
Core-crosslinked, temperature- and pH-responsive micelles: design, physicochemical characterization, and gene delivery application†
Katharina
Leer‡
 ab,
Gizem
Cinar‡
ab,
Jana I.
Solomun
ab,
Liam
Martin
ab,
Ivo
Nischang
*ab and
Anja
Traeger
*ab
ab,
Gizem
Cinar‡
ab,
Jana I.
Solomun
ab,
Liam
Martin
ab,
Ivo
Nischang
*ab and
Anja
Traeger
*ab
aLaboratory of Organic and Macromolecular Chemistry (IOMC), Friedrich Schiller University Jena, Humboldtstrasse 10, 07743 Jena, Germany. E-mail: Ivo.nischang@uni-jena.de; Anja.traeger@uni-jena.de; liam.t.martin.33@gmail.com; Tel: +49-3641-948-569 Tel: +49-3641-948-599
bJena Center for Soft Matter (JCSM), Friedrich Schiller University Jena, Philosophenweg 7, 07743 Jena, Germany
First published on 22nd September 2021
Abstract
Stimuli-responsive block copolymer micelles can provide tailored properties for the efficient delivery of genetic material. In particular, temperature- and pH-responsive materials are of interest, since their physicochemical properties can be easily tailored to meet the requirements for successful gene delivery. Within this study, a stimuli-responsive micelle system for gene delivery was designed based on a diblock copolymer consisting of poly(N,N-diethylacrylamide) (PDEAm) as a temperature-responsive segment combined with poly(aminoethyl acrylamide) (PAEAm) as a pH-responsive, cationic segment. Upon temperature increase, the PDEAm block becomes hydrophobic due to its lower critical solution temperature (LCST), leading to micelle formation. Furthermore, the monomer 2-(pyridin-2-yldisulfanyl)ethyl acrylate (PDSAc) was incorporated into the temperature-responsive PDEAm building block enabling disulfide crosslinking of the formed micelle core to stabilize its structure regardless of temperature and dilution. The cloud points of the PDEAm block and the diblock copolymer were investigated by turbidimetry and fluorescence spectroscopy. The temperature-dependent formation of micelles was analyzed by dynamic light scattering (DLS) and elucidated in detail by an analytical ultracentrifuge (AUC), which provided detailed insights into the solution dynamics between polymers and assembled micelles as a function of temperature. Finally, the micelles were investigated for their applicability as gene delivery vectors by evaluation of cytotoxicity, pDNA binding, and transfection efficiency using HEK293T cells. The investigations showed that core-crosslinking resulted in a 13-fold increase in observed transfection efficiency. Our study presents a comprehensive investigation from polymer synthesis to an in-depth physicochemical characterization and biological application of a crosslinked micelle system including stimuli-responsive behavior.
Introduction
Gene therapy has received increased attention in recent years and the first treatments for genetic diseases entered the market.1,2 Currently, the potential for gene transfer has not yet been fully exploited in the fields of genetic diseases3 and cancer therapy.4 Appropriate delivery systems are needed, which can be viral5 or non-viral6,7 in nature, in order to achieve the successful transport of genetic material to the targeted cells. Although viral vectors are evolutionarily optimized for delivering genetic material, non-viral alternatives are considered to be easier to scale-up, modify, and less immunogenic than their viral counterparts.6,8 In such cases, polymer-based nanocarriers could be advantageous due to the opportunity to readily tailor design criteria in terms of composition and structure.9 Indeed, the incorporation of stimuli-responsive segments in copolymers offers the ability to tune the physicochemical properties of the polymer to suit destined biomedical applications by, e.g., changing solution environmental conditions such as pH10–12 or temperature.13–16 Relevant research focuses on cationic, amine-containing polymers enabling the binding of the negatively charged genetic cargo.8,17 The formed polymer-nucleic acid-complexes, also called polyplexes, can then penetrate the cells via endocytotic routes and, ideally, transport the genetic material to the targeted location, i.e., the cell nucleus or cytoplasm. pH-Sensitive polymers are known to support the cellular delivery, i.e., uptake and endosomal escape.18Thermo-responsive polymers dissolved in aqueous solution usually undergo a phase transition upon temperature changes.19 Polymers with a lower critical solution temperature (LCST) are soluble in a solvent below their LCST. However, if the temperature is increased, the binary polymer solution phase separates and forms two non-miscible liquid phases. The LCST is defined as the minimum temperature of the concentration-dependent phase diagram of a binary mixture. The coil-to-globule transition can be observed when a polymer solution turns cloudy at elevated temperatures, representing the cloud point temperature (Tcp) of the polymer.20 The Tcp of a polymer strongly depends on the polymer concentration,21 its composition,22,23 and ionic strength of the solvent.24,25 In fact, the Tcp of a polymer can be adjusted by the incorporation of hydrophilic and hydrophobic monomers in its backbone.26
The most studied thermo-responsive polymer for biological applications is poly(N-isopropylacrylamide) (PNIPAm), which exhibits a LCST at approximately 32 °C in water.27,28 Since its LCST is close to the body temperature, NIPAm was combined with different monomers to form a variety of stimuli-responsive copolymers with adjusted LCST.29,30 Statistical copolymers of NIPAm showed higher transfection efficiencies when the cells were incubated near room temperature instead of 37 °C for the experimental timescale.31,32 This was attributed to the dissociation of the polyplex below the LCST and subsequent release of pDNA inside the cells. However, in vitro studies conducted below 37 °C are difficult to interpret, since cell metabolism, and thus, transfection efficiency is altered regardless of the utilized polymer.32 Since the transfection efficiency increases at temperatures below 37 °C, controls must be carefully chosen.33 Considering this limitation, it was demonstrated that the combination of a long PNIPAm block and a short cationic block led to increased transfection efficiency.34 Fliervoet and coworkers showed that the incorporation of a PNIPAm block into the copolymer structure decreased the cytotoxicity of the cationic groups of the polyplexes due to the reduction of surface charges.35
Another polyacrylamide-based thermo-responsive polymer is poly(N,N-diethylacrylamide) (PDEAm), which shows a comparable LCST to PNIPAm (33 °C).36 Block copolymers featuring one block with LCST behavior become amphiphilic at elevated temperatures, since the temperature-responsive block promotes phase separation, leading to the assembly of various nanostructures, particularly polymeric micelles.37,38 In this context, PDEAm containing block copolymers were studied with the stealth-polymer poly(ethylene glycol),39 poly(2-(dimethylamino)ethyl methacrylate) (PDMAEMA),40 or poly(L-lysine)41 as pH-responsive segments in terms of their thermo-responsive self-assembly behavior. However, PDEAm was not investigated regarding its gene delivery potential up to now.
A general drawback of polymeric micelles is that they dissociate below their critical micelle concentration (CMC).42 If used below the CMC for biomedical applications, these micelle systems need to be stabilized, as dilution effects are expected in vivo.43 Another effect to be considered is that temperature-responsive nanostructures disassemble below their phase transition temperature. To avoid dissociation of the temperature-responsive polymeric micelles below the CMC and LCST, either the core44–48 or the shell43,49,50 can be covalently crosslinked above the CMC at elevated temperatures, leading to micelles with a permanent core–shell structure. Covalent crosslinking of the micelle core can be realized, e.g., through disulfide crosslinking.44,47,48
To decode the change in structural dynamics of such temperature-responsive polymeric systems, analytical ultracentrifugation, an absolute and eminent hydrodynamic technique, can be considered.51 The analytical ultracentrifuge (AUC) can provide a gentle characterization platform for liposomes, nanoparticles, and also for thermo-responsive polymers or micelles in the field of gene delivery as reported for PNIPAm and PNIPAm-based copolymers.52,53E.g., Burova and coworkers investigated the conformational behavior of PNIPAm and its complexes with poly(methacrylic acid) regarding temperature changes by making use of an AUC.54 Notwithstanding, it should be noted that these mentioned studies show the absolutely obtained sedimentation coefficients observed at different temperatures, without considering different solvent viscosities and densities. In recent studies, the obtained features of multicomponent drug-delivery systems by the AUC demonstrated unprecedented insight, impossible to obtain by other utilized standard analytical methods,55,56 such as light scattering or microscopic techniques,57–59 in instances requiring prior sample processing.58,59 In fact, an AUC provides a separation opportunity of different solution species in their native state in a hermetically closed system60 under conditions of a globally conserved mass balance during the experiments.55,56
Herein, we report on a tailored synthetic polymer design, in-depth physicochemical analysis of the temperature-responsive nanocarriers through standard and advanced characterization by the AUC, and the carriers’ application for gene delivery. Therefore, we start with the design of a diblock copolymer, containing PDEAm as the temperature-responsive segment with the second block consisting of the pH-responsive polymer poly(aminoethyl acrylamide) (PAEAm) (pKa = 8.3–8.5). Previously, this primary amine-containing homopolymer showed moderate transfection efficiency for pDNA.61 The PDS-functionalized monomer 2-(pyridin-2-yldisulfanyl)ethyl acrylate (PDSAc) was additionally incorporated into the thermo-responsive PDEAm block. This moiety facilitates the crosslinking of the micelle core of the temperature-responsive block copolymer at elevated temperatures through reaction with the bifunctional crosslinker 1,6-hexanedithiol. The thermo-responsive behavior of the block copolymers and the effect of core-crosslinking was investigated physicochemically by turbidimetry, fluorescence measurements of an encapsulated compound, dynamic light scattering (DLS), and the AUC. Then, the block copolymer assemblies were evaluated regarding their cellular toxicity and transfection efficiency compared to the non-crosslinked polymer, in order to reveal the impact of the crosslinked micelle structure on the gene delivery process. Our study focuses on the physicochemical properties of a temperature-responsive amphiphilic diblock copolymer enabling the formation of micelles. To the best of our knowledge, this represents the first study which evaluates the temperature-dependent micelle formation in detail with the AUC and compares the results to DLS measurements. Furthermore, it is the first time that the polymer/micelle system presented in this work is used for gene delivery.
Materials and methods
Chemicals and materials
Acryloyl chloride, dimethyl sulfoxide (DMSO, anhydrous, 99.9%), 1,4-dioxane (anhydrous, 99.8%), 2,2′-dipyridyl disulfide, 1,6-hexanedithiol, 2-mercaptoethanol and 1,3,5-trioxane were obtained from Sigma-Aldrich (now Merck, Germany). N,N-Diethylacrylamide (DEAm) and trifluoroacetic acid (TFA) were obtained from TCI (Germany). Sodium sulfate (Na2SO4) was obtained from Grüssing GmbH (Germany). Glacial acetic acid (HOAc) and sodium chloride (NaCl) were obtained from Fisher Chemical (Germany). Triethylamine (TEA) was obtained from Carl Roth (Germany). N,N-Dimethylacetamide (DMAc, reagent grade, 99%) was obtained from Honeywell International Inc. (Germany). V-65B (2,2′-azobis(2,4-dimethylvaleronitrile)) was obtained from FUJI-FILM Wako Chemicals (Germany). DEAm and 1,4-dioxane were stored over inhibitor removal beads (containing 4-methoxyphenol) at 4 °C. Dichloromethane (DCM) and methanol were obtained from an on-site solvent purification system. Tetrahydrofuran (THF), n-hexane, ethyl acetate, and diethyl ether were distilled on site. The chain transfer agent (CTA) 2-(((butylthio)-carbonothioyl)thio)propanoic acid, called (propanoic acid)yl butyl trithiocarbonate (PABTC), was prepared according to a previously reported synthesis.62 The synthesis procedure and characterization of the monomer PDSAc can be found in Fig. S1 and 2 of the ESI.† The monomer AEAmBoc and homopolymer P(AEAm)96 (pA) were synthesized and available from another study.61All the following materials were ordered from the suppliers stated in brackets: HEK293T cells (DSMZ, Germany), TC treated cell culture flasks (Greiner Bio-One International GmbH, Austria), TC treated multiwell cell culture plates (VWR International GmbH, Germany), Dulbecco's modified Eagle's medium (DMEM) and 4-(2-hydroxyethyl)-1-piperazineethanesulfonic acid (HEPES) buffer (Biowest SAS, France), fetal bovine serum (FBS, Capricorn Scientific, Germany), Penicillin–Streptomycin and PrestoBlue™ cell viability reagent (Thermo Fisher Scientific, MA, US), trypsin-EDTA and 0.4% trypan blue solution (Sigma-Aldrich, MO, US), ethidiumbromide solution (Carl Roth, Germany), heparin sodium salt (Alfa Aesar, MA, US), linear poly(ethylenimine) (25 kDa, Polysciences, PA, US). Plasmid DNA encoding for enhanced green fluorescent protein (mEGFP-N1, 4.7 kb, Addgene plasmid #54767; http://n2t.net/addgene:54767; RRID: Addgene_54767) or Myc (pKMyc, 4.7 kb, Addgene plasmid #19400; http://n2t.net/addgene:19400; RRID: Addgene_19400) was isolated from E. Coli using a Giga plasmid kit (Qiagen, Germany).
Instruments
1H NMR (300 MHz) spectra and 13C NMR (75 MHz) spectra were measured on a spectrometer from Bruker equipped with an Avance I console, a dual 1H and 13C sample head and a 60 × BACS automatic sample changer. The signals were determined by using the residual solvent as the reference. All NMR spectra were analyzed with ACD/Spectrus Processor 2019.1.3.Size exclusion chromatography (SEC) was performed on an Agilent 1200 series system, equipped with a PSS degasser, a G1310A pump and a Techlab oven (tempered at 40 °C). A G1362A refractive index (RI) detector was utilized for data acquisition. The used eluent was 0.21 wt% LiCl in DMAc at a flow rate of 1 mL min−1. Both, a PSS Gram 30 Å column (300 × 0.8 mm, 10 μm particle size) and a PSS Gram 1000 Å column (300 × 0.8 mm, 10 μm particle size) placed in series served as a column set. The samples were filtered through a polytetrafluoroethylene (PTFE) membrane with a 0.45 μm pore size prior to injection. The apparent molar masses were determined using a poly(methyl methacrylate) (PMMA) standard calibration to calculate number- and weight-average molar masses, Mn,SEC and Mw,SEC, together with the dispersities (Đ = Mw/Mn).
Electrospray ionization mass spectrometry (ESI-MS) was performed by using a micro-TOF Q-II (Bruker Daltonics) mass spectrometer equipped with an automatic syringe pump from KD Scientific for sample infusion. The ESI-Q-TOF mass spectrometer was operating at a voltage of 4.5 kV, a desolvation temperature of 180 °C, and in the positive ion mode. Nitrogen was used as the nebulizer and drying gas. All samples were infused using a constant flow rate of 3 μL min−1. The instrument was calibrated in the m/z range of 50–3000 using a calibration standard (ESI-L Low Concentration Tuning Mix), which was acquired from Agilent Technologies (Waldbronn, Germany). All data were analyzed via the Bruker Data Analysis software version 4.2.
Dynamic light scattering (DLS) was performed with a Zetasizer Nano ZS (Malvern Instruments, Herrenberg, Germany), equipped with a 633 nm laser. All measurements were performed in disposable micro cuvettes (ZEN0040, Malvern Instruments, Herrenberg, Germany). After an equilibration time of 60 s, three measurements were carried out using an automatic selection of the measurement position at the different temperatures. The scattered light intensity fluctuations were monitored at a backscattering angle of 173°. The z-average hydrodynamic diameters (dh,z) are based on the Stokes–Einstein relation and the corresponding polydispersity index (PDI) of the samples originated from the cumulants method.
Sedimentation velocity experiments were performed with an Optima Analytical Ultracentrifuge (AUC) (Beckman Coulter Instruments, Brea, CA) using double-sector Epon centerpieces with a 12 mm optical solution path length. The cells were placed in an An-50 Ti eight-hole rotor. The cells were filled with 420 μL sample solution in diluent and with 440 μL of a 150 mM aqueous NaCl solution or a D2O/150 mM aqueous NaCl solution mixture as the reference.
Solvent density measurements were performed with a DMA4100 densimeter (Anton Paar, Graz, Austria). 1 mL of the prepared solvent was used to fill the measurement tube and investigated at the respective temperatures where sedimentation velocity experiments were carried out, i.e., (i) 5 °C, (ii) 20 °C, and (iii) 40 °C.
Viscosity measurements were performed with an Automated Microviscometer (AMVn, Anton Paar, Graz, Austria) at the respective temperature where sedimentation velocity experiments were carried out, i.e., at (i) 5 °C, (ii) 20 °C, and (iii) 40 °C. The instrument was operated with a capillary/ball combination.
Synthesis of polymers
![[double bond, length as m-dash]](https://www.rsc.org/images/entities/char_e001.gif) O)–), 2.23–2.87 (br, 80H, –CH2–CH(CO)–), 2.87–3.81 (br, 320H, 2 × CH3–CH2–) ppm.
O)–), 2.04–2.84 (br, 68H, –CH2–CH(CO)–), 2.84–3.81 (br, 258H, 2 × CH3–CH2––, –S–S–CH2–), 4.05–4.51 (br, 14H, –S–S–CH2–CH2–O–(CO)–), 7.10 (s, 7H, –CHCH–NC(CH–)–S–), 7.67 (s, 14H, –CH–(CN–)–S–, –CHCH–(CN–)–S–), 8.45 (s, 7H, –CHCH–NC(CH–)–S–) ppm.
O)–), 1.98–2.86 (br, 145H, –CH2–CH(CO)–), 2.86–3.90 (br, 566H, 2 × CH3–CH2–, –S–S–CH2–, –NH–CH2–CH2–NH–), 4.11–4.5 (br, 14H, –S–S–CH2–CH2–O–(CO)–), 4.97 (s, 77H, –NH–(CO)–O–), 6.45 (s, 77H, CH2CH–(CO)–NH–), 7.10 (s, 7H, –CHCH–NC(CH–)–S–), 7.68 (s, 14H, –CH–(CN–)–S–, –CHCH–(CN–)–S–), 8.46 (s, 7H, –CHCH–NC(CH–)–S–) ppm.
O)–), 2.00–2.93 (br, 145H, –CH2–CH(CO)–), 2.93–3.82 (br, 566H, 2 × CH3−CH2–, –S–S–CH2–, –NH–CH2–CH2–NH–), 4.14–4.57 (br, 14H, –S–S–CH2–CH2–O–(CO)–), 7.24 (s, 7H, –CHCH–NC(CH–)–S–), 7.84 (s, 14H, –CH–(CN–)–S–, –CHCH–(CN–)–S–), 8.43 (s, 7H, –CHCH–NC(CH–)–S–) ppm.
O)–), 2.23–2.87 (br, 80H, –CH2–CH(CO)–), 2.87–3.81 (br, 320H, 2 × CH3–CH2–) ppm.
O)–), 2.04–2.84 (br, 68H, –CH2–CH(CO)–), 2.84–3.81 (br, 258H, 2 × CH3–CH2––, –S–S–CH2–), 4.05–4.51 (br, 14H, –S–S–CH2–CH2–O–(CO)–), 7.10 (s, 7H, –CHCH–NC(CH–)–S–), 7.67 (s, 14H, –CH–(CN–)–S–, –CHCH–(CN–)–S–), 8.45 (s, 7H, –CHCH–NC(CH–)–S–) ppm.
O)–), 1.98–2.86 (br, 145H, –CH2–CH(CO)–), 2.86–3.90 (br, 566H, 2 × CH3–CH2–, –S–S–CH2–, –NH–CH2–CH2–NH–), 4.11–4.5 (br, 14H, –S–S–CH2–CH2–O–(CO)–), 4.97 (s, 77H, –NH–(CO)–O–), 6.45 (s, 77H, CH2CH–(CO)–NH–), 7.10 (s, 7H, –CHCH–NC(CH–)–S–), 7.68 (s, 14H, –CH–(CN–)–S–, –CHCH–(CN–)–S–), 8.46 (s, 7H, –CHCH–NC(CH–)–S–) ppm.
O)–), 2.00–2.93 (br, 145H, –CH2–CH(CO)–), 2.93–3.82 (br, 566H, 2 × CH3−CH2–, –S–S–CH2–, –NH–CH2–CH2–NH–), 4.14–4.57 (br, 14H, –S–S–CH2–CH2–O–(CO)–), 7.24 (s, 7H, –CHCH–NC(CH–)–S–), 7.84 (s, 14H, –CH–(CN–)–S–, –CHCH–(CN–)–S–), 8.43 (s, 7H, –CHCH–NC(CH–)–S–) ppm.
Determination of the cloud point (Tcp)
AUC experiments
Absorbance detection in terms of optical densities (OD) at a wavelength of 309 nm, i.e., that of the RAFT-agent pendant on the polymers was utilized for observation of sedimentation boundaries in respect to time. All measurements were performed at a rotor speed of 42![[thin space (1/6-em)]](https://www.rsc.org/images/entities/char_2009.gif) 000 rpm for 24 h with 3 min time intervals. To cover the most interesting temperature range, measurements were performed at isothermal temperatures of (i) 5 °C, (ii) 20 °C, and (iii) 40 °C.
000 rpm for 24 h with 3 min time intervals. To cover the most interesting temperature range, measurements were performed at isothermal temperatures of (i) 5 °C, (ii) 20 °C, and (iii) 40 °C.
For investigations of the non-crosslinked pPDA polymer in solution at different temperatures, a concentration series from 0.24 to 3.98 mg mL−1 in 150 mM aqueous NaCl solution was prepared. The crosslinked polymer (cross-pPDAexcess) in solution was further investigated by focusing on a lower concentration range from 0.06 to 1.01 mg mL−1 in 150 mM aqueous NaCl solution, i.e., closer to biologically-relevant application conditions. Measurements of the crosslinked polymer in solution after dialysis (cross-pPDAdialyzed) were performed in a concentration range from 0.05 to 2.23 mg mL−1 in 150 mM aqueous NaCl solution.
The software Sedfit was utilized for data evaluation while making use of the ls-g*(s) model, i.e., by a least-squares boundary modelling with a Tikhonov-Phillips regularization procedure and by assuming non-diffusing species.63 As a result, differential distributions of sedimentation coefficients, s, were obtained. The integration of the differential distributions of sedimentation coefficients, ls-g*(s), allows estimation of signal (weight) averages of sedimentation coefficients, s. The obtained integral typically corresponds to the observed plateau values of sedimentation boundaries in respect to meniscus depletion.
Transfection of HEK293T cells with mEGFP-N1 pDNA
The HEK293T cell line was cultured in Dulbecco’s modified Eagle’s medium (DMEM, 1 g L−1 glucose, supplemented with 10% (v/v) FBS, 100 U mL−1 penicillin and 100 μg mL−1 streptomycin (D10) at 37 °C in a humidified 5% (v/v) CO2 atmosphere. One day prior to transfection experiments, 0.2 × 10⁶ cells mL−1 were seeded into a 24-well plate in 500 μL D10 supplemented with 10 mM (4-(2-hydroxyethyl)-1-piperazineethanesulfonic acid) (HEPES, D10 + H). The next day, the medium was exchanged to 450 μL fresh D10 + H 1 h prior to treatment. Polyplexes were freshly prepared by diluting the materials in HBG buffer (5% (w/v) glucose, 20 mM HEPES, pH 7.4) to reach a final nitrogen to phosphate ratio (N/P ratio) of 10, followed by 5 min of incubation at RT. Subsequently, pDNA diluted in HBG buffer (final pDNA concentration in well 3 μg mL−1) was quickly added to the diluted material by pipetting up and down, followed by vortexing for 10 s. The polyplexes were incubated at RT for 15 min. For transfection experiments, polyplexes were either prepared with mEGFP-N1 pDNA or pKMyc pDNA (not encoding for the green fluorescent protein as the negative control). Polyplexes formed with linear polyethyleneimine (LPEI) were used as positive control (N/P 20, 3 μg mL−1 pDNA). Subsequently, the cells were treated with 50 μL sample solution or HBG buffer as the control. The cells were incubated for 48 h with the polyplexes. For experiments evaluating the influence of temperature on transfection efficiency, the cells were incubated with the samples for 20 h at 37 °C, followed by incubation at 25 °C for 3 h, and subsequent incubation at 37 °C for a further 25 h. After incubation, the cell culture supernatant was removed, the cells were detached by 150 μL trypsin EDTA and were then resuspended in 350 μL of the culture supernatant and measured via flow cytometry (CytoFlex S, Beckman Coulter, Brea, CA, US) as described previously.64 Additionally, the cells were imaged via fluorescence microscopy after an overall of 48 h using a Cytation5 Cell Imaging Multi-Mode Reader (BioTek Instruments, USA) equipped with a 4× objective using brightfield imaging and the FITC channel (λEx = 469/35 nm, λEm = 525/39 nm).Statistical analysis
To determine statistically significant differences between multiple groups within data sets one-way analysis of variance (one-way ANOVA) followed by Bonferroni's post-hoc test was performed. Experiments on the comparison of two groups in total were analyzed by the unpaired t-Test. Data analysis was conducted using OriginPro2018b software and statistically significant differences are denoted as follows: *p < 0.05, **p < 0.01, and ***p < 0.001.Results and discussion
P(PDSAc-co-DEAm) pPD and its LCST behavior
To investigate the influence of temperature, crosslinking, and concentration on the stability of micelles for perspective gene delivery, an amphiphilic diblock copolymer was created via sequential reversible addition–fragmentation chain-transfer (RAFT) polymerization, using acrylamide-based monomers with the CTA PABTC (Fig. 1A, Table 1). The first polymer block P(PDSAc7-co-DEAm61) (pPD) consists of two functional monomers: (i) a thiol-containing monomer PDSAc, which can later be utilized for disulfide crosslinking reactions, and (ii) the temperature-sensitive DEAm.65 Additionally, the homopolymer P(DEAm)80 (pD) was synthesized to compare and evaluate its temperature-responsive properties against the copolymer pPD (for 1H NMR see Fig. S3, ESI†). The SEC traces of the homopolymer pD and the copolymer pPD showed monomodal populations with dispersity (Đ) values ranging from 1.09 to 1.24 (Fig. 1B), indicating that the polymers were synthesized in a controlled manner. The incorporation of PDSAc appeared to broaden the elution signal and led to a higher apparent Đ value of pPD, when compared to the homopolymer pD. This could be attributed to the disulfide bond of PDSAc, which, at high monomer conversions, can act as a CTA, thereby broadening the molar mass distribution of the polymer.66,67 The experimental number-average molar masses (Mn,SEC), obtained from SEC, are different from the corresponding theoretical molar masses, Mn,th, since the hydrodynamic volumes of the polymers are expected to differ from the standards used for calibration.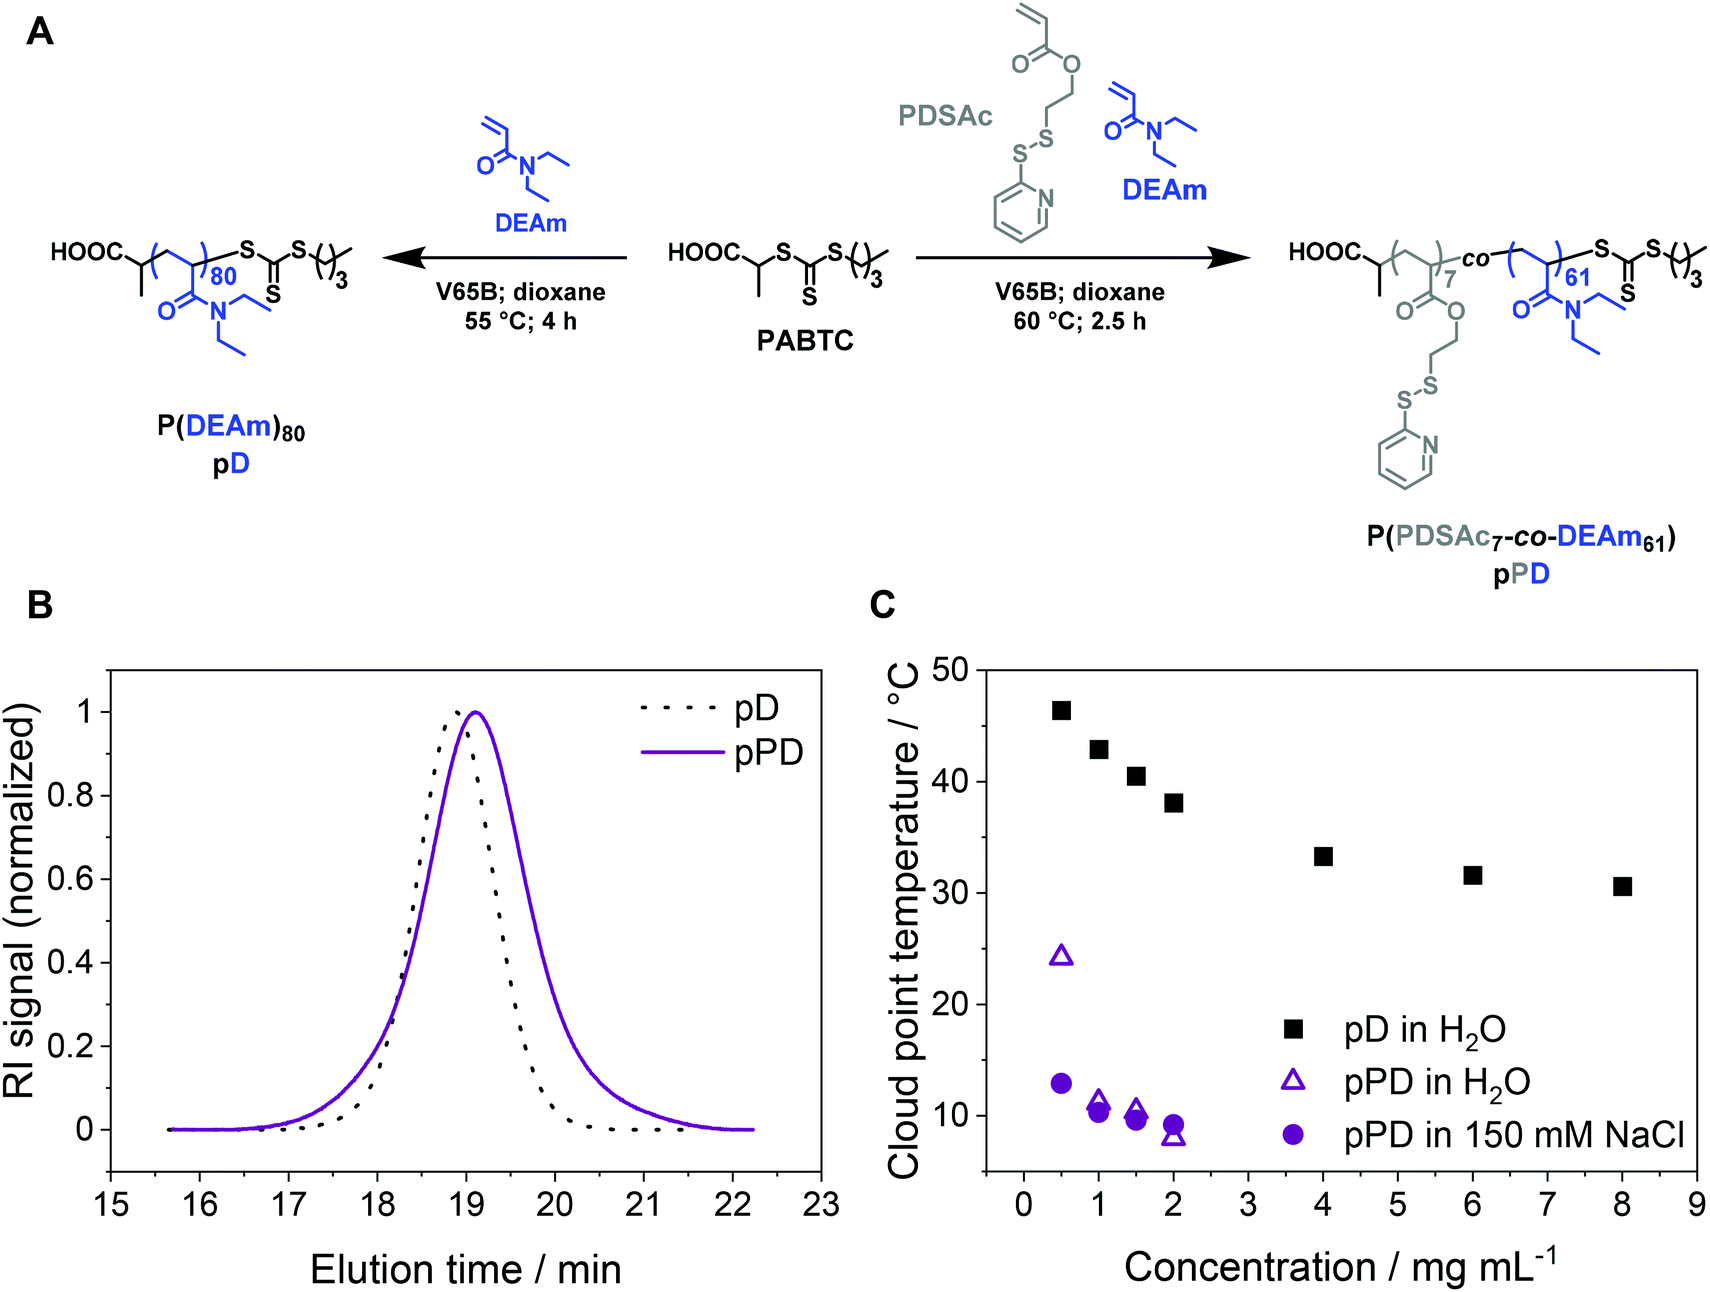 | ||
| Fig. 1 (A) Synthetic routes to obtain the homopolymer pD and the first block copolymer pPD by RAFT polymerization. (B) SEC elution traces of pD and pPD; DMAc containing 0.21 wt% LiCl with a PMMA system calibration. (C) Cloud point temperature (Tcp) investigation of pD and pPD in water and in 150 mM aqueous NaCl solution at different polymer concentrations as determined by turbidimetric measurements. | ||
The LCST behavior of the copolymer pPD was examined and compared to the homopolymer pD by turbidimetric measurements (Fig. S4–5, ESI†). The Tcp of pD was investigated at varying polymer concentrations ranging from 0.5 to 8.0 mg mL−1 (Fig. 1C). Firstly, the incorporation of the crosslinker PDSAc in the polymer backbone decreased the Tcp considerably (in the range of 7 to 15 °C) when compared to the homopolymer pD (in the range of 30 to 50 °C). In other words, the coil-to-globule transition occurred at much lower temperatures. The first possible origin is the increase in hydrophobicity of the polymers through copolymerization with PDSAc. Secondly, changing the solvent from water to an aqueous NaCl solution reduced the Tcp of pPD only slightly in a concentration-dependent manner, as seen for samples within a concentration range of 0.5 to 1.5 mg mL−1. This can be attributed to the weakening of the hydrogen bonds in aqueous saline solutions.24,36 This effect was most pronounced at the lowest measured polymer concentration of 0.5 mg mL−1. Such observation is in agreement with the literature, where a decrease of Tcp was shown with an increase in polymer concentration21 and decreasing content of the hydrophilic monomer in the backbone of the polymer.22,23 It was also demonstrated recently that the addition of NaCl to an aqueous solution of PDEAm decreased the Tcp.36
pPDABoc and pPDA analysis by fluorescence spectroscopy, DLS, and the AUC
The first block, pPD, was chain extended with the acrylamide-based monomer N-tert-butoxycarbonyl-N′-acryloyl-1,2-diaminoethane (AEAmBoc) to obtain the diblock copolymer P(PDSAc7-co-DEAm61)-b-P(AEAmBoc77) (pPDABoc) (Fig. 2A, Table 1). The SEC elution traces of pPDABoc showed a clear shift toward lower elution volumes in comparison to pPD, indicating successful chain extension (Fig. 2B). The population remained monomodal with only a small shoulder at higher elution volumes, originating from some dead pPD chains that could not be chain extended. Jia and coworkers observed a similar effect for the diblock copolymer of 2-(2-pyridyldisulfide)ethylmethacrylate with N-(2-hydroxypropyl)methacrylamide by RAFT poylmerization.68 The chain-extended polymer showed a higher dispersity (Đ = 1.43). The diblock copolymer pPDABoc was deprotected with trifluoroacetic acid (TFA) to expose the primary amine group of AEAm, as confirmed by 1H NMR analysis (Fig. S3, ESI†).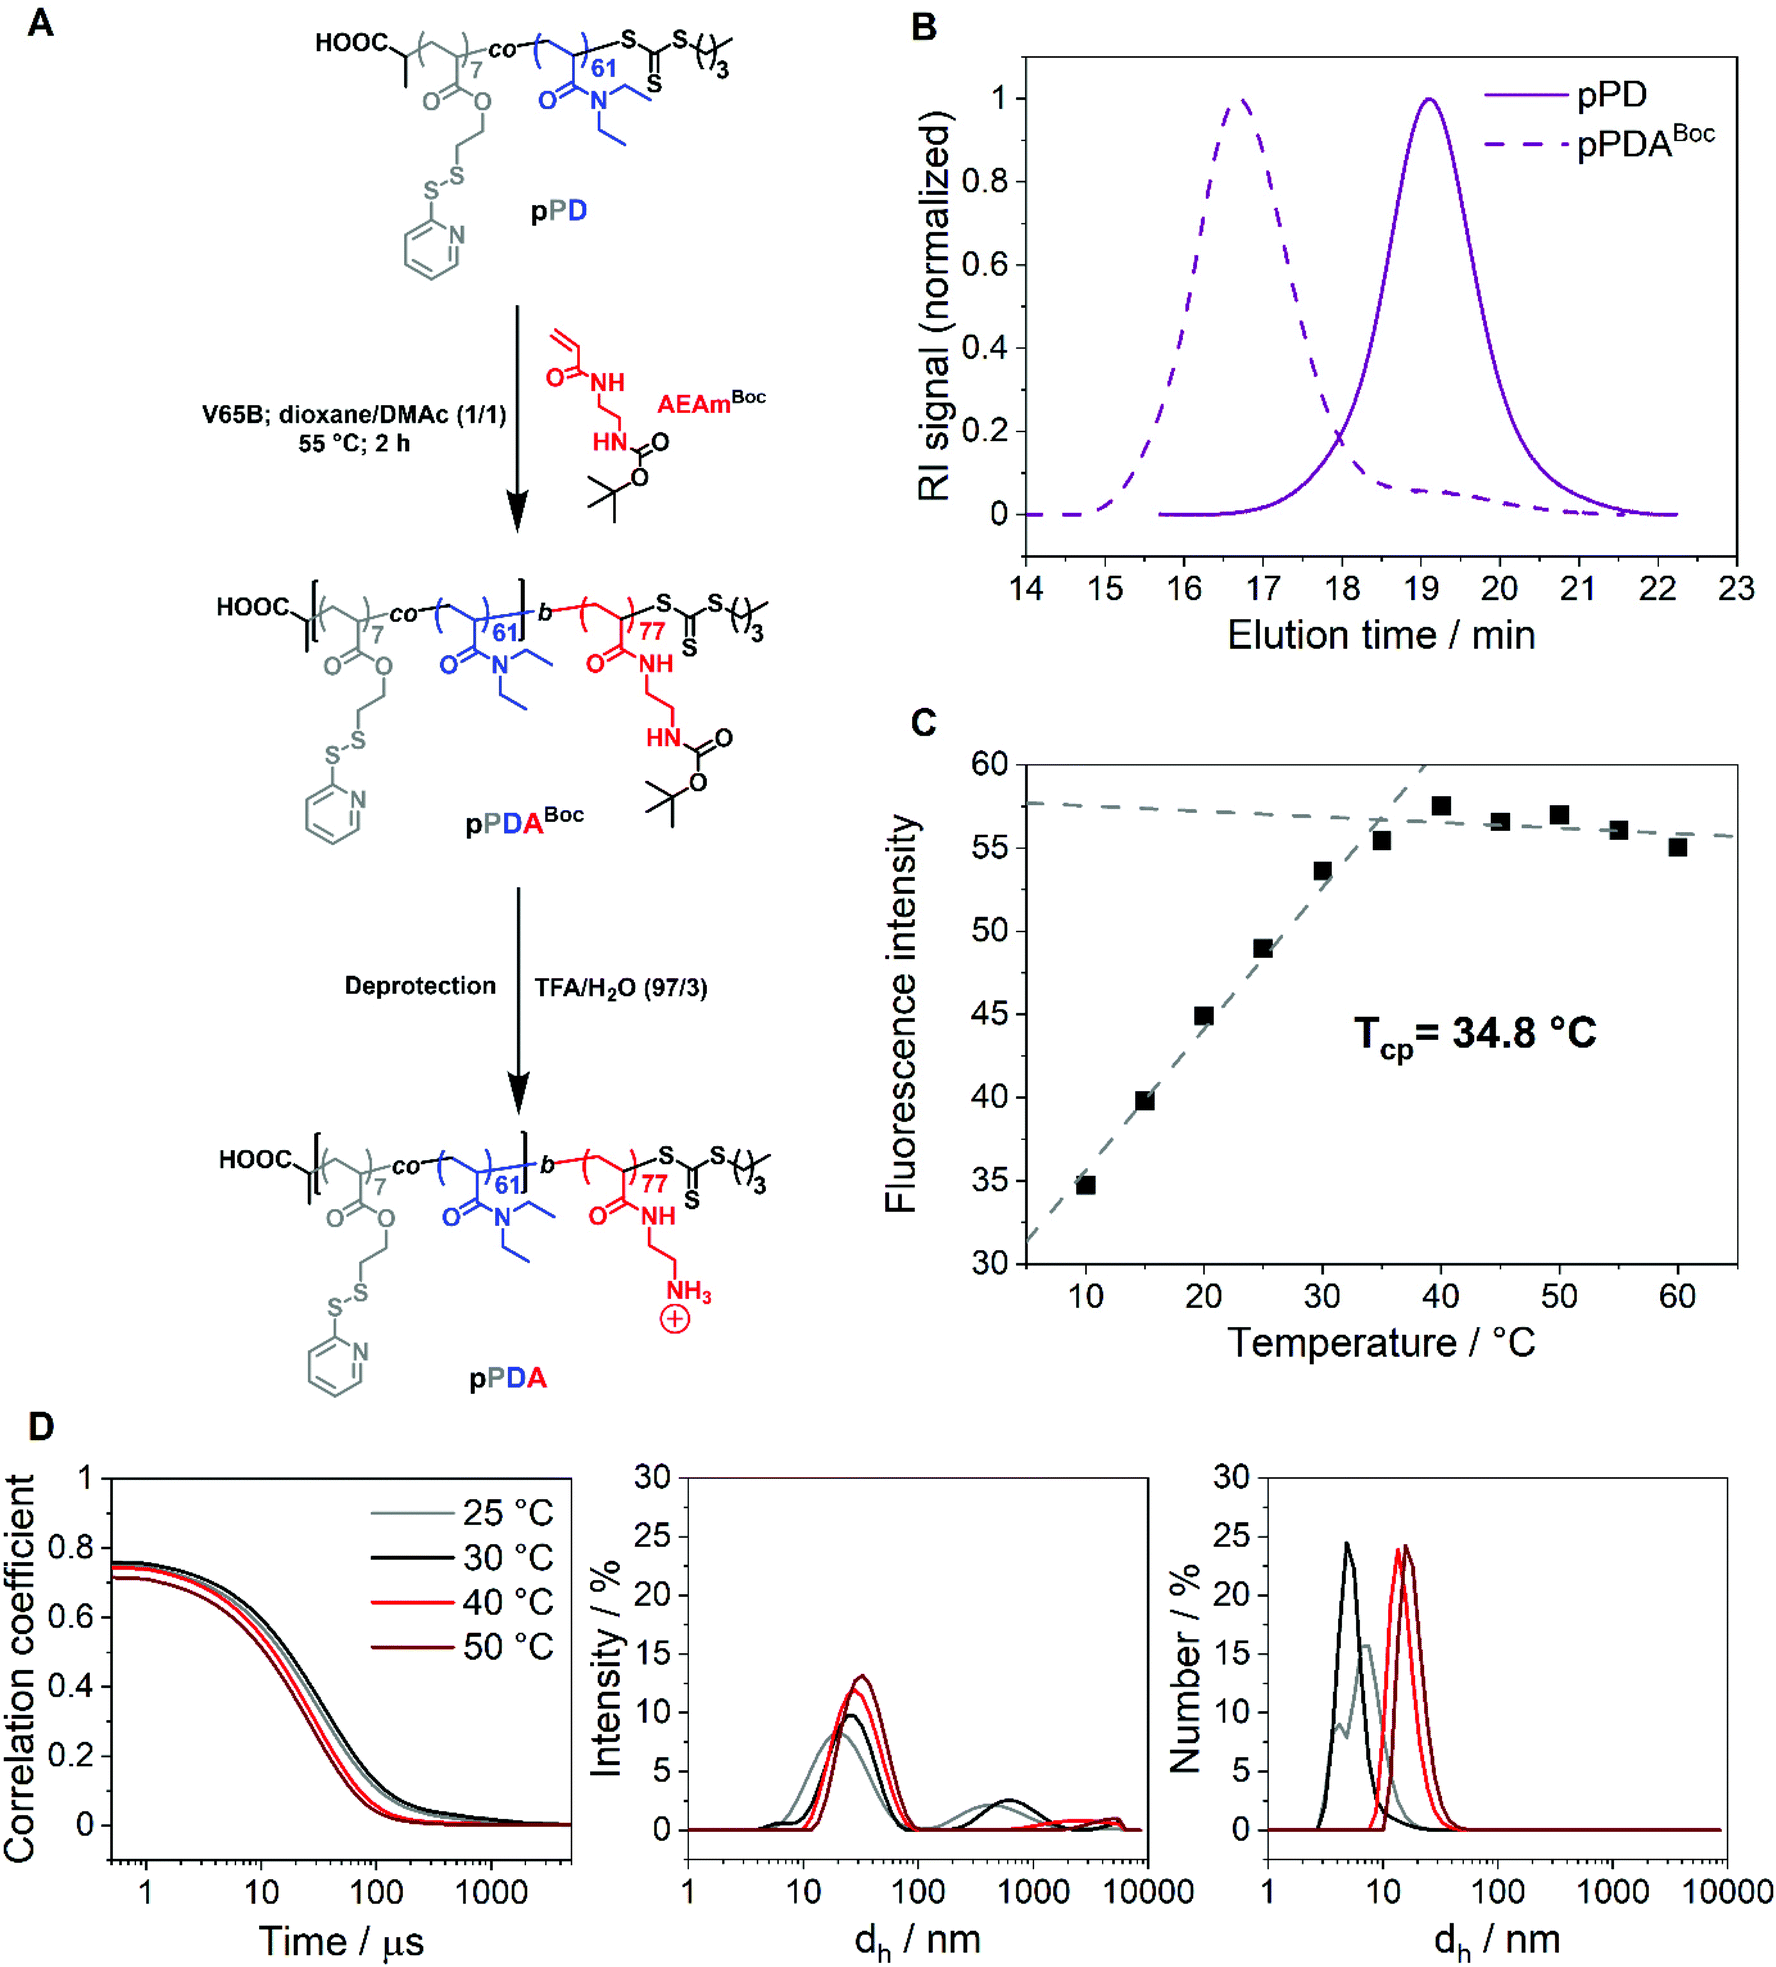 | ||
| Fig. 2 (A) Chain extension of the first block pPD to the diblock copolymer pPDABoc by RAFT polymerization and subsequent Boc-deprotection to obtain pPDA. (B) SEC elution traces of pPD and pPDABoc; DMAc containing 0.21 wt% LiCl with a PMMA system calibration. (C) Tcp determination of pPDA in 150 mM aqueous NaCl solution at a polymer concentration of 1 mg mL−1 by measuring the fluorescence intensity of Nile red at different temperatures; the polymer sample was incubated for 30 min at each temperature prior to each measurement (λex = 535 nm, λem = 550–725 nm); the fluorescence emission spectra were measured at each temperature and the derived fluorescence maxima were plotted versus temperature. The data points were fitted linearly from 10 to 35 °C and from 40 to 60 °C. The Tcp was determined as the intersection point of both dashed lines. (D) Exponential decay correlation coefficients and intensity- and number-weighted size distributions of pPDA in 150 mM aqueous NaCl (1 mg mL−1) at different temperatures obtained from DLS measurements. The polymer sample was incubated for 5 min prior to each DLS measurement. | ||
The diblock copolymer P(PDSAc7-co-DEAm61)-b-P(AEAm77) (pPDA) assembles into micelles at elevated temperatures when dissolved in aqueous solutions, with the pPD block forming the hydrophobic core. The second block, composed of PAEAm, provides pH-responsive properties and should form the hydrophilic corona of the micelle structures. At elevated temperatures, the polymer solution does not become cloudy, making turbidimetric measurements impossible. Thus, the Tcp of the diblock copolymer pPDA (1 mg mL−1 in 150 mM aqueous NaCl) was determined by utilization of Nile red, showing fluorescence in a hydrophobic environment but low solubility and fluorescence, due to a solvatochromic shift, in a hydrophilic environment, i.e., water.69,70 In this work, this was demonstrated by a monotonic increase in fluorescence intensity with temperature, reaching an apparent plateau at around 35 °C (Fig. 2C). The data points were fitted linearly from 10 to 35 °C and from 40 to 60 °C, obtaining an intersection point located at 34.8 °C. This temperature can be considered as the estimated Tcp of the micelle core formation. The Tcp of pPDA was increased considerably compared to pPD by the incorporation of the hydrophilic AEAm monomer as a block. The increase in Tcp can be attributed to the formation of micelles, whereas the pPD copolymer aggregates randomly at elevated temperatures.23 Similarly, the hydrodynamic diameter distributions of pPDA from 25 to 50 °C derived from DLS measurements display the temperature-dependent formation of micelles (Fig. 2D). This is pointed out by intensity-weighted hydrodynamic size distributions, since the size of the main population increased over the temperature range studied. Larger species are overrepresented in the intensity-weighted size distributions of DLS, according to the Rayleigh approximation.71 The size distribution by number shows the temperature-controlled formation of relatively small micelle structures. These results are supported by the overall increase of the z-average value of hydrodynamic size (dh,z) with a decrease in PDI values at elevated temperatures (Table S1, ESI†).
While DLS measurements allow to investigate the block copolymer behavior and formation of micelles, we utilized the AUC as an in situ hydrodynamic technique. The AUC can provide the temperature-dependent solution dynamics investigated at a fixed temperature. It is possible to analyze the solution complexity by active hydrodynamic separation in a hermetically-closed system of conserved mass balance at the chosen conditions.72 The additional option to adjust temperatures in the AUC experiments also provides access to the temperature-dependent solution dynamics of colloidal species.60 To investigate the temperature-dependent behavior of the micelles, AUC measurements were performed at different isothermal temperatures to study the polymer and micelle solution properties. The principle of the sedimentation velocity experiments by the AUC is illustrated in Fig. 3A, where the time-dependent radial concentration profiles in the AUC cells are resolved under the action of a centrifugal field. As opposed to a temperature of 5 °C (Fig. 3B), AUC experiments of pPDA at 40 °C (Fig. 3C) displayed a much different behavior, indicative of at least two species populations in solution. The radially-resolved sedimentation profiles were subsequently analyzed by sedimentation analysis without considering effects of diffusion in terms of differential distributions of sedimentation coefficients, ls-g*(s) (Fig. 3D). At 5 °C, the differential distribution of sedimentation coefficients of pPDA indicates a single resolvable population of species. At an increased temperature of 20 °C, a shoulder toward larger sedimentation coefficients can clearly be identified. At 40 °C, two clearly separated populations of species are identified. Such behavior was seen for all investigated concentrations of the material in solution (Fig. S6, ESI†). To eliminate the influence of the changing absolute densities and viscosities of the solvent at the different temperatures, we established an intrinsic scale derived from the following equation for the intrinsic sedimentation coefficient, [s]:
 | (1) |
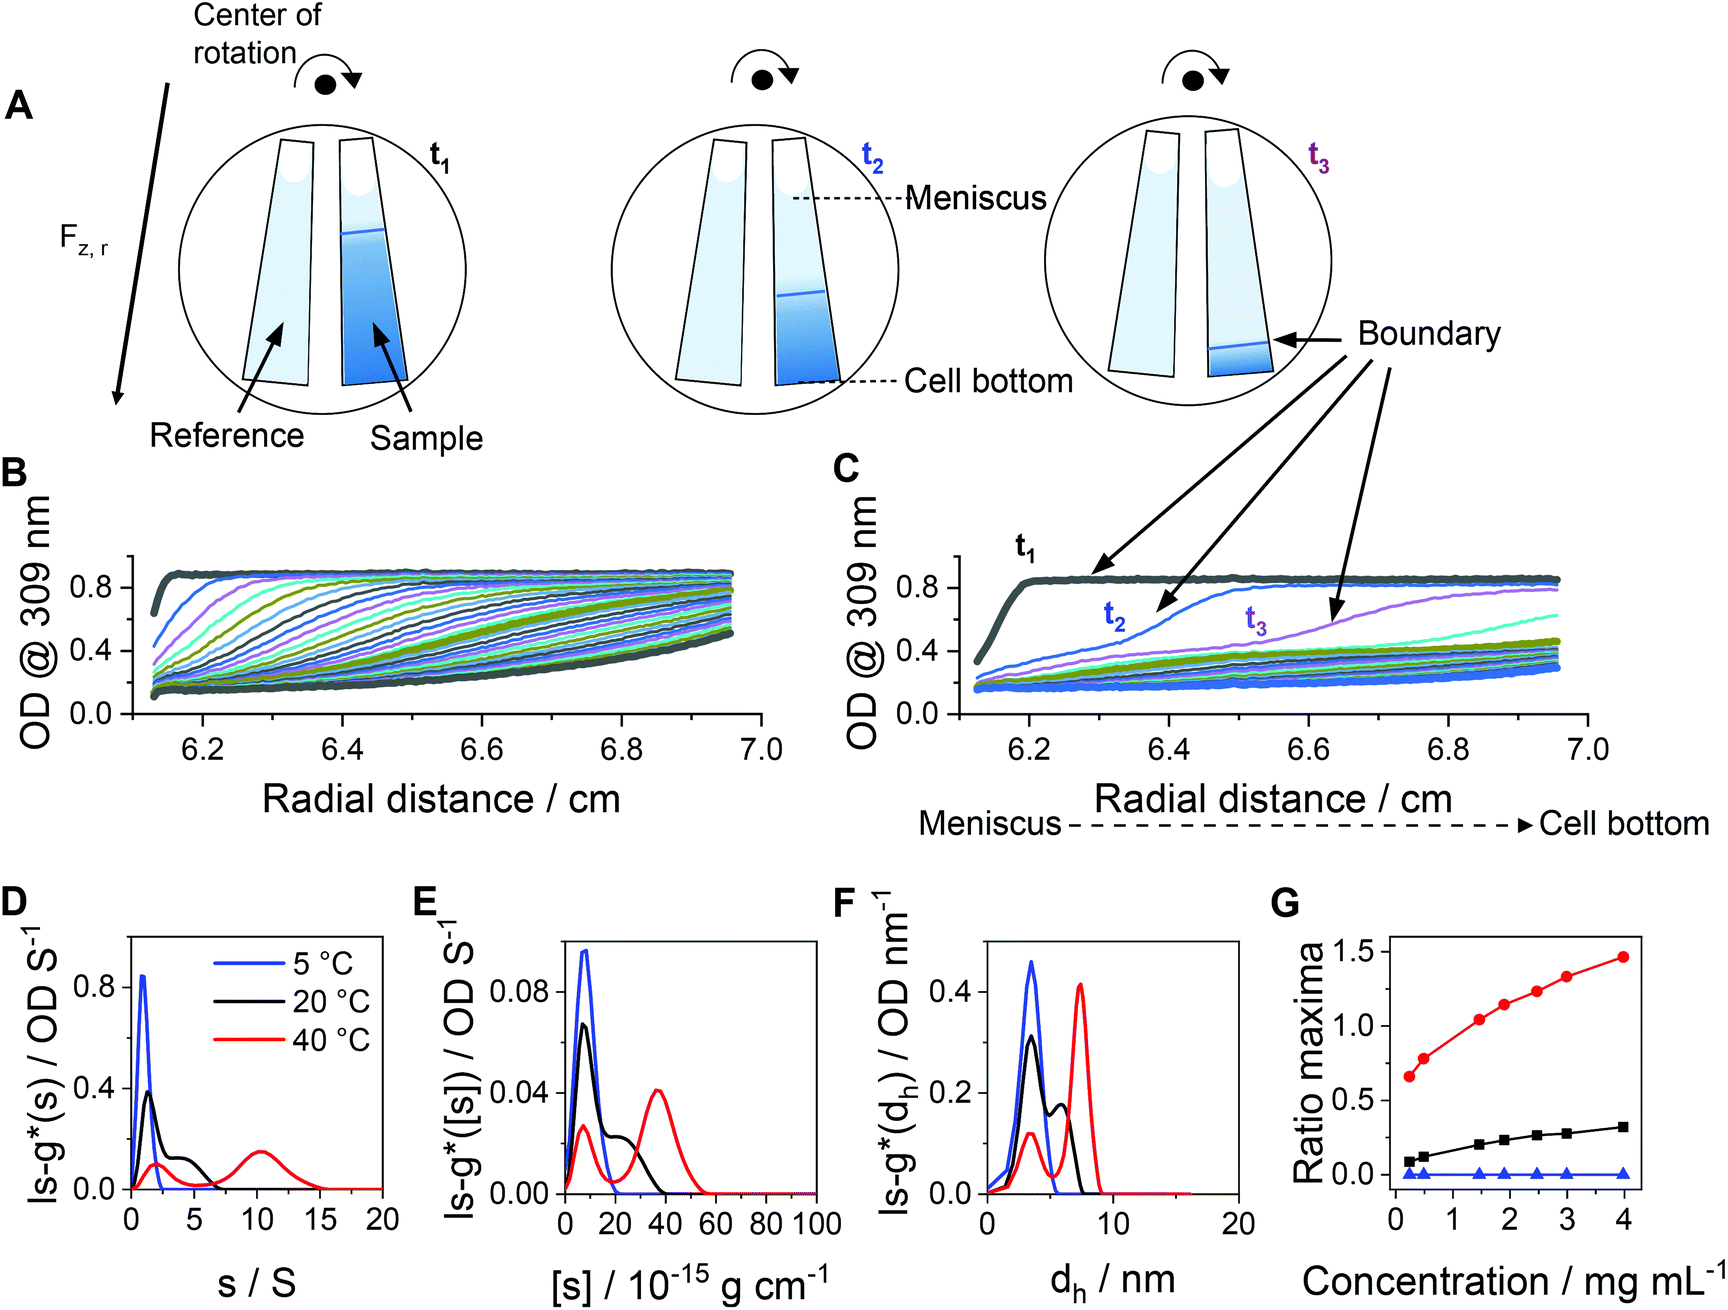 | ||
| Fig. 3 (A) Sketch of the principle of sedimentation velocity experiments by an AUC at different timepoints (t1, t2, t3). Radially resolved sedimentation profiles of pPDA at (B) 5 °C and (C) 40 °C. For clarity reasons, only selected sedimentation velocity profiles with the corresponding highlighted timepoints are shown. Results obtained by AUC sedimentation velocity experiments of pPDA measured at indicated temperatures and via absorbance detection in terms of optical densities (OD) at 309 nm are represented as differential distributions of (D) sedimentation coefficients, ls-g*(s), and (E) intrinsic sedimentation coefficients, ls-g*([s]). (F) Differential distributions of hydrodynamic diameters, ls-g*(dh). (G) Ratio of peak maxima between two observable peaks by division of the signal intensity at the peak maxima of the assembled micelles (second peak) by the signal intensity at the peak maxima of the free block copolymer pPDA (first peak) of differential distributions of sedimentation coefficients. Associated differential distributions of sedimentation coefficients at different concentrations are shown in the ESI (Fig. S6, ESI†). | ||
In order to rationalize this equilibrium, we calculated the quotient of the peak maxima intensities of the assembled micelles (at larger sedimentation coefficients) through the peak maxima intensities of the unimeric species of the differential distributions of sedimentation coefficients (Fig. 3G, Fig. S6, ESI†). At 5 °C, only the population of the unimeric single polymer chains are visible at all concentrations, resulting in a ratio of zero. With an increase of the temperature to 20 °C, a second species, representative of assembled structures in solution, appears. The ratio of the peak maxima intensities increased with increasing polymer concentration for temperatures of 20 °C and 40 °C. At 40 °C, the peak ratio at the lowest concentration exceeds already that of the highest concentration at 20 °C. Also, the peak ratio increases most steeply at 40 °C with increasing concentration, such that the micelle structures appear predominant in solution at increased temperatures. Therefore, we were able to resolve the temperature- and concentration-dependence on the formation of micelles. Considering the concentration dependence of the absorbance detection (Fig. S8, ESI†), the results showed that the equilibrium between single polymer chains and micelles appears being shifted to the formation of micelles with increasing temperature and concentration. Nevertheless, single polymer chains are evidently present under either condition studied. Such insight was virtually impossible to gain by the standard DLS measurements (Fig. 2D) and underpins the power of separation accompanied by population evaluation attempts making use of an AUC.72
DLS and AUC study of crosslinked micelles
After characterization of the temperature-dependent behavior of the polymer and formed assemblies, pPDA was crosslinked in a 150 mM aqueous NaCl solution using 1,6-hexanedithiol, enabling a disulfide exchange reaction with one thiol functionality of the crosslinker (Fig. 4A).75,76 Therefore, the pPDA solution was first equilibrated for 30 min at 50 °C to ensure the formation of micelles by using a temperature above the cloud point. Subsequently, the dithiol crosslinker 1,6-hexanedithiol was added to the polymer solution, followed by further heating at 50 °C to achieve the highest possible degree of crosslinking among different pPDA chains. Since the leaving group 2-thiopyridone displays absorbance in the range from 340 to 380 nm,77,78 the percentage of crosslinked moieties could be analyzed by UV-Vis spectroscopy (Fig. S9, ESI†). For this purpose, different equivalents of the crosslinker regarding the amount of PDSAc units in one polymer chain were added. The UV-Vis results showed that a solution with 0.2 equiv. of 1,6-hexanedithiol exhibited the highest absorbance at 370 nm. This result indicates that up to 40% (on average 2 to 3 units) of the PDSAc moieties from one polymer chain are connected to another polymer chain of the assembled micelles. After core-crosslinking, the crosslinked pPDA was dialyzed against 150 mM aqueous NaCl solution to remove the leaving group of the crosslinking reaction (2-thiopyridone) as well as the excess of the crosslinker (1,6-hexanedithol) prior to the AUC measurements. The dialyzed polymer solution was further filtered for biological investigations. Standard DLS measurements were performed at 25 and 50 °C using (i) free pPDA, (ii) crosslinked pPDA before dialysis (cross-pPDA), (iii) cross-pPDA after dialysis (cross-pPDAdialyzed), and (iv) cross-pPDA after dialysis and filtration (cross-pPDAfiltered) in 150 mM aqueous NaCl solution (Fig. 4B). For the free pPDA, an increase in temperature from 25 to 50 °C resulted in an increase of the z-average hydrodynamic size value from 23 to 33 nm, indicating enlargement of micelles at elevated temperatures.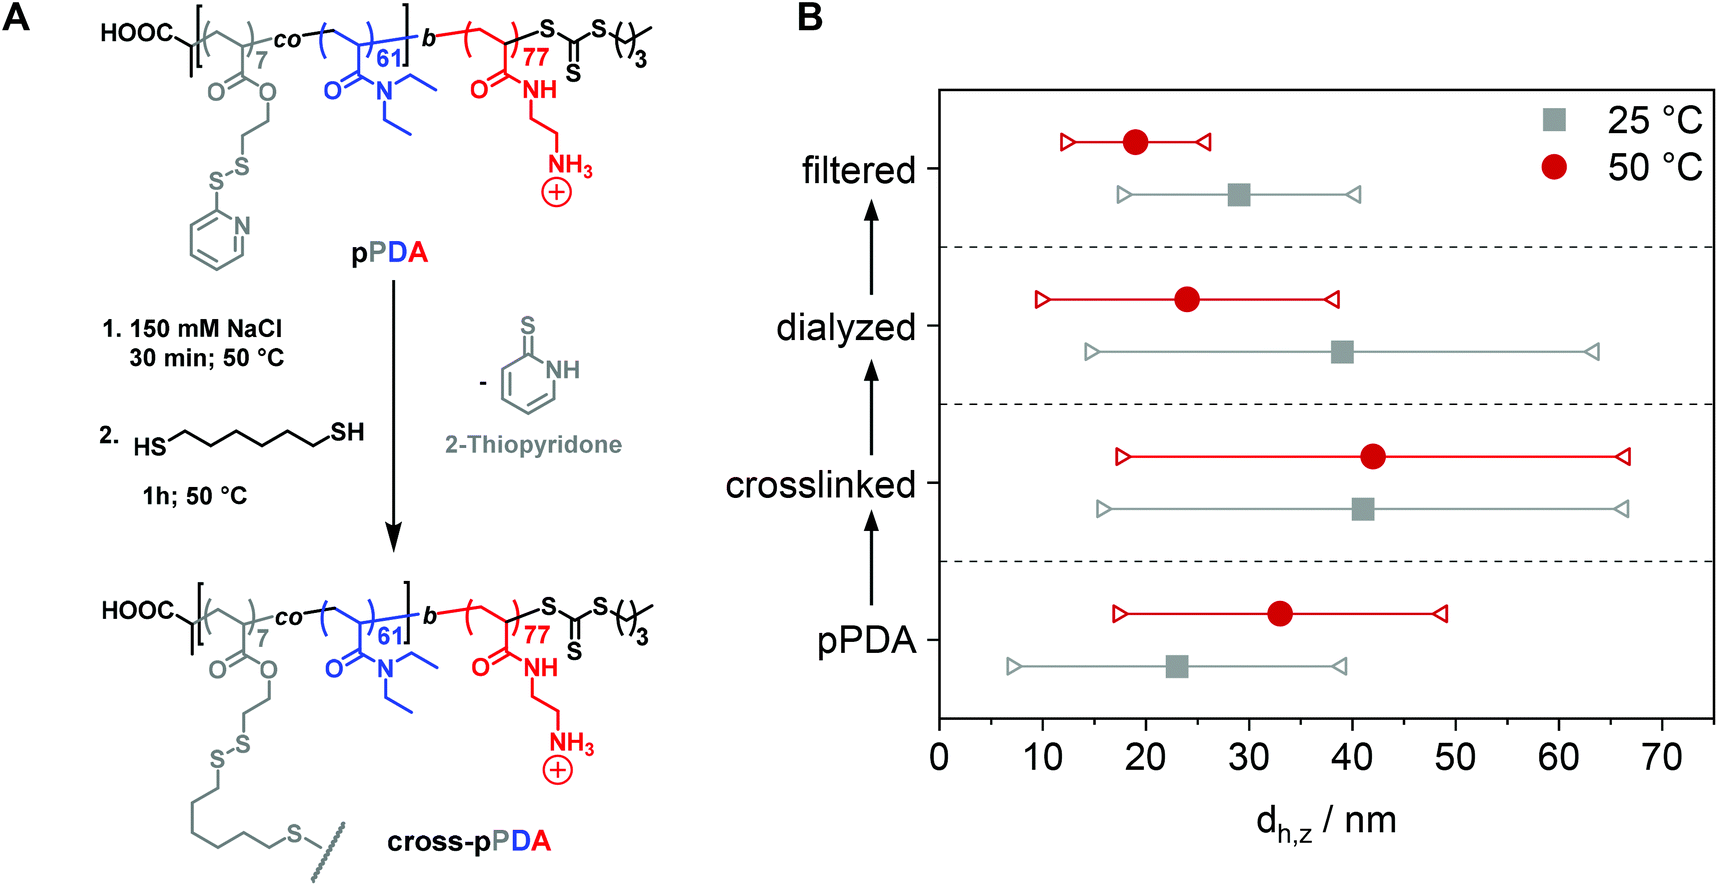 | ||
| Fig. 4 (A) Schematic overview of the crosslinking reaction of pPDA in 150 mM aqueous NaCl with 1,6-hexanedithiol. (B) Change of the z-average value (dh,z) (circles and squares) and corresponding variation of sizes in terms of standard deviation from the PDI (connected triangles) at 25 °C and 50 °C through crosslinking and processing. pPDA is crosslinked to cross-pPDA (crosslinked), followed by dialysis to cross-pPDAdialyzed, followed by filtration to cross-pPDAfiltered. | ||
The z-average value of cross-pPDA was temperature-independent at a size of 42 nm, whereas further processing and purification procedures (cross-pPDAdialyzed and cross-pPDAfiltered) resulted, again, in temperature-dependent changes of size. The size of cross-pPDAdialyzed and cross-pPDAfiltered decreased at 50 °C compared to the same samples measured at 25 °C. Z-average sizes are accompanied with the calculated standard deviation from the PDI values (dh,z ± σ) (eqn (S3), Table S5, ESI†). Sizes and their variations were temperature-independent for pPDA and cross-pPDA, but became temperature-dependent, again, after dialysis and filtration. The smallest variation of sizes of populations is displayed by the filtered sample (cross-pPDAfiltered); such values decreased further when moving from 25 to 50 °C. This indicates that the crosslinked core of the micelle is hydrated and, thus, swollen at 25 °C, since the pPD block in the crosslinked core forms hydrogen bonds with water molecules below the Tcp (Fig. 5A). At increased temperatures, the crosslinked core loses water content and, finally, collapses above the Tcp due to the LCST behavior of the pPD block. Overall, this resulted in apparently smaller PDI values and variation of sizes of the crosslinked micelles at 50 °C when compared to 25 °C. Fig. 5B supports this assumption, showing that the correlation function at 25 °C shifts to smaller decay times. This results in a shift of the intensity- and number-weighted populations of cross-pPDAfiltered to smaller sizes at 50 °C, which can be explained by a swollen core below the Tcp of the crosslinked pPDA micelles. This was shown for PNIPAm-containing micelle cores before.44–46
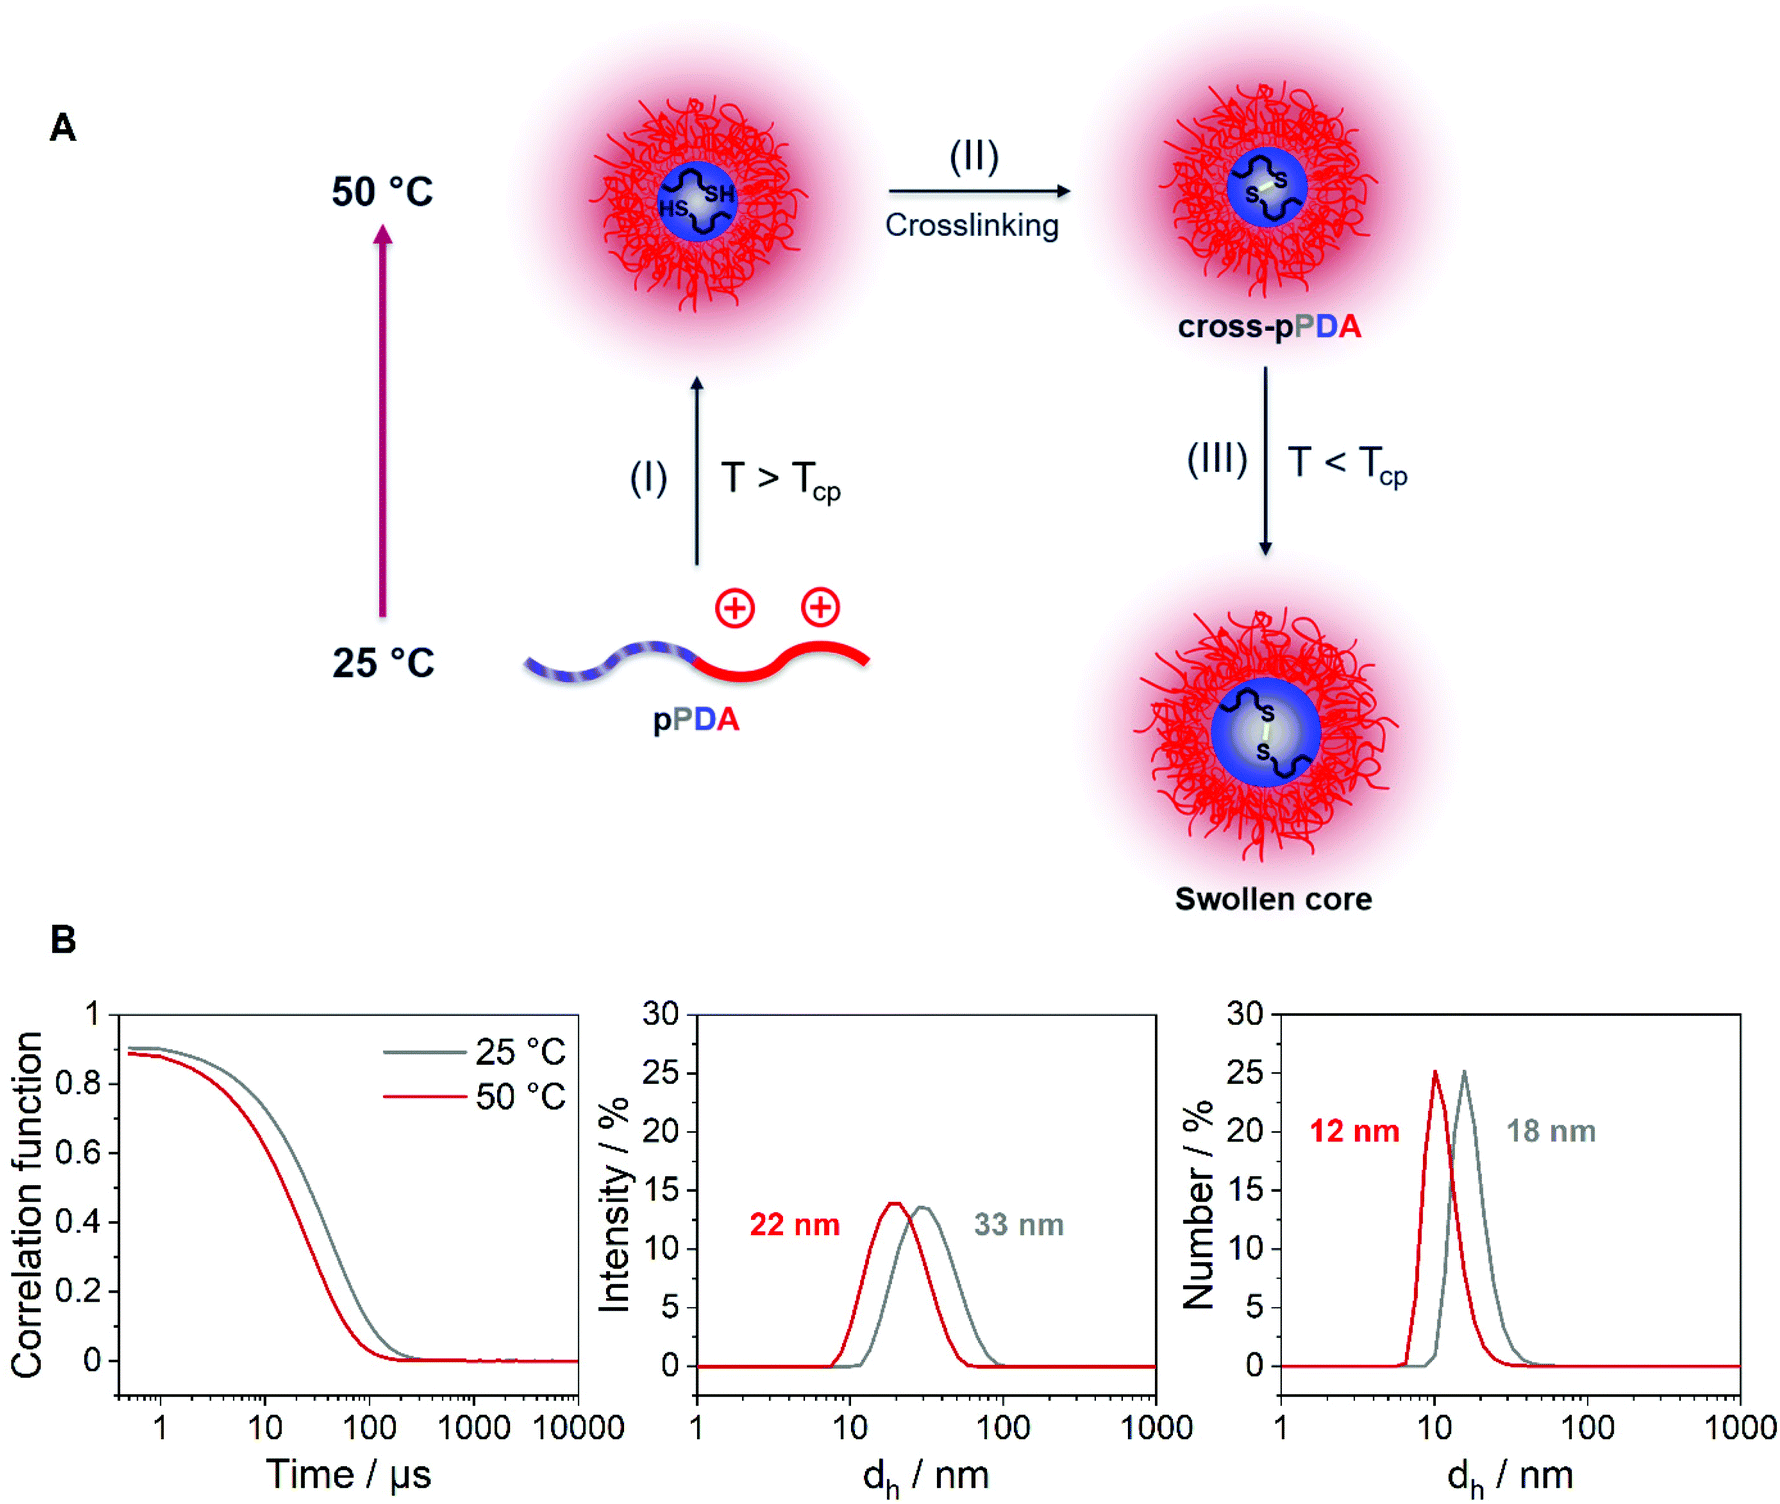 | ||
| Fig. 5 (A) Schematic overview of the crosslinking process: (I) Assembly of unimers into micelles above the Tcp, (II) crosslinking of the micelle core through disulfide bonds with 1,6-hexanedithiol, (III) collapsed pPD core becomes swollen below the Tcp due to hydrogen bonding with water molecules. (B) Exponential decay correlation function and intensity- and number-weighted size distributions of cross-pPDAfiltered in 150 mM aqueous NaCl at different temperatures obtained from DLS measurements; the mean intensity- and number-weighted sizes are stated; the polymer sample was incubated for 10 min prior to each DLS measurement. | ||
Beside DLS measurements, sedimentation velocity analysis by an AUC was utilized to investigate the temperature-dependent solution dynamics. To investigate the influence of crosslinker on the apparently formed micelle size, pPDA was either crosslinked with 1.5 (cross-pPDAexcess) or 0.5 equivalents of crosslinker (cross-pPDAdialyzed), following investigations by the AUC. To obtain a comprehensive insight into solution properties, AUC measurements were conducted in the native state and, therefore, non-filtered material solutions were used. At all temperatures, two distinct species were identified in solution of both samples. For cross-pPDAexcess, the radially-resolved sedimentation profiles at 5 °C and 40 °C showed distinct differences, such as distinct plateau values in the profiles at higher temperatures (Fig. 6A and B). Those can only originate from the presence of at least two populations in solution (Fig. S10, ESI†). Interestingly, the profiles showed a temperature-independent supernatant optical density (OD) of up to 0.6 (Fig. 6A and B, Fig. S11, ESI†), indicating components that absorb at this wavelength and have a molar mass too small for sedimentation. This could be attributed to the leaving group 2-thiophyridone, which is cleaved off during the crosslinking reaction (Fig. 4A). The absence of a remaining supernatant OD of cross-pPDAdialyzed indicates the removal of the 2-thiophyridone by dialysis (Fig. S12, ESI†). For both crosslinked samples, the differential distribution of intrinsic sedimentation coefficients, ls-g*([s]), revealed a population at similarly small intrinsic sedimentation coefficients (Fig. 6C and D). Again, the signal intensity at the peak maximum of this population partially decreased and increased intensities of the larger populations are observed with increasing temperature. Thus, the first peak represents the non-crosslinked polymer chains, which have been identified being present to some extend at all temperatures. The second population can be ascribed to the crosslinked micelle structures and new assemblies. For cross-pPDAexcess, a second species, i.e. micelles, appeared as a shoulder at slightly higher intrinsic sedimentation coefficients (5 °C). With increasing temperature, this micelle population became more pronounced and distinct at higher values of intrinsic sedimentation coefficients (eqn (1)). At 40 °C, it formed a clearly discernable separate population, similar to the non-crosslinked more dynamic structure of pPDA (Fig. 3). Since cross-pPDAexcess has been crosslinked with an excess of crosslinker, it is more likely that a larger proportion of the 1,6-hexanedithiol molecules undergoes a monoaddition to the PDSAc moieties of a single polymer chain only.79 Thus, the effectiveness of crosslinking between polymer chains is reduced. Therefore, small-sized micelles comprising a limited number of polymers were formed by an excess of crosslinker which is indicated by the increased preponderance of the micelle species in Fig. 6C. Increasing temperature caused the formation of new micelles or association of free polymer chains to existent micelle structures above the Tcp.
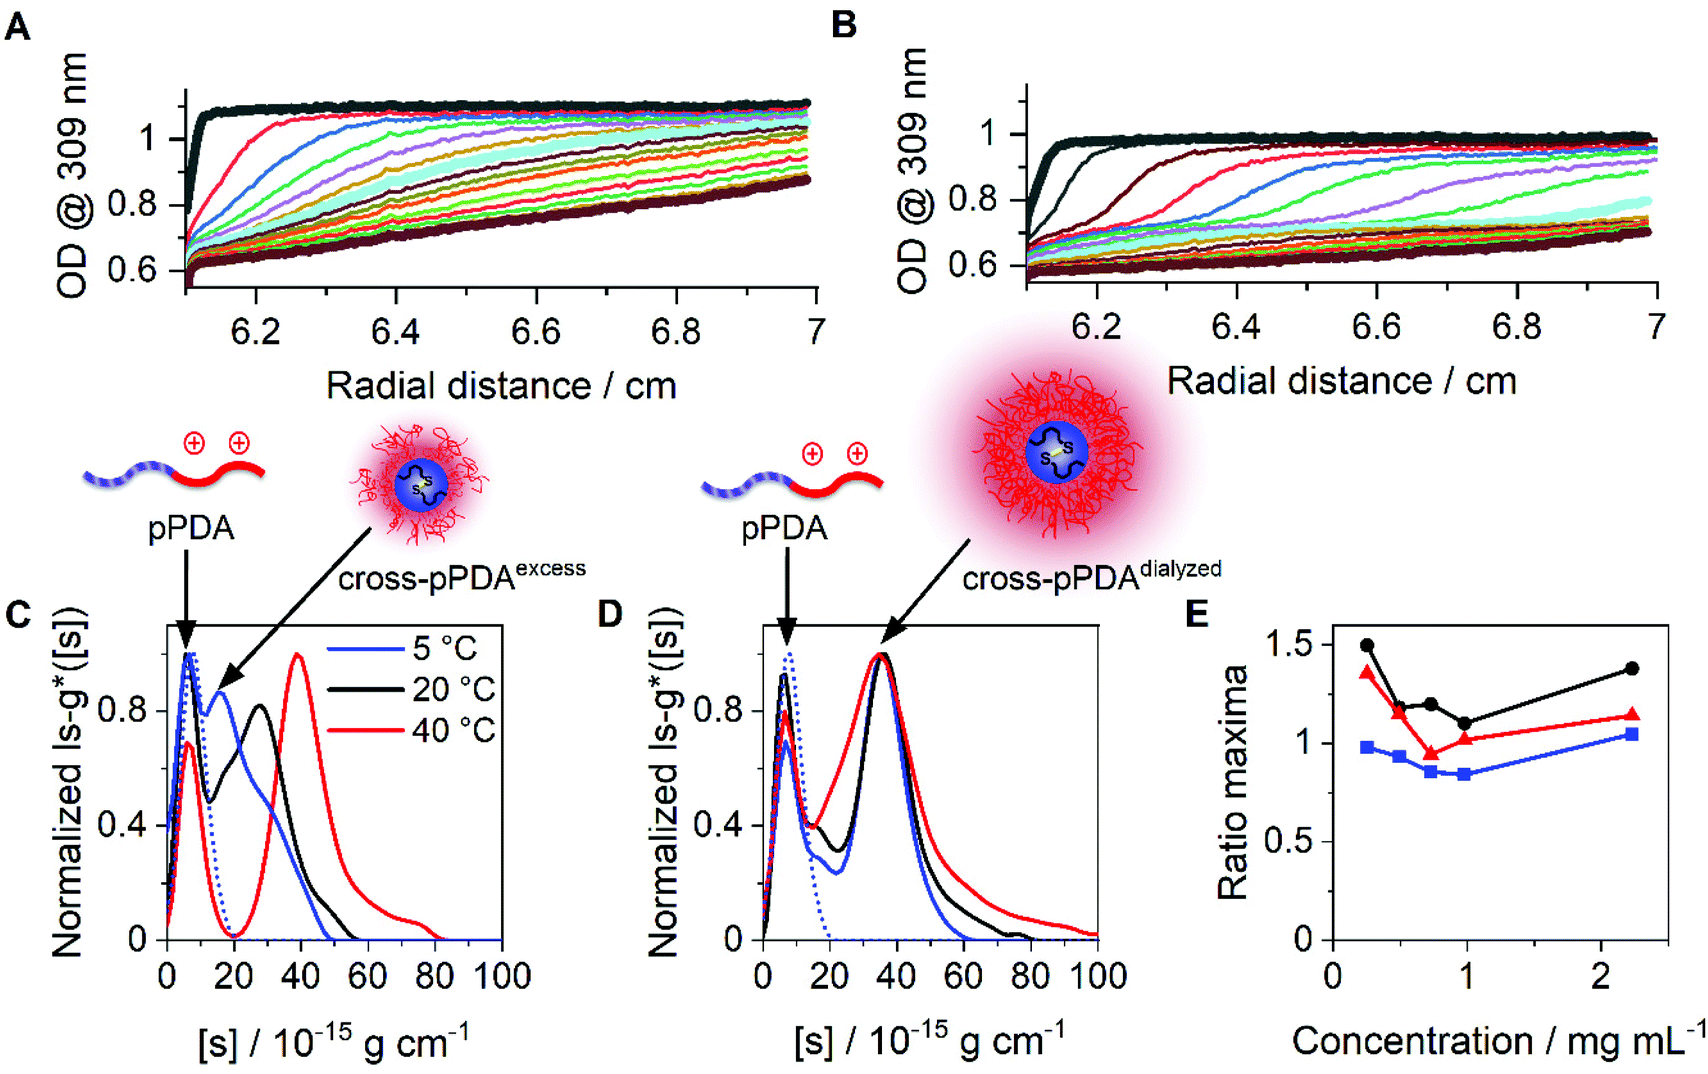 | ||
| Fig. 6 Results obtained by sedimentation velocity AUC experiments at different temperatures of cross-pPDAexcess and cross-pPDAdialyzed. Radially resolved sedimentation profiles of cross-pPDAexcess at (A) 5 °C and (B) 40 °C. Differential distributions of intrinsic sedimentation coefficients, ls-g*([s]), of (C) cross-pPDAexcess (1.5 equiv. dithiol crosslinker) and (D) cross-pPDAdialyzed (0.5 equiv. dithiol crosslinker) measured at different temperatures and via absorbance detection in terms of optical densities (OD) at 309 nm. For comparison the differential distribution of intrinsic sedimentation coefficients, ls-g*([s]), of the single polymer chain (pPDA) is displayed as the dotted blue line, overlapping with each first population of the micelles. (E) Ratio of peak maxima of cross-pPDAdialyzed between two observable peaks by division of the signal intensity at the peak maxima of assembled micelles (second peak) by the signal intensity at the peak maxima of the free block copolymer pPDA (first peak) for each measured sample concentration (Fig. S13, ESI†). | ||
In contrast, cross-pPDAdialyzed, which was crosslinked with 0.5 equivalents of 1,6-hexanedithiol, presents a less-dynamic state at all temperatures, with a second peak at comparable values of intrinsic sedimentation coefficients, [s] (eqn (1), Fig. 6D). However, at all temperatures the peak at smaller sedimentation coefficients remained, representing the free polymer chains. Cross-pPDAdialyzed was crosslinked with 0.5 equivalents of crosslinker molecules, which makes it more likely that both thiol groups of the crosslinker can react with free PDSAc moieties on several polymer chains. Thus, as the crosslinking efficiency increases, the micelle solution dynamic becomes more frozen.
For cross-pPDAdialyzed, the equilibrium between the smaller population (single polymer chains) and larger population (crosslinked micelles) was investigated again by the ratio of the signal intensities at the peak maxima (Fig. 6E). For this purpose, the signal intensity at the peak maxima of the differential distribution of sedimentation coefficients, attributable to the crosslinked micelles, were divided by those from the free polymer chains for each concentration and temperature (Fig. S13, ESI†). At all temperatures, the ratios over the investigated concentrations remained relatively similar (Fig. 6E), particularly when compared to the non-crosslinked systems (Fig. 3G). Since the ratio at each temperature remained almost constant with increasing polymer concentration, it can be concluded that the formation of the micelles does not depend on the polymer concentration at the investigated temperatures in contrast to the non-crosslinked version. These results demonstrate that the disulfide-crosslinked core stabilizes the micelle structure, regardless of the temperature and upon dilution, allowing the application of these thermo-responsive nanocarriers in biological systems.
To compare the size distributions derived from DLS and the AUC, the differential distributions of sedimentation coefficients were transformed to ls-g*(dh) distributions. For cross-pPDAexcess, a very broad size distribution containing several species was obtained at 5 °C (Fig. 7A). Such very broad size distribution can be attributed, again, to the simultaneous presence of single polymer chains and crosslinked, small-sized micelle structures. With increasing temperatures, two species became distinguishable with a peak maximum at 3 nm (single polymer chains) and 7 nm (micelles). At elevated temperatures, single polymer chains form new micelle structures or attach to the existing ones. In contrast to that, the number-weighted size distributions by DLS revealed only one population with a mean dh,n size at 21 nm and a temperature of 50 °C (Fig. S14, ESI†). It should be noted that the smaller species from the AUC at 3 nm was present in solution at any temperature investigated. The distribution of hydrodynamic diameters of cross-pPDAdialyzed displays a more frozen solution dynamic (Fig. 7B), in accordance with the sedimentation velocity experiments (Fig. 6D). While smaller species are present at the peak maximum located at 3 nm, ascribed to single polymer chains, the second population at apparent hydrodynamic sizes of 7 nm can be attributed to the core-crosslinked micelles. Interestingly, the intensity of the crosslinked micelles at 7 nm decreases at higher temperatures but also gets broader. This indicates that single polymer chains assembled into micelle structures in addition to the existent crosslinked micelles, which then increase in size. For a comparison to the AUC results (Fig. 7B), the mean size in the number-weighted DLS data (at 50 °C) was considered, which appeared being approx. 12 nm (Fig. S15, ESI†), thereby slightly larger to the sizes returned by AUC analysis. However, the DLS results did not show the presence of two discernable populations as from the AUC studies. This underlines the power of the AUC, which enables a separation as well as observation of different populations in solution.
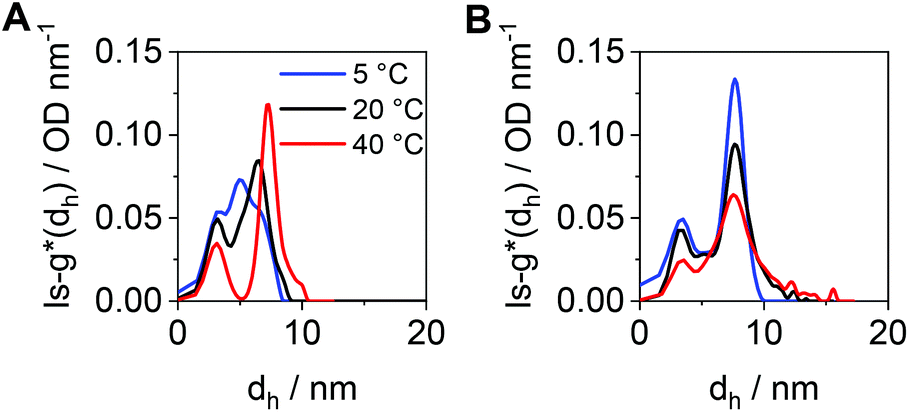 | ||
| Fig. 7 Differential distributions of hydrodynamic diameters, ls-g*(dh), at different temperatures of (A) cross-pPDAexcess and (B) cross-pPDAdialyzed. | ||
We recognize, that the sizes obtained by AUC were smaller than those from DLS due to the differences of the physical principles used for size estimations. The hydrodynamic sizes from sedimentation velocity experiments represent that of solid spherical particles sedimenting at the same speed as the species under investigation. At this point, we highlight the possibility of using a further detailing of sedimentation velocity data by switching to the c(s) and c(s,f/f0) models. In fact, those models can be utilized to gauge sizes through consideration of translational frictional ratios. In other words, this allows accounting for the diffusion properties as solely assessed by DLS. Thereby, frictional ratios, f/fsph, are attempted to be resolved in addition to the sedimentation coefficients.83f refers to the translational friction coefficient of the species under investigation and fsph that of a solid spherical particle. In this case, the corresponding dh values are calculated based on dh = 3√2√([s]υ)(f/fsph)3/2.84 This results in average hydrodynamic diameters of approx. 12 nm for the micelles and of approx. 7 nm for the unimeric polymer chains. Furthermore, the apparent molar masses of the unimer and micelle populations at 20 °C (Fig. 6D) could be determined by the very same modelling approach and the modified Svedberg equation (Tables S2 and 3, Fig. S16, ESI†).84 The results suggest that the polymer chains have molar mass values of approx. 22000 g mol−1 (in agreement with Mn,th = 18500 g mol−1), while the micelles center at about 290000 g mol−1, i.e., an average aggregation number of approx. 13 is calculated (Fig. S16, ESI†).
Further temperature-dependent study of pPDA and cross-pPDA by DLS
The stability of cross-pPDAfiltered compared to free pPDA was then investigated by measuring the count rate and PDI by DLS at different temperatures. Since the count rate is derived from the scattered light intensity an increase in the count rate indicates the formation of larger nanostructures such as micelles that scatter more light than single polymer chains. For free pPDA, it was demonstrated that the count rate gradually increased with increasing temperature, implying the assembly of micelles (Fig. 8A). Simultaneously, the PDI of pPDA decreased over the same temperature range in a sigmoidal fashion and resulted in a plateau between 48 and 58 °C with a PDI of about 0.2 (Fig. 8B). The sigmoidal decrease of the PDI was used to determine an inflection point to gauge an apparent Tcp of pPDA at around 32 °C. This value is in the same range as the Tcp obtained by fluorescence spectroscopy (34.8 °C, Fig. 2C). In contrast, the derived count rate and PDI of cross-pPDAfiltered do not change significantly with increasing temperature below 35 °C. However, for cross-pPDAfiltered, the derived count rate already exhibited a higher value from the beginning at 10 °C, remaining constant until 35 °C. Similarly, the PDI of cross-pPDAfiltered started at 0.2 for 10 °C, which was five-fold lower than for pPDA, and remained constant as well until 35 °C. These results can be explained by the presence of the micelle structures at temperatures below the cloud point due to the crosslinked micelle core. However, the count rate of cross-pPDAfiltered increased and the PDI decreased further above a temperature of 35 °C. This could be attributed to the non-crosslinked free polymer chains which may form new micelle structures in addition to the present core-crosslinked micelles. Besides, the transition of a water-swollen micelle core to a dehydrated core could lead to an apparent more uniform micelle structure and, thus, decrease of the PDI. The results of DLS and AUC measurements demonstrate, consistently, that the purified crosslinked assemblies contain micelles even below the apparent CMC, respectively cloud point, of the non-crosslinked polymer. This is likely due to the crosslinked core, preventing temperature-dependent dissociation.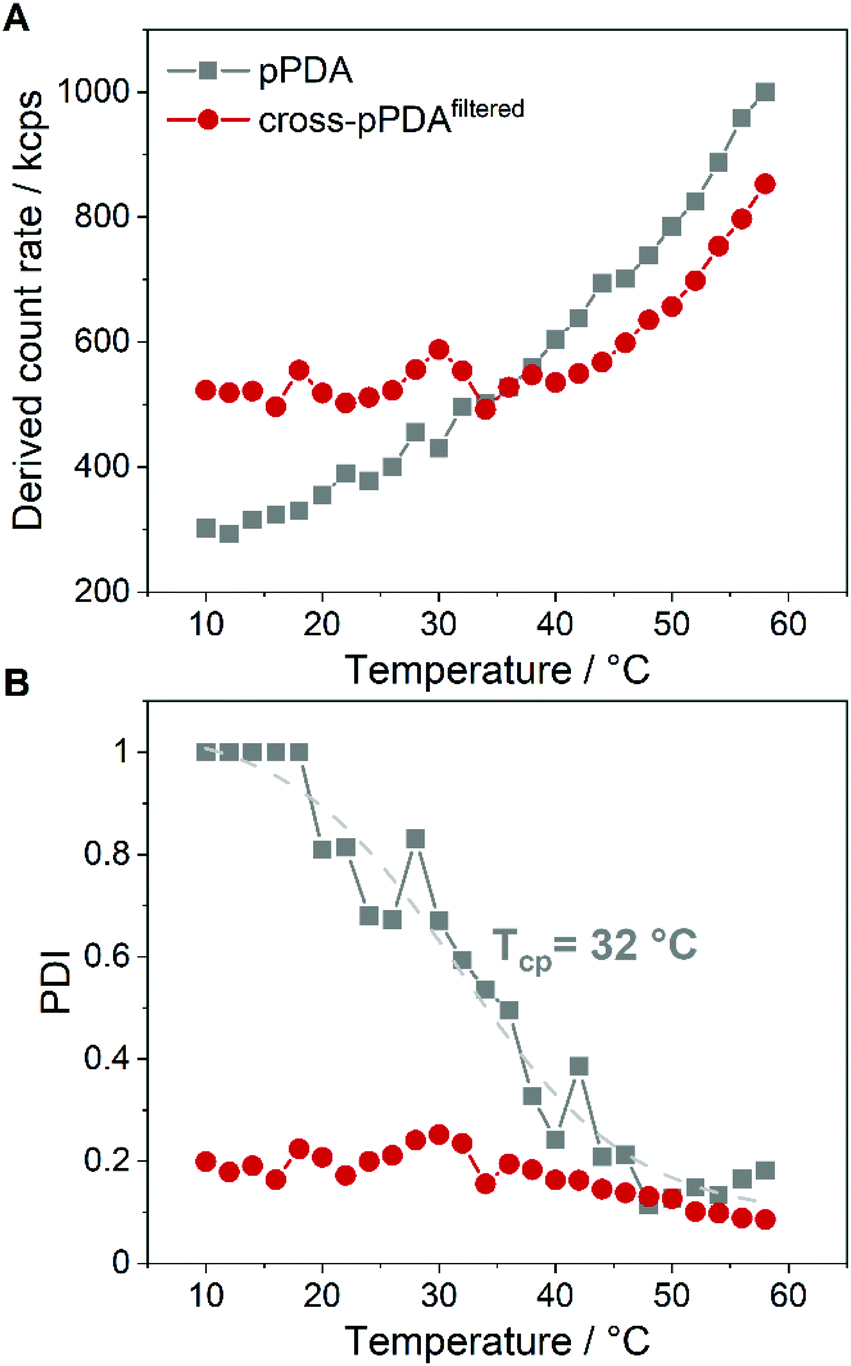 | ||
| Fig. 8 Plots of the count rate (A) and PDI (B) of pPDA in 150 mM NaCl and cross-pPDAfiltered at increasing temperature. The inflection point of the dashed sigmoidal fitting curve in (B) at 32 °C appears close to the cloud point of pPDA. The sample was equilibrated for 2 min at each temperature before DLS measurement. | ||
pDNA binding and release behavior of crosslinked and non-crosslinked micelles
To assess the potential of the pPDA polymer and cross-pPDAfiltered micelle for gene delivery, binding of plasmid DNA (pDNA) was evaluated by the ethidium bromide binding assay (EBA) as this represents a first crucial step for efficient delivery.80,81 The pDNA binding behavior of the pPDA polymer and cross-pPDAfiltered micelle were studied at molar ratios of nitrogen (of the polymer) to phosphate (of the nucleic acids) (N/P ratios) ranging from 1 to 30. Additionally, the influence of the temperature-responsive behavior and, therefore, the effect of crosslinking of the micelle was studied by performing the EBA at RT and 37 °C. Overall, both, the pPDA polymer and the cross-pPDAfiltered micelle showed a reduction of the relative fluorescence intensity (RFI) of EtBr to values below 20% and a plateau above N/P 1, indicating stable pDNA binding (Fig. 9A). The temperature had no effect on the binding behavior, at N/P ratios above 1, indicating that the crosslinking of the micelle has no influence on the ability to bind genetic material. The size and PDI of the polyplexes measured by DLS showed narrow distributions with diameters (dh,z) below 100 nm (Table S6, Fig. S17, ESI†). As the genetic material needs to be released in the cell for efficient gene delivery, the interactions within the pDNA-polymer complex (polyplex) need to be dynamic. The dissociation of the formed polyplex was studied in the presence of competing polyanions using the heparin release assay (HRA). Therefore, EtBr fluorescence was measured subsequent to addition of increasing amounts of heparin to the polyplex at N/P 10. Displacement of the pDNA from the polyplex results in re-intercalation of EtBr into the pDNA base pairs and increased the RFI values. Both, the pPDA polymer and the cross-pPDAfiltered micelle showed almost complete release of pDNA (∼90%) above 20 U mL−1 heparin (Fig. 9B). Nevertheless, there are differences observed in the release behavior of the non-crosslinked pPDA polymer and the crosslinked micelle. While the pPDA polyplex already shows increasing RFI values at approx. 9 U mL−1 heparin, indicating pDNA release, the cross-pPDAfiltered micelle polyplex is still intact under these conditions showing significantly lower RFI values. This might indicate that crosslinking somehow has an influence on the release behavior. While efficient binding regardless of temperature and crosslinking is expected due to incorporation of AEAm within the polymer,61 the release behavior is potentially influenced by stabilization of the micelle by crosslinking. Overall, the pPDA polymer and cross-pPDAfiltered micelle show promising pDNA binding and release properties, with the cross-pPDAfiltered micelle showing slightly higher complex stability and, therefore, high potential for gene delivery.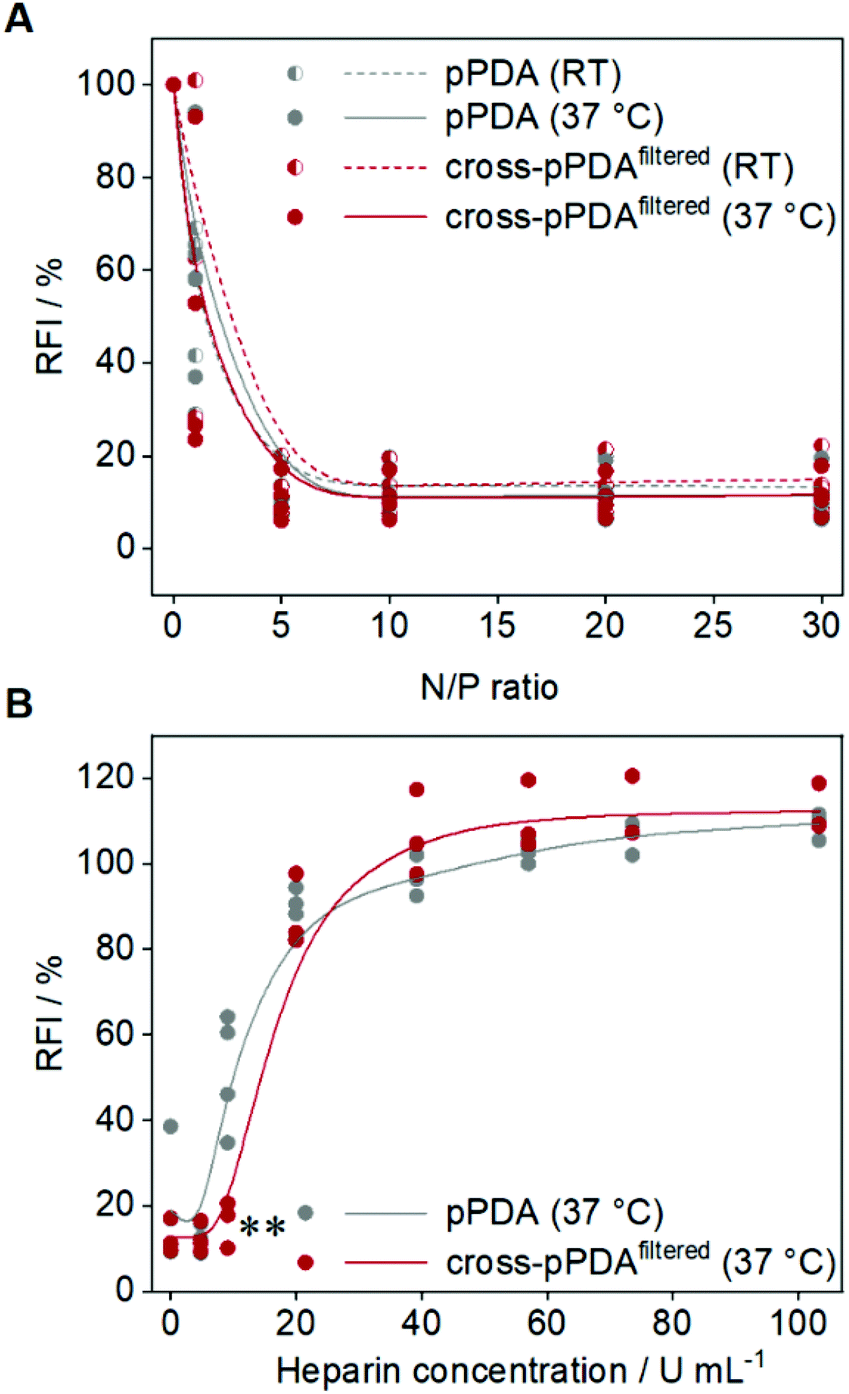 | ||
| Fig. 9 pDNA binding and release of the pPDA polymer and cross-pPDAfiltered micelle. pDNA binding ability was studied by (A) ethidium bromide binding assay (EBA) at room temperature (RT) and 37 °C at different N/P ratios (1 to 30). (B) Release behavior was studied at 37 °C by performing the heparin release assay (HRA) at N/P 10 (n ≥ 3). Statistically significant differences in comparison to the non-crosslinked pPDA polymer are denoted as follows: *p < 0.05, **p < 0.01, and ***p < 0.001. | ||
Cytotoxicity investigations and transfection of HEK293T cells
As cytotoxicity is a critical parameter often impairing gene delivery efficiency of cationic polymers, the biocompatibility of the pPDA polymer and the cross-pPDAfiltered micelles was studied. To evaluate cell viability at transfection conditions, HEK293T cells were incubated for 48 h with pPDA, cross-pPDAfiltered and the P(AEAm)96 homopolymer (pA) polyplexes at N/P 10 using pDNA encoding for EGFP. Subsequently, materials were measured via flow cytometry and imaged via fluorescence microscopy. Cell viability was determined by analyzing the cells by their sideward and forward scatter (SSC/FSC) and additionally by visualization via microscopy (Fig. S19, ESI†). All samples showed cell viabilities above 80% at concentrations used for transfection experiments (Fig. 10).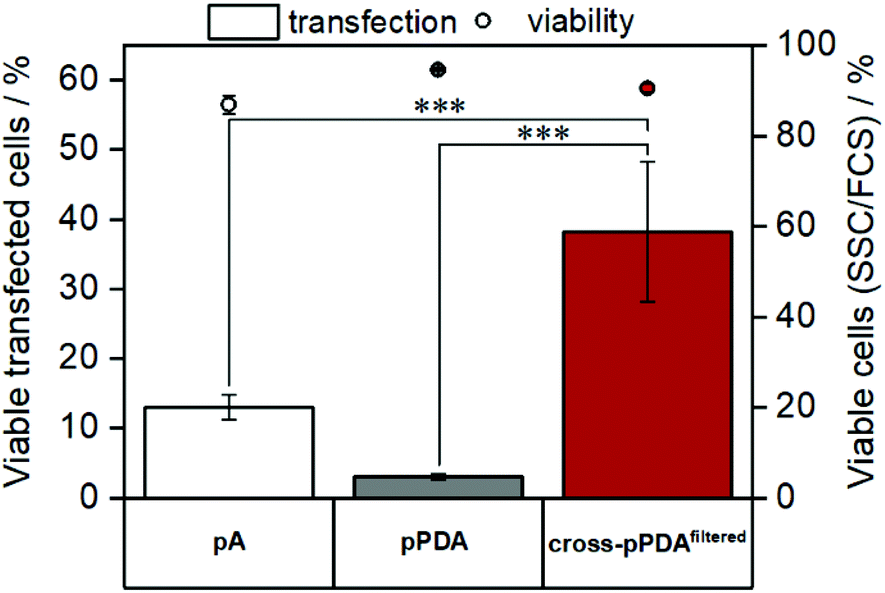 | ||
| Fig. 10 Evaluation of cytotoxicity and transfection efficiency in HEK293T cells via flow cytometry. HEK293T cells were treated with the samples for 48 h. Cytotoxicity was determined by analyzing a quantity of 2 × 10⁴ cells by their sideward and forward scatter (FSC/SSC). Transfection efficiency was investigated by measuring EGFP expression and is displayed as percentage of transfected cells in comparison to the control (polyplex with pKMyc pDNA) (mean of n = 3 ± SD). Statistical significance is denoted as follows: *p < 0.05, **p < 0.01, and ***p < 0.001. | ||
To evaluate transfection efficiency HEK293T cells were incubated as described above and transfection efficiency was determined as percentage of viable EGFP expressing cells measured via flow cytometry. The detailed gating strategy is shown in the ESI (Fig. S18, ESI†). LPEI was used under optimized conditions (N/P 20, 3 μg mL−1 pDNA) as a positive control to ensure valid conditions during transfection experiments (Table S7, ESI†). The cross-pPDAfiltered micelle clearly exhibited a higher efficiency compared to the non-crosslinked polymer (pPDA) (38.3 ± 10.0% and 3.0 ± 0.4%) (Fig. 10, Fig. S19, ESI†). Further, the crosslinked micelles also showed an almost three-fold higher transfection efficiency compared to the pA homopolymer. These results are clearly showing the advantage of incorporating pA within a micelle structure, usually showing relatively low transfection efficiency when used as homopolymer for related applications.61 Further crosslinking of the micelle cores leads to a significant 13-fold increase of transfection efficiency. This increase can be explained by the micelle structure chosen within this study. The LCST behavior of the pPDA polymer was utilized for the formation of micelles, which are subsequently stabilized by crosslinking and preserve their micelle structure regardless of the temperature and concentration (Fig. 11A). The cationic shell of the crosslinked micelle is capable of binding pDNA to its surface, showing high transfection efficiencies not influenced by temperature changes within the transfection protocol (Fig. S20, ESI†).
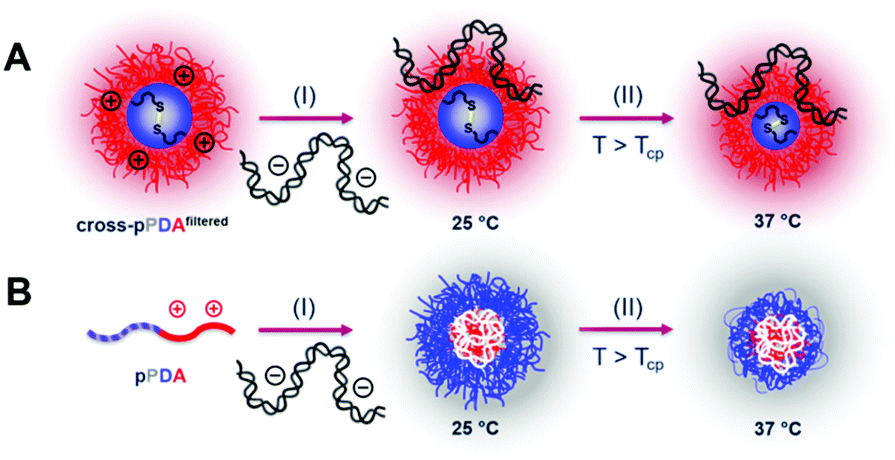 | ||
| Fig. 11 (A) Schematic polyplex formation with cross-pPDAfiltered: (I) pDNA is complexed with the cationic shell of the crosslinked micelle at 25 °C, which possesses a hydrated core; (II) the thermo-responsive hydrated core collapses above the Tcp due to the loss of water. (B) Polyplex formation with free pPDA chains: (I) pDNA is complexed by the free pPDA chains at 25 °C, resulting in a polyplex where the cationic charge density of pPDA is focused in the core of the complex and the hydrated thermo-responsive segment forms the outer layer; (II) outer layer of the polyplex collapses above the Tcp, accompanied by a loss of water. | ||
In contrast, the pPDA polymer is present as free polymer chains in solution at RT and a concentration of 220 μg mL−1 during polyplex formation. This could result in formation of a polyplex with a cationic core complexing the pDNA with the pPD block forming the shell of the polyplex (Fig. 11B). This hypothesis is supported by Fliervoet and coworkers, who observed a reduction of surface charge and resulting enhancement of cytocompatibility by the incorporation of PNIPAm into block copolymers of PEG and PDMAEMA.35 Similar effects, additionally at reduced uptake and transfection efficiency, were reported for copolymers of NIPAm and DMAEMA in comparison to a PDMAEMA homopolymer.82 The reduced transfection efficiency of the non-crosslinked pPDA polymer in comparison to the crosslinked micelle and the polyplex formed with the cationic pA homopolymer could, therefore, be explained by a “stealth” effect caused by the formation of a pPD shell. Overall, the substantially higher transfection efficiency of the cross-pPDAfiltered polyplex in comparison to the non-crosslinked pPDA polyplex and the pA homopolymer demonstrates the advantage of the micelle structure and its stabilization by core-crosslinking. Further, the results show, that the thermo-responsive behavior of PDEAm, which has so far not been incorporated into gene delivery systems, can successfully be utilized for the formation of well-defined core-crosslinked cationic micelles with high gene delivery efficiency.
Conclusions
We designed a temperature- and pH-responsive diblock copolymer that was assembled into polymeric micelles, which were core-crosslinked via disulfide linkages. The diblock copolymer pPDA was synthesized via sequential RAFT polymerization, comprising a temperature-responsive PDEAm block and a pH-responsive PAEAm block. The dithiol crosslinker PDSAc was incorporated in the PDEAm block to facilitate disulfide crosslinking of the desired micelle core.The temperature-responsive behavior of the pPD copolymer was investigated by turbidimetric measurements and revealed that the incorporation of the hydrophobic PDSAc monomer reduced the Tcp considerably, when compared to the pD homopolymer. The Tcp was determined to be 34.8 °C at a concentration of 1 mg mL−1, being close to the human body temperature. The size and population distributions of the micelle structures were investigated by DLS and AUC measurements. Both techniques confirmed the temperature-dependent formation of micelles. However, DLS results only showed one population, which shifted to larger sizes at decreasing PDIs upon temperature increase. The use of AUC provided deeper insights into the solution dynamics, as two unique populations could be resolved. For the non-crosslinked pPDA, we found that only single polymer chains were present in solution at 5 °C, whereas aggregated polymer chains, i.e., micelles, appeared with increasing temperature. This temperature-dependent dynamic equilibrium between single polymer chains and micelles was only decoded by AUC measurements, underlining the importance of using orthogonal analytical techniques for a comprehensive characterization of colloidal dynamics. For the crosslinked micelle (cross-pPDAdialyzed), a more frozen temperature dynamic was identified by the AUC. Here, the micelles were discernable at all the investigated temperatures, notwithstanding the always present unimeric polymer species. This implies that the crosslinking of the core was successful and sufficient to stabilize the micelles, regardless of the temperature and upon dilution.
It was found that the free pPDA and the crosslinked micelles showed a similarly strong pDNA binding. However, a slightly larger amount of heparin was needed to release the genetic material from the formed polyplexes with the crosslinked micelles. This can be attributed to the stabilized micelle structure due to the core-crosslinking. Both, the crosslinked micelles and the free pPDA enabled high cell viability at concentrations required for transfection experiments. Further, the crosslinked micelles showed a 13-fold higher transfection efficiency compared to polymer only, which might be attributed to the stabilizing effect of the micelles core-crosslinking and primarily surface binding of pDNA. Alterations in temperature during transfection experiments did not result in an observable change of transfection efficiency, showing the high stability of the core-crosslinked micelle system. These results further reveal the potential of the developed and future block copolymer systems for stimuli-responsive controlled assembly of gene delivery vectors in the form of micelles, stabilized by crosslinking.
Author contributions
KL: conceptualization, methodology, investigation, writing – original draft; GC: conceptualization, methodology, formal analysis, investigation, writing – original draft; JIS: methodology, investigation, formal analysis, writing – review & editing; LM: conceptualization, supervision, writing – review & editing; IN: conceptualization, supervision, writing – review & editing, project administration, funding acquisition; AT: conceptualization, supervision, writing – review & editing, project administration, funding acquisition.Conflicts of interest
There are no conflicts to declare.Acknowledgements
This work was supported by the Bundesministerium für Bildung und Forschung (BMBF, Germany, #13XP5034A PolyBioMik) and by the DFG-funded Collaborative Research Center PolyTarget (SFB 1278, projects B01 and Z01, project ID: 316213987). G.C. acknowledges support from the Free State of Thuringia and the European Social Fund (2019SD0129). I.N. and A.T. further acknowledge support of this work by the “Thüringer Aufbaubank (TAB)” and the “Europäischer Fond für regionale Entwicklung (EFRE)” (2018FGI0025) for funding of analytical ultracentrifugation and flow cytometry devices at the JCSM. The authors gratefully acknowledge Dr. Grit Festag for maintaining the SEC facilities. Furthermore, the authors gratefully acknowledge Nicole Fritz for measuring the ESI-MS spectrum. The authors gratefully acknowledge Elisabeth Preußger, Carolin Kellner and Bärbel Beringer-Siemers for taking splendid care of the cell lines and pDNA preparation. Furthermore, the authors gratefully acknowledge Elisabeth Moek for assistance in transfection assays. Moreover, the authors thankfully acknowledge Prof. U. S. Schubert for providing excellent facilities.Notes and references
- A. Shahryari, M. Saghaeian Jazi, S. Mohammadi, H. Razavi Nikoo, Z. Nazari, E. S. Hosseini, I. Burtscher, S. J. Mowla and H. Lickert, Front. Genet., 2019, 10, 868 CrossRef CAS PubMed.
- H. Buning, EMBO Mol. Med., 2013, 5, 1–3 CrossRef PubMed.
- R. Maldonado, S. Jalil and K. Wartiovaara, J. Community Genet., 2021, 12, 267–276 CrossRef PubMed.
- E. B. Yahya and A. M. Alqadhi, Life Sci., 2021, 269, 119087 CrossRef CAS PubMed.
- R. Goswami, G. Subramanian, L. Silayeva, I. Newkirk, D. Doctor, K. Chawla, S. Chattopadhyay, D. Chandra, N. Chilukuri and V. Betapudi, Front. Oncol., 2019, 9, 297 CrossRef PubMed.
- S. M. Dizaj, S. Jafari and A. Y. Khosroushahi, Nanoscale Res. Lett., 2014, 9, 252 CrossRef PubMed.
- H. Yin, R. L. Kanasty, A. A. Eltoukhy, A. J. Vegas, J. R. Dorkin and D. G. Anderson, Nat. Rev. Genet., 2014, 15, 541–555 CrossRef CAS PubMed.
- Y. Yue and C. Wu, Biomater. Sci., 2013, 1, 152–170 RSC.
- P. Zhang and E. Wagner, in Polymeric Gene Delivery Systems, ed. Y. Cheng, Springer International Publishing, Cham, 2018, pp. 1–39 Search PubMed.
- S. R. Mane, A. Sathyan and R. Shunmugam, ACS Appl. Nano Mater., 2020, 3, 2104–2117 CrossRef CAS.
- G. Kocak, C. Tuncer and V. Bütün, Polym. Chem., 2017, 8, 144–176 RSC.
- Y. W. Harn, Y. J. He, Z. W. Wang, Y. H. Chen, S. Liang, Z. L. Li, Q. Li, L. Zhu and Z. Q. Lin, Macromolecules, 2020, 53, 8286–8295 CrossRef CAS.
- A. Gandhi, A. Paul, S. O. Sen and K. K. Sen, Asian J. Pharm. Sci., 2015, 10, 99–107 CrossRef.
- M. T. Calejo, S. A. Sande and B. Nyström, Expert Opin. Drug Delivery, 2013, 10, 1669–1686 CrossRef CAS PubMed.
- T. Sarwan, P. Kumar, Y. E. Choonara and V. Pillay, Front. Mater., 2020, 7, 73 CrossRef.
- A. Bordat, T. Boissenot, J. Nicolas and N. Tsapis, Adv. Drug Delivery Rev., 2019, 138, 167–192 CrossRef CAS PubMed.
- A. Aied, U. Greiser, A. Pandit and W. Wang, Drug Discovery Today, 2013, 18, 1090–1098 CrossRef CAS PubMed.
- T. Bus, A. Traeger and U. S. Schubert, J. Mater. Chem. B, 2018, 6, 6904–6918 RSC.
- R. Hoogenboom, in Smart Polymers and their Applications, eds. M. R. Aguilar and J. San Román, Woodhead Publishing, 2014, pp. 15–44 Search PubMed.
- Q. Zhang, C. Weber, U. S. Schubert and R. Hoogenboom, Mater. Horiz., 2017, 4, 109–116 RSC.
- R. Hoogenboom, H. M. L. Thijs, M. J. H. C. Jochems, B. M. van Lankvelt, M. W. M. Fijten and U. S. Schubert, Chem. Commun., 2008, 5758–5760 RSC.
- R. Hoogenboom, A.-M. Zorn, H. Keul, C. Barner-Kowollik and M. Moeller, Polym. Chem., 2012, 3, 335–342 RSC.
- W. Steinhauer, R. Hoogenboom, H. Keul and M. Moeller, Macromolecules, 2013, 46, 1447–1460 CrossRef CAS.
- Y. Zhang, S. Furyk, D. E. Bergbreiter and P. S. Cremer, J. Am. Chem. Soc., 2005, 127, 14505–14510 CrossRef CAS PubMed.
- Y. Zhang and P. S. Cremer, Curr. Opin. Chem. Biol., 2006, 10, 658–663 CrossRef CAS PubMed.
- C. Alexander, Expert Opin. Drug Delivery, 2006, 3, 573–581 CrossRef CAS PubMed.
- M. Heskins and J. E. Guillet, J. Macromol. Sci. Chem. A2, 1968, 2, 1441–1455 CAS.
- K. Jain, R. Vedarajan, M. Watanabe, M. Ishikiriyama and N. Matsumi, Polym. Chem., 2015, 6, 6819–6825 RSC.
- R. Liu, M. Fraylich and B. R. Saunders, Colloid Polym. Sci., 2009, 287, 627–643 CrossRef CAS.
- Y. Chen, Z. Wang, Y. W. Harn, S. Pan, Z. Li, S. Lin, J. Peng, G. Zhang and Z. Lin, Angew. Chem., Int. Ed. Engl., 2019, 58, 11910–11917 CrossRef CAS PubMed.
- M. Kurisawa, M. Yokoyama and T. Okano, J. Controlled Release, 2000, 69, 127–137 CrossRef CAS PubMed.
- Z. Shen, B. Shi, H. Zhang, J. Bi and S. Dai, Soft Matter, 2012, 8, 1385–1394 RSC.
- C. Y. Lin, Z. Huang, W. Wen, A. Wu, C. Wang and L. Niu, PLoS One, 2015, 10, e0123562 CrossRef PubMed.
- M. T. Calejo, A. M. S. Cardoso, A.-L. Kjøniksen, K. Zhu, C. M. Morais, S. A. Sande, A. L. Cardoso, M. C. P. d. Lima, A. Jurado and B. Nyström, Int. J. Pharm., 2013, 448, 105–114 CrossRef CAS PubMed.
- L. A. L. Fliervoet, C. F. van Nostrum, W. E. Hennink and T. Vermonden, Multifunct. Mater., 2019, 2, 024002 CrossRef CAS.
- I. Idziak, D. Avoce, D. Lessard, D. Gravel and X. X. Zhu, Macromolecules, 1999, 32, 1260–1263 CrossRef CAS.
- B. V. K. J. Schmidt, Macromol. Chem. Phys., 2018, 219, 1700494 CrossRef.
- A. El Jundi, S. J. Buwalda, Y. Bakkour, X. Garric and B. Nottelet, Adv. Colloid Interface Sci., 2020, 283, 102213 CrossRef CAS PubMed.
- X. Zhang, T. F. Burton, M. In, S. Bégu, A. Aubert-Pouëssel, J.-J. Robin, S. Monge and O. Giani, Mater. Today Commun., 2020, 24, 100987 CrossRef CAS.
- S. Luo, M. Han, Y. Cao, C. Ling and Y. Zhang, Colloid Polym. Sci., 2011, 289, 1243–1251 CrossRef CAS.
- X. Zhang, S. Monge, M. In, O. Giani and J.-J. Robin, Soft Matter, 2013, 9, 1301–1309 RSC.
- C. F. van Nostrum, Soft Matter, 2011, 7, 3246–3259 RSC.
- C. Chang, H. Wei, D.-Q. Wu, B. Yang, N. Chen, S.-X. Cheng, X.-Z. Zhang and R.-X. Zhuo, Int. J. Pharm., 2011, 420, 333–340 CrossRef CAS PubMed.
- J. Zhang, X. Jiang, Y. Zhang, Y. Li and S. Liu, Macromolecules, 2007, 40, 9125–9132 CrossRef CAS.
- X. Jiang, J. Zhang, Y. Zhou, J. Xu and S. Liu, J. Polym. Sci., Part A: Polym. Chem., 2008, 46, 860–871 CrossRef CAS.
- L. Zhang, J. Bernard, T. P. Davis, C. Barner-Kowollik and M. H. Stenzel, Macromol. Rapid Commun., 2008, 29, 123–129 CrossRef CAS.
- X. Wan, T. Liu and S. Liu, Langmuir, 2011, 27, 4082–4090 CrossRef CAS PubMed.
- K. Maruya-Li, C. Shetty, A. M. Jazani, N. Arezi and J. K. Oh, ACS Omega, 2020, 5, 3734–3742 CrossRef CAS PubMed.
- Y. Li, B. S. Lokitz, S. P. Armes and C. L. McCormick, Macromolecules, 2006, 39, 2726–2728 CrossRef CAS.
- L. N. Pilon, S. P. Armes, P. Findlay and S. P. Rannard, Eur. Polym. J., 2006, 42, 1487–1498 CrossRef CAS.
- M. Grube, G. Cinar, U. S. Schubert and I. Nischang, Polymers, 2020, 12, 277 CrossRef CAS PubMed.
- A. Ortega, R. Pamies, K. Zhu, A.-L. Kjøniksen, B. Nyström and J. García, de la Torre, Colloid Polym. Sci., 2011, 290, 297–306 CrossRef.
- M. Hahn, E. Görnitz and H. Dautzenberg, Macromolecules, 1998, 31, 5616–5623 CrossRef CAS.
- T. V. Burova, N. V. Grinsberg, V. Ya. Grinberg, E. V. Kalinina, V. I. Lozinsky, V. O. Aseyev, S. Holappa, H. Tenhu and A. R. Khokhlov, Macromolecules, 2005, 38, 1292–1299 CrossRef CAS.
- G. Cinar, C. Englert, M. Lehmann and I. Nischang, Anal. Chem., 2020, 92, 7932–7939 CrossRef CAS PubMed.
- D. Mehn, R. Capomaccio, S. Gioria, D. Gilliland and L. Calzolai, J. Nanopart. Res., 2020, 22, 158 CrossRef CAS.
- I. Perevyazko, A. Vollrath, S. Hornig, G. M. Pavlov and U. S. Schubert, J. Polym. Sci., A: Polym. Chem., 2010, 48, 3924–3931 CrossRef CAS.
- S. Schottler, K. Landfester and V. Mailander, Angew. Chem., Int. Ed. Engl., 2016, 55, 8806–8815 CrossRef PubMed.
- C. Weber, S. Morsbach and K. Landfester, Angew. Chem., Int. Ed. Engl., 2019, 58, 12787–12794 CrossRef CAS PubMed.
- G. Cinar, C. Englert, U. S. Schubert and I. Nischang, Nanoscale, 2020, 12, 22462–22466 RSC.
- F. Richter, L. Martin, K. Leer, E. Moek, F. Hausig, J. C. Brendel and A. Traeger, J. Mater. Chem. B, 2020, 8, 5026–5041 RSC.
- S. C. Larnaudie, J. C. Brendel, K. A. Jolliffe and S. Perrier, J. Polym. Sci., Part A: Polym. Chem., 2016, 54, 1003–1011 CrossRef CAS.
- P. Schuck and P. Rossmanith, Biopolymers, 2000, 54, 328–341 CrossRef CAS PubMed.
- J. I. Solomun, G. Cinar, P. Mapfumo, F. Richter, E. Moek, F. Hausig, L. Martin, S. Hoeppener, I. Nischang and A. Traeger, Int. J. Pharm., 2021, 593, 120080 CrossRef CAS PubMed.
- D. Roy, W. L. Brooks and B. S. Sumerlin, Chem. Soc. Rev., 2013, 42, 7214–7243 RSC.
- Z. Jia, J. Liu, C. Boyer, T. P. Davis and V. Bulmus, Biomacromolecules, 2009, 10, 3253–3258 CrossRef CAS PubMed.
- L. Wong, C. Boyer, Z. Jia, H. M. Zareie, T. P. Davis and V. Bulmus, Biomacromolecules, 2008, 9, 1934–1944 CrossRef CAS PubMed.
- Z. Jia, L. Wong, T. P. Davis and V. Bulmus, Biomacromolecules, 2008, 9, 3106–3113 CrossRef CAS PubMed.
- J. Swain and A. K. Mishra, Photochem. Photobiol. Sci., 2016, 15, 1400–1407 CrossRef CAS PubMed.
- N. Scholz, T. Behnke and U. Resch-Genger, J. Fluoresc., 2018, 28, 465–476 CrossRef CAS PubMed.
- M. D. Lechner, J. Serb. Chem. Soc., 2005, 70, 361–369 CrossRef CAS.
- S. Hanio, J. Schlauersbach, B. Lenz, F. Spiegel, R. A. Bockmann, R. Schweins, I. Nischang, U. S. Schubert, S. Endres, A. C. Poppler, F. P. Brandl, T. M. Smit, K. Kolter and L. Meinel, Langmuir, 2021, 37, 2543–2551 CrossRef CAS PubMed.
- W. Mächtle, Makromol. Chem., 1984, 185, 1025–1039 CrossRef.
- T. Svedberg and K. Estrup, Z. Chem. Ind. Kolloide, 1911, 9, 259–261 CrossRef.
- P. J. Roth, C. Boyer, A. B. Lowe and T. P. Davis, Macromol. Rapid Commun., 2011, 32, 1123–1143 CrossRef CAS PubMed.
- I. Altinbasak, M. Arslan, R. Sanyal and A. Sanyal, Polym. Chem., 2020, 11, 7603–7624 RSC.
- S. Ghosh, S. Basu and S. Thayumanavan, Macromolecules, 2006, 39, 5595–5597 CrossRef CAS.
- T. C. Lai, H. Cho and G. S. Kwon, Polym. Chem., 2014, 5, 1650–1661 RSC.
- J. K. Elter, G. Sentis, P. Bellstedt, P. Biehl, M. Gottschaldt and F. H. Schacher, Polym. Chem., 2018, 9, 2247–2257 RSC.
- A. J. Geall and I. S. Blagbrough, J. Pharm. Biomed. Anal., 2000, 22, 849–859 CrossRef CAS PubMed.
- A.-K. Trützschler, T. Bus, M. Reifarth, J. C. Brendel, S. Hoeppener, A. Traeger and U. S. Schubert, Bioconjugate Chem., 2018, 29, 2181–2194 CrossRef PubMed.
- W. Hinrichs, N. Schuurmans-Nieuwenbroek, P. Van De Wetering and W. Hennink, J. Controlled Release, 1999, 60, 249–259 CrossRef CAS PubMed.
- P. Schuck, Biophys. J., 2000, 78(3), 1606–19 CrossRef CAS PubMed.
- M. Grube, M. N. Leiske, U. S. Schubert and I. Nischang, Macromolecules, 2018, 51(5), 1905–1916 CrossRef CAS.
Footnotes |
| † Electronic supplementary information (ESI) available. See DOI: 10.1039/d1nr04223h |
| ‡ Authors contributed equally to the study. |
| This journal is © The Royal Society of Chemistry 2021 |