
 Open Access Article
 This Open Access Article is licensed under a
 Creative Commons Attribution 3.0 Unported Licence
Simple and high-yield preparation of carbon-black-supported ∼1 nm platinum nanoclusters and their oxygen reduction reactivity†
Tokuhisa
Kawawaki‡
 a,
Nobuyuki
Shimizu‡
a,
Kanako
Funai
a,
Yusuke
Mitomi
a,
Sakiat
Hossain
a,
Soichi
Kikkawa
b,
D. J.
Osborn
c,
Seiji
Yamazoe
b,
Gregory F.
Metha
c and
Yuichi
Negishi
*a
a,
Nobuyuki
Shimizu‡
a,
Kanako
Funai
a,
Yusuke
Mitomi
a,
Sakiat
Hossain
a,
Soichi
Kikkawa
b,
D. J.
Osborn
c,
Seiji
Yamazoe
b,
Gregory F.
Metha
c and
Yuichi
Negishi
*a
aDepartment of Applied Chemistry, Faculty of Science, Tokyo University of Science, Kagurazaka, Shinjuku-ku, Tokyo 162-8601, Japan. E-mail: negishi@rs.tus.ac.jp
bDepartment of Chemistry, Graduate School of Science, Tokyo Metropolitan University, 1-1 Minami-Osawa, Hachioji-shi, Tokyo 192-0397, Japan
cDepartment of Chemistry, University of Adelaide, Adelaide, South Australia 5005, Australia
First published on 3rd August 2021
Abstract
The improvement of oxygen reduction reaction (ORR) catalysts is essential before polymer electrolyte fuel cells can be used widely. To this end, we established a simple method for the size-selective synthesis of a series of ligand-protected platinum nanoclusters with ∼1 nm particle size (Ptn NCs; n = ∼35, ∼51, and ∼66) and narrow size distribution (±∼4 Pt atoms) under atmospheric conditions. Using this method, each ligand-protected ∼1 nm Pt NC was obtained in a relatively high yield (nearly 80% for Pt∼66). We succeeded in adsorbing each ligand-protected ∼1 nm Pt NC on carbon black (CB) and then removing most of the ligands from the surface of the Pt NCs via calcination while maintaining the original size. The obtained Pt∼35/CB, Pt∼51/CB, and Pt∼66/CB exhibited ORR mass activities that were 1.6, 2.1, and 1.6 times higher, respectively, than that of commercial CB supported-Pt nanoparticles, and also display high durability.
Introduction
Effective use of energy resources and conservation of the global environment are currently important issues for humankind.1 Polymer electrolyte fuel cells (PEFCs; Fig. S1†) are power-generation devices that directly convert chemical energy into electrical energy (Fig. S2†) with higher conversion efficiency and improved environmental friendliness relative to devices currently used in thermal power generation. However, further cost reduction is essential for their widespread use. In PEFCs, the oxygen reduction reaction (ORR; Fig. S2a†) at the cathode is the rate-limiting step, and carbon-black (CB)-supported platinum nanoparticles (Pt NPs or PtNP) with particle sizes of 2–3 nm (PtNP/CB) are widely used in the cathodes. As Pt is a rare and expensive precious metal, with its use as a catalyst contributing to the high cost of PEFCs, attempts have been made to develop cathode electrocatalysts that do not contain precious metals.2 However, currently, there are no known non-precious-metal catalysts that offer the same activity and durability as PtNP/CB. The following facts have recently been clarified for Pt nanoclusters3,4 with a particle size of ∼1 nm which are smaller than Pt NPs; (1) ∼1 nm Pt NCs have higher mass activity than Pt NPs5–9 and (2) the mass activity of ∼1 nm Pt NCs varies dramatically depending on the number of constituent atoms.5–9 Accordingly, if highly active ∼1 nm Pt NCs can be synthesized with a narrow distribution in the number of the constituent atoms9,10 and can then be supported on CB without aggregation, it might be possible to create a highly active ORR catalyst, leading to the cost reduction of PEFCs.Previous studies on ∼1 nm Pt NCs mainly used the following synthesis/preparation methods: (1) laser vaporization11,12 or ion sputtering7 of bulk Pt under vacuum (Fig. S3a†), (2) liquid-phase synthesis using a special dendrimer as a template (Fig. S3b†),5,6 (3) liquid-phase synthesis using carbon monoxide (CO) as ligands (or as a part of ligands) (Fig. S3c†),13 (4) liquid-phase synthesis using a metal–organic framework (MOF) as a template (Fig. S3d†),14 or (5) particle growth on a support via an impregnation method (Fig. S3e†).15 However, method 1 requires expensive equipment and method 2 requires precise synthesis of special dendrimers and are thus not suitable for the mass production of Pt NCs. Methods 3 and 4 use a Pt–CO compound that is difficult to handle as a precursor in the atmosphere, thereby requiring complicated equipment and synthesis processes. Finally, method 5 is simple and suitable for the mass production of Pt NCs; however, it is difficult in principle to control the number of the constituent atoms of Pt NCs with a narrow distribution in the number of the constituent atoms using this method. Thus, to realize the creation of highly active ORR catalysts that can be practically used, the establishment of a new catalyst-preparation method is indispensable.
We recently succeeded in establishing a simple method for isolating [Pt17(PPh3)8(CO)12]z+ (z = 1, 2; PPh3 = triphenylphosphine) with atomic precision.16 This method consists of mixing the reagents, heating the mixture, and removing the by-products in the atmosphere. Furthermore, we succeeded in adsorbing the obtained [Pt17(PPh3)8(CO)12]z+ onto a support and subsequently removing the ligands via calcination while maintaining the original size (Fig. S3f†).17 Unfortunately, [Pt17(PPh3)8(CO)12]z+ could not be isolated in high yields.16 Therefore, in the present study, we have established a new method for synthesising ∼1 nm Pt NCs. To address the problems of the other methods, we attempted to simultaneously achieve (i) simple operation under atmospheric conditions, (ii) narrow distribution in the number of the constituent atoms, and (iii) high yield of product in their syntheses. We succeeded in the size-selective synthesis of a series of ligand-protected ∼1 nm Pt NCs (Pt∼35, Pt∼51, and Pt∼66 NCs) with a narrow distribution in the number of the constituent atoms using a combination of simple procedures, such as mixing the reagents, heating the solution, and washing the by-product in air. Using this method, each Pt NC was obtained in relatively high yields of 21.6, 48.4, and 78.4%, respectively. The obtained series of ligand-protected ∼1 nm Pt NCs were adsorbed onto CB mostly retaining their original size, and then the majority of ligands was removed from the surface of the Pt NCs by calcination (Ptn/CB). The obtained Ptn/CB catalysts exhibited higher ORR mass activity than commercial PtNP/CB loaded with 2–3 nm Pt NPs. Pt∼51/CB exhibited particularly high ORR mass activity and high durability comparable to that of PtNP/CB.
Results and discussion
Synthesis of ligand-protected Pt∼35, Pt∼51, and Pt∼66 NCs
In the synthesis, a polyol reduction method (Fig. S4†)18–23 was used as in the case of [Pt17(CO)12(PPh3)8]z+ (Fig. 1a and Fig. S5†). First, an appropriate amount of sodium hydroxide (NaOH) was dissolved in ethylene glycol, and then hexachloride platinum(IV) acid (H2PtCl6) was dissolved in this solution. The solution was then heated at 80 °C to reduce the [Pt(IV)Cl6]2− into [Pt(II)Cl4]2−.22 Then, Pt ions in the solution were reduced to Pt atoms by heating the solution at 120 °C. During this process, CO was coordinated to the generated Pt atom along with the reduction of the Pt ion.23 Thus, the generated Pt NCs appeared to be weakly protected by CO and OH− in the solution.23 Since such unstable Pt NCs easily aggregate when dried, most of the CO and OH− was replaced with 2-phenylethanethiolate (PET), which forms a strong bond with Pt. Specifically, the temperature of the solution was cooled down to room temperature, and 2-phenylethanethiol was added to the solution for exchange of the ligands of the Pt NCs. The target Ptn NCs protected by PET and CO were obtained by removing unreacted thiols, Pt ions, and by-products from the solution. These operations include mixing of the reagents, heating of the reaction mixture, and removal of the by-products in air, making this method a convenient one (Fig. 1a). Experiments with different concentrations of H2PtCl6 salt, NaOH, and 2-phenylethanethiol revealed that the following conditions are the most appropriate for obtaining a product with a narrow size distribution and high yield (Fig. S6†): (1) concentration of H2PtCl6 salt of 13.3 mM; (2) concentration of NaOH of 225 mM, and (3) amount of 2-phenylethanethiol of 10 times equivalent of H2PtCl6 salt.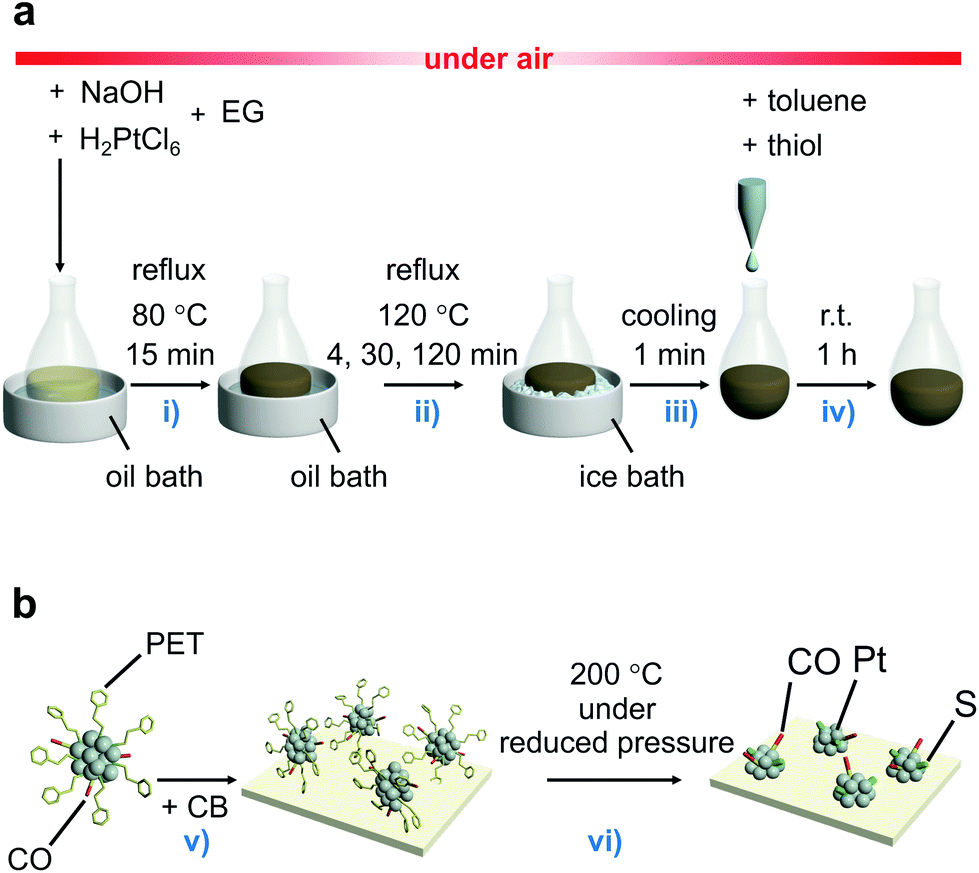 | ||
| Fig. 1 Schematic illustrations of experimental procedure. (a) The controlled synthesis of ligand-protected ∼1 nm Pt NCs. (b) The controlled loading of ∼1 nm Pt NCs on CB used in this study. The main role of each procedure is (i) reduction of [Pt(IV)Cl6]2− into [Pt(II)Cl4]2−,22 (ii) formation of the Pt NC core and growth of Pt NCs, (iii) stopping the growth of Pt NCs, (iv) ligand exchange, (v) adsorption of ligand-protected Pt NCs on CB, and (vi) partial elimination of the ligands from the surface of the Pt NCs (EG = ethylene glycol). | ||
Fig. 2a and b presents transmission electron microscopy (TEM) and high-angle annular dark-field scanning transmission electron microscopy (HAADF-STEM) images (Fig. S7†) of samples obtained by heating the solution at 120 °C for 4 min (1), 30 min (2), and 120 min (3). Clear particle images were observed for all the samples. The Pt L3-edge X-ray absorption near-edge structure (XANES) spectra (Fig. 2c) and Pt 4f X-ray photoelectron spectroscopy (XPS) spectra (Fig. S8†) indicated that the Pt in these samples were reduced to a charge state similar to that of Pt(0). The optical absorption of 1–3 showed the absorption in the entire visible region, similar to that of the Pt NPs (Fig. S9†). In the Pt L3-edge Fourier-transform extended X-ray absorption fine structure (FT-EXAFS) spectra, peaks were observed at positions attributed to Pt–Pt (2.2–3.0 Å), Pt–S (1.7–2.0 Å), and Pt–C (1.5–1.7 Å) bonds (Fig. S10†). The S 2p XPS (Fig. S11†) and FT infrared spectroscopy (FT-IR) spectra (Fig. 2d and Table S1†) indicated that 1–3 compound contained PET. The FT-IR spectrum (Fig. 2d) revealed that 1–3 also contained CO (Table S1†). These results indicate that PET and CO-protected Ptn NCs were indeed synthesized by the method described above. From the histogram (inset in Fig. 2b) obtained from the HAADF-STEM image, it was determined that 1–3 have particle sizes of 1.1 ± 0.1, 1.2 ± 0.2, and 1.3 ± 0.1 nm, respectively, namely, a narrow size distribution in the ∼1 nm particle-size region.
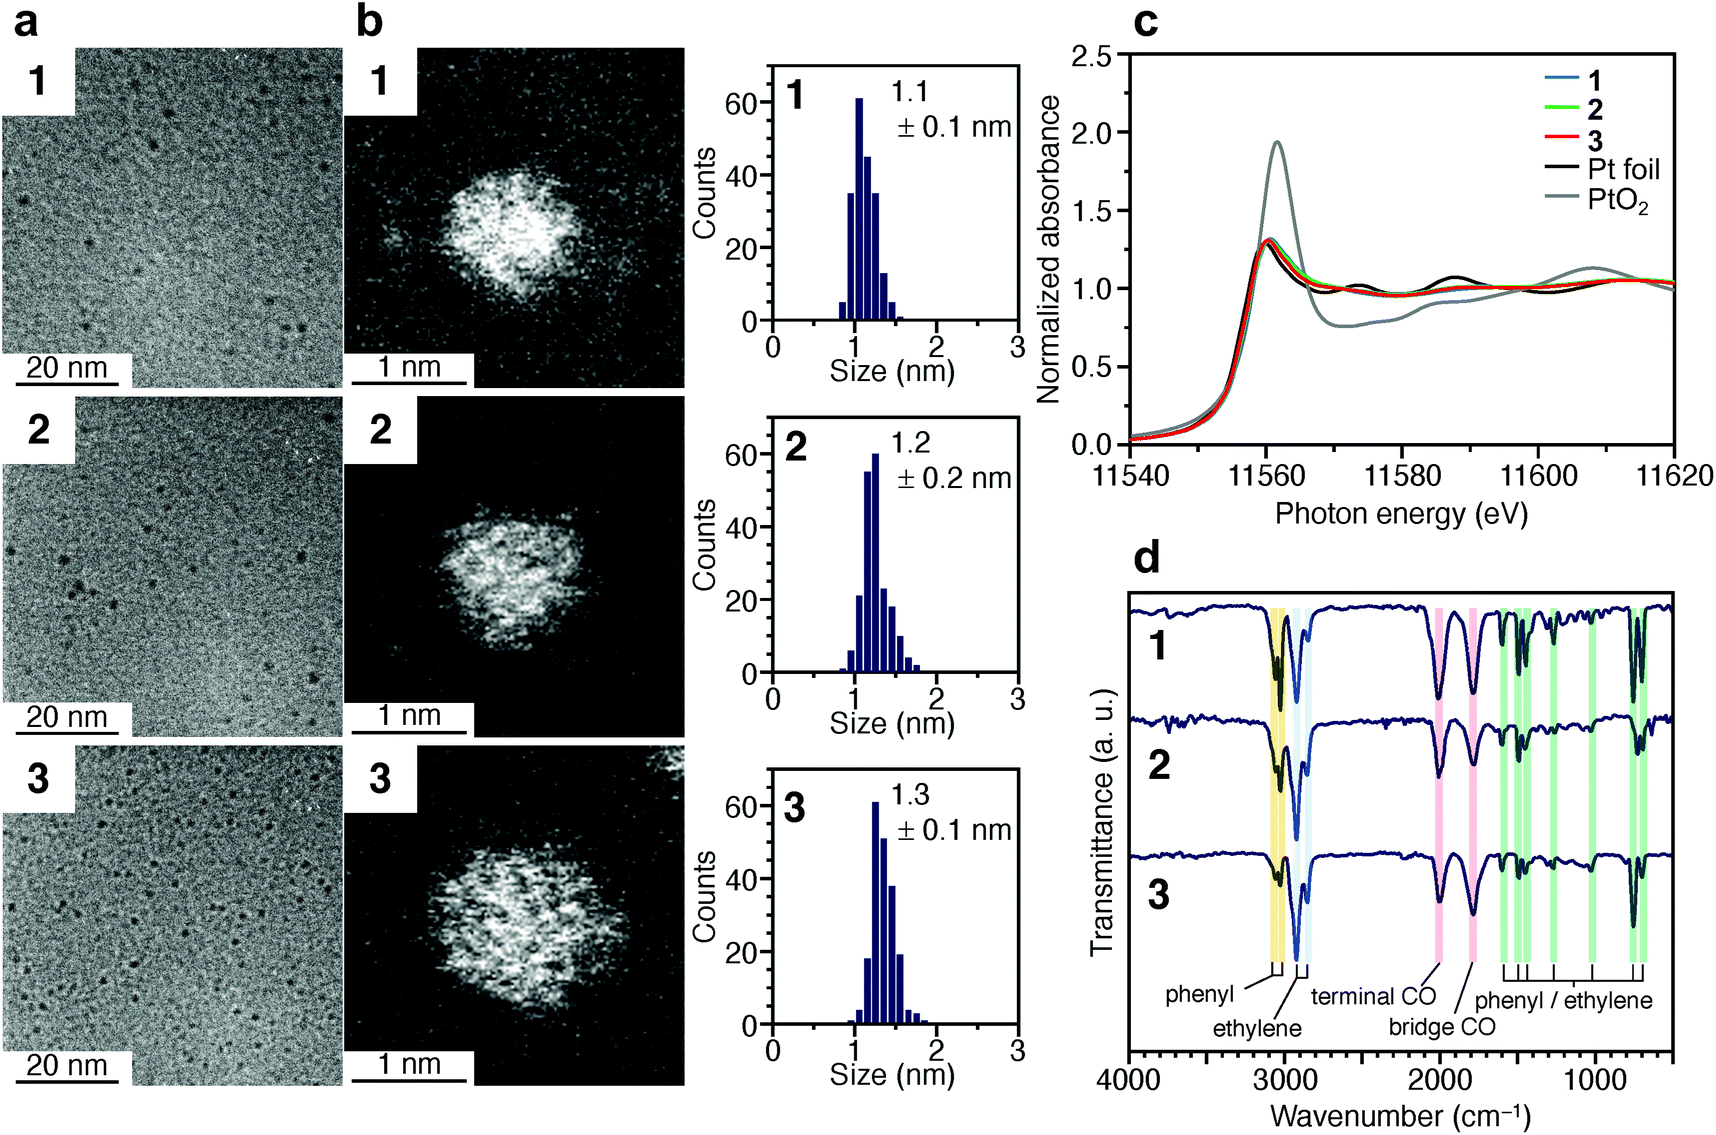 | ||
| Fig. 2 Characterization of 1–3. (a) TEM images, (b) HAADF-STEM images (Fig. S7†) and resulting histograms of particle-size distribution, (c) Pt L3-edge XANES spectra, and (d) FT-IR spectra. In (c), Pt L3-edge XANES spectra of Pt foil and PtO2 are also shown for comparison. In (d), the peak assignable to S–H stretching (∼2570 cm−1) was not observed, indicating that PET is coordinated to Pt NCs via Pt–S bonds. Details of the assignments of the peaks in FT-IR are shown in Table S1.† | ||
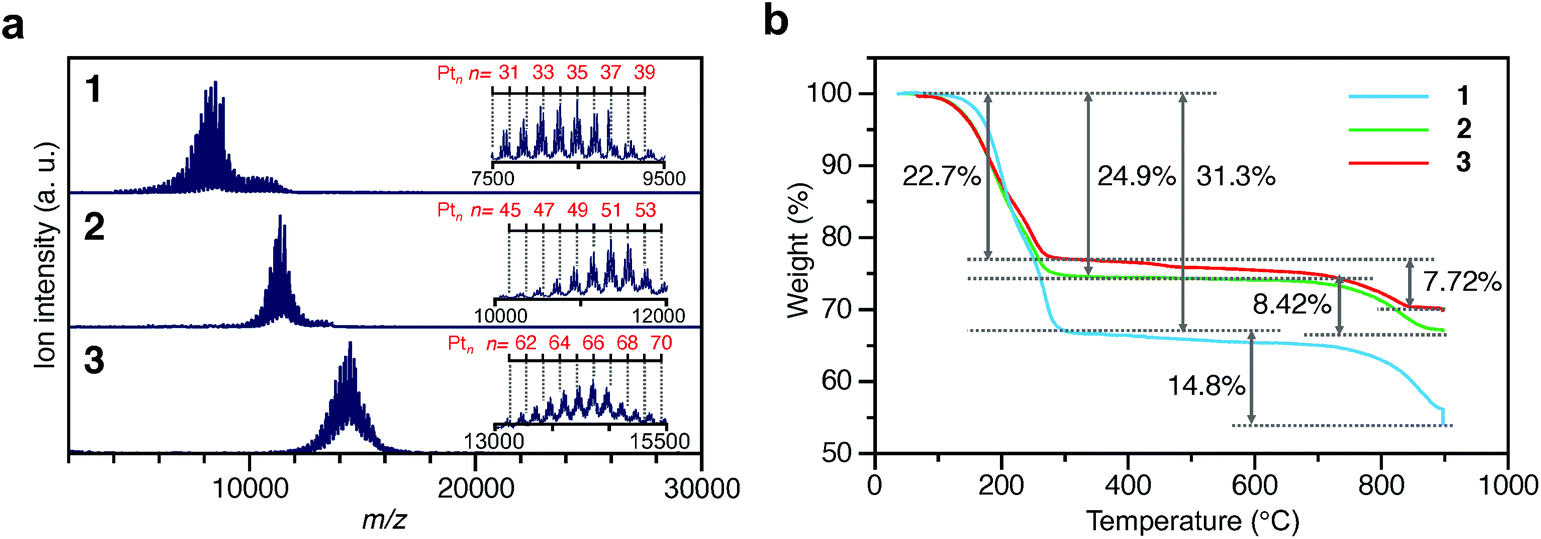
To investigate the chemical compositions of the obtained 1–3, matrix-assisted laser desorption/ionization mass spectrometry (MALDI-MS), thermogravimetric analysis (TGA), and TG mass spectrometry (TG-MS) were performed. Fig. 3a shows the MALDI-MS spectra of 1–3. In each MS spectrum, a series of narrowly distributed peaks appear near m/z = 8000, 11![[thin space (1/6-em)]](https://www.rsc.org/images/entities/char_2009.gif) 000, and 14000, respectively. There is little overlap in these mass distributions, indicating that each sample contained Ptn(PET)m(CO)l NCs with different chemical compositions. The peak spacing observed in each spectrum corresponds to the atomic weight of Pt (195.1) or S (32.1) (insets of Fig. 3a and Fig. S12†), implying that S–C dissociation occurred (Fig. S13†)24–26 upon laser irradiation. Fig. 3b presents the TGA curves of 1–3. For all the samples, the first weight loss occurred in the temperature range of 160–300 °C and the second weight loss started at 750 °C. The TG-MS results (Fig. S14†) indicate that the first weight loss was caused by the S–C dissociation of PET and that the second weight loss was caused by the desorption of S and CO (Table S2†). On the basis of all these results, it can be considered that (1) 1–3 have the chemical compositions shown in Tables S3–5† and, therefore, (2) 1–3 contain approximately 35, 51, and 66 Pt atoms, respectively, and (3) the distribution of the number of the Pt atoms is only ±∼4 in 1–3. These interpretations are consistent with the TEM (Fig. 2a) and HAADF-STEM (Fig. 2b) results. For example, if we calculate the particle size of Pt∼35, Pt∼51, and Pt∼66 using the density of bulk Pt (21.45 g cm−3),27 they are estimated to be 1.00, 1.14, and 1.24 nm, respectively. These particle sizes are close to the particle sizes of 1–3 observed in Fig. 2a. From the Pt weight in each Pt NC estimated from TGA (Fig. 3b), it was found that 1–3 were synthesized in relatively high yields (21.6%, 48.4%, and 78.4%, respectively), when the yield was calculated for the amount of used Pt.
000, and 14000, respectively. There is little overlap in these mass distributions, indicating that each sample contained Ptn(PET)m(CO)l NCs with different chemical compositions. The peak spacing observed in each spectrum corresponds to the atomic weight of Pt (195.1) or S (32.1) (insets of Fig. 3a and Fig. S12†), implying that S–C dissociation occurred (Fig. S13†)24–26 upon laser irradiation. Fig. 3b presents the TGA curves of 1–3. For all the samples, the first weight loss occurred in the temperature range of 160–300 °C and the second weight loss started at 750 °C. The TG-MS results (Fig. S14†) indicate that the first weight loss was caused by the S–C dissociation of PET and that the second weight loss was caused by the desorption of S and CO (Table S2†). On the basis of all these results, it can be considered that (1) 1–3 have the chemical compositions shown in Tables S3–5† and, therefore, (2) 1–3 contain approximately 35, 51, and 66 Pt atoms, respectively, and (3) the distribution of the number of the Pt atoms is only ±∼4 in 1–3. These interpretations are consistent with the TEM (Fig. 2a) and HAADF-STEM (Fig. 2b) results. For example, if we calculate the particle size of Pt∼35, Pt∼51, and Pt∼66 using the density of bulk Pt (21.45 g cm−3),27 they are estimated to be 1.00, 1.14, and 1.24 nm, respectively. These particle sizes are close to the particle sizes of 1–3 observed in Fig. 2a. From the Pt weight in each Pt NC estimated from TGA (Fig. 3b), it was found that 1–3 were synthesized in relatively high yields (21.6%, 48.4%, and 78.4%, respectively), when the yield was calculated for the amount of used Pt.
 | ||
| Fig. 3 Characterization of 1–3. (a) MALDI mass spectra and (b) TGA curves. In (a), the insets show the expanded spectra. Detail of the assignments are shown in Fig. S12.† | ||
As demonstrated above, we have succeeded in obtaining a series of ∼1 nm Pt NCs with a narrow distribution in a relatively high yield using a simple operation in air. Although PET was the main ligand in the Pt NCs obtained in this study, such synthesis of controlled ∼1 nm Pt NCs is difficult using the Brust method,28 which has been widely used in the precise synthesis29–42 of thiolate-protected gold NCs.43,44 In this study, first, Pt NCs that were weakly coordinated by CO and OH− were synthesized by polyol reduction.18–23 For such Pt NCs, the particle size can be gradually increased with the reduction time.19,45 In addition, size convergence to the stable size is expected to occur46,47 when the ligands of the obtained Pt NCs are replaced by PET. These two factors are presumed to be largely related to the success of the isolation of a series of Pt NCs with narrow distribution (Fig. 4). In this study, the synthetic conditions were optimized to obtain 3, the largest Pt NCs among the three Pt NCs, with high yield. Consequently, lower yields were obtained for 1 and 2 whose metal cores are intermediates in the growth of the metal core of 3. In addition, under these experimental conditions, the number of Pt atoms is considered insufficient for the formation of Ptn(PET)m(CO)l NCs larger than 3. In fact, Ptn(PET)m(CO)l NCs larger than 3 could not be synthesized with good reproducibility. However, on the basis of the proposed mechanism shown in Fig. 4, it is expected that other Ptn(PET)m(CO)l NCs including 1 and 2 can be also synthesized in high yields if the synthetic conditions are optimized for those Pt NCs. The three differently-sized Pt NCs, 1, 2 and 3, were then used to investigate the relationship between the number of the constituent Pt atoms and the ORR activity.
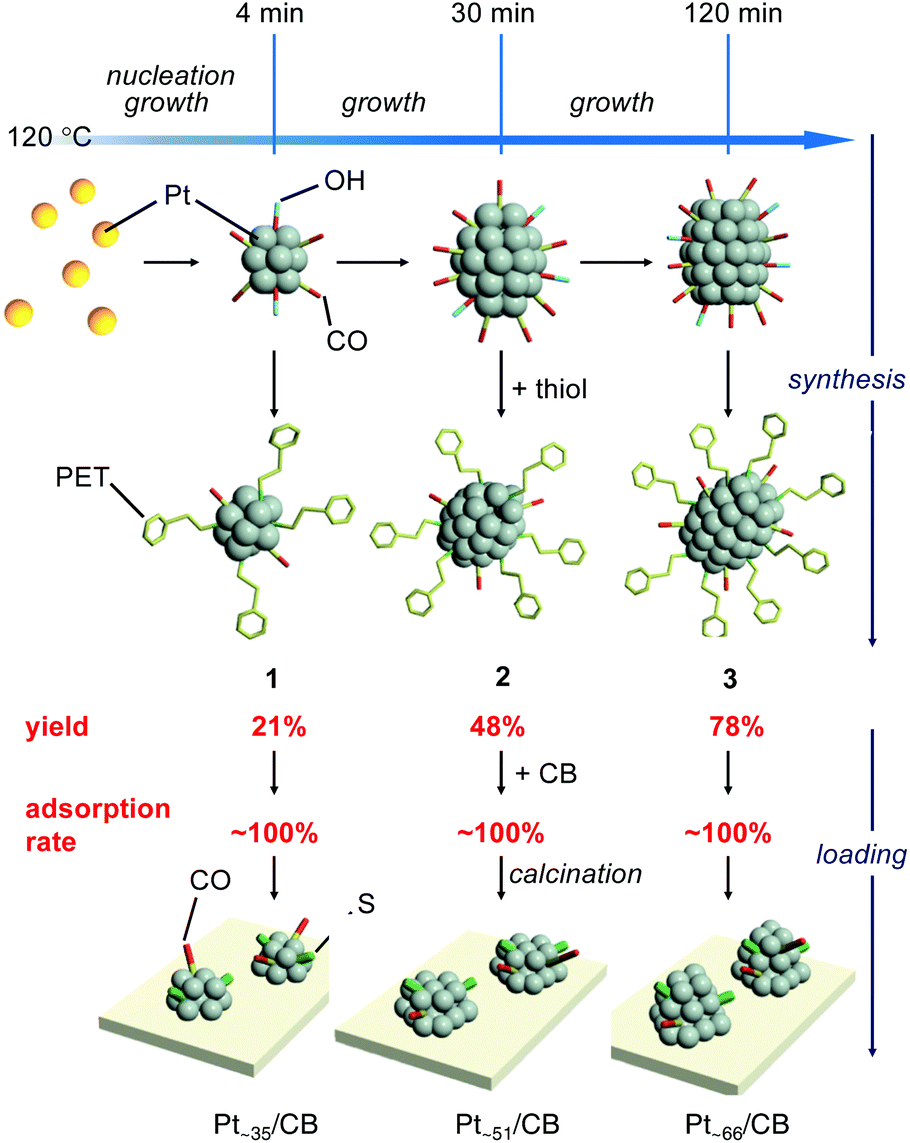 | ||
| Fig. 4 Proposed mechanism for the synthesis of 1–3 and the preparation of Pt∼35/CB, Pt∼51/CB, and Pt∼66/CB in the case of loading with 1.0 wt% Pt. | ||
Loading of Ptn on CB support
In PEFCs, PtNP/CB is used as a catalyst (Fig. S1†)1 for ORR.5–9 In this study, the obtained Pt NCs were loaded onto CB supports to clarify the ORR activity of ∼1 nm Pt NCs under conditions close to those of practical catalysts.First, 1–3 was adsorbed onto CB by adding CB to the toluene solution in which 1–3 was dissolved (Fig. 1b). Inductively coupled plasma mass spectrometry confirmed that all of the 1–3 material was adsorbed onto the CB with an almost 100% adsorption rate when mixed at a weight ratio of 1.0 wt% Pt (Table S6†). The CB includes 6-membered carbon rings in the framework structure;48 thus, a π–π interaction was expected to occur between these functional groups and the phenyl group of PET. In addition, CB also contains hydroxyl groups and carboxyl groups;48 thus, hydrogen bonds were expected to form between these polar functional groups and CO. It can be interpreted that 1–3 was adsorbed on the CB with a high adsorption rate when mixed at a weight ratio of 1.0 wt% Pt because of these two interactions. However, the presence of the NC ligand generally hinders the approach of the reactants and induces a change of the charge state of NCs, which often leads to a decrease of the catalytic activity.49–52 Thus, most of the ligands were removed from 1–3 by heating the obtained sample in an electric furnace under reduced pressure at 200 °C (Pt∼35/CB, Pt∼51/CB, and Pt∼66/CB; Fig. 1b).
TEM images of the samples adsorbed by 1–3 reveal that there was almost no aggregation of 1–3 on CB during adsorption (Fig. S15†). Fig. 5a and b presents TEM and HAADF-STEM images (Fig. S16 and S17†) of Pt∼35/CB, Pt∼51/CB, and Pt∼66/CB prepared by calcination at 200 °C, respectively. From the histogram (Fig. 5b) obtained from the HAADF-STEM image, Pt NCs with particle sizes of 1.1 ± 0.2, 1.2 ± 0.2, and 1.4 ± 0.3 nm were found to be supported for Pt∼35/CB, Pt∼51/CB, and Pt∼66/CB, respectively. These particle sizes are slightly larger than those of 1–3 (Fig. 2b). It is presumed that 1–3 have a metal core with spherical structure, whereas the Pt NCs in Pt∼35/CB, Pt∼51/CB, and Pt∼66/CB have a hemispherical structure.53 This difference in geometrical structure appears to lead to the slight increase in particle size by calcination. These results indicate that the Pt NCs barely aggregated on the CB even when the sample was calcined at 200 °C under reduced pressure. However, some aggregation of Pt NCs was observed when the sample was calcined at higher temperatures (250 and 300 °C) (Fig. S18†). Based on the TGA curve shown in Fig. 3b, it is presumed that some ligands remained on the surfaces of Pt NC after calcination at 200 °C (Fig. S16 and S17†). It can be considered that the aggregation of Pt NCs was significantly suppressed during the calcination at 200 °C, probably due to such remaining ligands.
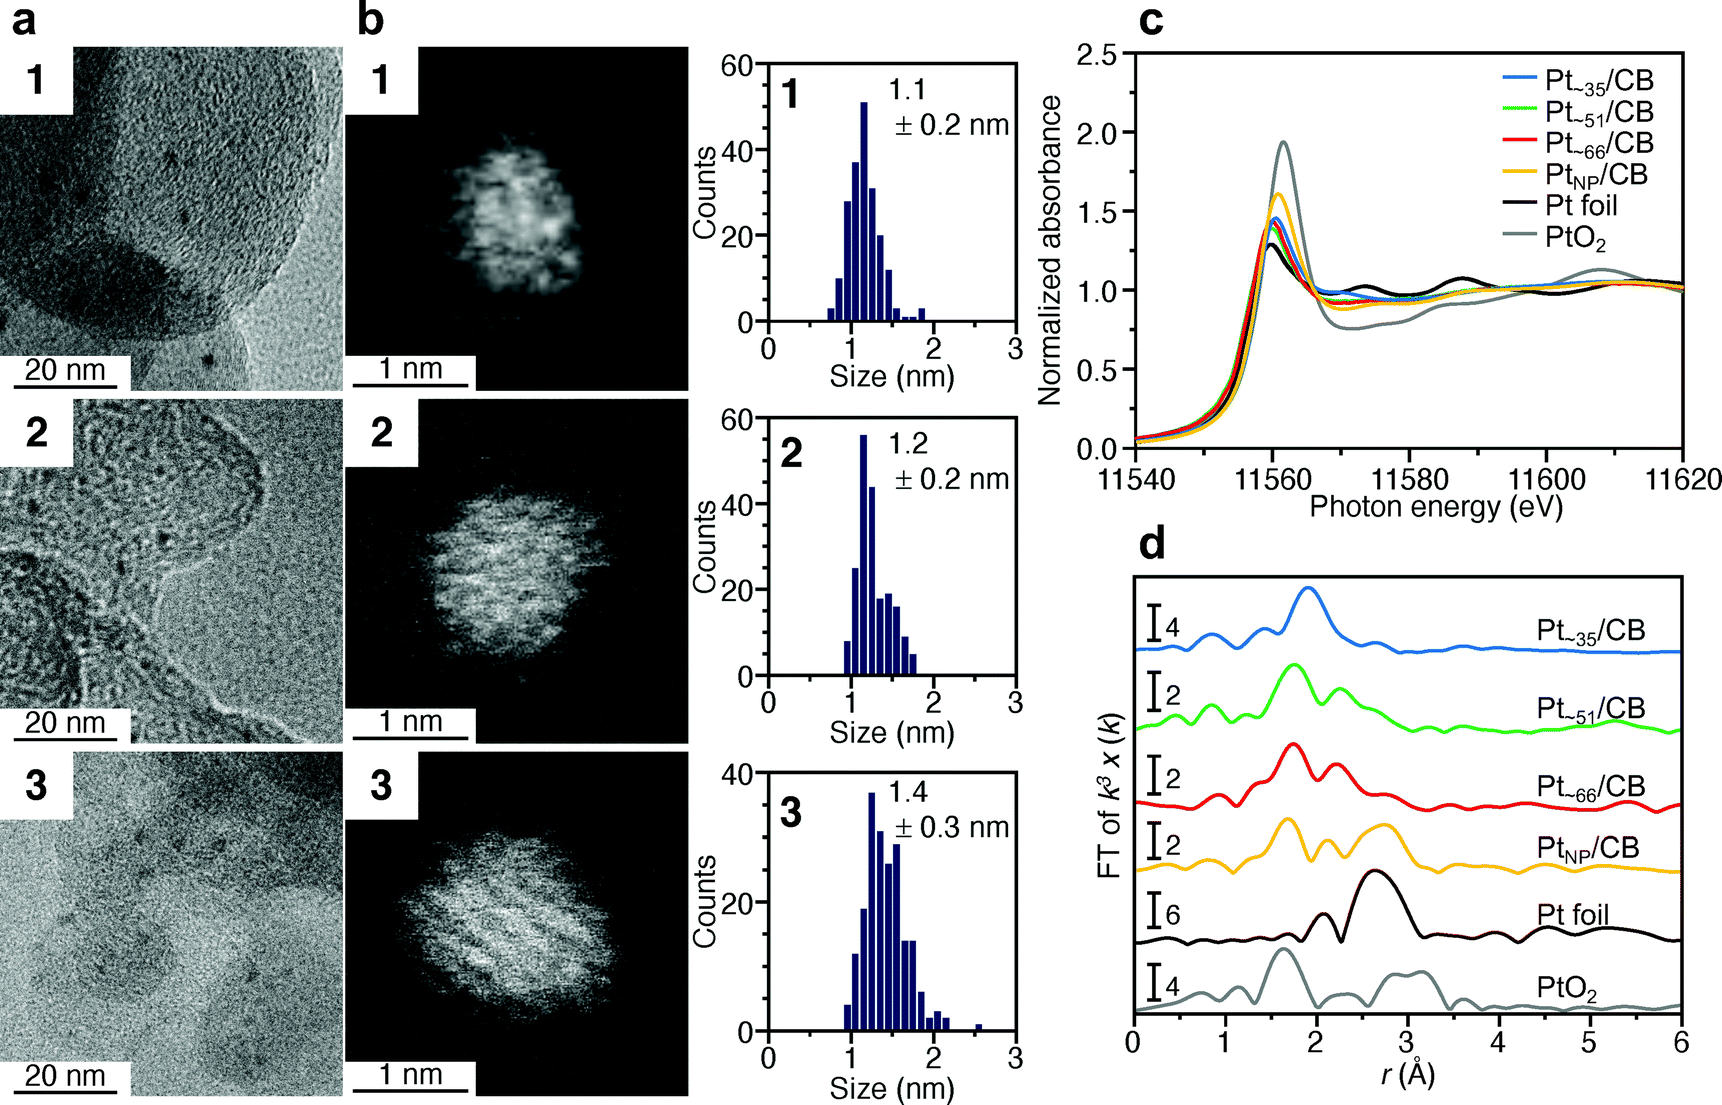 | ||
| Fig. 5 Characterization of Pt∼35/CB, Pt∼51/CB, and Pt∼66/CB. (a) TEM images, (b) HAADF-STEM images and resulting histograms of particle-size distribution, (c) Pt L3-edge XANES spectra, and (d) Pt L3-edge FT-EXAFS spectra. In (c) and (d), Pt L3-edge FT-EXAFS spectra of Pt foil and PtO2 are also shown for comparison. In (d), the peak at ∼2.3 Å in the spectrum of Pt foil is attributed to the satellite peak of the Pt–Pt bond. | ||
We investigated the charge state of the supported Pt NCs using XANES analysis. Fig. 5c presents the Pt L3-edge XANES spectra of Pt∼35/CB, Pt∼51/CB, and Pt∼66/CB. The intensities of the adsorption edge (white line) in Pt∼35/CB, Pt∼51/CB, and Pt∼66/CB are slightly higher than those of 1–3 (Fig. 2c). This result indicates that the Pt NCs in Pt∼35/CB, Pt∼51/CB, and Pt∼66/CB were a little more oxidized than the Pt NCs in 1–3. However, upon comparison with the charge state of commercial PtNP/CB (TEM image is shown in Fig. S19†), Pt in Ptn/CB is more metallic than Pt in PtNP/CB (Fig. 5c). Considering the peak intensity of PtNP/CB, the surface Pt atoms in commercial PtNP/CB are considered to be a slightly oxidized. On the other hand, in Pt∼35/CB, Pt∼51/CB, and Pt∼66/CB, some of the ligands remain on the surface of the Ptn/CB prepared in this study, as mentioned above, which seems to suppress the oxidation of Pt in Ptn/CB.
Fig. 5d presents the Pt L3-edge FT-EXAFS spectra of Pt∼35/CB, Pt∼51/CB, and Pt∼66/CB. In the spectrum of each sample, a peak appeared at the position attributable to Pt–S (1.7–2.0 Å).54 This result strongly supports the above interpretation that some of the ligands remain in Ptn/CB. The peak observed at 1.5–1.7 Å (Pt–O or Pt–C) is thought to be associated with the formation of Pt–C bonds between Pt NCs and CB and/or small amounts of residual CO.54 In all the spectra, the peak from the Pt–Pt bond (2.2–3.0 Å)54 was observed at low intensity. It is expected that a variation in the geometrical structure (i.e. different morphologies) of the supported metal NCs exists even if the number of Pt atoms is well controlled. Indeed, particles with various shapes were observed in the HAADF-STEM images (Fig. S20–S22†). This seems to be the reason why the peaks attributable to Pt–Pt bonds were not clearly observed for Pt∼35/CB, Pt∼51/CB, and Pt∼66/CB.
In this way, we succeeded in adsorbing 1–3 onto the CB with a high adsorption rate with almost the same size that they were prepared in solution.
ORR activity of Ptn NCs/CB
The ORR activity5–8,55–57 was examined for the obtained Pt∼35/CB, Pt∼51/CB, and Pt∼66/CB to clarify the activity under conditions as close as possible to those of a practical material. The activity was examined in the presence of Nafion® (solid polymer membrane; Fig. S1 and S23†). Before the measurement, cyclic voltammetry (CV) was repeated 100 times in a nitrogen (N2) atmosphere to clean the electrodes (Fig. S24 and S25†). It is expected that a part of the residual ligands were removed by this operation.58,59In the CV curves of Ptn/CB after the cleaning operation, a peak was observed at a position attributed to hydrogen adsorption (Fig. S26†).60 The electrochemically active area (ECSA)60,61 at each Ptn NCs/CB was estimated based on the peaks in the range of 0.03–0.3 V (vs. reversible hydrogen electrode; RHE). The top of Fig. 6 shows the ECSA of Pt∼35/CB, Pt∼51/CB, and Pt∼66/CB. The ECSA of each catalyst was estimated to be 97.2, 110.9, and 85.6 m2 gPt−1, respectively, which are larger than the ECSA of commercial PtNP/CB (65.5 m2 gPt−1; Fig. S27†); the ECSAs of Pt∼35/CB, Pt∼51/CB, and Pt∼66/CB are 1.48, 1.69, and 1.31 times higher than that of PtNP/CB, respectively. It can be interpreted that Ptn/CB showed a larger ECSA because the ratio of surface atoms increased with decreasing particle size of the NCs. Interestingly, among the three catalysts, Pt∼51/CB showed the highest ECSA. This finding suggests that Pt∼51/CB has a geometrical structure containing a large number of Pt atoms that are easily adsorbed by protons, although we could not confirm such a geometrical structure only from HAADF-STEM images (Fig. S21†).
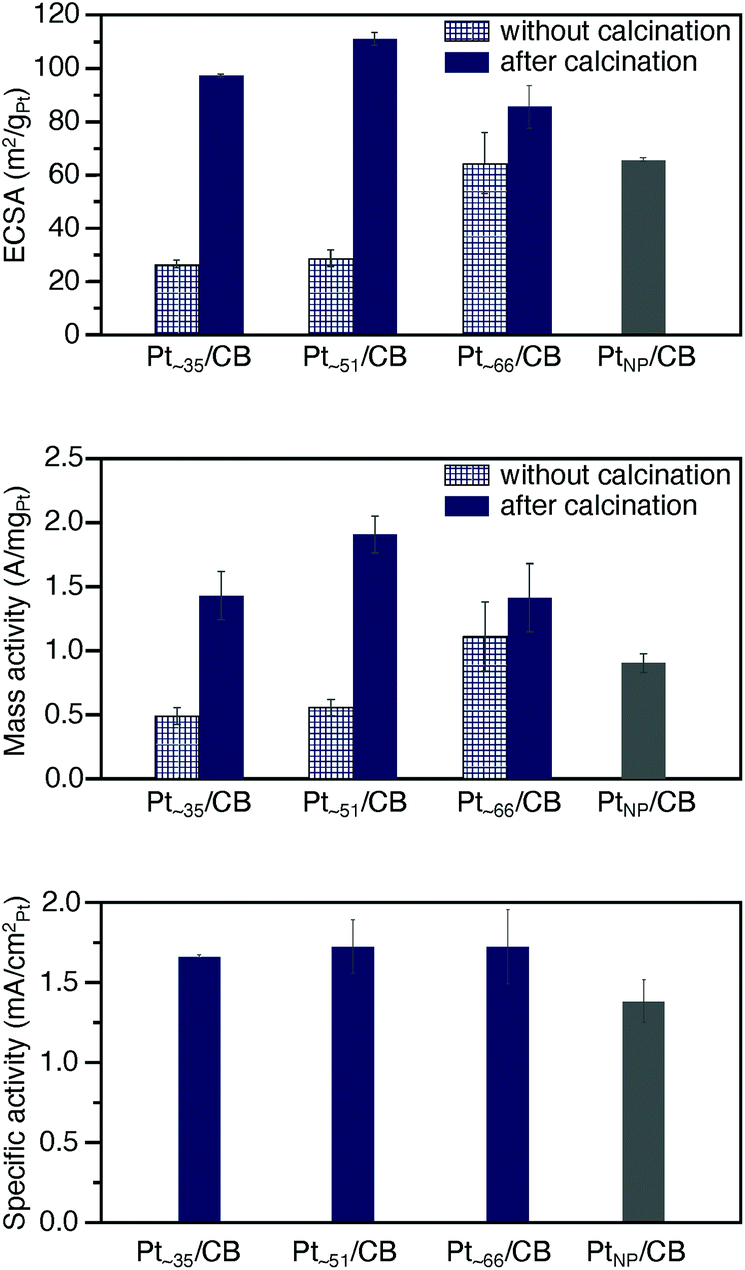 | ||
| Fig. 6 Results of ORR catalytic activity. Comparison of (top) ECSA, (middle) ORR mass activity at 0.6 V vs. RHE, and (bottom) ORR specific activity for Pt∼34/CB, Pt∼51/CB, Pt∼66/CB, and commercial PtNP/CB. For ECSA and ORR mass activity, the results obtained for Pt∼34/CB, Pt∼51/CB, and Pt∼66/CB without calcination are also shown. In the calculation of ECSA, the value of 210 μC cm−2 observed for Pt(111) was used as the electrical charge associated with the monolayer adsorption of hydrogen on Pt. The ORR mass activity of each catalyst was compared using the current at 0.6 V in this study, since the loading amount of Pt was reduced to 1 wt% Pt to avoid the aggregation of the Pt NCs, resulting in little current at a potential of 0.9 V, the current at which is often used for the comparison of mass activity. In these figures, the average values, obtained by performing the experiments 3 times, are presented. | ||
Then, we performed linear sweep voltammetry (LSV; Fig. S28†) and thereby obtained Koutecky–Levich plot62 (Fig. S29†). The result confirmed that 4-electron reduction (Fig. S2a†) occurred in these catalysts (Table S7†). In addition, the value of the kinetically limited current was calculated from the Koutecky–Levich equation, and the mass activity was estimated from this value. Middle of Fig. 6 shows the estimated mass activity for each catalyst. The mass activities of Pt∼35/CB, Pt∼51/CB, and Pt∼66/CB were 1.43, 1.91, and 1.41 A mgPt−1, respectively. These mass activities are 1.6, 2.1, and 1.6 times higher than that of commercial PtNP/CB (0.90 A mgPt−1; Fig. S30†). This result indicates that the reduction of Pt particle size down to ∼1 nm induces an increase in mass activity.
Bottom of Fig. 6 shows the specific activity estimated for each catalyst. The specific activities of Pt∼35/CB, Pt∼51/CB, and Pt∼66/CB were 1.67, 1.73, and 1.72 mA cmPt−2, respectively, which are larger than that of commercial PtNP/CB (1.38 mA cmPt−2). Previous studies reported the following results for the specific activity of Pt catalysts. (1) When the particle size of the Pt catalyst is reduced to 2 nm or less, a rise of the d-band center is induced,63 and the ratio of the surface Pt atoms increases.64 These changes strengthen the bond between Pt and O, leading to a decrease of the specific activity of the Pt catalyst.63,64 (2) High activity is induced when Pt atoms with the generalized coordination number (GCN) of 7.7–8.3 exist in the Pt NCs.65,66 Here, GCN is the coordination number calculated by taking into account the second-nearest-neighbor atoms in addition to the nearest-neighbor atoms, and Pt atoms with GCN of 7.7–8.3 are generated when the concave cavity is generated at the surface.65,66 It can be considered that Ptn NCs/CB showed a larger specific activity than the commercial PtNP/CB because the latter effect was greater in the Ptn/CB prepared in this study. In addition, the enriched electron state of Ptn/CB (Fig. 5c) would also contribute to their larger specific activities.
Based on the above results, Ptn/CB is considered to exhibit higher ORR mass activity than commercial PtNP/CB because both the ECSA and specific activity are higher in Ptn/CB than in commercial PtNP/CB. In addition, Pt∼51/CB is considered to show the highest ORR mass activity because the surface atom ratio is highest in Pt∼51/CB among the three Ptn/CB. Overall, the results obtained in this study are consistent with the results recently reported by other groups:9,14 the density functional theory (DFT) calculation in ref. 9 predicted that Pt NCs with particle size of 1.0 ± 0.1 nm exhibit 1.5 times higher mass activity than Pt NPs with particle sizes of 2–4 nm, and the DFT calculation in ref. 14 predicted that Pt NCs with a particle size of 1.1 ± 0.17 nm exhibit 2.36 times higher mass activity than commercial PtNP/CB. Although our results described above were obtained at a loading amount of 1.0 wt% Pt to suppress the aggregation of Ptn NCs, similar results were also obtained at a loading amount of ∼5 wt% Pt (Table S6, Fig. S31 and S32†).
We also examined the durability of Ptn/CB (Fig. S33 and S34†). Fig. 7 shows the ECSA values obtained after the aging test for Pt∼51/CB, which exhibited the highest mass activity, and commercial PtNP/CB. For the commercial PtNP/CB, 45000 CV rotations were required before the value of ECSA fell below 50% of the initial value. Similarly, the ECSA of Pt∼51/CB also fell below 50% of the initial value after 45000 CV rotations. These results indicate that the durability of Pt∼51/CB is similar to that of commercial PtNP/CB; that is, its level of durability allows its use as a practical material. According to Fig. 7, the ECSA of Pt∼51/CB after ∼35000 CV rotations was the same as that of the fresh PtNP/CB. Similar high durability was also observed for Pt∼66/CB (Fig. S35†).
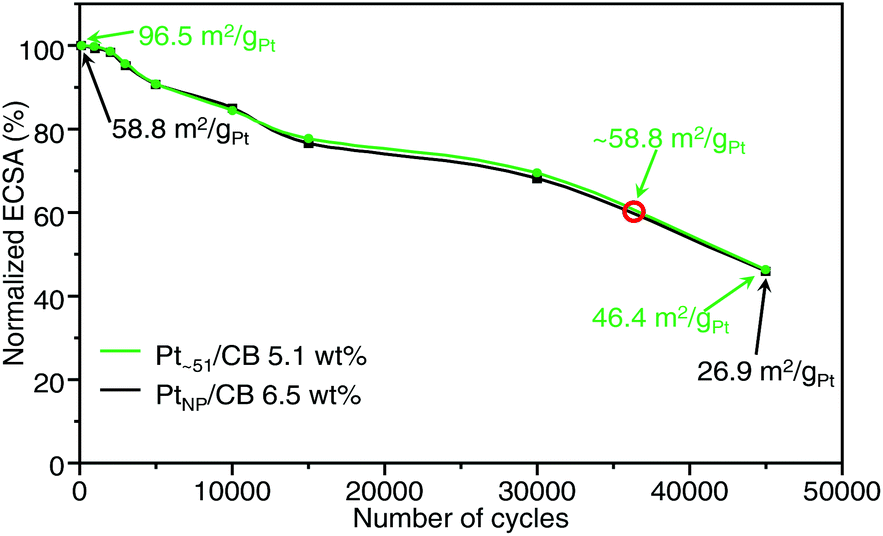 | ||
| Fig. 7 Normalized ECSA of Pt∼51/CB and commercial PtNP/CB during accelerated durability test. This figure was obtained by plotting the normalised ECSA against the number of cycles. In this experiment, Pt∼51/CB with a high loading of 5.1 wt% Pt (green) was used and compared with PtNP/CB with 6.5 wt% Pt (black), as a large difference in loading weight may affect the durability of the catalysts. The red circle indicates the position where the ECSA of Pt∼51/CB is expected to coincide with that of the fresh PtNP/CB (58.8 m2 gPt−1). | ||
Finally, we discuss the necessity of calcination for preparation of the catalyst. In this study, to suppress the aggregation of Pt NCs on CB, some ligands were left on the surface of the Pt NCs (Fig. 1b). Because such Ptn/CB exhibited high ORR mass activity, one may question the necessity of the calcination for preparing the active catalyst. To verify its necessity, we also measured the ECSA and ORR mass activity of the samples before calcination. All the uncalcined samples exhibited lower ECSA and ORR mass activity than the Ptn/CB obtained by calcination at 200 °C (top and middle of Fig. 6). These results indicate that the partial removal of ligands by the calcination at moderate temperature (pre-treatment) is very important to obtain highly active and stable Ptn/CB catalysts. However, it has been known that CO also works as a poison in Pt catalysis. Thus, in future, it is expected that the calcination condition to eliminate all CO while leaving a little quantity of S would be found and thereby the creation of further highly active Ptn/CB catalysts could be achieved.
Conclusions
In this study, we attempted to establish a method to simultaneously realize “simple operation in air”, “narrow distribution in the number of constituent atoms”, and “high yield of products” for the synthesis of ∼1 nm Pt NCs and prepared ORR catalysts using the obtained ligand-protected Pt NCs. The results are summarized as follows:(1) We succeeded in establishing a size-selective and systematic synthesis method for a series of ∼1 nm Pt NCs with a distribution of only ±∼4 Pt atoms. This method enabled us to obtain Pt∼35, Pt∼51, and Pt∼66 in relatively high yields of 21.6%, 48.4%, and 78.4%, respectively.
(2) We succeeded in adsorbing Pt∼35, Pt∼51, and Pt∼66 onto CB with high adsorption rates, and loading them onto CB whilst maintaining the NC size.
(3) The ORR mass activities of the obtained Pt∼35/CB, Pt∼51/CB, and Pt∼66/CB were determined to be 1.6, 2.1, and 1.6 times higher than that of commercial PtNP/CB catalyst, respectively.
(4) We elucidated that Ptn/CB exhibits higher ORR mass activity than commercial PtNP/CB as both the ECSA and specific activity increase in Ptn/CB.
(5) Pt∼51/CB and Pt∼66/CB exhibited high durability comparable to that of commercial PtNP/CB.
(6) We elucidated that partial removal of the ligand by calcination at moderate temperature is very important to obtain highly active and stable Ptn/CB.
These results are expected to advance design guidelines for the creation of highly functional ORR catalysts and therefore improvement of PEFCs. In the future, it is expected that the loading amount of Pt will be improved by including a ligand that more readily adsorbs onto CB.53
Author contributions
T. K. and Y. N. conceived the research and designed the experiments. T. K. and N. S. designed the synthesis and electrocatalytic test. N.S., K. F. and Y. M. performed the synthesis, characterization, and electrocatalytic activity. T. K., S. K. and S. Y. performed the XAFS measurements. D. O and G. M. performed the HAADF-STEM and EDS elemental mapping. T. K., N. S., S. H. and Y. N. wrote the manuscript.Conflicts of interest
There are no conflicts to declare.Acknowledgements
We thank Dr Jun Hirayama (Kyoto University) and Atsuya Harasawa (Tokyo University of Science) for technical assistance. This work was supported by the Japan Society for the Promotion of Science (JSPS) KAKENHI (grant number JP16H04099, 16K21402, 20H02698, 20H02552), Scientific Research on Innovative Areas “Coordination Asymmetry” (grant number 17H05385 and 19H04595), and Scientific Research on Innovative Areas “Innovations for Light-Energy Conversion” (grant number 18H05178 and 20H05115). Funding from JST A-STEP (grant number JPMJTM20MS), Nissanken, the Yashima Environment Technology Foundation, the Yazaki Memorial Foundation for Science and Technology, TEPCO Memorial Foundation Research Grant (Basic Research), and the Kato Foundation for Promotion of Science (grant number KJ-2904) is gratefully acknowledged. The authors acknowledge also the instruments and scientific and technical assistance of Ashley Slattery and Microscopy Australia at Adelaide Microscopy, The University of Adelaide.Notes and references
- R. Borup, J. Meyers, B. Pivovar, Y. S. Kim, R. Mukundan, N. Garland, D. Myers, M. Wilson, F. Garzon, D. Wood, P. Zelenay, K. More, K. Stroh, T. Zawodzinski, J. Boncella, J. E. McGrath, M. Inaba, K. Miyatake, M. Hori, K. Ota, Z. Ogumi, S. Miyata, A. Nishikata, Z. Siroma, Y. Uchimoto, K. Yasuda, K.-i. Kimijima and N. Iwashita, Chem. Rev., 2007, 107, 3904–3951 CrossRef CAS PubMed.
- L. Dai, Y. Xue, L. Qu, H.-J. Choi and J.-B. Baek, Chem. Rev., 2015, 115, 4823–4892 CrossRef CAS.
- Z. Liu, Z. Li, G. Li, Z. Wang, C. Lai, X. Wang, E. A. Pidko, C. Xiao, F. Wang, G. Li and X. Yang, J. Phys. Chem. Lett., 2020, 11, 5987–5991 CrossRef CAS PubMed.
- C. Liu, G. Li, D. R. Kauffman, G. Pang and R. Jin, J. Colloid Interface Sci., 2014, 423, 123–128 CrossRef CAS PubMed.
- T. Imaoka, H. Kitazawa, W.-J. Chun, S. Omura, K. Albrecht and K. Yamamoto, J. Am. Chem. Soc., 2013, 135, 13089–13095 CrossRef CAS PubMed.
- T. Imaoka, H. Kitazawa, W.-J. Chun and K. Yamamoto, Angew. Chem., Int. Ed., 2015, 54, 9810–9815 CrossRef CAS PubMed.
- H. Tsunoyama, A. Ohnuma, K. Takahashi, A. Velloth, M. Ehara, N. Ichikuni, M. Tabuchi and A. Nakajima, Chem. Commun., 2019, 55, 12603–12606 RSC.
- M. Nesselberger, M. Roefzaad, R. F. Hamou, P. U. Biedermann, F. F. Schweinberger, S. Kunz, K. Schloegl, G. K. H. Wiberg, S. Ashton, U. Heiz, K. J. J. Mayrhofer and M. Arenz, Nat. Mater., 2013, 12, 919–924 CrossRef CAS PubMed.
- M. Rück, A. Bandarenka, F. Calle-Vallejo and A. Gagliardi, J. Phys. Chem. Lett., 2018, 9, 4463–4468 CrossRef PubMed.
- F. Calle-Vallejo, M. D. Pohl, D. Reinisch, D. Loffreda, P. Sautet and A. S. Bandarenka, Chem. Sci., 2017, 8, 2283–2289 RSC.
- A. von Weber and S. L. Anderson, Acc. Chem. Res., 2016, 49, 2632–2639 CrossRef CAS PubMed.
- U. Heiz, A. Sanchez, S. Abbet and W.-D. Schneider, J. Am. Chem. Soc., 1999, 121, 3214–3217 CrossRef CAS.
- I. Ciabatti, C. Femoni, M. C. Iapalucci, S. Ruggieri and S. Zacchini, Coord. Chem. Rev., 2018, 355, 27–38 CrossRef CAS.
- B. Garlyyev, K. Kratzl, M. Rück, J. Michalička, J. Fichtner, J. M. Macak, T. Kratky, S. Günther, M. Cokoja, A. S. Bandarenka, A. Gagliardi and R. A. Fischer, Angew. Chem., Int. Ed., 2019, 58, 9596–9600 CrossRef CAS PubMed.
- X. Hao, L. Quach, J. Korah, W. A. Spieker and J. R. Regalbuto, J. Mol. Catal. A: Chem., 2004, 219, 97–107 CrossRef CAS.
- L. V. Nair, S. Hossain, S. Wakayama, S. Takagi, M. Yoshioka, J. Maekawa, A. Harasawa, B. Kumar, Y. Niihori, W. Kurashige and Y. Negishi, J. Phys. Chem. C, 2017, 121, 11002–11009 CrossRef CAS.
- Y. Negishi, N. Shimizu, K. Funai, R. Kaneko, K. Wakamatsu, A. Harasawa, S. Hossain, M. E. Schuster, D. Ozkaya, W. Kurashige, T. Kawawaki, S. Yamazoe and S. Nagaoka, Nanoscale Adv., 2020, 2, 669–678 RSC.
- H. Dong, Y.-C. Chen and C. Feldmann, Green Chem., 2015, 17, 4107–4132 RSC.
- F. Fievet, J. P. Lagier and M. Figlarz, MRS Bull., 1989, 14, 29–34 CrossRef CAS.
- C. Bock, C. Paquet, M. Couillard, G. A. Botton and B. R. MacDougall, J. Am. Chem. Soc., 2004, 126, 8028–8037 CrossRef CAS PubMed.
- Y. Wang, J. Ren, K. Deng, L. Gui and Y. Tang, Chem. Mater., 2000, 12, 1622–1627 CrossRef CAS.
- B.-J. Hwang, L. S. Sarma, C.-H. Chen, C. Bock, F.-J. Lai, S.-H. Chang, S.-C. Yen, D.-G. Liu, H.-S. Sheu and J.-F. Lee, J. Phys. Chem. C, 2008, 112, 19922–19929 CrossRef CAS.
- I. Schrader, J. Warneke, S. Neumann, S. Grotheer, A. A. Swane, J. J. K. Kirkensgaard, M. Arenz and S. Kunz, J. Phys. Chem. C, 2015, 119, 17655–17661 CrossRef CAS.
- R. J. Arnold and J. P. Reilly, J. Am. Chem. Soc., 1998, 120, 1528–1532 CrossRef CAS.
- T. G. Schaaff and R. L. Whetten, J. Phys. Chem. B, 1999, 103, 9394–9396 CrossRef CAS.
- T. G. Schaaff, M. N. Shafigullin, J. T. Khoury, I. Vezmar and R. L. Whetten, J. Phys. Chem. B, 2001, 105, 8785–8796 CrossRef CAS.
- D. R. Lide, CRC Handbook of Chemistry and Physics, CRC Press LLC, Florida, 84th edn, 2003 Search PubMed.
- M. Brust, M. Walker, D. Bethell, D. J. Schiffrin and R. Whyman, J. Chem. Soc., Chem. Commun., 1994, 801–802 RSC.
- I. Chakraborty and T. Pradeep, Chem. Rev., 2017, 117, 8208–8271 CrossRef CAS PubMed.
- R. Jin, G. Li, S. Sharma, Y. Li and X. Du, Chem. Rev., 2021, 121, 567–648 CrossRef CAS.
- Q. Yao, T. Chen, X. Yuan and J. Xie, Acc. Chem. Res., 2018, 51, 1338–1348 CrossRef CAS.
- M. Agrachev, M. Ruzzi, A. Venzo and F. Maran, Acc. Chem. Res., 2019, 52, 44–52 CrossRef CAS PubMed.
- B. Nieto-Ortega and T. Bürgi, Acc. Chem. Res., 2018, 51, 2811–2819 CrossRef CAS PubMed.
- N. A. Sakthivel and A. Dass, Acc. Chem. Res., 2018, 51, 1774–1783 CrossRef CAS PubMed.
- T. Tsukuda, Bull. Chem. Soc. Jpn., 2012, 85, 151–168 CrossRef CAS.
- Z. Gan, N. Xia and Z. Wu, Acc. Chem. Res., 2018, 51, 2774–2783 CrossRef CAS PubMed.
- S. Hossain, Y. Niihori, L. V. Nair, B. Kumar, W. Kurashige and Y. Negishi, Acc. Chem. Res., 2018, 51, 3114–3124 CrossRef CAS PubMed.
- H. Kawasaki, S. Kumar, G. Li, C. Zeng, D. R. Kauffman, J. Yoshimoto, Y. Iwasaki and R. Jin, Chem. Mater., 2014, 26, 2777–2788 CrossRef CAS.
- B. Kumar, T. Kawawaki, N. Shimizu, Y. Imai, D. Suzuki, S. Hossain, L. V. Nair and Y. Negishi, Nanoscale, 2020, 12, 9969–9979 RSC.
- O. Lopez-Acevedo, H. Tsunoyama, T. Tsukuda, H. Häkkinen and C. M. Aikens, J. Am. Chem. Soc., 2010, 132, 8210–8218 CrossRef CAS PubMed.
- S. Li, Y. Sun, C. Wu, W. Hu, W. Li, X. Liu, M. Chen and Y. Zhu, Chem. Commun., 2021, 57, 2176–2179 RSC.
- D. R. Kauffman, D. Alfonso, C. Matranga, H. Qian and R. Jin, J. Am. Chem. Soc., 2012, 134, 10237–10243 CrossRef CAS PubMed.
- S. E. Eklund and D. E. Cliffel, Langmuir, 2004, 20, 6012–6018 CrossRef CAS PubMed.
- K.-S. Kim, D. Demberelnyamba and H. Lee, Langmuir, 2004, 20, 556–560 CrossRef CAS PubMed.
- Y. Wang, Y. Zheng, C. Z. Huang and Y. Xia, J. Am. Chem. Soc., 2013, 135, 1941–1951 CrossRef CAS PubMed.
- Y. Shichibu, Y. Negishi, T. Tsukuda and T. Teranishi, J. Am. Chem. Soc., 2005, 127, 13464–13465 CrossRef CAS PubMed.
- X. Kang and M. Zhu, Chem. Mater., 2019, 31, 9939–9969 CrossRef CAS.
- D. Rivin, Rubber Chem. Technol., 1971, 44, 307–343 CrossRef CAS.
- W. Kurashige, R. Kumazawa, D. Ishii, R. Hayashi, Y. Niihori, S. Hossain, L. V. Nair, T. Takayama, A. Iwase, S. Yamazoe, T. Tsukuda, A. Kudo and Y. Negishi, J. Phys. Chem. C, 2018, 122, 13669–13681 CrossRef CAS.
- T. Yoskamtorn, S. Yamazoe, R. Takahata, J.-i. Nishigaki, A. Thivasasith, J. Limtrakul and T. Tsukuda, ACS Catal., 2014, 4, 3696–3700 CrossRef CAS.
- T. Kawawaki, Y. Kataoka, S. Ozaki, M. Kawachi, M. Hirata and Y. Negishi, Chem. Commun., 2021, 57, 417–440 RSC.
- B. Zhang, S. Kaziz, H. Li, M. G. Hevia, D. Wodka, C. Mazet, T. Bürgi and N. Barrabés, J. Phys. Chem. C, 2015, 119, 11193–11199 CrossRef CAS.
- W. Kurashige, R. Hayashi, K. Wakamatsu, Y. Kataoka, S. Hossain, A. Iwase, A. Kudo, S. Yamazoe and Y. Negishi, ACS Appl. Energy Mater., 2019, 2, 4175–4187 CrossRef CAS.
- T. Imaoka, Y. Akanuma, N. Haruta, S. Tsuchiya, K. Ishihara, T. Okayasu, W.-J. Chun, M. Takahashi and K. Yamamoto, Nat. Commun., 2017, 8, 688 CrossRef PubMed.
- Z. Peng and H. Yang, J. Am. Chem. Soc., 2009, 131, 7542–7543 CrossRef CAS PubMed.
- L. Wang, Z. Tang, W. Yan, H. Yang, Q. Wang and S. Chen, ACS Appl. Mater. Interfaces, 2016, 8, 20635–20641 CrossRef CAS PubMed.
- Y. Lu, Y. Jiang, X. Gao and W. Chen, Chem. Commun., 2014, 50, 8464–8467 RSC.
- L. Lu, S. Zou, Y. Zhou, J. Liu, R. Li, Z. Xu, L. Xiao and J. Fan, Catal. Sci. Technol., 2018, 8, 746–754 RSC.
- M. W. Breiter, Electrochim. Acta, 1966, 11, 905–909 CrossRef CAS.
- K. J. J. Mayrhofer, D. Strmcnik, B. B. Blizanac, V. Stamenkovic, M. Arenz and N. M. Markovic, Electrochim. Acta, 2008, 53, 3181–3188 CrossRef CAS.
- M. Li, Z. Zhao, T. Cheng, A. Fortunelli, C.-Y. Chen, R. Yu, Q. Zhang, L. Gu, B. V. Merinov, Z. Lin, E. Zhu, T. Yu, Q. Jia, J. Guo, L. Zhang, W. A. Goddard III, Y. Huang and X. Duan, Science, 2016, 354, 1414–1419 CrossRef CAS.
- N. M. Marković, H. A. Gasteiger, B. N. Grgur and P. N. Ross, J. Electroanal. Chem., 1999, 467, 157–163 CrossRef.
- E. Toyoda, R. Jinnouchi, T. Hatanaka, Y. Morimoto, K. Mitsuhara, A. Visikovskiy and Y. Kido, J. Phys. Chem. C, 2011, 115, 21236–21240 CrossRef CAS.
- M. Shao, A. Peles and K. Shoemaker, Nano Lett., 2011, 11, 3714–3719 CrossRef CAS PubMed.
- F. Calle-Vallejo, J. Tymoczko, V. Colic, Q. H. Vu, M. D. Pohl, K. Morgenstern, D. Loffreda, P. Sautet, W. Schuhmann and A. S. Bandarenka, Science, 2015, 350, 185–189 CrossRef CAS PubMed.
- B. Garlyyev, J. Fichtner, O. Piqué, O. Schneider, A. S. Bandarenka and F. Calle-Vallejo, Chem. Sci., 2019, 10, 8060–8075 RSC.
Footnotes |
| † Electronic supplementary information (ESI) available: Characterization, analysis, assignment of the peaks in FT-IR, additional results for HAADF-STEM, XPS, optical absorption spectroscopy, EXAFS, MALDI-MS, TG-MS, TEM, EDX elemental mapping, CV, LSV, Koutecky–Levich plot, and durability test. See DOI: 10.1039/d1nr04202e |
| ‡ These authors contributed equally. |
| This journal is © The Royal Society of Chemistry 2021 |