
Tracking the emergence of epitaxial metal–oxide interfaces from precursor alloys†
Yu
Wen
 ab,
Hideki
Abe
cd,
Kazutaka
Mitsuishi
a and
Ayako
Hashimoto
*abe
ab,
Hideki
Abe
cd,
Kazutaka
Mitsuishi
a and
Ayako
Hashimoto
*abe
aNational Institute for Materials Science, 1-2-1 Sengen, Tsukuba, Ibaraki 305-0047, Japan. E-mail: HASHIMOTO.Ayako@nims.go.jp
bGraduate School of Pure and Applied Sciences, University of Tsukuba, 1-1-1 Tennodai, Tsukuba, Ibaraki 305-8577, Japan
cCREST, JST, 4-1-8 Honcho, Kawaguchi, Saitama 332-0012, Japan
dGraduate School of Science and Technology, Saitama University, 255 Shimookubo, Saitama 338-8570, Japan
ePREST, JST, 4-1-8 Honcho, Kawaguchi, Saitama 332-0012, Japan
First published on 8th September 2021
Abstract
Heterointerfaces with an epitaxial relationship, self-assembled nanocomposites of Pt(111)/CeO2(111) 60°, were successfully formed by simple oxidation of Pt5Ce alloy. Oxygen dissolution into the alloy causes spacial periodic compositional perturbation by atomic segregation, specifically, by local diffusion of Pt and Ce atoms. A striped pattern of Pt and CeO2 with a 4–5 nm periodicity formed through phase transformation of the Pt-rich alloy and oxidation of the Ce-rich alloy, respectively. Notably, a fully epitaxial relationship between the Pt and CeO2 phases was observed even in the initial stage. With continued annealing, the crystals rotated into an energetically favorable orientation with respect to the remaining (111)Pt//(111)CeO2. The alloy oxidation and its resulting nanoscale phase-separation behavior were verified in an ex situ annealing experiment of an alloy specimen, which had been first thinned by a focused ion beam. Changing the oxygen partial pressure to the reaction interface may alter the orientation relationship between the hexagonal close-packed Pt5Ce structure and face-centered cubic Pt/CeO2 structure, thereby altering the growth direction of the separated phases. These findings present a pathway for the self-assembly of epitaxial Pt(111)/CeO2(111) interface and are expected to assist the structural design of metal–oxide nanocomposites.
1. Introduction
Owing to its facile reducibility, ceria (CeO2) is an attractive option for fuel cells and catalysts in exhaust-free vehicles.1–3 The reduction of two Ce4+ cations to Ce3+ provides an oxygen vacancy which plays crucial roles in ionic oxygen transportation4,5 and catalytic reactions.6,7 Doped ceria and cerium-based hybrids with rich oxygen defects are great photocatalysts for photo-thermal reactions.8–10 Furthermore, ceria is an important support or supported object of metal components in heterogeneous catalysis.11–13 Strong interactions at the metal–oxide interface enable more specific performances than mono-component counterparts.14 The interface effect between Pt and CeO2 has been widely studied because Pt/CeO2 catalysts are promising for water-gas shift reaction15 and low temperature CO oxidation.16,17 Theoretical studies18,19 have revealed that electron transfer from Pt to CeO2 and oxygen-vacancy formation at the interface contribute to the high catalytic activity of Pt/CeO2. Therefore, to achieve highly active of Pt/CeO2 catalysts, we require a rational design of the interfacial structure.To boost the catalytic activity, researchers have developed two strategies for enhancing interactions at the Pt–CeO2 interface. The first strategy tunes the exposed surface planes of the metal and ceria to match the oxygen vacancies density with the electronic perturbation, which typically lie in different orientations. As a model system, a Pt/CeO2 catalyst with an epitaxial interface on the (111) plane contains a relatively high Ce3+ concentration20 and facilitates charge transfer from CeO2 to Pt.21 The second strategy controls the configuration of Pt and CeO2 to increase the surface area of the interface and present more active reaction sites.22–24 Although the interface effect has been extensively engineered for fundamental study and commercial application, the preparation methods of controlled Pt/CeO2 catalysts, such as deposition-precipitation21,25 and electrodeposition,26,27 are generally complex and high-cost. However, the Pt5Ce surface alloy can be post-oxidization,28 suggesting that Pt/CeO2 composites with an epitaxial interface can be prepared by simple oxidation of arc-melted Pt5Ce alloy.29
Recently, oxidation of binary alloys has been considered as a possible route towards stable and active metal–oxide nanocomposites for catalysis.30,31 We previously showed that the morphology of the self-assembled Pt/CeO2 nanocomposites from Pt5Ce alloys can be controlled to tailor the oxygen ion conductivity.32 Moreover, various metal/oxide nanocomposites as catalysts (Ni/Nb2O5, Rh/Nb2O5, Ru/CeO2, etc.) having superior performances were prepared via the same alloy oxidation method.33–36 Therefore, by thoroughly understanding the oxidation process in the binary alloy, we could control the interface effect of their corresponding nanocomposites.
In the present work, we track the oxidation process of Pt5Ce alloy that leads to a self-assembled Pt/CeO2 heterostructure, whose framework is composed of polycrystalline Pt embedded by nanocrystalline CeO2 with epitaxial Pt(111)/CeO2(111) interface. Completely and partially oxidized samples were characterized at the atomic scale using combined high-resolution transmission electron microscopy (HRTEM) and atomic-resolution high-angle annular dark field scanning transmission electron microscopy (HAADF–STEM). The oxidation-induced phase-separation behavior was then elucidated, and the fully epitaxial relationship of Pt and CeO2 phases was derived from the atomic segregated alloy. The epitaxial type (111)Pt//(111)CeO2 60° was found at the final stage after crystal rotation. The nanoscale phase-separation behavior of the alloy was verified in an ex situ annealing experiment on a firstly-focused ion beam (FIB)-thinned alloy.
2. Experimental
2.1 Specimen preparation
Pt5Ce alloy was prepared by arc melting of the elemental metals in a pure argon atmosphere. Alloy powders with an average particle size of 50 μm were then obtained by grinding. The alloy precursor was transferred to a reactive gas furnace (containing mixed CO and O2 at a molecular ratio of 2![[thin space (1/6-em)]](https://www.rsc.org/images/entities/char_2009.gif) :1) for phase separation. The bulky powder alloys were first annealed for 30 min and 12 h to form partial and complete phase-separated structures, respectively. For the ex situ experiment, the firstly-FIB-thinned alloy specimen was prepared by FIB milling (JEOL-9420, Japan) of 30 keV Ga ions. The firstly-FIB-thinned specimen was annealed for only 10 min at 400 °C to observe its phase-separation behavior.
:1) for phase separation. The bulky powder alloys were first annealed for 30 min and 12 h to form partial and complete phase-separated structures, respectively. For the ex situ experiment, the firstly-FIB-thinned alloy specimen was prepared by FIB milling (JEOL-9420, Japan) of 30 keV Ga ions. The firstly-FIB-thinned specimen was annealed for only 10 min at 400 °C to observe its phase-separation behavior.
2.2 Transmission electron microscopy
The morphologies of the three kinds of specimens were investigated by a field emission microscope (JEOL JEM-2100F) operated at 200 kV. The atomic analyses (HRTEM and HAADF-STEM) and energy dispersive X-ray spectroscopy (EDS) mapping of specimens were carried out in a JEOL JEM-200ARMF equipped with double Cs-correctors and a Schottky-filed emission gun. To highlight the lattice fringes in the atomic HAADF-STEM images, the images were processed by a smooth–filter which is freely available as a plug-in for the DigitalMicrograph.37 The Fast Fourier transformation (FFT) patterns were also obtained using the DigitalMicrograph software package (Gatan, Pleasanton, CA). The lattice strain maps were calculated from HAADF-STEM images by a geometric phase analysis (GPA) plug-in.38 HAADF-STEM simulations were performed using the Dr. Probe software,39 implementing the multislice method to calculate the quasielastic forward scattering of the incident high-energy electron probes from the sample.3. Results and discussion
3.1 Epitaxial relationship in the self-assembled Pt/CeO2 nanocomposites
As reported in our previous work,32 phase-separation and self-assembly in oxidized Pt5Ce alloy leads to an interwoven structure of Pt and CeO2. Atomic STEM characterizations of the Pt/CeO2 nanocomposites annealed for 12 h at 400 °C are shown in Fig. 1. In the nanostructure, the bright-contrast phase of Pt alternated with the dark-contrast phase of CeO2 (Fig. 1(a)), as confirmed by the EDS mapping shown in Fig. S1.† The average periodicity of approximately 50 stripe structures was 4.6 nm (see histogram in Fig. S2(a)† for details). To clarify the orientation relationship between the Pt and CeO2 structures, the heterointerfaces between the two phases enclosed in boxes A and B in Fig. 1(a) are magnified in Fig. 1(b) and (c), respectively. As shown in Fig. 1(b), the Pt and CeO2 crystals were exactly on the [110] zone axis but the interface was incommensurate. The angle between the (200) planes of Pt and CeO2 was approximately 57° and the (1 −11)CeO2 and (11−1)Pt planes were almost parallel. Fig. 1(c) consolidates the parallel relationship between the (111) planes of Pt and CeO2 crystals on different zone axis. Due to the lattice misfit (∼38%), several edge dislocations were found at the heterointerface. However, the relationship was fully epitaxial along the direction of the [111] zone axis (see Fig. 1(d)). The brightest spots (connected by red triangles in Fig. 1(d)) were deduced as overlapped Pt and Ce atoms. More specifically, the calculated lattice-constant ratio between (111)CeO2 and (111)Pt was 1.38, between the verified lattice constant ratio of 4:3 and 7:5.40 The lower and upper parts of Fig. 1(e) present a structural model of the observed structure based on the calculated 4:3 CeO2/Pt model and a simulated HAADF–STEM image along the [111] direction, respectively. The simulation results confirm that the Pt and Ce atoms overlapped at the brightest projection spots (enclosed by the dashed red circles in the model). Integrating the relationships observed in Fig. 1(b)–(d), the lattice-matching relationship between Pt and CeO2 that maintains (111)Pt//(111)CeO2 is a certain angle of rotation. From Fig. 1(d), the rotation angle was deduced as 60°, that is, the orientation relationship between Pt and CeO2 is Pt(111)//CeO2(111) 60°. This kind of rotated epitaxial relationship was already reported in thin-layers of Rh/CeO241, MoS2/S,42,43etc., but firstly found in Pt/CeO2 composites here. Owing to the sixfold symmetry axis of (111) planes, a 60° rotation of (111)Pt plane parallel to a (111)CeO2 plane retains the epitaxial relationship, but other planes are crystallographically non-equivalent. Fig. 1(f) illustrates the side view along [01–1] direction of the structure model in Fig. 1(e). The atomic arrangement between Pt and CeO2 matches that of Fig. 1(b). Since the fully epitaxial Pt(111)/CeO2(111) and the epitaxial type of Pt(111)/CeO2(111) 60° are much similar in the atomic arrangement at the metal-oxide interface perimeter that plays a central role in catalysis, no prominent difference would be expected on the performance.
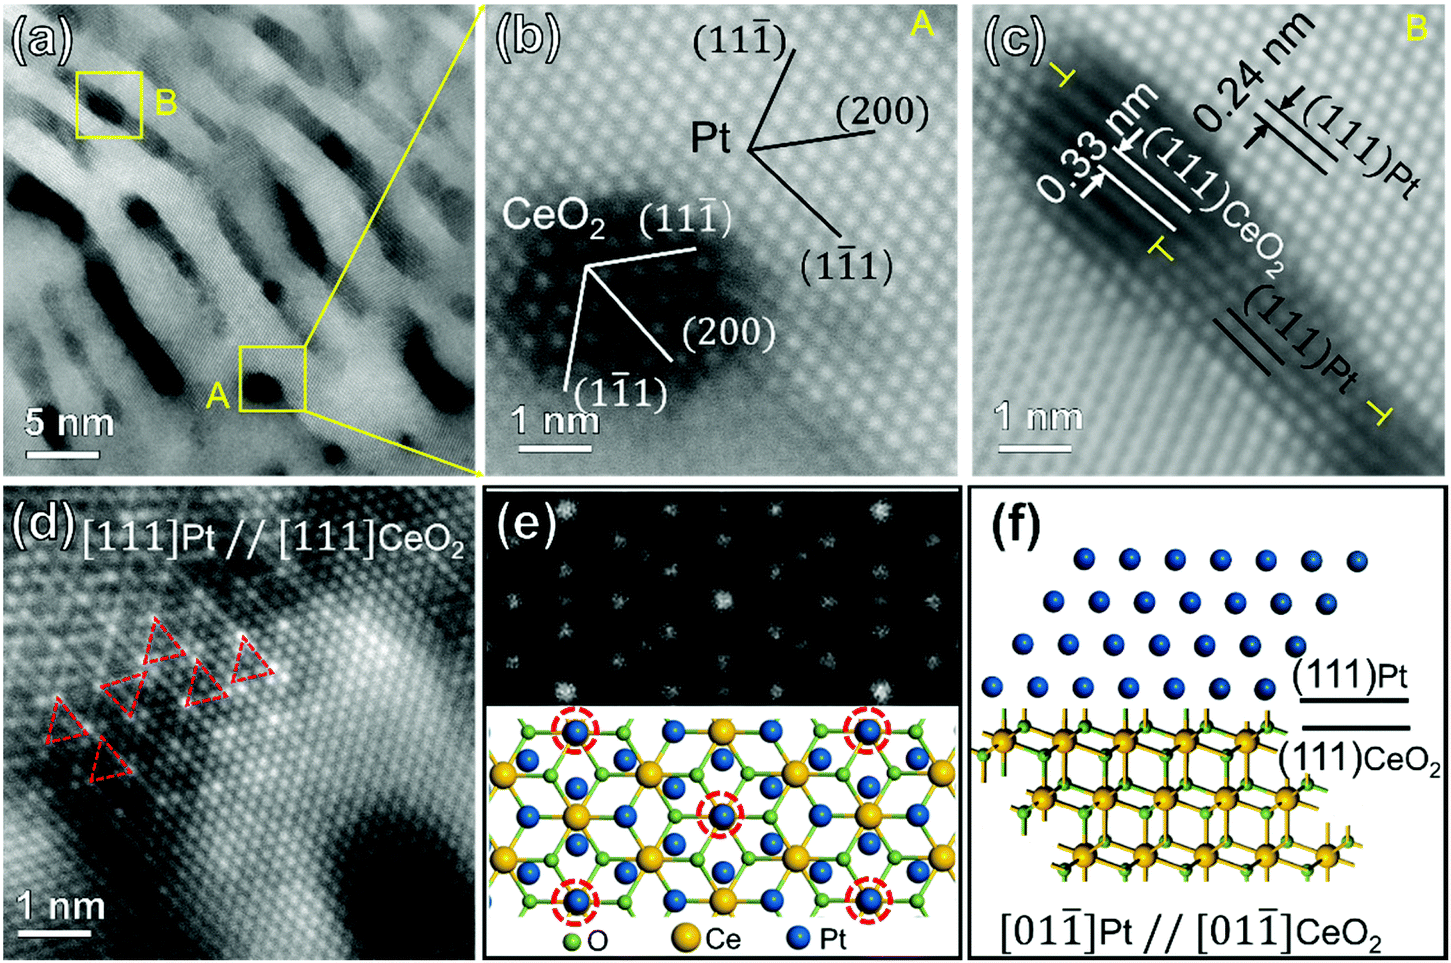 | ||
| Fig. 1 (a) HAADF–STEM image of the Pt5Ce bulk sample annealed at 400 °C for 12 h showing the completely separated Pt/CeO2 composites. (b and c) Enlarged filtered HAADF–STEM images of the boxes in (a), indicating the incoherent relationship between Pt and CeO2. (d) HAADF–STEM image of another site on the same sample showing the epitaxial relationship in the [111] zone axis. (e) Schematic of the 4:3 lattice structure of (111)CeO2 on (111)Pt (top view) and the corresponding simulated HAADF–STEM image, revealing that the bright spots connected by red dashed triangles in (d) are produced by overlapped Pt and Ce atoms. (f) Side view along the [01−1] direction of the Pt/CeO2 epitaxial interface, which has a 60° rotational relation with (111)Pt//(111)CeO2. | ||
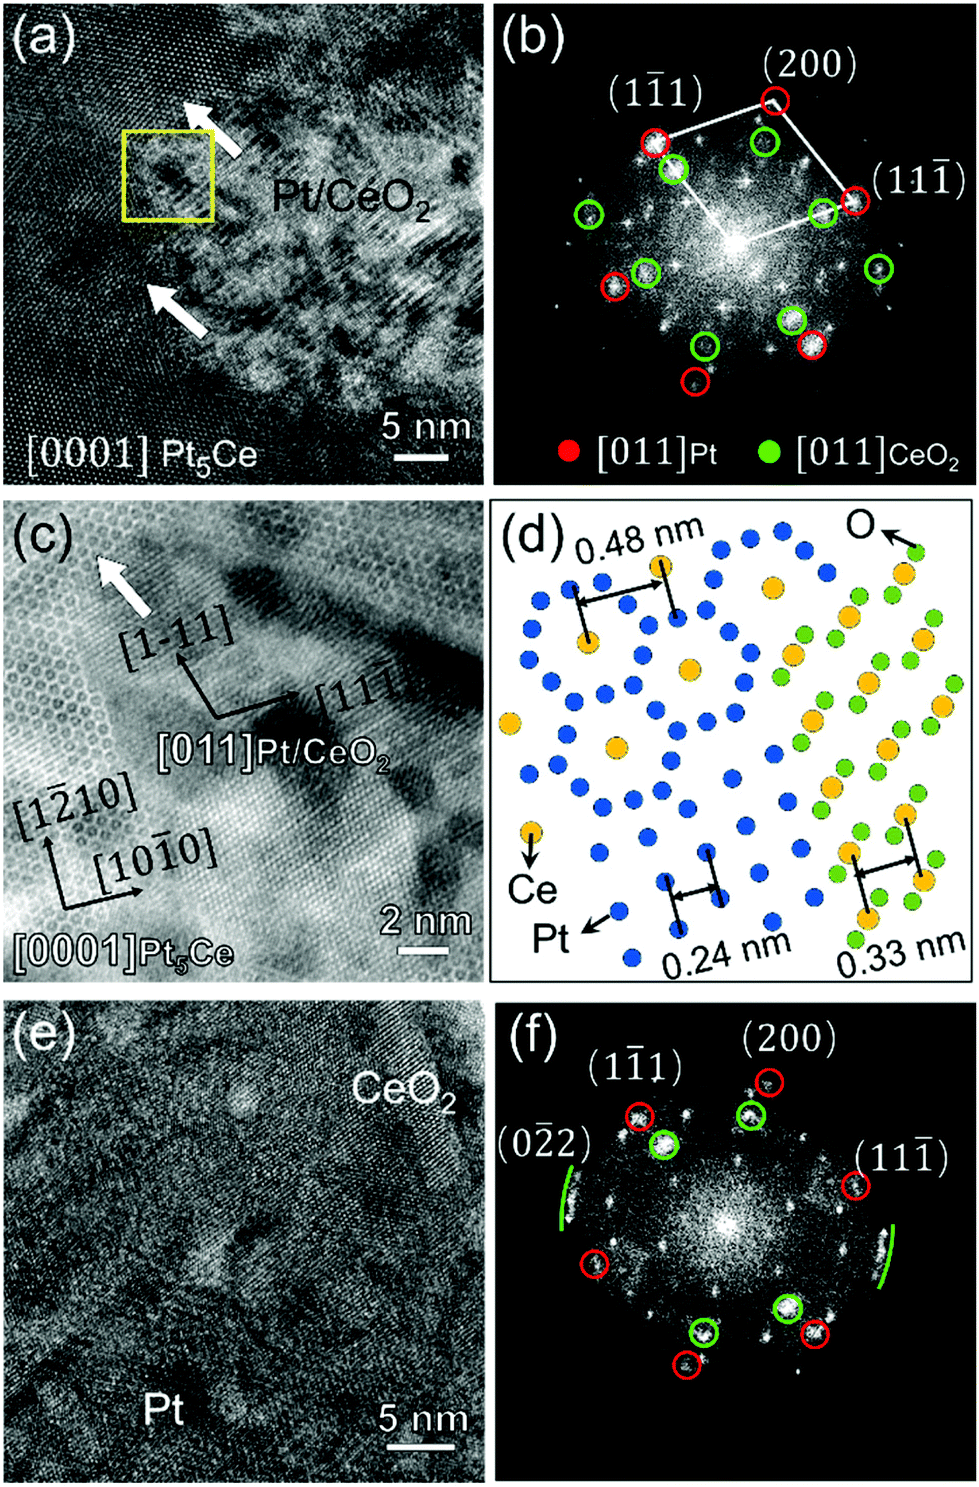
3.2 Phase separation behavior during the oxidation of Pt5Ce alloy
How the special epitaxial relationship of (111)Pt//(111)CeO2 with a 60° rotation evolves in the self-assembled Pt/CeO2 composites must be elucidated. For this purpose, we prepared a partially oxidized powder specimen containing the reaction interface between the Pt5Ce precursor and the phase-separated Pt/CeO2 nanocomposites. By analyzing the reaction interface structure, we can understand the early stage of the phase-separation behavior. Fig. 2(a) displays HAADF–STEM image of the powder precursor heated for 30 minutes, projected along the [0001]Pt5Ce direction. The reaction interface between the upper Pt5Ce alloy and lower Pt/CeO2 nanocomposites is marked by the black dashed line. The corresponding FFT images of two regions enclosed in the yellow-edged squares are shown on the right side of Fig. 2(a). These images clarify the different crystal structures of the alloy and nanocomposite. In the Pt5Ce precursor, a periodical compositional contrast is visible within 10–20 nm from the interface. All spots in the FFT image were attributable to the Pt5Ce structure, confirming the absence of precipitates; that is, the contrast was caused by atomic segregation. Meanwhile, the nanocomposites presented stripy patterns with alternating dark CeO2 and bright Pt. The periodicity of the stripes was 4.6 nm, identical to that in the completely phase-separated nanocomposites. The statistical data are displayed in Fig. S2(b)†. It appears that the periodicity of the separated phase is independent of the annealing duration. Focusing on the near-interface region, one observes that CeO2 stripes in the composites were connected with the dark-contrast phase in the precursor alloy. Moreover, the stripes were almost perpendicular to the reaction interface, indicating that the nanocomposites growth pointed toward the reaction interface (white arrows in Fig. 2(a)). The Pt and CeO2 structures viewed from the [−112] direction were identified by indexing the FFT pattern of the nanocomposites. Evidently, the Pt and CeO2 grains shared a fully epitaxial relationship, unlike that of the completely oxidized sample [(111)Pt//(111)CeO2 60°]. The orientation relationship between the Pt5Ce alloy and self-assembled nanocomposites was derived as (1−100)Pt5Ce//(220)Pt/CeO2, [0001]Pt5Ce//[−112]Pt/CeO2. This result is the first observed orientation relationship between hexagonal closest packed (hcp) and face-centered cubic (fcc) structures during a phase transformation. Another pronounced feature is the growth direction of the nanocomposites, which was parallel to the [110] direction. The fast growth rate of the (220) plane in [110] direction caused the preferential orientation of the Pt and CeO2 phases in the composites, consistent with the X-ray diffraction (XRD) result (see Fig. S3†). In the XRD pattern, the relative intensity of the (220)Pt plane was much stronger than the referenced XRD powder data [JCPDS no. 04-0802].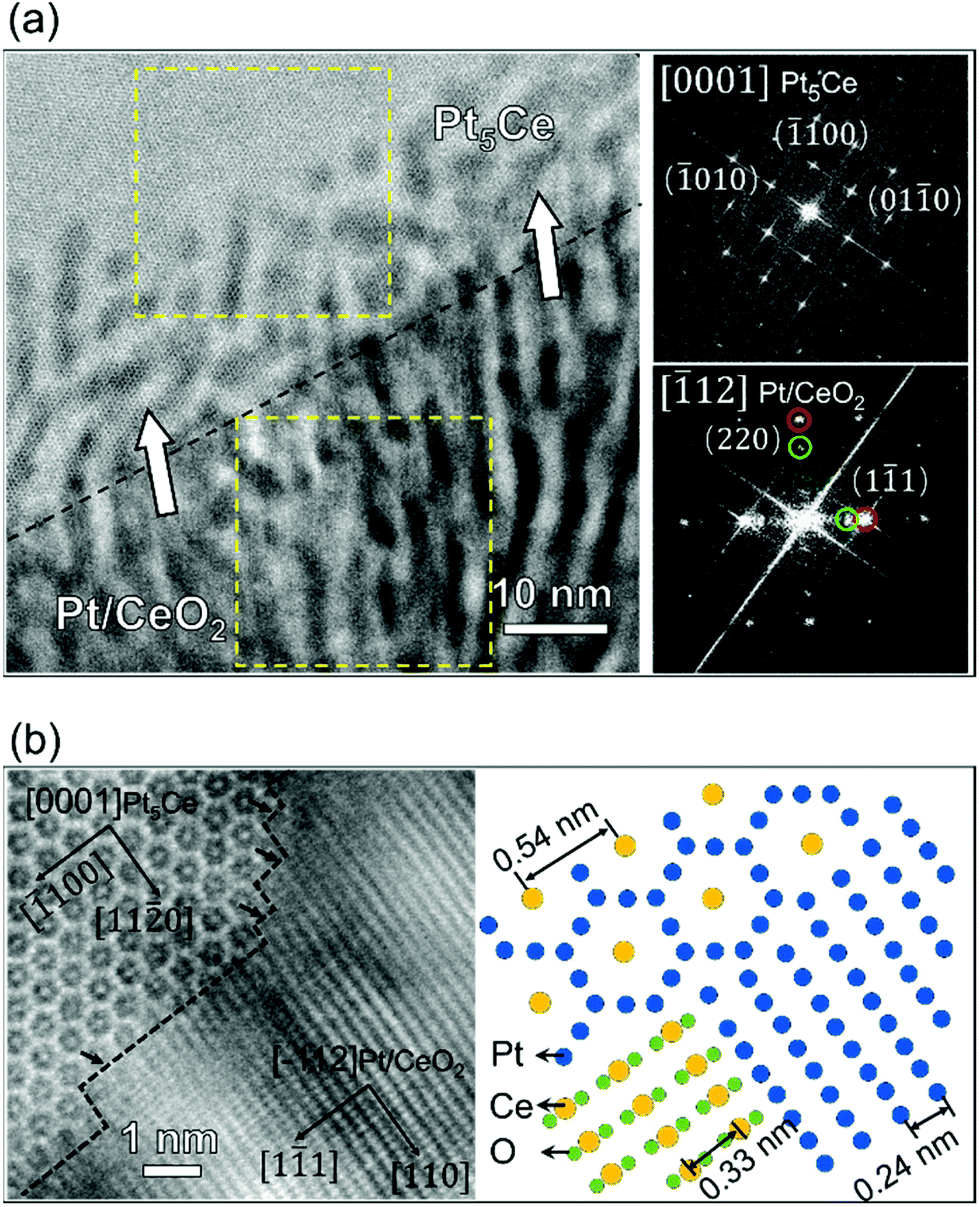 | ||
| Fig. 2 (a) HAADF–STEM image of the Pt5Ce bulk sample annealed at 400 °C for 30 min showing the interface area between the Pt5Ce alloy and Pt/CeO2 composites. The two FFT images were calculated in the areas within the yellow frames. In front of the dashed line, the contrast was caused by the atomic segregation. (b) Higher-magnification HAADF–STEM image at the reaction interface, showing the orientation relationship between the Pt5Ce and Pt/CeO2 composites. Right panel shows the corresponding structure model. | ||
To clarify the reaction interface structure between the Pt5Ce alloy and Pt/CeO2 nanocomposites, the HAADF–STEM image was magnified at the reaction interface. The image is displayed in Fig. 2(b). A hexagonal arrangement of atoms was projected along the [0001] zone axis in the Pt5Ce structure. The reaction interface was uneven and facilitated phase separation in certain stages. The arrows indicate the terraces lying exactly on the (220) plane of the nanocomposite. Based on the above-described orientation relationship between the alloy and the precipitates, the atomistic structures of the phases were derived and are displayed in the right panel of Fig. 2(b). As shown in the structural model, the plane spacing of (11−20) in the alloy was approximately twice the plane spacings of (111) in the Pt precipitates. The lattice misfit of the (111) planes of fully epitaxial Pt and CeO2 was calculated as 36% against Pt crystal, similar to that of the completely oxidized sample.
When alloys containing noble metals are oxidized, the noble metal phase separates from the oxide of the less noble metal. This phase separation is driven by the large discrepancy in the oxygen affinities of the noble and non-noble constituents.44 Unlike nanoscale alloy particles,30 which form metal core–oxide shell structures when oxidized, the microcrystalline Pt–Ce alloy in the present study formed a spatially periodic striped pattern similar to a Turing pattern. Such periodic structures have been found in the oxidized alloys based on silver,45 nickel,46 and other metals undergoing internal oxidation. In this scenario, one alloy component is selectively oxidized but cannot reach the surface quickly enough to form an oxide layer.47 Alloy diffusion is thought to be negligibly slower than the inward oxygen movement, so the oxidation process is diffusion controlled.48 The oxide in internal oxidation reactions can be spherical, facetted crystalline, dendritic, or some other shape.49 In the striped structure observed here, the CeO2 precipitates were constrained in their growth direction by the cerium and oxygen supplies. Consequently, the distance of oxygen diffusion to the immobile unreacted cerium was minimal, and the separated phase grew (on average) in the direction normal to the reaction interface. As oxygen must be transported through the CeO2 phase to reach the reaction interface and Pt and Ce have different oxygen affinities, it was inferred that oxygen dissolution into the alloy contributed to atomic segregation in front of the reaction interface. CeO2 and Pt phases were then epitaxially formed by oxidation of the Ce-rich alloy and transformation of the Pt-rich alloy, respectively. Moreover, the Pt–CeO2 interface facilitated the oxygen diffusion from the surface to the inner Pt5Ce alloy,44 thereby accelerating the oxidation process. The diffusion path of each element in the alloy and oxide is schematized in Fig. S4.† Owing to the low misfit between the (111) plane of Pt and the (11−20) plane in Pt5Ce alloy, the phase transformation with the described orientation relationship, namely, (1−100)Pt5Ce//(220)Pt/CeO2, [0001]Pt5Ce//[−112]Pt/CeO2, beneficially minimizes the lattice strain. In contrast, the epitaxy (111) planes of Pt and CeO2 are largely mismatched and cannot be solely compensated by inducing misfit dislocations. As the remaining lattice strain relaxes, the fully epitaxial relationship of Pt and CeO2 at the early phase-separation stage should change to an epitaxial type of (111)Pt/(111)CeO2 60° in the final stage.
3.3 Ex situ experiment for tracking the phase-separation behavior
Although characterizing the samples prepared at different annealing times revealed the phase-separation behavior induced by oxidation, observing the whole process in a single sample would provide more conclusive results. For this purpose, we studied the phase-separation stages in an ex situ experiment of the firstly-FIB-thinned alloy specimen. The ex situ specimen was annealed for 10 min while the other synthesis conditions were those of the bulky powder sample.Panels (a) and (b) of Fig. 3 show the HAADF–STEM images and corresponding selected area electron diffraction (SEAD) patterns of the Pt5Ce alloy precursor and the as-annealed alloy of the firstly-FIB-thinned specimen, respectively. The observed Pt5Ce alloy precursor with about 300 × 300 nm2 area presented a single hcp phase along the [0001] zone axis (Fig. 3(a)) with no evidence of precipitates. After heating the initial Pt5Ce alloy specimen ex situ to 400 °C for 10 min, two interconnected phases with stripy patterns were continuously formed from the edge of the specimen (white and gray phases in the STEM image of Fig. 3(b)). In a statistical analysis of the phase-separated region, the periodicity of the two-phase stripes was determined as 4.5 nm (see Fig. S2(c)†). The black arrows in Fig. 3(b) indicate the growth direction of the striped structure. The stripes proceeded perpendicular to the alloy interface (dashed line in the figure). The SEAD pattern showed an additional two pairs of arc-shaped reflections. Based on the calculated diffraction distances, these reflections were indexed to diffractions of the (111) and (220) planes of the Pt and CeO2 phases. The positions of the diffraction spots suggest an almost-epitaxial relationship of the (111)Pt and (111)CeO2 planes, but with a slight swing in the same direction. Fig. 3(c) shows the elemental maps of the interface-contained regions. The concentrations of O atoms differed on both sides of the interface, suggesting an oxidation- induced phase separation. Within the phase-separated regions, the white and gray stripes were apparently rich in Pt and Ce, respectively, confirming that the phase-separated region is composed of Pt/CeO2 composites.
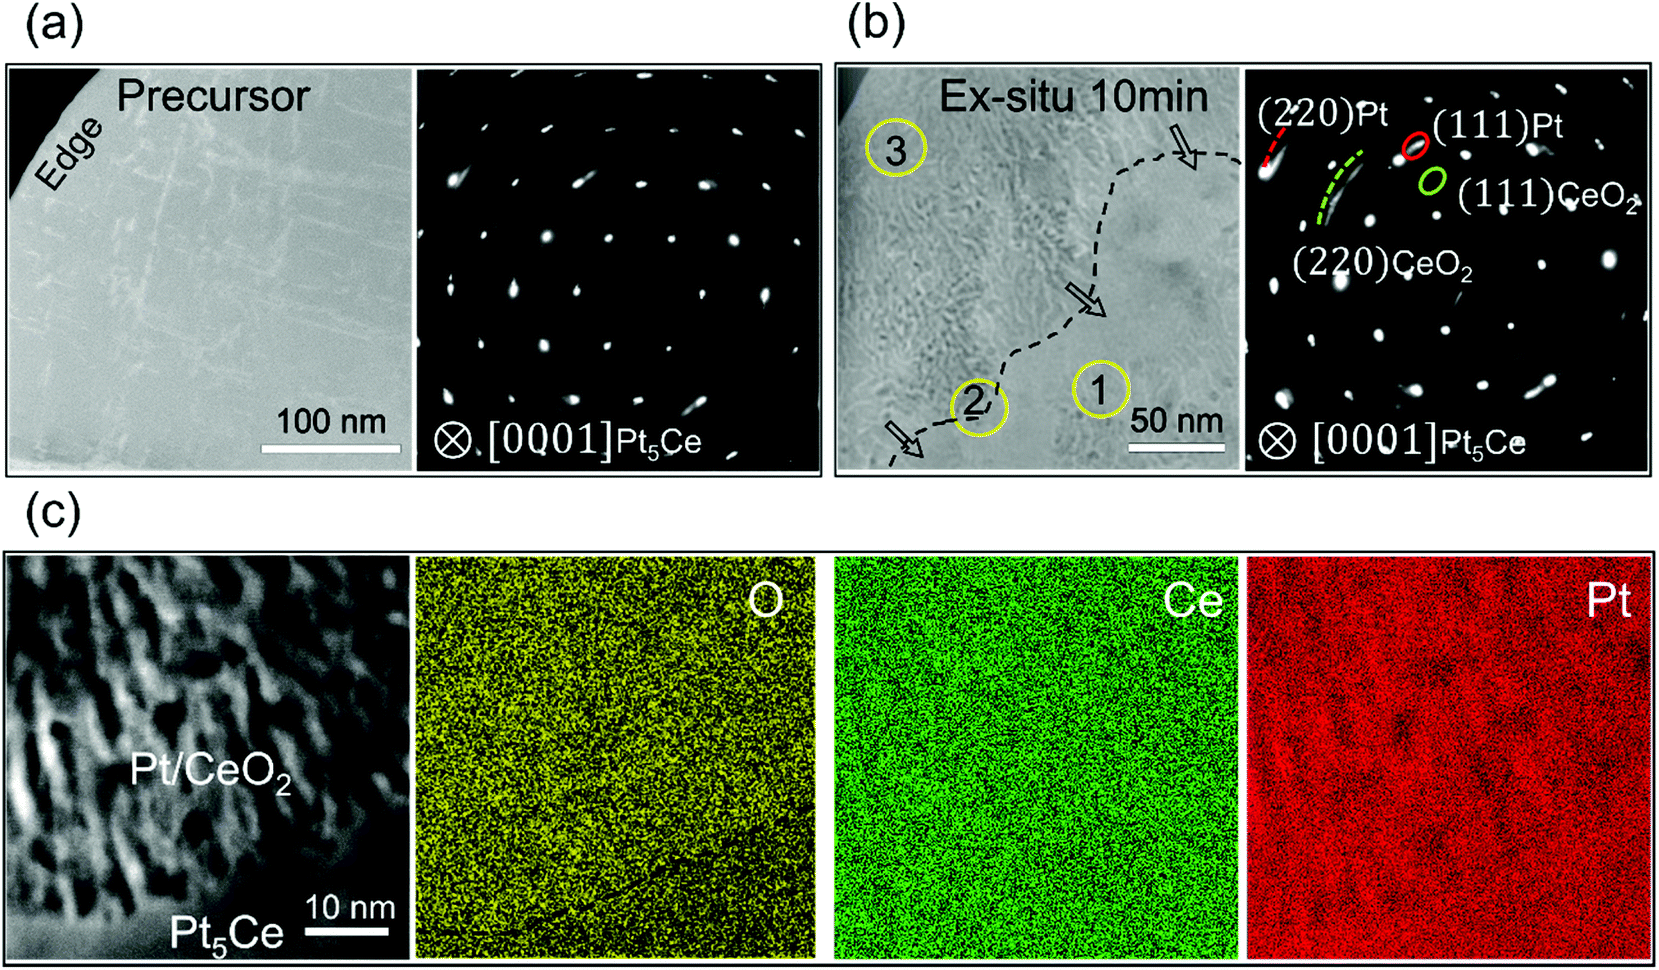 | ||
| Fig. 3 Characterization of nano-phase separation in Pt5Ce alloy. HAADF–STEM images and corresponding SAED patterns along the [0001] Pt5Ce zone axis of (a) Pt5Ce alloy precursor and (b) the firstly-FIB-thinned specimen ex situ annealed at 400 °C for 10 min. (c) HAADF–STEM image of the interface area containing the alloy precursor and separated phases, and corresponding elemental maps of O, Ce and Pt. | ||
As explained in subsection 3.2, oxidation of Pt5Ce alloy produces not only a Ce metal oxide, but also an fcc structure of Pt metal, which emerges through a matrix phase transformation. Moreover, the (111) planes of Pt and CeO2 shared a parallel relationship. A striped pattern with the same periodicity was observed both in the bulky powder sample and the firstly-FIB-thinned sample, suggesting that the metal atoms diffused laterally regardless of the sample geometry. In the present case, the absence of the oxide layer at the surface further verified the slow diffusion of alloy components and the resulting predominant oxidant diffusion. Because oxidation started at the surface and progressed inward, the front and back positions (marked as positions 1 and 3 in Fig. 3(b), respectively) at the interface should indicate the initial and late phase-separation stages, respectively. Therefore, to extract more information on the oxidation-induced phase-separation behavior, three regions at different separation stages (enclosed within the yellow-edged circles in Fig. 3(b)) were further analyzed by HRTEM and HAADF–STEM.
Fig. 4(a) is a HAADF–STEM image of the initial separation stage corresponding to Region 1 in Fig. 3(b). The Pt-rich and Pt-poor nanoclusters are distinguished by their Z-contrast intensities. Fig. 4(b) displays the corresponding FFT patterns along the [0001] orientation of the Pt5Ce alloy precursor. Besides the reflections of Pt5Ce, two pairs of weak reflections suggested an ordering of the nanoclusters. The inverse-FFT (IFFT) patterns of both pairs of reflections confirmed their emergence in different regions (see Fig. S5†). The spots enclosed by the green- and red-edged circles in Fig. 4(b) were identified as CeO2 and Pt-rich alloys, respectively. After extracting the {10–10}Pt5Ce reflections (enclosed by the yellow-edged circles in Fig. 4(b)), an edge dislocation was identified in the {10–10} plane (Fig. 4(c)). This dislocation resulted from lattice distortion and strain relaxation after component segregation, which would contract or expand the lattice. To visualize the degree of lattice distortion, the local lattice strain was mapped using GPA. Fig. 4(d) shows the strain component εxx of Fig. 4(a). A small lattice strain appeared around the segregation areas. The obvious strain field around the edge dislocation implies a compressive strain in the Pt-poor nanoclusters and a tensile strain in the Pt-rich nanocluster, which resulted from the larger atomic radius of the Ce atoms than the Pt atoms. The compositional contrast in Fig. 4(a) at the same dislocation position (white-edged square) affirms this conclusion.
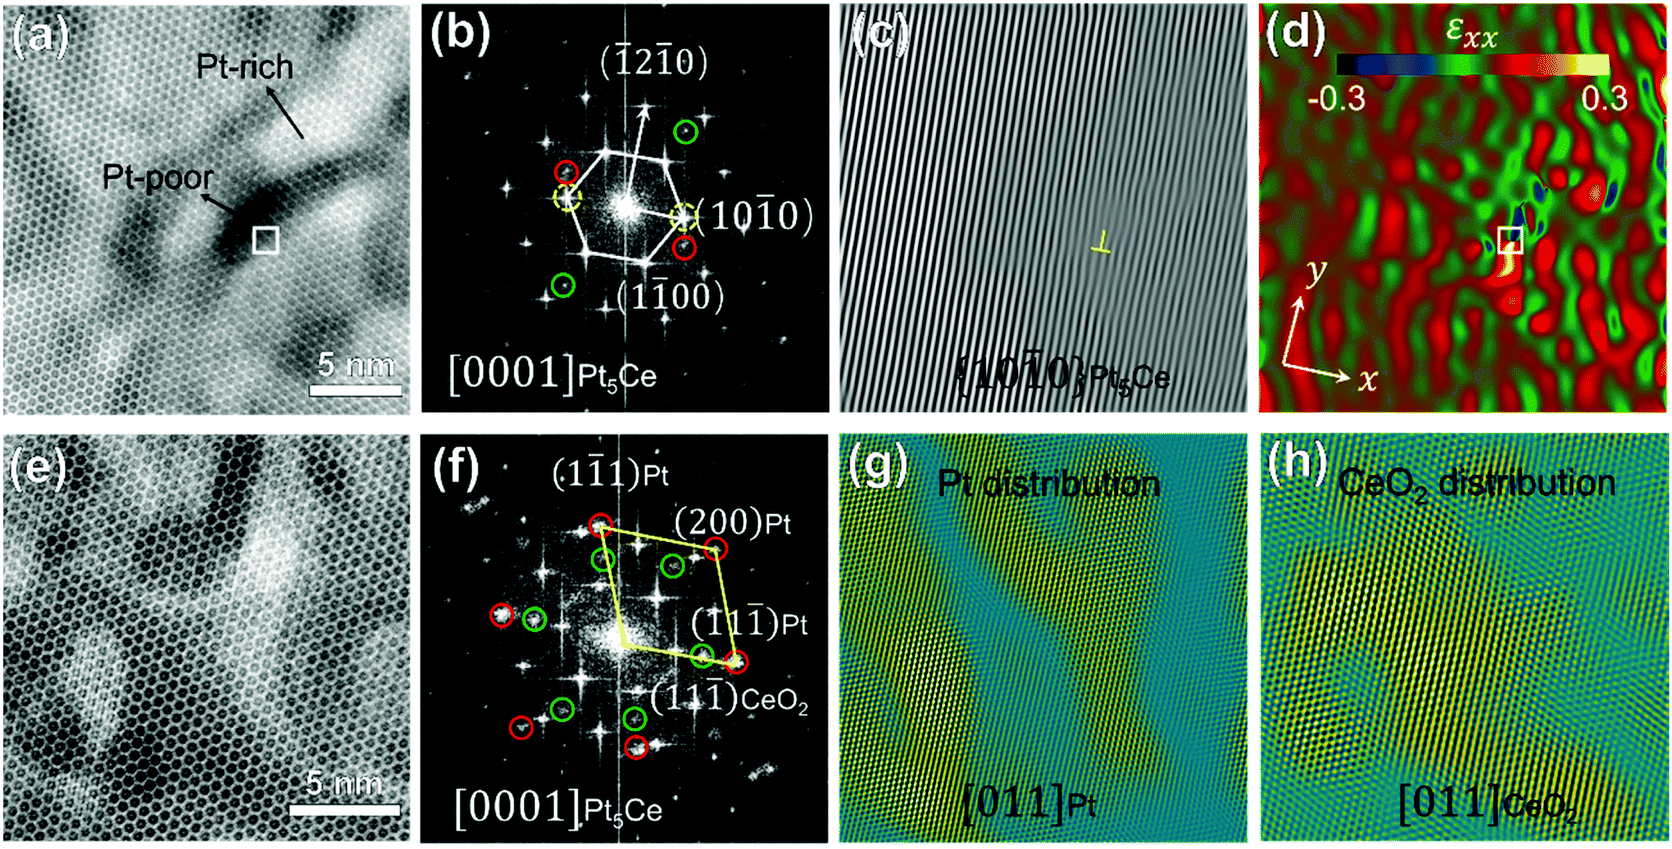 | ||
| Fig. 4 (a) HAADF–STEM image of the initial separation stage (region 1 in Fig. 1(b)) showing atomic segregation along the [0001]Pt5Ce axis, (b)FFT pattern of (a), (c) IFFT image of Pt5Ce (10−10) extracted from (b) to highlight the lattice fringe image along {10–10}Pt5Ce (yellow symbol indicates the edge dislocation), and (d) strain component εxx of (a) obtained in a GPA analysis: x|| [10–10]Pt5Ce, y|| [1−210]Pt5Ce. (e) HAADF–STEM image of another site in region 1 of panel 4(b), showing the Pt and CeO2 crystals with a [0001]Pt5Ce zone axis, and (f) corresponding FFT pattern (red- and green-edged circles enclose diffraction spots from the Pt and CeO2 phases, respectively). (g) and (h) IFFT images displaying the Pt and CeO2 distributions, obtained by extracting the six red circles and six green circles in (f), respectively. | ||
Fig. 4(e) shows another HAADF–STEM image in Region 1 along the [0001]Pt5Ce direction. The corresponding FFT pattern in Fig. 4(f) demonstrates that Pt and CeO2 crystals were formed in the Pt5Ce alloy. In addition to the FFT spots of Pt5Ce alloy, spots attributed to [011]Pt and [011]CeO2 (enclosed within the red- and green-edged circles, respectively) were identified by calculating the interplanar spacings. Panels (g) and (h) of Fig. 4 show the IFFT patterns determined from the Pt and CeO2 spots in Fig. 4(f), illustrating the distributions of the Pt and CeO2 phases, respectively. The patterns re-confirm that the bright and dark contrasts in HAADF–STEM in Fig. 4(e) are related to the Pt and CeO2 phases, respectively. As the oxidation process occurred after atomic segregation, it was inferred to be governed by inward diffusion of the dissolved oxygen. Moreover, stress in the atomic segregation area promoted the oxidation50 and phase transformation processes,51 accelerating the penetration into the phase-separation zone.
HRTEM images of the middle and late separation stages (Regions 2 and 3 in Fig. 3(b)) are displayed in Fig. 5. Fig. 5(a) shows the interface area of Region 2, which contains both the Pt5Ce alloy and the phase-separated Pt/CeO2 composites in the [0001]Pt5Ce orientation. The growth direction of the Pt and CeO2 stripes (indicated by the white arrows in Fig. 5(a)) was explained earlier. In the corresponding FFT pattern (Fig. 5(b)), the red and green-edged circles mark the Pt and CeO2 spots, respectively. Clearly, the epitaxial relationship between Pt and CeO2 was established in this separation stage. Moreover, the growth direction of the Pt/CeO2 composites is consistent with the [111]Pt/CeO2 direction. Considering the phase transformation of Pt5Ce alloy with an hcp structure to Pt with an fcc structure, the orientation relationship between the two phases was obtained as {10−10}Pt5Ce//(1−11)Pt/CeO2, [0001]Pt5Ce//[011]Pt/CeO2, which differs from the typically reported phase relationship in Pt5Ce surface alloy transformation, i.e., {0001}Pt5Ce//{111}Pt.28Fig. 5(c) is an enlarged atomic STEM image of the region enclosed by the square in Fig. 5(a). This image confirms the above-derived orientation relationships between the Pt5Ce alloy and the Pt/CeO2 composites. The atomic structure model of phase separation in this system is shown in Fig. 5(d). In the direction nearly normal to the growth direction of the precipitates, the lattice spacing of the (10−10) plane of the Pt5Ce alloy was twice that of the (111) plane of Pt crystals. This perfect alignment favors phase separation. In the (111) planes, the ratio of the Pt to CeO2 lattice vectors was 1.38 with an approximate misfit of 38%. Judging from the large misfit at the coherent interface, the epitaxial relationship between Pt and CeO2 was probably unstable to further reactive heating.
 | ||
| Fig. 5 (a) HRTEM image with [0001]Pt5Ce zone axis and (b) corresponding FFT of the middle separation stage (region 2 in Fig. 3(b)) showing the interface area between Pt5Ce alloy and Pt/CeO2 composites. (c) HAADF–STEM image of the boxed area in (a), and (d) atomic structure model of each phase in the interface area. (e) HRTEM image along the [0001]Pt5Ce zone axis and (f) corresponding FFT of the late separation stage (region 3). | ||
In the late separation stage (close to the edge of the thinned specimen, indexed as Region 3 in Fig. 3(b)), the situation was somewhat different. The HRTEM image of this phase-separated area is shown in Fig. 5(e). The composite structure of Pt and CeO2 is clearly visible. The corresponding FFT image is displayed in Fig. 5(f). Comparing the reflections in panels (b) and (f) of Fig. 5, we find that some reflection spots developed arc shapes in the late separation stage and the CeO2 crystals were shifted from the correct zone axis. The reflections from CeO2(11−1) disappeared while those from (220) were stronger than those in the interface area. It was deduced that during the growth process, the CeO2 crystals rotated through a small angle while the epitaxial relationship was retained on the (111) planes. Such rotational behavior is often found in largely mismatched metal–oxide heterointerface systems because it lowers the interface energy.52,53 Given the large misfit between the Pt and CeO2 phases (38%), the crystal rotation was likely enforced by strain relaxation.
Based on the above results, the phase-separation behavior in the present samples was identical to that found in bulky powder samples and proceeded in three steps. In the first step, atomic segregation of Pt and Ce occurs in the Pt5Ce alloy because of their different oxygen affinity. As the oxygen continues to diffuse into the Ce-rich regions, the self-assembled Pt and CeO2 stripy phases with a fully epitaxial relationship then become separated from the alloy during the early stage. Owing to the large misfit between the lattice constants of Pt and CeO2 phases, the crystals with an initially commensurate interface tend to rotate along [111], and finally maintain the (111)Pt//(111)CeO2 relation. The phase-separation behavior is schematized in Fig. S6.† It should be noted that although stripy patterns of Pt and CeO2 are kinetically favorable to minimize the oxygen diffusion distance to the immobile unreacted cerium, the stripes growth direction and the orientation relationship between the stripes and the precursor alloy should be energetically favorable because of the large internal surface area. Therefore, the preferred growth direction and orientation of stripes vary with the orientation of the precursor alloy and annealing temperature. Moreover, different growth directions ([110] and [111], respectively) and orientation relationships (see stereographic projections in Fig. S7†) in the bulky powder and firstly-FIB-thinned specimens indicate the influence of the oxygen partial pressure for the phase separation behavior. This is because oxygen can more easily reach the reaction interface on the surfaces of FIB-thinned samples than the inside bulky powder samples. The stripes were assumed to be oriented perpendicular to the growing interface between the alloy and Pt/CeO2 precipitants; accordingly, the growth direction is closely related to the orientation relationship between Pt5Ce and Pt/CeO2.
4. Conclusions
Self-assembled epitaxial interfaces of Pt/CeO2 nanocomposites were successfully formed by simple oxidation of Pt5Ce alloy. Nanoscale stripy patterns of alternating Pt and CeO2 phases were observed and an epitaxial interface between Pt and CeO2 was identified on their (111) planes. Furthermore, the oxidation-induced phase-separation process in a partially oxidized sample was observed by atomic-scale TEM, and a verification experiment was performed by ex situ annealing of a firstly-FIB-thinned TEM specimen. The oxygen partial pressure on the surface of the FIB-thinned specimen differed from that inside bulky powder samples, affecting the growth direction of the stripes and the orientation relationship between the Pt5Ce alloy and Pt/CeO2 composites. These findings suggest that Pt/CeO2 catalysts with an epitaxial interface can be economically prepared for fundamental research and practical applications. Furthermore, our results are expected to assist the structural design of metal–oxide nanocomposites.Author contributions
Yu Wen: conceptualization, methodology, formal analysis, writing-original draft; Hideki Abe: funding acquisition, writing-review & editing; Kazutaka Mitsuishi: writing-review& editing; Ayako Hashimoto: conceptualization, supervision, funding acquisition, writing-review& editing.Conflicts of interest
There are no conflicts to declare.Acknowledgements
This work was funded by the Precursory Research for Embryonic Science and Technology (PREST) (Grant No. JPMJPR17S7) and Core Research for Evolutional Science and Technology (CREST), Japan. We thank TEM station of National Institute for Materials Science (NIMS) for the support of using TEM and EDS techniques.Notes and references
- S. Park, J. M. Vohs and R. J. Gorte, Nature, 2000, 404, 265–267 CrossRef CAS PubMed.
- M. Takahashi, T. Mori, F. Ye, A. Vinu, H. Kobayashi and J. Drennan, J. Am. Ceram. Soc., 2007, 90, 1291–1294 CrossRef CAS.
- C. Sun, H. Li and L. Chen, Energy Environ. Sci., 2012, 5, 8475–8505 RSC.
- L. Sun, D. Marrocchelli and B. Yildiz, Nat. Commun., 2015, 6, 1–10 Search PubMed.
- S. A. Acharya, V. M. Gaikwad, V. Sathe and S. K. Kulkarni, Appl. Phys. Lett., 2014, 104, 113508 CrossRef.
- D. R. Mullins, P. M. Albrecht, T. L. Chen, F. C. Calaza, M. D. Biegalski, H. M. Christen and S. H. Overbury, J. Phys. Chem. C, 2012, 116, 19419–19428 CrossRef CAS.
- K. Werner, X. Weng, F. Calaza, M. Sterrer, T. Kropp, J. Paier, J. Sauer, M. Wilde, K. Fukutani, S. Shaikhutdinov and H. J. Freund, J. Am. Chem. Soc., 2017, 139, 17608–17616 CrossRef CAS PubMed.
- Y. Huang, B. Long, M. Tang, Z. Rui, M. S. Balogun, Y. Tong and H. Ji, Appl. Catal., B, 2016, 181, 779–787 CrossRef CAS.
- Y. Huang, Y. Lu, Y. Lin, Y. Mao, G. Ouyang, H. Liu, S. Zhang and Y. Tong, J. Mater. Chem. A, 2018, 6, 24740–24747 RSC.
- J. Yang, N. Xie, J. Zhang, W. Fan, Y. Huang and Y. Tong, Nanomaterials, 2020, 10, 1–12 Search PubMed.
- D. Gao, Y. Zhang, Z. Zhou, F. Cai, X. Zhao, W. Huang, Y. Li, J. Zhu, P. Liu, F. Yang, G. Wang and X. Bao, J. Am. Chem. Soc., 2017, 139, 5652–5655 CrossRef CAS PubMed.
- Z. Lu and Z. Yang, J. Phys.: Condens. Matter, 2010, 22, 475003 CrossRef PubMed.
- J. A. Rodriguez, D. C. Grinter, Z. Liu, R. M. Palomino and S. D. Senanayake, Chem. Soc. Rev., 2017, 46, 1824–1841 RSC.
- M. Boudart, Adv. Catal., 1969, 20, 153–166 CAS.
- Q. Fu, H. Saltsburg and M. Flytzani-Stephanopoulos, Science, 2003, 301, 935–938 CrossRef CAS PubMed.
- H. H. Liu, Y. Wang, A. P. Jia, S. Y. Wang, M. F. Luo and J. Q. Lu, Appl. Surf. Sci., 2014, 314, 725–734 CrossRef CAS.
- H. P. Zhou, H. S. Wu, J. Shen, A. X. Yin, L. D. Sun and C. H. Yan, J. Am. Chem. Soc., 2010, 132, 4998–4999 CrossRef CAS PubMed.
- C. Spiel, P. Blaha, Y. Suchorski, K. Schwarz and G. Rupprechter, Phys. Rev. B: Condens. Matter Mater. Phys., 2011, 84, 1–11 CrossRef.
- S. Aranifard, S. C. Ammal and A. Heyden, J. Phys. Chem. C, 2014, 118, 6314–6323 CrossRef CAS.
- W. Rong, H. Chen, Z. Huang and K. Wu, J. Phys. Chem. C, 2020, 124, 6284–6289 CrossRef CAS.
- C. Xu, Y. Wu, S. Li, J. Zhou, J. Chen, M. Jiang, H. Zhao and G. Qin, J. Mater. Sci. Technol., 2020, 40, 39–46 CrossRef.
- Y. Gao, W. Wang, S. Chang and W. Huang, ChemCatChem, 2013, 5, 3610–3620 CrossRef CAS.
- M. Cargnello, V. V. T. Doan-Nguyen, T. R. Gordon, R. E. Diaz, E. A. Stach, R. J. Gorte, P. Fornasiero and C. B. Murray, Science, 2013, 341, 771–773 CrossRef CAS PubMed.
- L. Tao, Y. Shi, Y. Huang, Y. Zhang, J. Huo, Y. Zou, J. Luo, C. Dong and S. Wang, Nano Energy, 2018, 53, 604–612 CrossRef CAS.
- H. Iida and A. Igarashi, Appl. Catal., A, 2006, 298, 152–160 CrossRef CAS.
- M. Sedighi, A. A. Rostami and E. Alizadeh, Int. J. Hydrogen Energy, 2017, 42, 4998–5005 CrossRef CAS.
- Y. Kozu, S. Kawashima and F. Kitamura, J. Solid State Electrochem., 2013, 17, 761–765 CrossRef CAS.
- U. Berner and K. D. Schierbaum, Phys. Rev. B: Condens. Matter Mater. Phys., 2002, 65, 2354041–23540410 CrossRef.
- C. Hardacre, T. Rayment and R. M. Lambert, J. Catal., 1996, 158, 102–108 CrossRef CAS.
- E. A. Sutter, X. Tong, K. Jungjohann and P. W. Sutter, Proc. Natl. Acad. Sci. U. S. A., 2013, 110, 10519–10524 CrossRef CAS PubMed.
- P. Sutter, S. A. Tenney, F. Ivars-Barcelo, L. Wu, Y. Zhu and E. Sutter, Nanoscale Horiz., 2016, 1, 212–219 RSC.
- Y. Wen, A. Hashimoto, A. S. B. M. Najib, A. Hirata and H. Abe, Appl. Phys. Lett., 2020, 118, 054102 CrossRef.
- T. Tanabe, T. Imai, T. Tokunaga, S. Arai, Y. Yamamoto, S. Ueda, G. V. Ramesh, S. Nagao, H. Hirata, S. I. Matsumoto, T. Fujita and H. Abe, Chem. Sci., 2017, 8, 3374–3378 RSC.
- T. Imai, S. Ueda, S. Nagao, H. Hirata, K. R. Deepthi and H. Abe, RSC Adv., 2017, 7, 9628–9631 RSC.
- A. S. B. M. Najib, X. Peng, A. Hashimoto, S. Shoji, T. Iida, Y. Bai and H. Abe, Chem. – Asian J., 2019, 14, 2802–2805 CAS.
- A. S. B. M. Najib, M. Iqbal, M. B. Zakaria, S. Shoji, Y. Cho, X. Peng, S. Ueda, A. Hashimoto, T. Fujita, M. Miyauchi, Y. Yamauchi and H. Abe, J. Mater. Chem. A, 2020, 8, 19788–19792 RSC.
- Dave Mitchell's DigitalMicrograph™ Scripting Website. http://www.dmscripting.com/hrtem_filter.html.
- Useful Plugins and Scripts for DigitalMicrograph. https://www.physik.hu-berlin.de/en/sem/software/software_frwrtools.
- J. Barthel, Ultramicroscopy, 2018, 193, 1–11 CrossRef CAS PubMed.
- C. Spiel, P. Blaha, Y. Suchorski, K. Schwarz and G. Rupprechter, Phys. Rev. B: Condens. Matter Mater. Phys., 2011, 84, 045412 CrossRef.
- S. Bernal, F. J. Botana, J. J. Calvino, G. A. Cifredo, J. A. Pérez-Omil and J. M. Pintado, Catal. Today, 1995, 23, 219–250 CrossRef CAS.
- Q. Ji, M. Kan, Y. Zhang, Y. Guo, D. Ma, J. Shi, Q. Sun, Q. Chen, Y. Zhang and Z. Liu, Nano Lett., 2015, 15, 198–205 CrossRef CAS PubMed.
- N. Marzari, O. L. Sanchez, Y. Kung, D. Krasnozhon, M. Chen, S. Bertolazzi, P. Gillet, A. Fontcuberta, A. Radenovic and A. Kis, ACS Nano, 2015, 4, 4611–4620 Search PubMed.
- G. C. Wood and F. H. Stott, Mater. Sci. Technol., 1986, 3, 519–530 CrossRef.
- T. D. Nguyen, J. Zhang and D. J. Young, Corros. Sci. Technol., 2015, 14, 127–131 CrossRef CAS.
- D. T. M. Do and M. Nanko, Mater. Sci. Forum, 2011, 696, 384–388 CAS.
- D. J. Young, Defect Diffus. Forum, 2012, 323–325, 283–288 CAS.
- F. H. Stott and G. C. Wood, Mater. Sci. Technol., 1988, 4, 1072–1078 CrossRef CAS.
- D. J. Young, High Temperature Oxidation and Corrosion of Metals: Second Edition, Corrosion series, Sydney, 2nd edn, 2008 Search PubMed.
- H. E. Evans, Int. Mater. Rev., 1995, 40, 1–40 CrossRef CAS.
- D. H. Hong, T. W. Lee, S. H. Lim, W. Y. Kim and S. K. Hwang, Scr. Mater., 2013, 69, 405–408 CrossRef CAS.
- K. Matsunaga, T. Sasaki, N. Shibata, T. Mizoguchi, T. Yamamoto and Y. Ikuhara, Phys. Rev. B: Condens. Matter Mater. Phys., 2006, 74, 2–9 CrossRef.
- F. Ernst, Mater. Sci. Eng. R, 1995, 14, 97–156 CrossRef.
Footnote |
| † Electronic supplementary information (ESI) available. See DOI: 10.1039/d1nr03492h |
| This journal is © The Royal Society of Chemistry 2021 |