
 Open Access Article
 This Open Access Article is licensed under a
 Creative Commons Attribution 3.0 Unported Licence
Accurate and rapid prediction of pKa of transition metal complexes: semiempirical quantum chemistry with a data-augmented approach†
Vivek
Sinha
 *,
Jochem J.
Laan
and
Evgeny A.
Pidko
*
*,
Jochem J.
Laan
and
Evgeny A.
Pidko
*
Inorganic Systems Engineering, Department of Chemical Engineering, Faculty of Applied Sciences, Delft University of Technology, 2629 HZ, Delft, The Netherlands. E-mail: V.Sinha@tudelft.nl; e.a.pidko@tudelft.nl
First published on 8th December 2020
Abstract
Rapid and accurate prediction of reactivity descriptors of transition metal (TM) complexes is a major challenge for contemporary quantum chemistry. The recently-developed GFN2-xTB method based on the density functional tight-binding theory (DFT-B) is suitable for high-throughput calculation of geometries and thermochemistry for TM complexes albeit with moderate accuracy. Herein we present a data-augmented approach to improve substantially the accuracy of the GFN2-xTB method for the prediction of thermochemical properties using pKa values of TM hydrides as a representative model example. We constructed a comprehensive database for ca. 200 TM hydride complexes featuring the experimentally measured pKa values as well as the GFN2-xTB-optimized geometries and various computed electronic and energetic descriptors. The GFN2-xTB results were further refined and validated by DFT calculations with the hybrid PBE0 functional. Our results show that although the GFN2-xTB performs well in most cases, it fails to adequately describe TM complexes featuring multicarbonyl and multihydride ligand environments. The dataset was analyzed with the ordinary least squares (OLS) fitting and was used to construct an automated machine learning (AutoML) approach for the rapid estimation of pKa of TM hydride complexes. The results obtained show a high predictive power of the very fast AutoML model (RMSE ∼ 2.7) comparable to that of the much slower DFT calculations (RMSE ∼ 3). The presented data-augmented quantum chemistry-based approach is promising for high-throughput computational screening workflows of homogeneous TM-based catalysts.
Introduction
Proton transfer reactions are ubiquitous in chemistry. The propensity of proton transfer from a chemical species is related to its acidity constant (pKa). In the context of the transition metal (TM) complexes, pKa has a direct relevance to their (bio)chemical activity and stability. In homogeneously catalysed (de)hydrogenation reactions such as the hydrogenation of CO2 to formates/formic acid1 and dehydrogenation of aqueous methanol,2 the pKa of TM-based catalysts has been recognized as an important design parameter. For example, the pKa of a TM hydride determines the strength of an acid necessary for the H2 evolution.3 Loss or gain of protons can open up undesirable conversion paths or even initiate the decomposition and/or deactivation of the catalyst.Accurate estimation of the thermodynamic properties such as the pKa of TM complexes is a major challenge for quantum theoretical methods. Computational methods for rapid and accurate screening of such thermodynamic properties are highly desirable. Density functional theory (DFT) has been extensively applied to estimate thermodynamic properties of TM complexes.4,5 However, the DFT based prediction workflows commonly face major challenges with respect to the accuracy of the calculations (basis set; XC functional; solvation model) and the computational costs. The accuracy of the method in DFT towards prediction of thermochemical properties can be addressed by validation against the experimental data. However, the computational cost for predicting molecular geometries and thermochemical properties remains an important challenge; in particular, when the applications in high-throughput computational screening are sought for. Despite the advances in software and hardware architectures, DFT-based calculations for moderately sized TM complexes (>50 atoms) can take several hours to complete in most cases on a modern supercomputer. Furthermore, the electronic structure of TM complexes, particularly for the 3d metals, is a major challenge for DFT.6 The cost and accuracy of DFT makes it challenging for its direct use in high throughput (HT) computational screening of TM complexes.
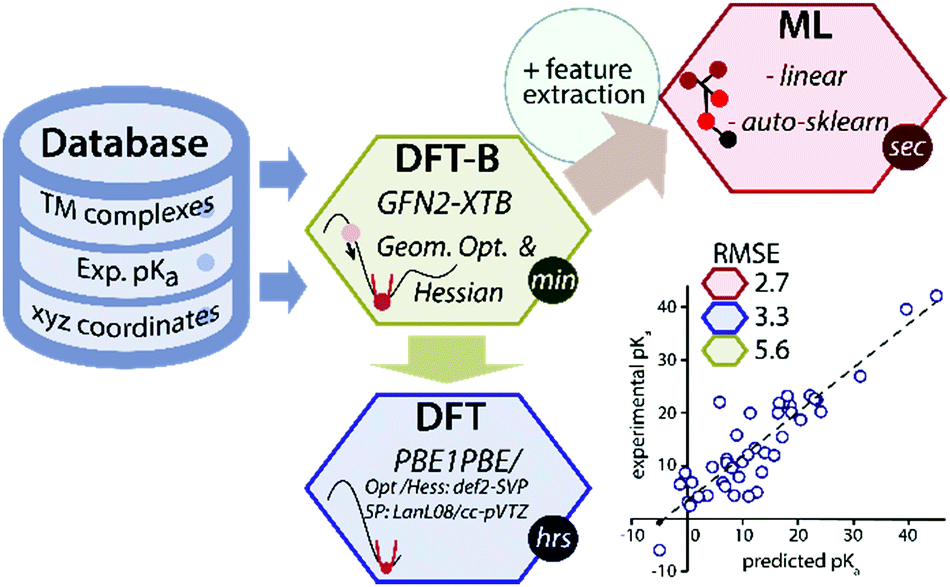
Data-driven or semiempirical quantum chemical approaches can be used to circumvent the low throughput of DFT for predicting geometries and thermochemical properties.7–11 Recently a GFN2-xTB method (the latest one from the GFN(n) family), based on the density functional tight-binding approach has been introduced for the rapid prediction of geometry and thermochemical properties of TM complexes.12 However, because of its semiempirical nature, the accuracy of the GFN2-xTB is fundamentally limited by the thermochemical span of the training set of molecules and the level of theory used in the parametrization. We propose that the accuracy of the GFN2-xTB method can be improved using machine learning of a target chemical property such as the pKa values (Fig. 1).
 | ||
| Fig. 1 A schematic overview of the data-driven approach to predict experimental pKa of TM hydride complexes. | ||
Density functional theory (DFT) calculations have been successfully applied to estimate the pKa of diverse classes of molecules.2,13–16 However, fewer studies have been carried out to compute the pKa of TM complexes. Previously, DFT was successfully used to compute the pKa of hexa-aqua TM complexes because of its relevance to the biochemical activity of TM cations.17–20 Qi and co-workers used an ONIOM-based approach to estimate the experimental pKa of TM hydrides.21 Muñoz and co-workers reported a theoretical approach to estimate the pKa of biologically relevant pyridoxamine–Cu(II) complexes.22 Recently Cundari and co-workers23 applied DFT calculations to estimate the pKa of methane adducts of 3d TM complexes.
Accurate treatment of solvent effects, especially in a protic and hydrogen bonding environment often pose a major challenge for the reliable computation of pKa values. Ab initio molecular dynamics (AIMD) simulations with a fully explicit solvent have been used to address solvation effects in computation of pKa of TM complexes in protic environments.13,14,24 The reader is referred to a review by Luber and co-workers25 for a comprehensive overview of AIMD-based protocols for computing pKa.
DFT-based methods typically require geometry optimization and calculation of the Hessian matrix to estimate the Gibbs free energy of protonated and deprotonated complexes. Even for relatively small complexes (∼50 atoms) with a single TM center, DFT calculations can take several hours to converge. AIMD simulations typically require several days to be able to compute a single pKa value of a TM complex. A model based on additive ligand acidity constants (LACs) was proposed by Morris and co-workers, which avoids DFT calculations and can compute the pKa of TM hydrides.26 The additive LAC method uses the ligand acidity constants of ligands coordinated to the metal centre, the charge of the conjugate base form of the metal complex, the location of TM metal in the periodic table and a correction related to the stability and geometry of the metal centre. While simple, reasonably accurate and motivated by physical principles, the additive LAC model requires knowledge of acidity constants of coordinating ligands, which makes it difficult to use directly in high throughput screening workflows. Cundari and co-workers recently reported ML-based methods for the estimation of pKa of methane adducts of TM complexes and demonstrated the potential of ML for catalyst design via rapid property prediction.27 The potential of GFNn-xTB methods towards rapid and accurate prediction of pKa was recently demonstrated in the SAMPL6 challenge by Grimme and co-workers.28 They demonstrated that the workflows based on GFN1-xTB and GFN2-xTB methods resulted in rapid and accurate prediction of experimental pKa of 24 drug-like molecules. The performance of GFN2-xTB has also been tested upon a large number of TM complexes taken from the Cambridge structural database.28,29 However, the performance of GFN2-xTB towards prediction of thermochemical properties of TM complexes has not been extensively validated against experimental and/or DFT computed data.
Therefore, research objectives in this study are two-fold: (1) systematically improve the accuracy of the GFN2-xTB method for prediction of experimental pKa of TM hydrides via a data-augmented approach, and (2) assess the suitability of GFN2-xTB and DFT//GFN2-xTB (i.e. DFT energy refinement on GFN2-xTB optimized geometries) for predicting pKa as compared with the conventional full DFT computational protocol. The presented data-augmented approach leads to a systematic improvement in the accuracy of the GFN2-xTB method for predicting the experimental pKa of TM hydrides at negligible additional computational cost. As a final test we use our data-augmented approach to predict the ligand pKa of TM complexes and estimate the pKa of TM hydrides for which ambiguous values have been reported in the literature.
Computational methods
Semiempirical tight-binding calculations
Semiempirical tight-binding calculations were carried out using the xTB code.12,30 We applied the GFN2-xTB method,31,32 recently developed by the Grimme group. Molecular geometries were subject to geometry optimization using the verytight criteria. The Hessian matrix calculations were performed for all optimized geometries to verify the absence of imaginary frequencies and that each geometry corresponds to a local minimum on its respective potential energy surface (PES). Solvent effects were implicitly accounted for using the GBSA solvation mode33,34 as implemented in xTB.‡Density functional theory calculations
DFT calculations were carried out using the Gaussian 16 C.01 program package.35 Geometry optimizations were carried out using the PBE0 (also denoted as the PBE1PBE)36 exchange–correlation functional, def2-SVP37 basis set and the Grimme's dispersion corrections (D3 version).38 The choice of the PBE0 functional is motivated by our previous experience for prediction of reliable results for TM complexes in good agreement with experimental data.Furthermore, our initial test showed the superior performance of the PBE0 method for the prediction of experimentally determined ligand pKa (N–H function) of several representative TM complexes. The DFT computed-energies were additionally refined by single point (SP) calculations using the PBE0-D3 method together with the SMD variation of the IEFPCM implicit solvent model of Truhlar and co-workers39 and the combination of the LANL08 basis set40 on the metal center and the cc-pvtz basis set for all other atoms.41
We note two limitations of our current approach. All complexes were computed at their lowest spin state and higher spin states were not considered in our calculations. Furthermore, we did not make a full exploration of the conformation space of the TM complexes, which could contribute towards the observed pKa. Conformation searching is computationally expensive at the DFT level of theory. At the GFN2-xTB level of theory one could use CREST calculations, which use a metadynamics-based approach to make a robust exploration of various possible conformations of a given complex.42–44 However, such a focused investigation of the contribution of conformational freedom to the pKa of M complexes is outside the scope of the current study. All geometries were pre-optimized first at the GFN2-xTB level and then subject to full DFT-based optimization. DFT-based geometry optimizations were carried out in the gas phase. We also performed geometry optimization in the solvated phase (using the SMD solvation model). The gas phase and solvated optimized geometries were found to be in good agreement with each other (see Fig. S23, ESI†). We however note that highly flexible molecular geometries with multiple conformations can show different global minimum in the gas and solvated phases.
Machine learning methods
We performed DFT-B-based geometry optimizations for 177 complexes in the gas phase and in solution. The output files were analysed to extract 17 descriptors (see Table 2) based on the computed electronic structure, geometry and energetics, which were stored in the dataset along with the experimentally measured pKa values obtained from the literature. For ML modelling we took two approaches: (1) linear regression via the ordinary least squares (OLS) fitting using sklearn library in python.45 (2) Automated ML using auto-sklearn library in python.46,47 Auto-sklearn allows a rigorous search of a number of ML regression models and hyperparameters. The Pearson correlation coefficient (r2_score) was used as a metric for the optimization of the ML model. The dataset was split into the training and test sets (80–20 split). The ML model was trained on the training set and its performance was tested on a test set, which it has not seen before. Cross-validation (CV) set via k-fold (5 folds) sampling was used, while optimizing the ML model.The ML models were further tested for their accuracy on an additional dataset of ligand pKa of TM complexes. ML models have been solely trained on TM hydrides and their performance on ligand pKa demonstrates their general applicability. We further use the ML models to assign pKa values of complexes, for which multiple pKa values have been reported in the literature and compare the results with the DFT-based predictions. The accuracy of ML models is assessed via calculation of root mean squared error (RMSE), wherever labelled data are available and compared against the performance of the DFT-based methods, wherever possible.
Determination of pKa
Several methods have been proposed in the literature for estimating pKa by means of DFT calculations.15 For an acid–base titration between an acid AH and base B to produce the conjugate base A and conjugate acid BH, one can express the pKa of AH as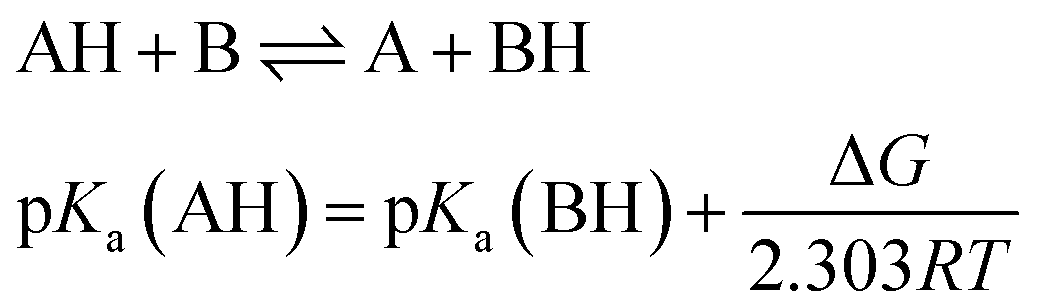 | (1) |
 | (2) |
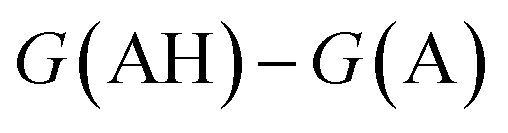 . We define proton affinity (PA) as the difference between the Gibbs free energies of protonated (G(AH)) and deprotonated species (G(A)) i.e.
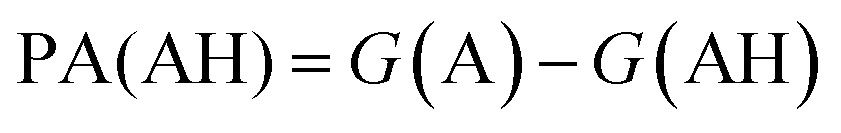 | (3) |
Equivalently one can also express the pKa(AH) using the PA and solvated Gibbs free energy of a proton.
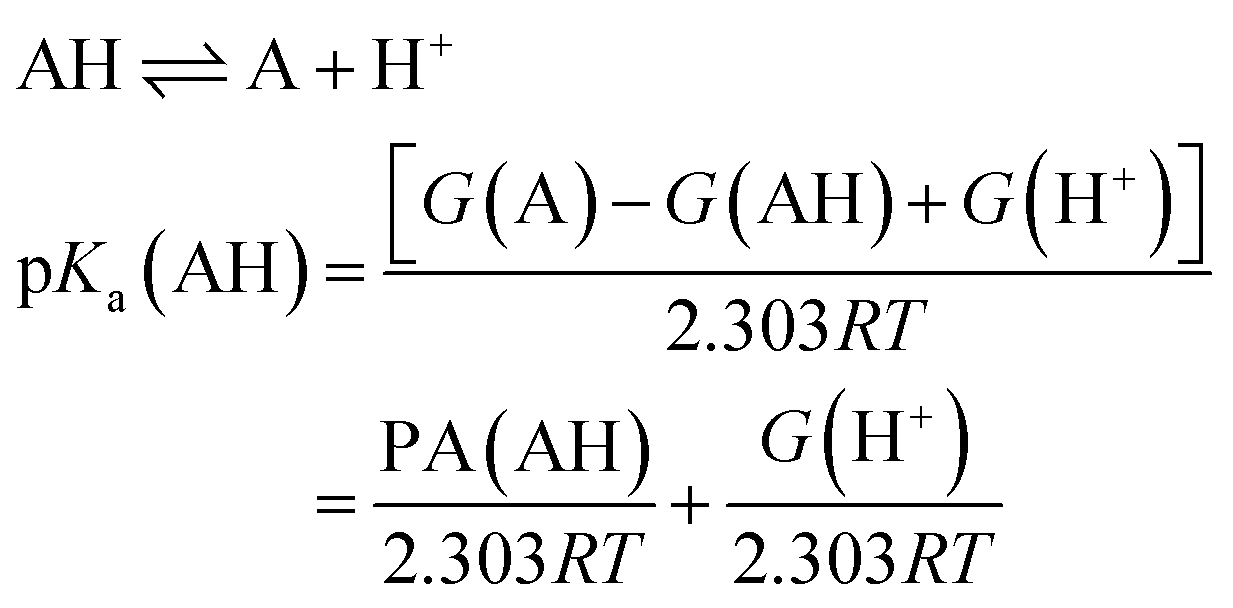 | (4) |
It can be shown that eqn (1) and (4) are equivalent and pKa can be expressed as a linear function of PA at fixed temperatures and for a given solvent.
For both the DFT and GFN2-xTB calculations, we discovered that the PA computed using Gibbs free energy (eqn (3)) correlates perfectly with the PA computed using electronic energies only (i.e. PA = E(A) − E(AH)). We therefore use electronic energy to compute the PA (≈E(A) − E(AH)) in our ML models. For further details please refer to Fig. S3 and S4 in the ESI.†
Results and discussion
pKa MH dataset
A data-augmented approach requires reliable data. Generation of data by experimentation and simulation is one of the key propelling factors towards the rise of data-driven chemical sciences. However, well-curated experimental datasets on TM complexes with measured/computed thermodynamic properties are rare. The Cambridge structural database (CSD) partly serves this purpose by providing geometries and measured/calculated properties of TM complexes but lacks experimentally measured or computed pKa values of TM complexes. In fact, to the best of our knowledge no open datasets on experimentally measured pKa values of TM complexes along with geometric information are available. To address this we curated experimental pKa data for over 200 TM complexes from the literature (Fig. 2).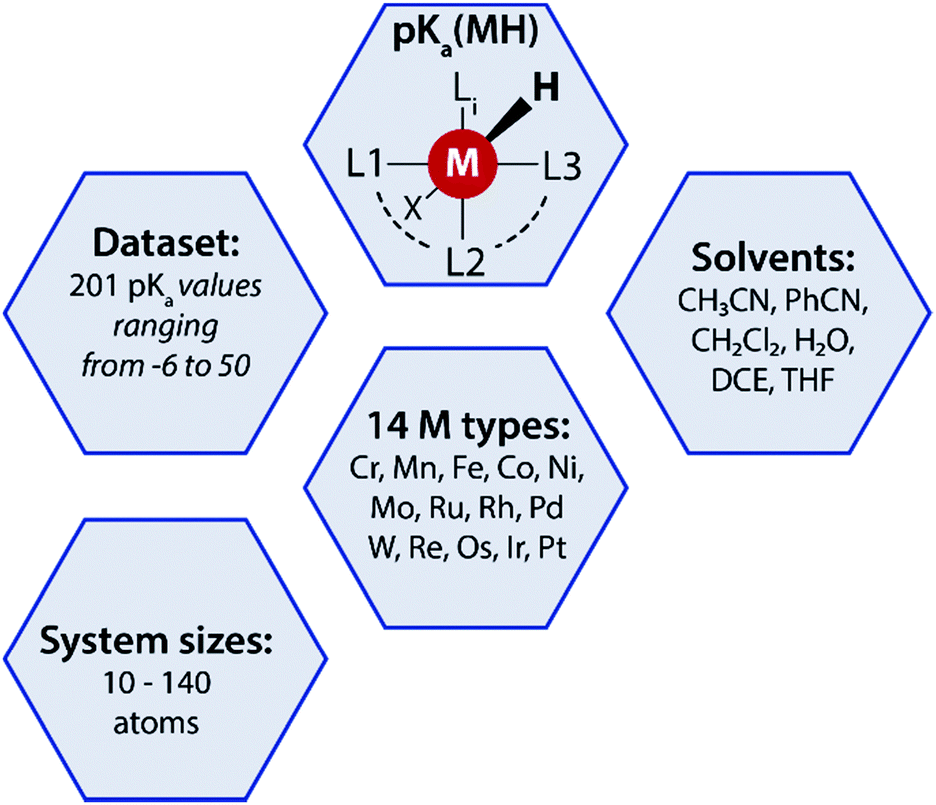 | ||
| Fig. 2 A summary of the pKa MH dataset reported in this work used for the data-augmented prediction of experimental pKa using the GFN2-xTB method. | ||
Most of these complexes are transition metal hydrides where the pKa of the M–H bond has been measured. The dataset is provided with 3D coordinates of the TM complexes (acid and conjugate base form) computed using GFN2-xTB. The dataset, referred to as pKaMH is provided as a .csv file and includes the DOI of original references and review papers that cite the measured pKa. pKaMH consists of 201 TM complexes in 6 different solvents and 14 metal centers (Fig. 2).
In the process of curating the dataset we observed that a uniform experimental method was not always used in determination of the pKa of TM hydride complexes. On many occasions the pKa was indirectly determined e.g. using linear correlations with a reduction potential or via thermodynamic cycles. In some cases where the conjugate base complex was unstable, pKa was determined by indirect methods.3,48–51 The pKa data are therefore also expected to contain errors related to the measurement/estimation method.
GFN2-xTB and DFT calculations
We computed the solvated PA for all complexes using the GBSA implicit solvation method as implemented in xTB. Fig. 3 compares the computed PA and the experimental pKa values for 172 complexes in pKaMH. Our results show that the solvated PAs based on the electronic energy (E(A) − E(AH)) (R2 = 0.74, and RMSE = 5.73), is a good descriptor of the experimental pKa. There is a minimal loss of accuracy when using PA = E(A) − E(AH) as a descriptor as compared to PA = G(A) − G(AH) (see the ESI†).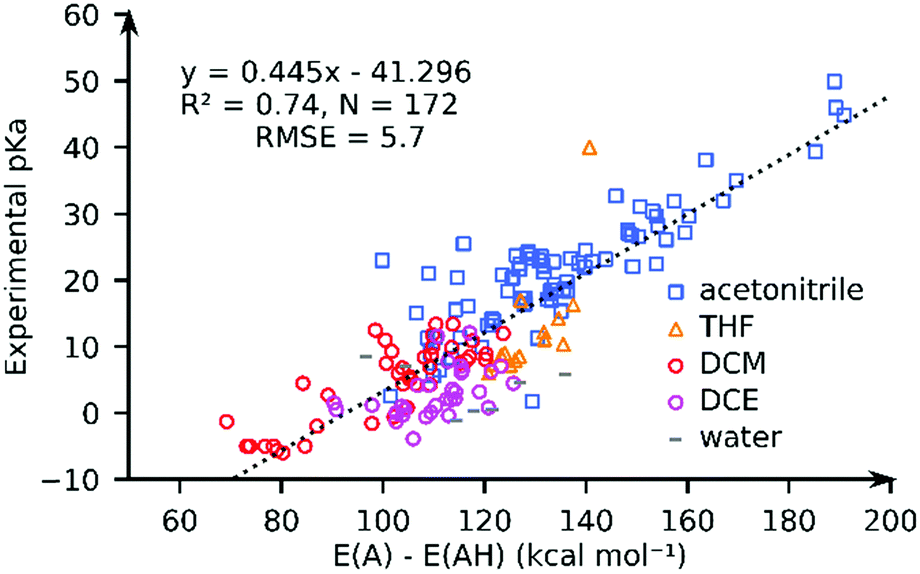 | ||
| Fig. 3 The comparison of the experimental pKa values and the GFN2-xTB-computed proton affinities (PA = E(A) − E(AH)) for TM complexes in different solvents. | ||
For individual solvents the estimation of the experimental pKa using the GFN2-xTB-computed PA results in RMSEs of 4.6 (MeCN; N = 79), 5.7 (THF; N = 14), 3.4 (DCM; N = 40) and 4.1 (DCE; N = 31) (see ESI†). A worse correlation (R2 = 0.46; RMSE = 8.2) is observed for the DFT//GFN2-xTB-computed PA. Removal of 10 outlier complexes however improved the correlation (R2 = 0.77; RMSE = 5.5). The outlier complexes mainly consisted of complexes with multiple carbonyl (CO) groups (see Fig. S22, ESI†) with the exception of complex 159 ([HFe(Py2Tstacn)]+2). The pKa of complex 159 was experimentally determined in a solvent mixture of acetonitrile and water but computed in pure acetonitrile. Our calculations suggest that GFN2-xTB may have limited accuracy in describing the M–CO bonds. This aspect is discussed later in the manuscript.
The correlation between the PA and the experimental pKa is rather surprising taking into account that different solvents are involved and the solvation free energy of proton or the PA and pKa of a reference base were not considered (eqn (1) and (4)). We speculate that this is related to a small variation in the solvation free energy of H+ across the range of solvents considered. These results indicate that PA is a good descriptor of pKa of TM complexes.52
Having computed the PA using the GFN2-xTB and DFT//GFN2-xTB methods, we turn to estimating the pKa using a full DFT approach. The DFT computed PA correlates well with the experimental pKa (R2 = 0.84, and RMSE = 4.5) (see ESI†). For individual solvent estimation of experimental pKa using DFT-computed PA results in RMSEs of 3.3 (MeCN; N = 69), 2.3 (THF; N = 13), 3.1 (DCM; N = 38) and 2.3 (DCE; N = 30) (see the ESI†).
To further assess the performance of GFN2-xTB, we compared the accuracy of DFT, DFT//GFN2-xTB and GFN2-xTB for predicting the experimental pKa of TM hydride complexes in our database in acetonitrile solvent. We have chosen acetonitrile solvent for comparison since it has the largest share in the database and it is parametrized both in Gaussian and xTB packages. We identified 69 TM complexes for which both DFT and GFN2-xTB calculations were found to converge without errors. The resulting plot is shown in Fig. 4. Going from GFN2-xTB (R2 = 0.76; RMSE = 4.3) to DFT//GFN2-xTB (R2 = 0.51; RMSE = 6.1) leads to a drastic deterioration of the predictive capability for experimental pKa. Full DFT-based predictions were found to have better correlation and higher accuracy (R2 = 0.86; RMSE = 3.3). These results further confirm that the GFN2-xTB-predicted geometries are not always close to the DFT-predicted minimum energy geometries.
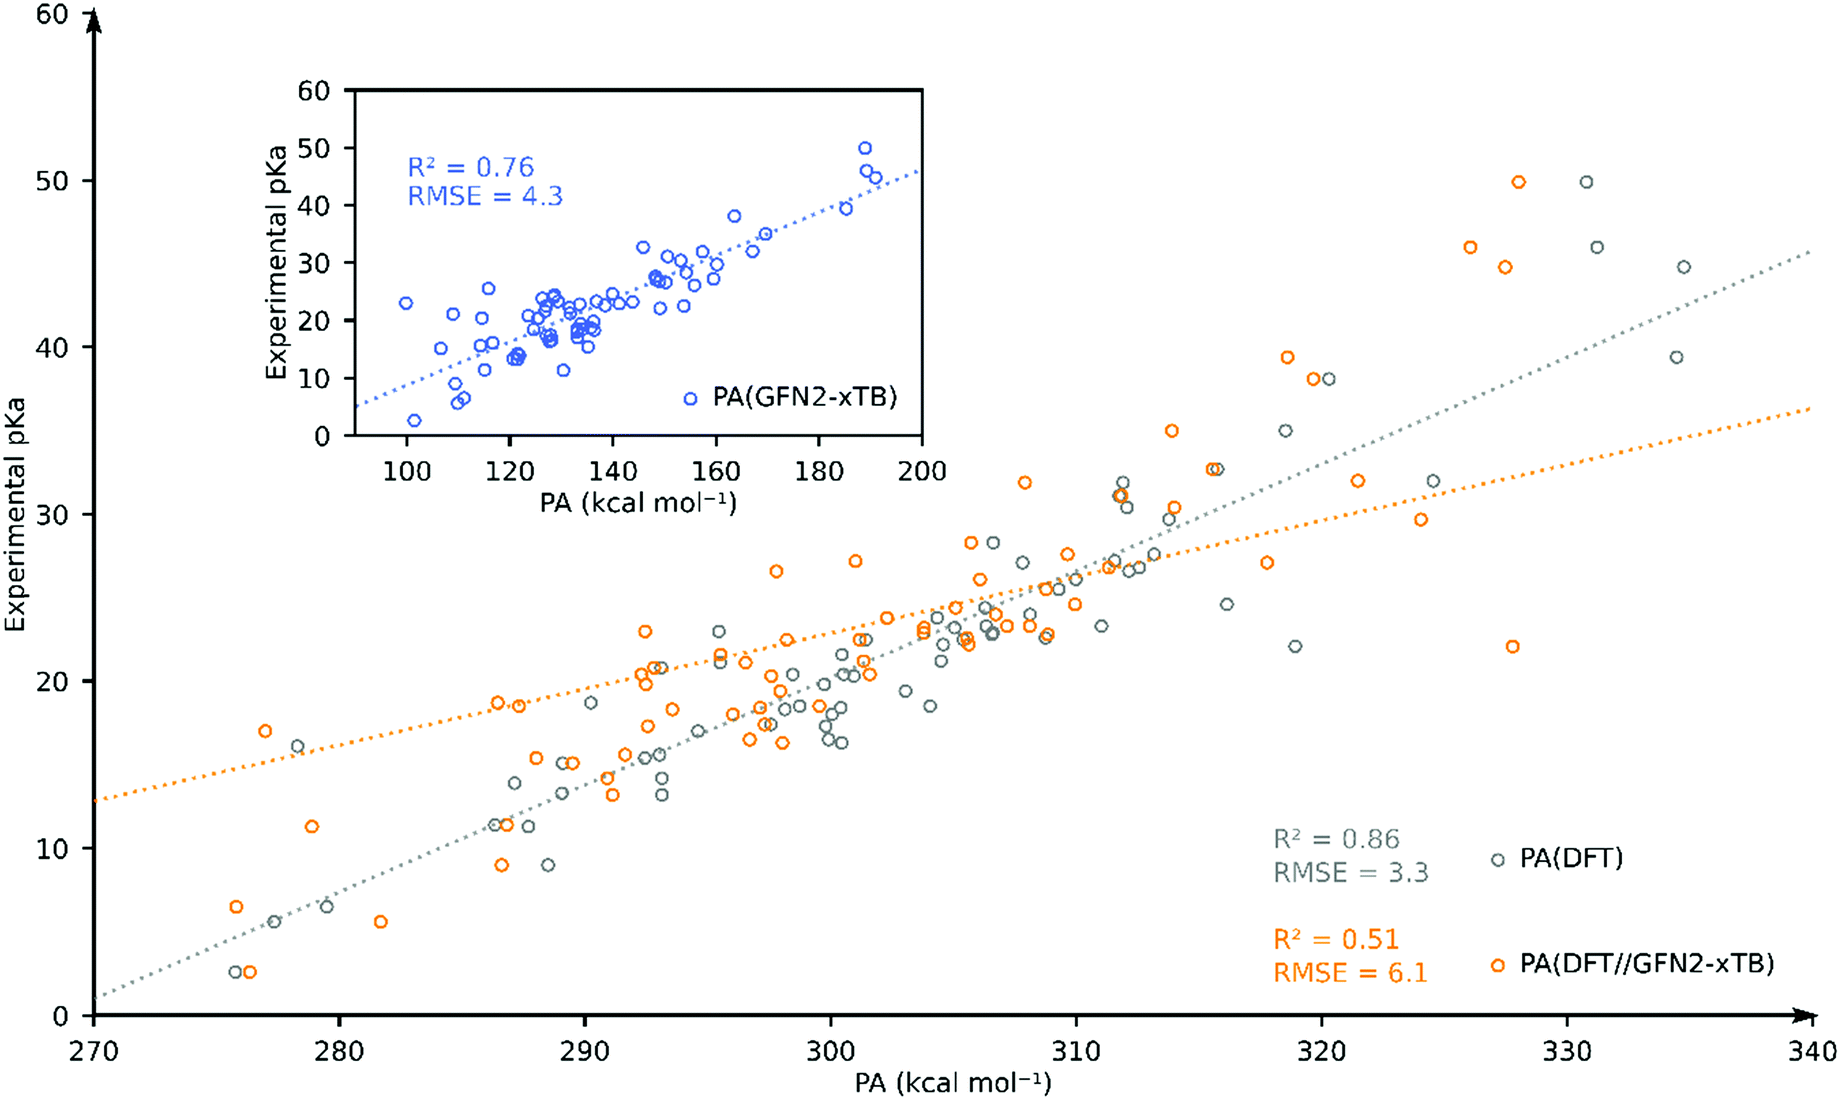 | ||
| Fig. 4 Comparison of DFT-, DFT//GFN2-xTB- and GFN2-xTB (inset)-computed pKa as the estimator of experimental pKa for 69 TM complexes in acetonitrile. | ||
To analyse this further, we analysed the difference in PA between DFT and GFN2-xTB (ΔPA = PADFT − PADFT//GFN2-xTB = e(A) − e(AH)). Here, e(A) = E(A)DFT − E(A)DFT//GFN2-xTB and e(AH) = E(AH)DFT − E(AH)DFT//GFN2-xTB are the individual errors in conjugate base (A) and acid type complexes. The mean and median values of e(A) are −35.2 kcal mol−1 and −30.6 kcal mol−1, and for e(AH) are −38.2 kcal mol−1 and −32.0 kcal mol−1, respectively. Complex 45 has a high ΔPA = −66 kcal mol−1, with e(A) = −25 kcal mol−1 and e(AH) = −91 kcal mol−1. Therefore, the conjugate base form of complex 45 can be considered to have an above-average stability, while the acid form has a high error. On the other hand, complex 43, which has a low ΔPA = −1.4 kcal mol−1 has e(A) = −45.6 kcal mol−1 and e(AH) = −47 kcal mol−1. Therefore, both the acid and conjugate base forms for complex 43 have high error.
Complex 43 therefore has a lower overall error in PA due to favourable error cancellation on the conjugate acid and base forms. The mean and median of the absolute ΔPA were found to be 6.2 and 3.3 kcal mol−1, respectively, with a rather large standard deviation of 10.7 kcal mol−1 indicating an overall good agreement between DFT and GFN2-xTB with some highly skewed cases of large disagreement. The sign of ΔPA determines whether the acid (AH) or the base (A) form of the complex has a larger error as compared to DFT. ΔPA < 0 indicates a larger error in the acid form (AH) of the complex, while ΔPA > 0 denotes that the conjugate base form (A) contributes to the overall error. Complexes (in acetonitrile) that featured a |ΔPA| > 5 kcal mol−1 have been tabulated in Table 1. The majority of complexes have a negative ΔPA indicating the higher instability of the AH forms of geometries computed by GFN2-xTB as compared to DFT.
| Index | Complex | e(A)/kcal mol−1 | e(AH)/kcal mol−1 | ΔPA/kcal mol−1 |
|---|---|---|---|---|
| 7 | [Ni((P(Ph))2(N(Bn))2)2] | −64.7 | −69.8 | −5.1 |
| 15 | [Ni((P(Cy))2(N(t-Bu))2)2] | −54.1 | −60.2 | −6.2 |
| 16 | [Ni((P(Cy))2(N(Ph))2)2] | −59.3 | −66.5 | −7.2 |
| 25 | [Pd(PNP)2] | −44.8 | −35.9 | 8.9 |
| 28 | [Pd(depx)2] | −37.6 | −44.8 | −7.3 |
| 30 | [Pd(EtXantphos)2] | −54.8 | −66.3 | −11.4 |
| 26 | [Pt(PNP)2] | −63.8 | −71.1 | −7.3 |
| 32 | [Rh((P(Ph))2(N(PhOMe))2)2]− | −66.2 | −82.1 | −15.9 |
| 33 | [Rh((P(Cy))2(N(Ph))2)2]− | −59.5 | −64.6 | −5.2 |
| 45 | [CpCr(CO)3] | −25.4 | −91.3 | −66.0 |
| 46 | [CpMo(CO)3]− | −12.4 | −60.9 | −48.5 |
| 47 | [CpW(CO)3]− | −10.0 | −48.8 | −38.9 |
| 52 | [Co(CO)3P(OPh)3]− | −19.2 | −28.0 | −8.8 |
| 56 | [HCp*Mo(CO)3]+ | −17.6 | −77.6 | −60.0 |
| 62 | [CpW(CO)2(PMe3)]− | −12.2 | −26.6 | −14.4 |
| 64 | [Mn(CO)4(PPh3)]− | −21.8 | −28.0 | −6.2 |
| 75 | [CpFe(CO)2]− | −25.9 | −16.0 | 10.0 |
| 78 | [Cp*Fe(CO)2]− | −30.6 | −20.3 | 10.3 |
| 100 | [Cp*Cr(CO)3]− | −38.1 | −55.7 | −17.6 |
| 102 | [CpCr(CO)2(IMe)]− | −41.9 | −52.4 | −10.5 |
A cursory analysis of entries in Table 1 reveals that the complexes with |ΔPA| > 5 kcal mol−1 either contain phosphine-based ligands or multiple CO ligands or both. To compare the DFT and GFN2-xTB predicted geometries we made structure overlay plots of the acid and conjugate base forms of selected complexes, which are presented in Fig. 5. The Pd-based PNP complex (25) shows a moderate ΔPA of 8.9 kcal mol−1. The structure overlay figure (Fig. 5) reveals that the GFN2-xTB optimization results in hemi-labile PNP coordination in the [Pd(PNP)2] complex, which probably contributes to a higher error for the conjugate base form. Contrastingly such hemi-labile coordination was not observed for the acid form of the complex [HPd(PNP)2]+. For complex 30, the planarity of the phenathroline ring is misrepresented in the acid form of the complex leading to a negative ΔPA of −11.4 kcal mol−1.
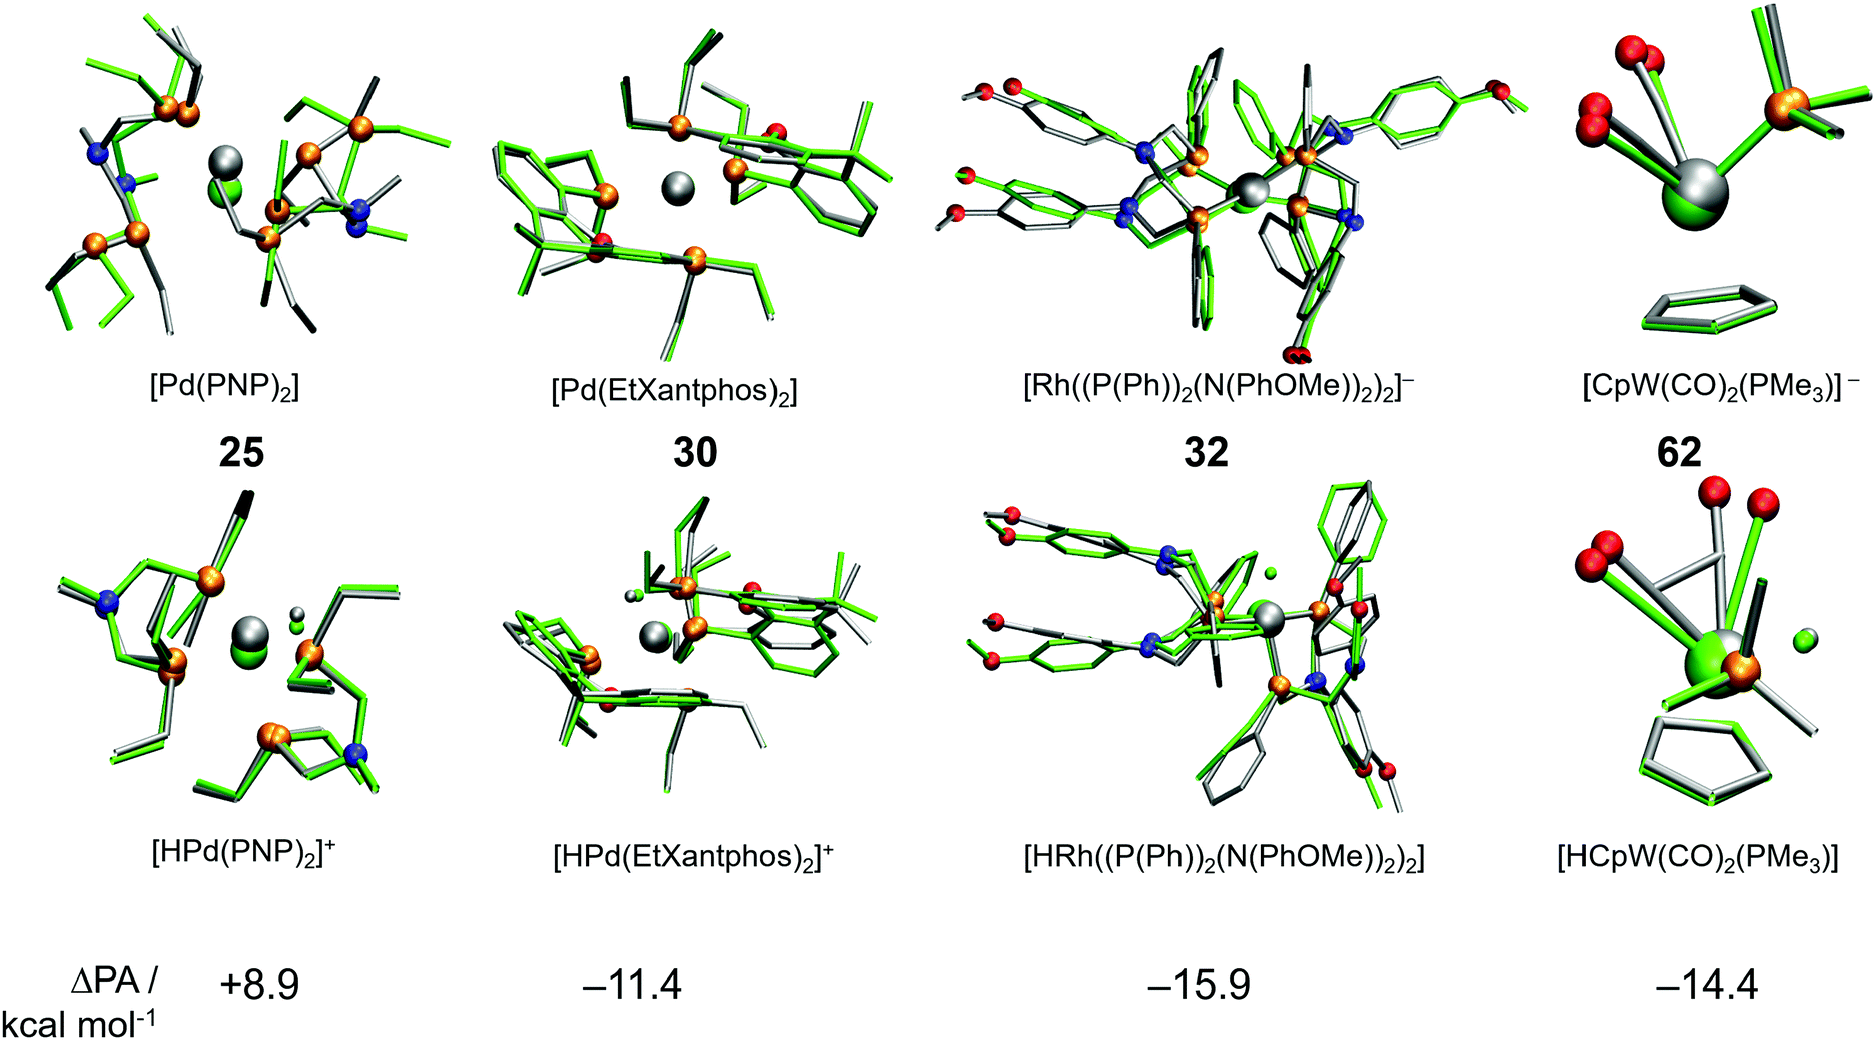 | ||
| Fig. 5 Structure overlay plots of acid and base forms of some selected TM complexes optimized using GFN2-xTB (silver) and DFT (green). The top row shows conjugate base forms, while the bottom row shows the acid forms of complexes 25, 30, 32 and 62. | ||
Similarly, the mismatch in orientation of benzene rings between GFN2-xTB and DFT in the acid form of complex 32 leads to a ΔPA of −15.9 kcal mol−1. Interestingly for the dicarbonyl W complex 62 with a PMe3 ligand, the energy difference between acid and base forms are both relatively low. However, the acid form is more destabilized due to an underestimated CCO–W–CCO angle leading to a ΔPA of −14.4 kcal mol−1. In comparison, complex 7 has a ΔPA of −5.1 kcal mol−1 but energy differences in excess of 60 kcal mol−1 for the acid and base forms (Table 1). The higher magnitude of ΔPA of complex 62 despite better individual agreements of both the acid and base forms with DFT stresses the importance of error cancellation in computing thermochemical properties at the DFT//GFN2-xTB level of theory.
Analysis of molecular geometries of the di-carbonyl complexes [CpW(CO)2(PMe3)]− (62), [CpFe(CO)2]− (75), [Cp*Fe(CO)2]− (78) and [CpCr(CO)2(IMe)]− (102) revealed that the CCO–M–CCO angle is in general underestimated (by 12.2°, 13.3°, 16.5° and 36.2°, respectively), in the conjugate base form of these complexes by GFN2-xTB. The increasing underestimated angles are reflected in larger energy differences for these complexes as well (Table 1). Interestingly the CCO–M–CCO does not have a large deviation in the acid forms of complexes 75 and 78 (also see Fig. S21, ESI†). In contrast, the acid form of complex 62 has an underestimated CCO–M–CCO angle (∼23°), and complex 102 features largely (>30°) underestimated CCO–M–CCO angles in both acid and conjugate base forms. Therefore, the erroneous representation of the CCO–M–CCO angle or M–CO bonding in general is not systematically present in all complexes. The tricarbonyl complexes 45–47 and 56 all feature a very large and negative ΔPA stemming from highly destabilized acid forms of these complexes (Fig. 6). The structure plots of complexes 45–47 and 56 in their acid forms reveal the inaccurate description of M–CO bonding in GFN2-xTB.
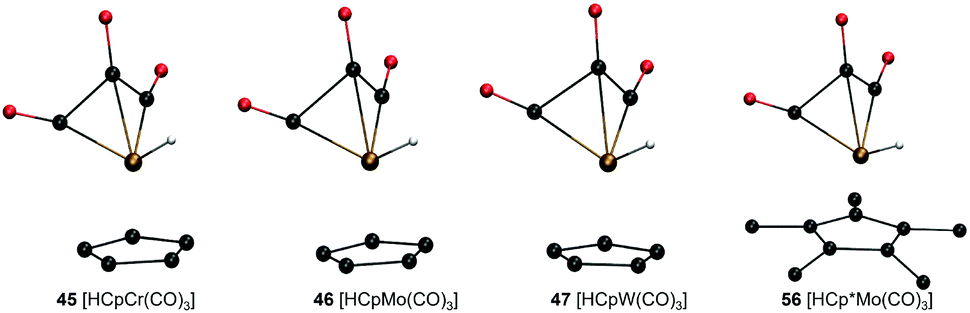 | ||
| Fig. 6 GFN2-xTB-optimized geometries of three tri-carbonyl metal hydride acids with Cp/Cp* ligand and different metal centers. | ||
The CCO–M–CCO angles between adjacent CO moieties are largely underestimated, for example by ∼35° in complex 45 (acid form). It can therefore be inferred that the GFN2-xTB-optimized geometries are less reliable for metal carbonyl complexes. The unsystematic nature of the error makes prediction of pKa unreliable using the GFN2-xTB-optimized geometries. The prediction of PA involves taking an energy difference between the A and AH type conjugate base–acid complexes. This results in scenarios where favourable cancellation of error is possible. For example, complexes 45–47 and 56 have absolute errors (difference between predicted pKa and experimental pKa) of 30–38 pKa units, respectively, at the DFT//GFN2-xTB level of theory. However, the absolute errors on pKa predicted by the stand-alone GFN2-xTB calculations on the same complexes are between 1.0–3.8 pKa units indicating a favourable error cancellation at the GFN2-xTB level of theory. Therefore, despite inaccurate representation of M–CO bonding the GFN2-xTB method gives consistent results when used as a standalone demonstrating its robust thermochemical predictive power. Moreover, examining the geometric overlays in Fig. 5 the overlap of GFN2-xTB-predicted and DFT-predicted geometries have a good agreement in general despite significant mismatch for CO ligands. For example, the Cp/Cp* ligands seem to overlap very well between the geometries predicted by two methods.
Apart from the poor description of M–CO type complexes a notable challenge for the GFN2-xTB method was identified to be its convergence failure for complexes with multiple hydrides. We found 16 TM complexes for which at least one or both of the base and acid forms did not converge. With the exception of the dinitrogen complex [HCr(N2)((P(Ph))3(N(Bn))3)(dmpe)]+ (index 97) for which the reason for convergence failure is not understood, all of these complexes have multiple M–H bonds indicating that the GFN2-xTB method faces problems with such systems.
Machine learning experimental pKa using GFN2-xTB
Given the stand-alone performance of the GFN2-xTB methods in predicting experimental pKa, it can be considered robust and a good starting point for thermochemical property calculations. We seek to improve the predictive capability of GFN2-xTB using a data-augmented approach. Our hypothesis is that GFN2-xTB already provides good geometric and energetic predictions. These predictions when used as features in an ML model, can be used to learn the experimental pKa. We therefore use GFN2-xTB-computed molecular geometries and energetic features to learn the experimental pKa of TM complexes. The choice of features is driven by intuition and physical reasoning in the present work. A more rigorous and automated approach towards construction and identification of relevant features from DFT-B calculations is an ongoing effort in our group.We selected a set of 17 features, which include the HOMO and LUMO energies of AH and A, DFT-B computed partial charges on metal (AH and A) and hydrogen (which is to be deprotonated), atomic number, coordination number and coordination environments of metal centre in AH and A, dielectric constant of the solvent, solvated and gas phase PA, M–H bond length and total charge on AH complex (Table 2). Note that the total size of the dataset used for ML (168) is smaller than the dataset, for which experimental pKa values have been curated. For 16 TM complexes DFT-B calculations did not converge (vide supra). We excluded complexes with multiple metal centres from our analysis (7 entries). Moreover, some complexes had ambiguous pKa or pKa values that were later revised in the literature (5 + 3 entries), and 3 entries are actually those of ligand pKa. We applied an ordinary least squares fitting on 80% of the dataset to learn the experimental pKa and use 20% of the dataset for testing the prediction learnt by the model. The results are presented in Fig. 7.
| ML features | Weight features – linear model | ML features | Weight features – linear model |
|---|---|---|---|
| M = metal centre; cc = sum of atomic number of all elements that are coordinated to M; epsilon = dielectric constant of solvent; charge (AH) = total charge on AH complex; charge metal (A/AH) = charge computed on M via population analysis of DFT-B-computed electron density. | |||
| Solvated PA | −40.20 | Gas PA | −3.95 |
| HOMO (A) | 11.08 | HOMO (AH) | 2.86 |
| LUMO (A) | −2.42 | LUMO (AH) | −70.11 |
| Charge (AH) | −5.22 | Epsilon | −0.015 |
| Charge metal (A) | −11.45 | Charge metal (AH) | 14.15 |
| M–H max (AH) | −8.23 | Charge hydride (AH) | 23.03 |
| Coordination number (A) | 30.65 | Coordination number (AH) | −6.03 |
| cc (A) | −10.73 | cc (AH) | −7.33 |
| Metal centre | 4.17 | ||
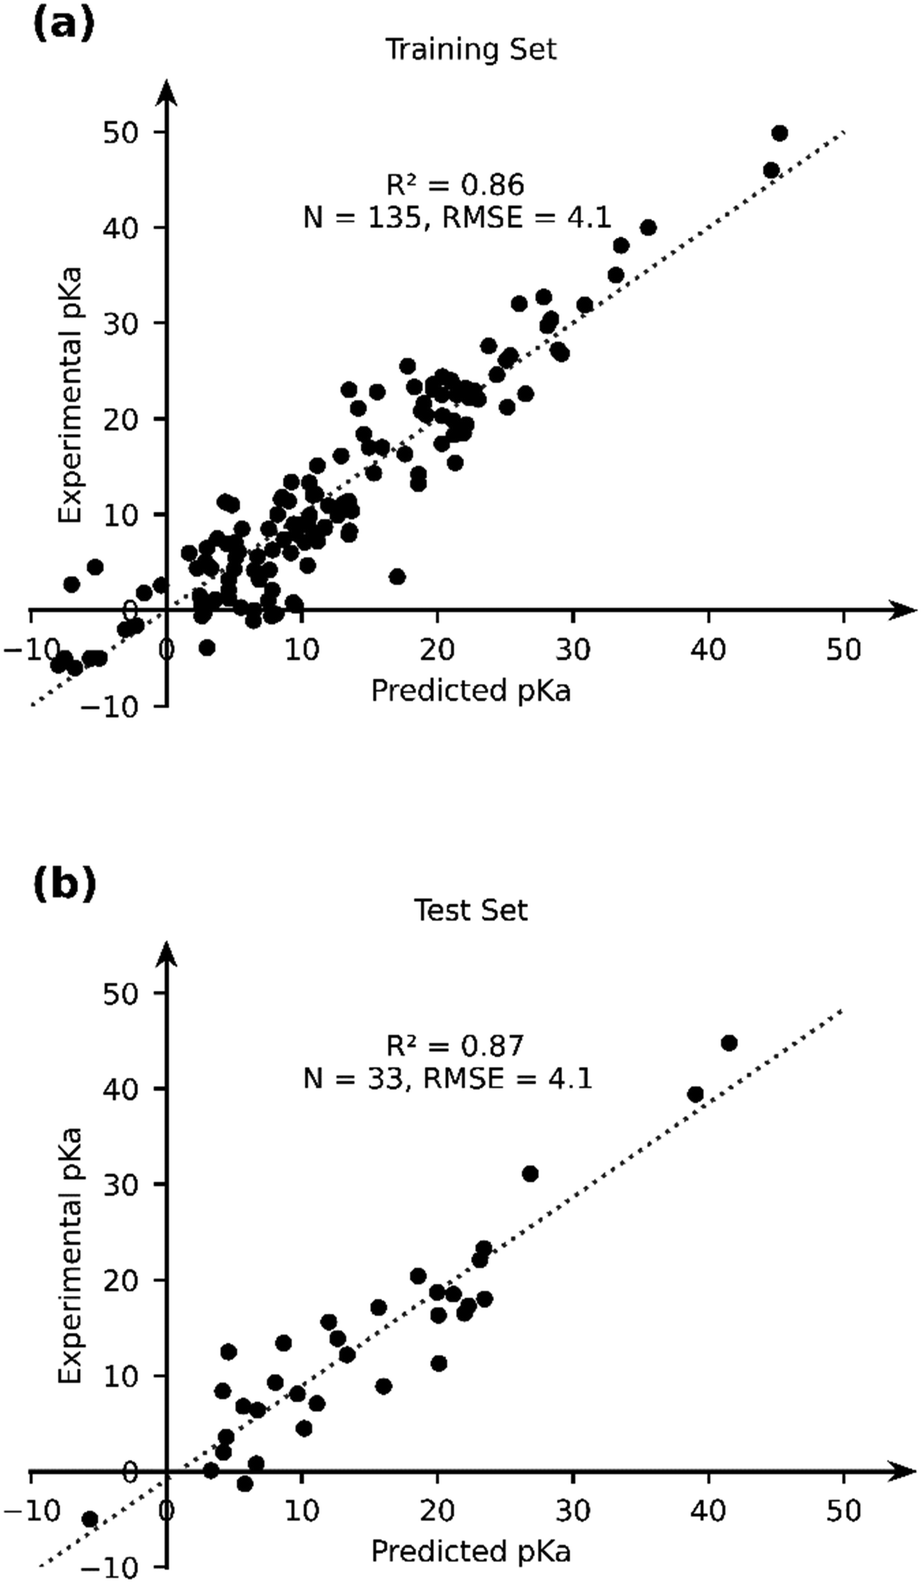 | ||
| Fig. 7 The comparison of the experimental and OLS-predicted pKa values in (a) the training and (b) test sets. | ||
The OLS model leads to a significant improvement in the predicting power of the DFT-B method for the pKa of TM complexes in the database resulting in an R2 of ∼0.87 and an RMSE of ∼4.1 pKa units (Fig. 7). Next, we explored the AutoML method provided by the auto-sklearn library in python. The details of the model are described in the Computational methods section. The AutoML model found that the K nearest neighbour (k-NN) algorithm performed the best on our dataset. The complete ensemble of the learned ML algorithms is presented in the ESI.† The AutoML model resulted in an R2 = 0.94 and an RMSE = 2.7 for the test set (Fig. 8). The AutoML model therefore outperforms OLS and has similar accuracy to that of pure DFT.
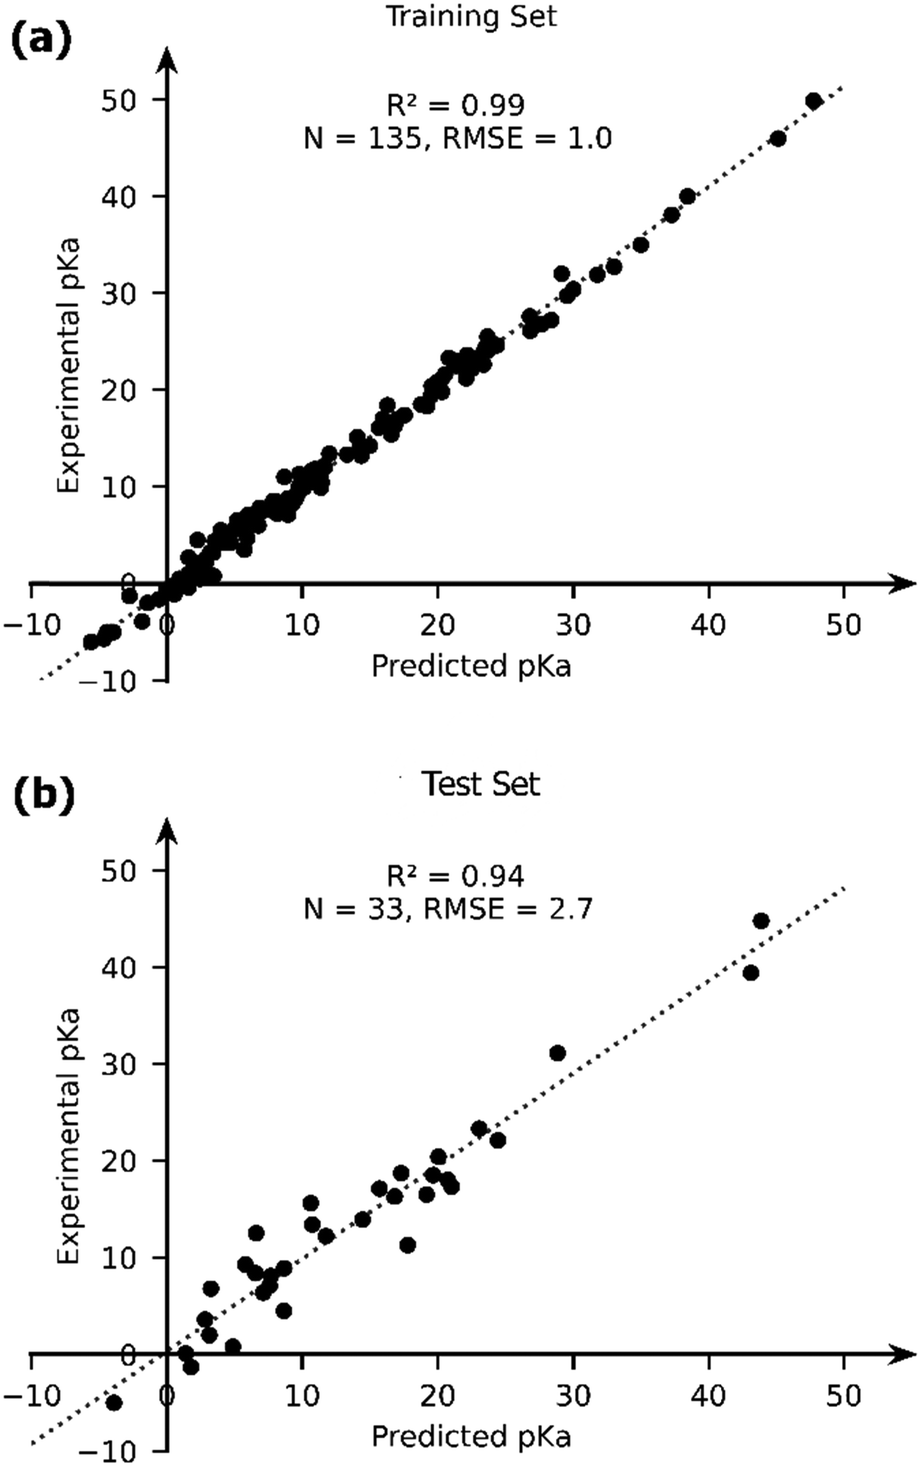 | ||
| Fig. 8 The comparison of the experimental and AutoML-predicted pKa values in the (a) training and (b) test sets. | ||
A particularly notable case is the WH(CO)3(C5H4COO−) complex (index 99 in pKa MH), for which an experimental pKa of 5.8 has been reported in water.53 The OLS model predicted a pKa of 21.1 for this complex. Consistently a pKa of 18.0 is predicted by the LAC method.26 The AutoML model predicted a pKa of 17.0 for this complex. This is the only anionic acid in the database, which could be the reason for erroneous predictions by various models. This complex is therefore considered an outlier and it is excluded from training/test sets and is not plotted in Fig. 7 and 8.
We used the DFT, GFN2-xTB, OLS and autoML models to estimate the pKa of complexes with multiple/revised pKa in the literature and ligand pKa. We further added 7 additional complexes, for which ligand pKa were reported in the literature. Note that the ML models are purely trained on the pKa of metal hydrides and have never encountered ligand pKa. The assignment of ligand pKa tests the generality and transferability of our ML models. Furthermore, these test cases allow us to compare the accuracy of DFT, GFN2-xTB, OLS and AutoML models on an equal footing (Table 3).
| Species | Index | Exp. pKa | OLS | AutoML | DFT | GFN2-xTB |
|---|---|---|---|---|---|---|
| a Using [H(η6-C6H6)Mn(CO)2] (index 67 in pKaMH) as a reference. b Using [H2Cp*Ru(PMe3)2]+ (index 200 in pKaMH) as a reference. c Based on the reaction with HOTf, which has a pKa of −5 in water. d Using [(H2)Fe(CNH)(depe)2]+2 (index 147 in pKaMH) as a reference. e These are not pKa values but relative acidities on a pK scale in CD2Cl2. See ref. 57. f Computed using [H2Fe(CO)4] (index 53 in pKaMH) as a reference. g Computed using [H2Ru(CO)4] (index 57 in pKaMH) as a reference. | ||||||
| Ligand pKa | ||||||
| [(η3-C6H9)Mn(CO)3] | 66 | 22.2 | 27.6 | 17.6 | 30.0 (26.8a) | 22.3 |
| [(PNP)Ru]+ | 73 | 20.7 | 24.3 | 12.3 | 18.6 (21.3b) | 30.2 |
| [(PNP)Ru–CO2] | 74 | 24.6 | 32.7 | 21.5 | 26.5 (32.6b) | 31.9 |
| RMSE | 6.0 | 5.8 | 4.8 (5.3) | 6.9 | ||
| [Rh(trop2NH)tropNH2]+ | — | 20.154 | 24.9 | 21.5 | — | |
| [Rh(trop2NH)bipy]+ | — | 18.755 | 27.4 | 22.8 | — | |
| [Rh(trop2dach)]+ | — | 15.754 | 22.2 | 19.8 | — | |
| [Ir(trop2NH)phen(H,H)]+ | — | 18.256 | 21.7 | 23.4 | — | |
| [Rh(trop2NH)phen(H,H)]+ | — | 18.656 | 27.5 | 22.9 | — | |
| [Rh(trop2NH)phen(Me,H)]+ | — | 19.056 | 28.4 | 23.2 | — | |
| [Rh(trop2NH)phen(Ph,H)]+ | — | 18.756 | 27.6 | 22.8 | — | |
| RMSE | 7.5 | 4.0 | ||||
| Ambiguous pKa reported in literature | ||||||
| [(H2)Fe(CO)(dppe)2]2+ | 124 | <−5c | −13.4 | −1.9 | −4.6 (−9.5d) | −3.8 |
| [HFe(CO)3(Ptol3)2]+ | 136 | 0.1e | 3.9 | 2.3 | 7.0 (10.6d) | 8.1 |
| [HFe(CO)3(PPh3)2]+ | 137 | −1.1e | 2.6 | 0.5 | 6.0 (9.0d) | 7.3 |
| [HFe(CO)3(PPh2Cy)2]+ | 139 | 1.3e | 3.8 | 1.7 | 7.0 (9.1d) | 8.3 |
| [HFe(CO)3(PCy3)2]+ | 155 | 4.4e | 5.6 | 4.2 | 7.9 (8.7d) | 9.3 |
| pKa values revised in literature | ||||||
| [HCpFe(CO)2] | 75 | 27.1 | 23.7 | 27.4 | 25.2 (27.4f) | 26.7 |
| [HCpRu(CO)2] | 76 | 28.3 | 27.2 | 29.7 | 24.5 (29.8g) | 28.9 |
| [HCp*Fe(CO)2] | 78 | 29.7 | 26.4 | 28.2 | 29.0 (30.2f) | 31.2 |
| RMSE | 2.8 | 1.2 | 2.5 (0.9) | 1.0 | ||
Ligand pKa for complexes 66, 73 and 74 proved difficult to predict for all the methods. GFN2-xTB performed worse (RMSE = 6.9), followed by OLS (RMSE = 6.0), AutoML (RMSE = 5.8) and DFT (RMSE = 4.8). For the Trop2 family of complexes, which are not a part of pKaMH, the AutoML model performs well with an RMSE of 4.0, while OLS showed a high RMSE of 7.5 indicating poor transferability of the OLS model. An estimated pKa < −5 was established for complex 124 based on its reactivity with HOTf (aqueous pKa = −5).58 Using the correlation of the DFT-computed PA with exp. pKa, we estimated a pKa of −0.5 for HOTf. Therefore, the pKa of complex 124 is expected to be <−0.5 in contrast to −5 as reported earlier.58 OLS predicts a highly negative pKa of −13.4. AutoML, DFT (using linear scaling relation) and GFN2-xTB predict similar pKa values of −1.9, −4.6 and −3.8, respectively. DFT calculations using a reference base predicts a more negative value of −9.5. While all values are <−0.5, the variation in predictions make it difficult to assign a particular value to the pKa of complex 124.
For complexes 136, 137, 139 and 155 pKa values have not been measured in the literature, but rather an acidity scale was set up in CD2Cl2.57 Both the DFT and GFN2-xTB methods consistently predict higher pKa values for these complexes in contrast to OLS and AutoML, which predict smaller values. If we consider the relative acidities as per the acidity scale, pKa should follow 137 < 136 < 139 < 155. Only AutoML and GFN2-xTB predicted pKa to follow this trend. For complexes 75, 76 and 78 the literature values were erroneously reported earlier and were corrected in subsequent studies.59 All four approaches work well with low RMSE values in predicting the pKa of complexes 75, 76 and 78.
Experimentally measured pKa values typically have an error in the order of 1 pKa units. To the best of our knowledge, a comprehensive benchmark for the performance of computational methods towards prediction of experimental pKa of TM complexes does not exist. AIMD simulations have been applied to compute the aqueous phase ligand pKa of TM complexes and are reported to have an error of 1–2 pKa units.13 Qi and co-workers performed CCSD(T) and DFT calculations using the ONIOM model to estimate the experimental pKa of 30 TM hydrides in acetonitrile solvent. They reported RMSEs of 1.5 and 2.6 pKa units for CCSD(T) and DFT results, respectively. The RMSEs for the current DFT results in different solvents range from 2.3 to 3.3 pKa units (see ESI†), which is comparable to the results reported by Qi and co-workers. Furthermore, the RMSE of 2.7 pKa units obtained using auto-sklearn is comparable to the accuracy achieved with DFT calculations.
Summary and conclusions
In this manuscript we identify and address some of the key challenges for accurate and rapid prediction of thermochemical properties of TM complexes using quantum chemical approaches. We applied and compared two quantum chemical methods: semiempirical GFN2-xTB and hybrid DFT. Using pKa as a model thermochemical problem we first curated a novel dataset pKaMH composed of pKa of ∼200 TM hydride complexes. Our calculations revealed that PA is a good descriptor of experimental pKa. We further discovered that the computationally expensive Hessian calculations can be avoided when using PA to estimate experimental pKa values. Comparison of DFT and DFT//GFN2-xTB calculations revealed that while GFN2-xTB-predicted geometries are close to DFT-predicted geometries, significant errors can occur in the case of metal carbonyl complexes due to inaccurate representation of chemical bonding of M–CO functions. We further found out that despite such inaccurate geometric representations the GFN2-xTB method is robust for thermochemical property predictions when used as a standalone. However, direct use of GFN2-xTB-optimized geometries for DFT-based single-point calculations is not recommended due to the unsystematic nature of errors posed by the GFN2-xTB-optimized geometries. The GFN2-xTB method faced convergence issues for multi-hydride TM complexes.Using a data-augmented approach we computed features from GFN2-xTB and trained two different ML models to learn experimental pKa values. The OLS method resulted in a reasonable accuracy (R2 = 0.87, and RMSE = 4.1), which is comparable albeit inferior to DFT-based predictions. The autoML approach using auto-sklearn library improved the performance of the GFN2-xTB approach to near DFT accuracy with an R2 of 0.94 and an RMSE of 2.7 on the test set. We further tested the ML models to predict the pKa of TM complexes, which underwent deprotonation at the ligands. Even though the ML models were trained on TM-hydrides the AutoML model performed reasonably well for predicting ligand pKa values showing its transferability.
Our calculations identify challenging cases for predicting geometry and thermochemical properties of TM complexes using GFN2-xTB methods. We further demonstrate the promise of the GFN2-xTB method as a robust, fast and accurate semiempirical method for calculating thermochemical properties of TM complexes. Our data-augmented approach using an AutoML approach can rapidly predict accurate experimental pKa of TM complexes using GFN2-xTB calculations at near DFT accuracy. The data-augmented GFN2-xTB approach developed in this work is promising for development of high throughput computational screening workflows for discovering TM catalysts. We expect pKaMH to accelerate development and application of data-driven chemistry approaches for TM complexes. Further extension of this dataset with ligand pKa values of TM complexes and automated construction of features for use in the ML models are ongoing efforts in our group.
Author contributions
J. J. L. carried out DFT and GFN2-xTB calculations under the supervision of V. S. V. S. conceived the project and performed machine learning calculations. E. A. P. played an advisory role and directed the project. All the authors discussed the results and wrote the manuscript.Conflicts of interest
There are no conflicts of interest to declare.Acknowledgements
V. S. acknowledges the ARC-CBBC project 2016.008 for funding. E. A. P. acknowledges the financial support from the European Research Council (ERC) under the European Union's Horizon 2020 Research and Innovation Programme (grant agreement no. 725686). The authors thank the Netherlands Organization for Scientific Research (NWO) for the access to SURFsara computational facilities and SURF Cooperative for support. The authors thank Mr Menno Geerdes for helping with GFN2-xTB computed data on trop2 family of complexes. This work was carried out on the Dutch national e-infrastructure.Notes and references
- K. M. Waldie, A. L. Ostericher, M. H. Reineke, A. F. Sasayama and C. P. Kubiak, ACS Catal., 2018, 8, 1313–1324 CrossRef CAS.
- N. Govindarajan, V. Sinha, M. Trincado, H. Grützmacher, E. J. Meijer and B. Bruin, ChemCatChem, 2020, 12, 2610–2621 CrossRef CAS.
- C. J. Curtis, A. Miedaner, J. W. Raebiger and D. L. DuBois, Organometallics, 2004, 23, 511–516 CrossRef CAS.
- P. Verma and D. G. Truhlar, Trends Chem., 2020, 2, 302–318 CrossRef CAS.
- A. Jaoul, G. Nocton and C. Clavaguéra, ChemPhysChem, 2017, 18, 2688–2696 CrossRef CAS PubMed.
- K. D. Vogiatzis, M. V. Polynski, J. K. Kirkland, J. Townsend, A. Hashemi, C. Liu and E. A. Pidko, Chem. Rev., 2019, 119, 2453–2523 CrossRef CAS PubMed.
- M. D. Wodrich, B. Sawatlon, E. Solel, S. Kozuch and C. Corminboeuf, ACS Catal., 2019, 9, 5716–5725 CrossRef CAS.
- O. A. von Lilienfeld, K. R. Müller and A. Tkatchenko, Nat. Rev. Chem., 2020, 4, 347–358 CrossRef.
- B. Meyer, B. Sawatlon, S. Heinen, O. A. V. Lilienfeld and C. Corminboeuf, Chem. Sci., 2018, 9, 7069–7077 RSC.
- M. D. Wodrich, A. Fabrizio, B. Meyer and C. Corminboeuf, Chem. Sci., 2020, 11, 12070–12080 RSC.
- J. P. Janet and H. J. Kulik, J. Phys. Chem. A, 2017, 121, 8939–8954 CrossRef CAS PubMed.
- C. Bannwarth, S. Ehlert and S. Grimme, J. Chem. Theory Comput., 2019, 15, 1652–1671 CrossRef CAS.
- N. Govindarajan, H. Beks and E. J. Meijer, ACS Catal., 2020, 10, 14775–14781 CrossRef CAS.
- V. Sinha, N. Govindarajan, B. D. Bruin and E. J. Meijer, ACS Catal., 2018, 8, 6908–6913 CrossRef CAS PubMed.
- J. Ho and M. L. Coote, Theor. Chem. Acc., 2009, 125, 3–21 Search PubMed.
- Q. Zeng, M. R. Jones and B. R. Brooks, J. Comput. – Aided Mol. Des., 2018, 32, 1179–1189 CrossRef CAS.
- S. V. Jerome, T. F. Hughes and R. A. Friesner, J. Phys. Chem. B, 2014, 118, 8008–8016 CrossRef CAS.
- G. Galstyan and E.-W. Knapp, J. Comput. Chem., 2015, 36, 69–78 CrossRef CAS PubMed.
- R. Gilson and M. C. Durrant, Dalton Trans., 2009, 10223–10230 RSC.
- C. Grauffel, B. Chu and C. Lim, Phys. Chem. Chem. Phys., 2018, 20, 29637–29647 RSC.
- X. J. Qi, L. Liu, Y. Fu and Q. X. Guo, Organometallics, 2006, 25, 5879–5886 CrossRef CAS.
- R. Casasnovas, J. Ortega-Castro, J. Donoso, J. Frau and F. Muñoz, Phys. Chem. Chem. Phys., 2013, 15, 16303–16313 RSC.
- A. S. Guan, I. X. Liang, C. X. Zhou and T. R. Cundari, J. Phys. Chem. A, 2020, 124, 7283–7289 CrossRef.
- N. Govindarajan, V. Sinha, M. Trincado, H. Grützmacher, E. J. Meijer and B. Bruin, ChemCatChem, 2020, 12, 2610–2621 CrossRef CAS.
- M. Schilling and S. Luber, Inorganics, 2019, 7, 73 CrossRef CAS.
- R. H. Morris, Chem. Rev., 2016, 116, 8588–8654 CrossRef CAS PubMed.
- F. X. Christopher Zhou, W. M. Grumbles and T. R. Cundari, Using Machine Learning to Predict the pKa of C–H Bonds. Relevance to Catalytic Methane Functionalization, ChemRxiv, 2020 DOI:10.26434/chemrxiv.12646772.v1.
- P. Pracht, R. Wilcken, A. Udvarhelyi, S. Rodde and S. Grimme, J. Comput. – Aided Mol. Des., 2018, 32, 1139–1149 CrossRef CAS PubMed.
- D. Balcells and B. B. Skjelstad, J. Chem. Inf. Model., 2020 DOI:10.1021/acs.jcim.0c01041.
- S. Grimme, C. Bannwarth and P. Shushkov, J. Chem. Theory Comput., 2017, 13, 1989–2009 CrossRef CAS PubMed.
- C. Bannwarth, S. Ehlert and S. Grimme, J. Chem. Theory Comput., 2019, 15, 1652–1671 CrossRef CAS PubMed.
- C. Bannwarth, E. Caldeweyher, S. Ehlert, A. Hansen, P. Pracht, J. Seibert, S. Spicher and S. Grimme, Wiley Interdiscip. Rev.: Comput. Mol. Sci., 2020, e01493, DOI:10.1002/wcms.1493.
- W. Clark Still, A. Tempczyk, R. C. Hawley and T. Hendrickson, J. Am. Chem. Soc., 1990, 112, 6127–6129 CrossRef.
- T. Ooi, M. Oobatake, G. Némethy and H. A. Scheraga, Proc. Natl. Acad. Sci. U. S. A., 1987, 84, 3086–3090 CrossRef CAS PubMed.
- M. J. Frisch, G. W. Trucks, H. B. Schlegel, G. E. Scuseria, M. A. Robb, J. R. Cheeseman, G. Scalmani, V. Barone, G. A. Petersson, H. Nakatsuji, X. Li, M. Caricato, A. V. Marenich, J. Bloino, B. G. Janesko, R. Gomperts, B. Mennucci, H. P. Hratchian, J. V. Ortiz, A. F. Izmaylov, J. L. Sonnenberg, D. Williams-Young, F. Ding, F. Lipparini, F. Egidi, J. Goings, B. Peng, A. Petrone, T. Henderson, D. Ranasinghe, V. G. Zakrzewski, J. Gao, N. Rega, G. Zheng, W. Liang, M. Hada, M. Ehara, K. Toyota, R. Fukuda, J. Hasegawa, M. Ishida, T. Nakajima, Y. Honda, O. Kitao, H. Nakai, T. Vreven, K. Throssell, J. A. Montgomery, Jr., J. E. Peralta, F. Ogliaro, M. J. Bearpark, J. J. Heyd, E. N. Brothers, K. N. Kudin, V. N. Staroverov, T. A. Keith, R. Kobayashi, J. Normand, K. Raghavachari, A. P. Rendell, J. C. Burant, S. S. Iyengar, J. Tomasi, M. Cossi, J. M. Millam, M. Klene, C. Adamo, R. Cammi, J. W. Ochterski, R. L. Martin, K. Morokuma, O. Farkas, J. B. Foresman and D. J. Fox, Gaussian 16, Revision C.01, Gaussian, Inc., Wallingford CT, 2016 Search PubMed.
- C. Adamo and V. Barone, J. Chem. Phys., 1999, 110, 6158–6170 CrossRef CAS.
- F. Weigend and R. Ahlrichs, Phys. Chem. Chem. Phys., 2005, 7, 3297–3305 RSC.
- E. Caldeweyher, C. Bannwarth and S. Grimme, J. Chem. Phys., 2017, 147, 034112 CrossRef PubMed.
- A. V. Marenich, C. J. Cramer and D. G. Truhlar, J. Phys. Chem. B, 2009, 113, 6378–6396 CrossRef CAS PubMed.
- L. E. Roy, P. J. Hay and R. L. Martin, J. Chem. Theory Comput., 2008, 4, 1029–1031 CrossRef CAS PubMed.
- E. R. Davidson, Chem. Phys. Lett., 1996, 260, 514–518 CrossRef CAS.
- P. Pracht, C. A. Bauer and S. Grimme, J. Comput. Chem., 2017, 38, 2618–2631 CrossRef CAS PubMed.
- S. Grimme, J. Chem. Theory Comput., 2019, 15, 2847–2862 CrossRef CAS PubMed.
- P. Pracht, F. Bohle and S. Grimme, Phys. Chem. Chem. Phys., 2020, 22, 7169–7192 RSC.
- F. Pedregosa Fabianpedregosa, V. Michel, O. Grisel Oliviergrisel, M. Blondel, P. Prettenhofer, R. Weiss, J. Vanderplas, D. Cournapeau, F. Pedregosa, G. Varoquaux, A. Gramfort, B. Thirion, O. Grisel, V. Dubourg, A. Passos, M. Brucher, M. Perrot and É. Duchesnay, Scikit-learn: Machine Learning in Python, 2011, vol. 12 Search PubMed.
- M. Feurer, K. Eggensperger, S. Falkner, M. Lindauer and F. Hutter, arXiv, 2020 DOI:arXiv:2007.04074v1.
- M. Feurer, A. Klein, K. Eggensperger, J. Springenberg, M. Blum and F. Hutter, in Advances in Neural Information Processing Systems, ed. C. Cortes, N. D. Lawrence, D. D. Lee, M. Sugiyama and R. Garnett, Curran Associates, Inc., 2015, vol. 28, pp. 2962–2970 Search PubMed.
- R. H. Morris, J. Am. Chem. Soc., 2014, 136, 1948–1959 CrossRef CAS.
- R. Ciancanelli, B. C. Noll, D. L. DuBois and M. Rakowski DuBois, J. Am. Chem. Soc., 2002, 124, 2984–2992 CrossRef CAS PubMed.
- K. Fraze, A. D. Wilson, A. M. Appel, M. R. DuBois and D. L. Dubois, Organometallics, 2007, 26, 3918–3924 CrossRef CAS.
- B. R. Galan, J. Schöffel, J. C. Linehan, C. Seu, A. M. Appel, J. A. S. Roberts, M. L. Helm, U. J. Kilgore, J. Y. Yang, D. L. Dubois and C. P. Kubiak, J. Am. Chem. Soc., 2011, 133, 12767–12779 CrossRef CAS PubMed.
- Z. Marković, J. Tošović, D. Milenković and S. Marković, Comput. Theor. Chem., 2016, 1077, 11–17 CrossRef.
- F. Shafiq, D. J. Szalda, C. Creutz and R. M. Bullock, Organometallics, 2000, 19, 824–831 CrossRef CAS.
- P. Maire, F. Breher, H. Schönberg and H. Grützmacher, Organometallics, 2005, 24, 3207–3218 CrossRef CAS.
- T. Büttner, J. Geier, G. Frison, J. Harmer, C. Calle, A. Schweiger, H. Schönberg and H. Grützmacher, Science, 2005, 307, 235–238 CrossRef.
- N. Donati, D. Stein, T. Büttner, H. Schönberg, J. Harmer, S. Anadaram and H. Grützmacher, Eur. J. Inorg. Chem., 2008, 4691–4703 CrossRef CAS.
- T. Li, A. J. Lough and R. H. Morris, Chem. – Eur. J., 2007, 13, 3796–3803 CrossRef CAS PubMed.
- S. E. Landau, R. H. Morris and A. J. Lough, Inorg. Chem., 1999, 38, 6060–6068 CrossRef CAS PubMed.
- D. P. Estes, A. K. Vannucci, A. R. Hall, D. L. Lichtenberger and J. R. Norton, Organometallics, 2011, 30, 3444–3447 CrossRef CAS.
Footnotes |
| † Electronic supplementary information (ESI) available: SI (pdf) and related data are available free of charge. See DOI: 10.1039/d0cp05281g |
| ‡ Multiple solvents were unavailable in xTB and were replaced by a solvent with similar dielectric constant. Benzonitrile was replaced by acetonitrile, dichloroethane was replaced by dichloromethane and mixtures were replaced by one of the components. |
| This journal is © the Owner Societies 2021 |