
Multifunctional nanoparticles for targeting the tumor microenvironment to improve synergistic drug combinations and cancer treatment effects
Mei-Lin
Chen
a,
Chih-Jen
Lai
b,
Yi-Nan
Lin
c,
Chien-Ming
Huang
a and
Yu-Hsin
Lin
 *bde
*bde
aDepartment of Pharmacy, Chen Hsin General Hospital, Taipei, Taiwan
bFaculty of Pharmacy, National Yang-Ming University, Taipei, Taiwan. E-mail: ylhsin@ym.edu.tw; Fax: +886-2-2826-7932
cDepartment of Biological Science and Technology, China Medical University, Taichung, Taiwan
dInstitute of Biopharmaceutical Sciences, Department and Institute of Pharmacology, Center for Advanced Pharmaceutics and Drug Delivery Research, National Yang-Ming University, Taipei, Taiwan
eDepartment of Medical Research, China Medical University Hospital, China Medical University, Taichung, Taiwan
First published on 28th October 2020
Abstract
Docetaxel-based chemotherapy for prostate cancer is the clinical standard of care. However, nonspecific targeting, multiple drug resistance, and adverse side effects are common obstacles. Various natural compounds, including epigallocatechin-3-gallate (EGCG) in combination with taxane, have the potential to be developed as anticancer therapeutics. Although synergistic hydrophobic–hydrophilic combination drugs have been used with some success, the main drawbacks of this approach are poor bioavailability, unfavorable pharmacokinetics, and low tissue distribution. To improve their synergistic effect and overcome limitations, we encapsulated EGCG and low-dose docetaxel within TPGS-conjugated hyaluronic acid and fucoidan-based nanoparticles. This approach might facilitate simultaneous target-specific markers at the edge and center of the tumor and then might increase intratumoral drug accumulation. Additionally, the successful release of bioactive combination drugs was regulated by the pH-sensitive nanoparticles and internalization into prostate cancer cells through CD44 and P-selectin ligand recognition, and the inhibition of cell growth via induced G2/M phase cell cycle arrest was observed in in vitro study. In in vivo studies, treatment with cancer-targeted combination drug-loaded nanoparticles significantly attenuated tumor growth and increased M30 protein expression without causing organ damage. Overall, the multifunctional nanoparticle system improved the drugs’ synergistic effect, indicating great potential in its development as a prostate cancer treatment.
Introduction
Prostate cancer is the most commonly diagnosed malignancy and the third leading cause of cancer-related deaths among men in the United States.1,2 Although early stage prostate cancer is generally treatable, most cases eventually progress to an advanced stage, castration-resistant prostate cancer (CRPC).3 Docetaxel (DTX)-based chemotherapy is the standard-of-care regimen for CRPC, but only about 48% of patients respond to DTX, and acquired drug resistance rapidly develops.4 Multi-drug resistance (MDR) promotes drug efflux through a P-glycoprotein pump, and prostate cancer cells with increased MDR demonstrate markedly reduced intracellular concentrations of DTX.5,6 P-glycoprotein (P-gp), a member of the ATP-binding cassette transporter, acts as an efflux pump for most hydrophobic anticancer drugs, causing MDR and thus limiting the efficacy of treatment.7 Several nonionic surfactants, including tweens, spans, or pluronic block copolymers that have been shown to modulate cellular drug transport activity by inhibiting P-gp efflux pumps, have been used to overcome MDR.8,9D-Alpha-tocopheryl polyethylene glycol 1000 succinate (TPGS) is a water-soluble succinate ester of vitamin E that is widely used in the food and drug industries. TPGS and its derivatives have been shown to prevent P-gp ATPase from hydrolyzing ATP by blocking its ATP-binding sites, thereby inhibiting its enzymatic activity.10,11 We prepared TPGS-conjugated hyaluronic acid (TPGS-g-HA) to interact with membrane-bound CD44 protein and reduce P-gp expression levels in prostate cancer cells (Fig. 1). HA, which is composed of repeating disaccharides of (β,1–4)-glucuronic acid and (β,1–3)-N-acetyl glucosamine, is a primary binding agent for the cell surface molecule CD44 through hydrogen bonding and van der Waals binding interactions. It is overexpressed in a wide range of solid tumors, including prostate cancer.12–15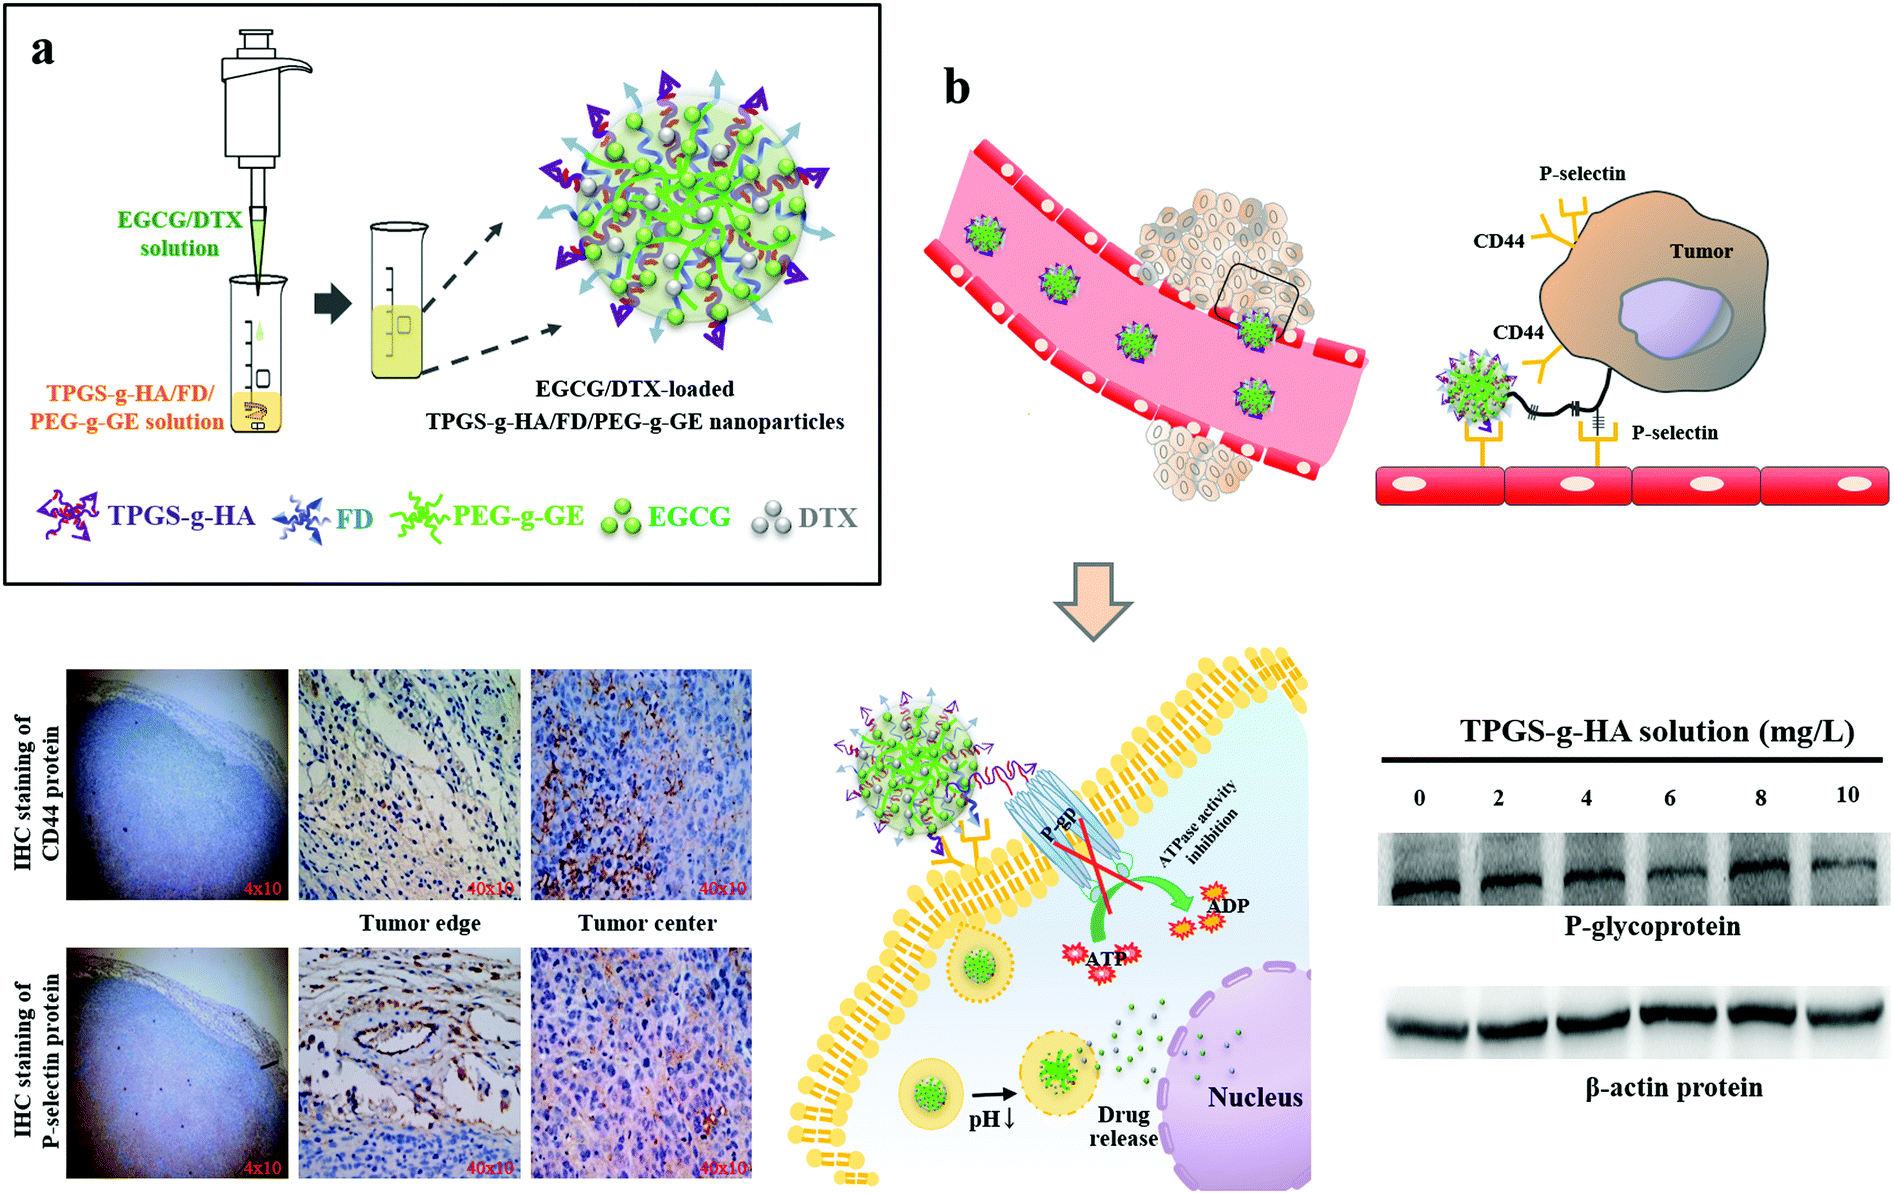 | ||
| Fig. 1 (a) The nanoparticles were prepared by adding aqueous EGCG/DTX solution into aqueous TPGS-g-HA/FD/PEG-g-GE solution, and the solutions were gently stirred for 30 min at 37 °C; (b) schematic representation of the strategy for using EGCG/DTX-loaded TPGS-g-HA/FD/PEG-g-GE nanoparticles and observing their potential effects on carcinoma cells. | ||
DTX is a hydrophobic, semisynthetic taxane drug with proven efficacy in a variety of solid tumors, including breast cancer, nonsmall cell lung cancer, and prostate cancer.16–18 The standard dose of 70–75 mg m−2 administered 3 times per week has been widely used for CRPC, but it has been associated with significant side effects.19 When administered at the higher end of this dose range, the majority of the patients develop hematological toxicity (grade 3–4 neutropenia).20 However, low-dose weekly DTX displayed comparable oncological effectiveness but with a lower rate of adverse events compared to the standard dosage for prostate cancer treatment.19 The natural bioactive ingredient epicatechin-3-gallate (EGCG) displays a synergistic, additive effect when used in combination with taxanes in inhibiting cell growth and inducing the apoptosis of prostate cancer cells.21 However, the in vivo pharmacokinetic profiles and biodistribution of different drug molecule types may reduce the synergistic effects. It has been found that the cellular cytotoxicity of hydrophobic–hydrophilic drug conjugates is significantly reduced if the drug conjugates are encapsulated into nanoparticles.22,23 The application of nanoparticle systems with tightly controlled, targeted cell delivery and sustained drug release properties presents a promising strategy in cancer therapeutics.24–26
The full clinical potential of nanomedicine has not been achieved in part because of the endothelial barrier, which limits the extravasation of nanoparticles at solid tumor sites.27,28 Tumor vasculature, which is composed of smooth muscle cells, pericytes, and endothelial cells, is necessary for the growth and support of tumors.29 P-Selectin, an inflammatory cell adhesion molecule, is expressed constitutively on endothelial cells and is responsible for leukocyte recruitment.30 Fucoidans (FDs) are water-soluble, branched homo- and hetero-polysaccharides derived from fibrillar cell walls and intercellular spaces of brown marine algae or echinoderms and have recently been identified in seagrasses. FDs can also serve as ligands for either L- or P-selectins, both of which interact with sulfated oligosaccharides. This interaction has physiological consequences that could be therapeutically beneficial.31–34 In this study, we developed a tumor-targeted nanocarrier to combine FD-binding to P-selectin-expressing tumors with TPGS-g-HA targeting of CD44 protein-expressing tumors to reduce the level of P-gp, thereby enhancing the drug uptake capacity of cancer cells, providing synergistic antitumor effects (Fig. 1).
Materials and methods
Preparation of TPGS-conjugated HA (TPGS-g-HA) and polyethylene-glycol-conjugated gelatin (PEG-g-GE)
The TPGS-g-HA copolymer was prepared by integrating polymers with active terminal groups. The synthesis procedure was as follows: 0.2 g of HA was dissolved in 10.0 mL of deionized water, and 2.0 mL of deionized water containing 0.1 g of TPGS was then added with continuous stirring at room temperature. Afterward, dicyclohexylcarbodiimide (0.2 mmol) and 4-dimethylaminopyridine (0.2 mmol) were dissolved in 5.0 mL acetonitrile, and 1.0 mL of triethanolamine was added to the mixture of aqueous TPGS/HA and stirred for 24 h at room temperature under a nitrogen atmosphere. To remove the unconjugated reagents, the sample was dialyzed in 5.0 L deionized water, which was replaced 5 times per day. The resultant TPGS-g-HA was lyophilized in a freeze dryer.The PEG-conjugated gelatin (PEG-g-GE) was synthesized essentially as described in our previous study. Briefly, 2.0 g of gelatin was dissolved in 20.0 mL dimethyl sulfoxide, and 0.6 g of methoxypolyethylene glycol succinimidyl ester (mPEG-NHS) was added to this solution with even stirring for 4.0 h. The samples were dialyzed in the dark against deionized water, which was replaced five times per day to remove unconjugated mPEG-NHS. The degree of grafting density on TPGS-g-HA was determined by nuclear magnetic resonance spectroscopy (NMR), and the quality of the purified TPGS-g-HA was confirmed by Fourier-transform infrared spectroscopy (FTIR) analysis.
Characterization of EGCG/DTX-loaded TPGS-g-HA/FD/PEG-g-GE nanoparticles
We developed nanoparticles composed of TPGS-g-HA/FD complexes with PEG-g-GE containing encapsulated EGCG and DTX. First, EGCG-loaded TPGS-g-HA/FD/PEG-g-GE nanoparticles were established, and the proportions and concentrations of TPGS-g-HA/FD were optimized. A series of TPGS-g-HA/FD aqueous mixed solutions (2.40![[thin space (1/6-em)]](https://www.rsc.org/images/entities/char_2009.gif) :2.40, 4.80:4.80, 7.20:7.20, and 9.60:9.60 mg mL−1; 0.50 mL) were added into a PEG-g-GE aqueous solution in deionized water (15.00 mg mL−1; 0.50 mL), and then, the solutions were gently shaken for 30 min at 37 °C. Afterward, the EGCG aqueous solution (4.00 mg mL−1; 1.00 mL) was separately added to 1.0 mL of the aqueous TPGS-g-HA/FD/PEG-g-GE mixed solutions under stirring for 30 min at 37 °C to form nanoparticles of TPGS-g-HA/FD/PEG-g-GE/EGCG with proportions of 0.60:0.60:3.75:2.00, 1.20:1.20:3.75:2.00, 1.80:1.80:3.75:2.00, and 2.40:2.40:3.750:2.00 mg mL−1. After centrifugation, the particle size, polydispersity index, and zeta potentials were measured using a Zetasizer instrument.
:2.40, 4.80:4.80, 7.20:7.20, and 9.60:9.60 mg mL−1; 0.50 mL) were added into a PEG-g-GE aqueous solution in deionized water (15.00 mg mL−1; 0.50 mL), and then, the solutions were gently shaken for 30 min at 37 °C. Afterward, the EGCG aqueous solution (4.00 mg mL−1; 1.00 mL) was separately added to 1.0 mL of the aqueous TPGS-g-HA/FD/PEG-g-GE mixed solutions under stirring for 30 min at 37 °C to form nanoparticles of TPGS-g-HA/FD/PEG-g-GE/EGCG with proportions of 0.60:0.60:3.75:2.00, 1.20:1.20:3.75:2.00, 1.80:1.80:3.75:2.00, and 2.40:2.40:3.750:2.00 mg mL−1. After centrifugation, the particle size, polydispersity index, and zeta potentials were measured using a Zetasizer instrument.
Subsequently, water-insoluble DTX was encapsulated in these nanoparticles. First, the proportions of EGCG/DTX were optimized for EGCG/DTX-loaded TPGS-g-HA/FD/PEG-g-GE nanoparticles. DTX dissolved in 99% ethanol (0.80, 1.60, 3.20, and 4.80 mg mL−1; 0.125 mL) was mixed with deionized water (0.375 mL) and then added to the EGCG solution (8.00 mg mL−1; 0.500 mL) to form EGCG/DTX aqueous mixed solutions (4.00:0.10, 4.00:0.20, 4.00:0.40, and 4.00:0.60 mg mL−1; 1.00 mL). The EGCG/DTX solutions (1.00 mL) were added to the TPGS-g-HA/FD/PEG-g-GE in deionized water (1.00 mL) and stirred at 37 °C for 30 min. After centrifugation, the size distribution and compositions of the resultant nanoparticles were evaluated with Zetasizer instrument analysis. Additionally, the amount of free EGCG or DTX in the supernatant was detected, and the drug-loading efficiency of the nanoparticles was calculated using a high-performance liquid chromatography (HPLC) system connected to a reversed-phase C18 column and equipped with a UV detector at 230 nm.
Evaluating pH sensitivity and drug release profiles in EGCG/DTX-loaded TPGS-g-HA/FD/PEG-g-GE nanoparticles
The pH sensitivity of the nanoparticles in the distinct pH environments was assessed by measuring the release of EGCG and DTX using HPLC. The nanoparticle solutions (2.0 mg mL−1) were dialyzed against 10.0 mL of buffer at each pH value and placed into a dialysis bag. Buffers with pH values of 5.0 (10.0 mM acetic acid/sodium acetate), 6.5, and 7.4 (10.0 mM phosphate buffered saline; PBS) were chosen to simulate the environments of endosomal compartments, tumor tissues, and physiological fluids, respectively. The release solution was removed at certain intervals for analysis, and the equivalent volume of fresh buffer was added to prevent drug saturation. The amount of each drug released was confirmed using a standard calibration curve and repeated five times under each condition. Meanwhile, the nanoparticle suspension at each pH value was placed onto a mesh copper grid and positively stained with osmium tetroxide, and the morphology was then observed by transmission electron microscopy (TEM).Estimating the anticancer effect in vitro and the combination index assay
The human prostate cancer PC3 cells (ATCC® CRL1435™) used in the cell toxicity study were grown in Roswell Park Memorial Institute 1640 medium supplemented with 10% fetal bovine serum in a humidified atmosphere enriched with 5% CO2 at 37 °C. In a cell viability study, PC3 cells (1.0 × 10⁴ cells per well) were seeded into 96-well plates and allowed to adhere for 24 h. The growth medium was substituted by PBS with fetal bovine serum solution containing different concentrations of dissolved EGCG (ranging from 0 to 100 mg L−1), DTX solution (ranging from 0 to 40 mg L−1), EGCG/DTX combination solution (ranging from 0/0 to 100/20 mg L−1), or EGCG/DTX-loaded nanoparticles (EGCG/DTX ranging from 0/0 to 60/12 mg L−1). These solutions were added to the cells for 2 h and then replaced with a fresh cell medium for an additional 22 h, and cell growth was assessed using the 3-(4,5-dimethylthiazol-2-yl)-2,5-diphenyltetrazolium bromide (MTT) assay. We also evaluated the combined beneficial effect of EGCG and DTX on cancer cell viability using the Chou–Talalay method.35 The combination index (CI) of test agents was calculated using the formula CI = DE/DxE + DT/DxT, where DE and DT are the concentrations of EGCG and DTX used in the combined treatment to achieve x% drug effect, respectively.36DxE and DxT represented the concentrations of single agents to achieve x% drug effect. CI < 1.0, CI = 1.0, and CI > 1.0 indicate, respectively, the synergistic effects, additive effects, and antagonistic effects of the combined agents.37,38 In our experiments, the relationship between drug concentration and decreased cell viability (IC10–50) was calculated, and an isobologram and a CI–Fa plot are presented. Additionally, changes in cell morphology induced by EGCG/DTX combination solution or EGCG/DTX-loaded nanoparticles (EGCG/DTX concentration 5.0/1.0 and 10.0/2.0 mg L−1) and control samples were analyzed using an inverted microscope under phase-contrast illumination (4× and 10× objective).Cellular distribution of complexes and immunofluorescence staining contained within fluorescent nanoparticles observed by confocal microscopy
To observe the interaction of the prepared nanoparticles on cell surface protein expression, 2 × 10⁴ cells per mL were cultured on glass coverslips at 37 °C for 24 h. Additionally, a fluorescent-dye-labeled polymer was synthesized in reactions between the amine groups of fluorescent dyes (FA or Rh6G) and the carboxylic acid groups of TPGS-g-HA or FD to form FA-TPGS-g-HA or Rh6G-FD. The fluorescent FA or Rh6G dyes (1 mg) were completely dissolved in 1 mL acetonitrile and added to the aqueous TPGS-g-FA or FD solution (50 mg/10 mL in deionized water). Then, 1-(3-(dimethylaminopropyl)-3-ethylcarbodiimide) hydrochloride (1 mg) was added to the resultant mixtures under stirring at 4 °C. To remove unconjugated fluorescent dyes, the products were dialyzed against deionized water until no fluorescence was detected in the supernatant and then freeze-dried to form a powder. The fluorescent nanoparticles were produced according to the procedure described above. Afterward, the prepared fluorescent EGCG/DTX-loaded FA-TPGS-g-HA/Rh6G-FD/Cy5-PEG-g-GE nanoparticles were exposed to cells for 2 h, which were then were fixed in 3.7% paraformaldehyde and 4′,6-diamidino-2-phenylindole (DAPI) to stain the nuclei. Stained cells were observed by confocal laser scanning microscopy (CLSM) with excitation wavelengths of 340, 488, 525, and 633 nm.Meanwhile, the EGCG/DTX-loaded FA-TPGS-g-HA/Rh6G-FD/PEG-g-GE nanoparticle-treated cells were fixed in 1.0% paraformaldehyde and stained for CD44 and P-selectin for immunofluorescence experiments. The fixed cells were blocked in 1% BSA in PBST for 60 min and then treated with a mixture of 2 primary antibodies (mouse anti-CD44 antibody and rabbit anti-P-selectin antibody) overnight at 4 °C. After 3 PBS washes, they were incubated in a mixture of donkey anti-mouse CF™ 594 or anti-rabbit CF™ 633-conjugated secondary antibodies for 1 h at room temperature in the dark and then uniformly mounted on slides and examined using CLSM.
To observe the cellular distribution of the combination-drugs-loaded nanoparticles, fluorescent Rh6G-conjugated EGCG (Rh6G-EGCG) was synthesized as described previously.39 Additionally, the fluorescent polymer cyanine 5 hydrazide-labeled DTX (Cy5-DTX), synthesized as Cy5 hydrazide in solution, was added to the DTX solution gradually with continuous stirring at 4 °C in the dark for 12 h. To remove the unconjugated fluorescent dye, the Cy5-DTX was freeze-dried, and deionized water was added to precipitate the Cy5 dye, which was separated by centrifugation. The precipitation procedure was repeated three times until no fluorescent dye precipitate was observed. The Cy5-DTX solution was lyophilized with a freeze dryer. Afterward, cells were seeded onto glass coverslips at 3 × 10⁵ cells cm−2 and incubated for 24 h. Fluorescent Rh6G-EGCG/Cy5-DTX-loaded FA-, HA-, or TPGS-g-HA/FD/PEG-g-GE nanoparticles were added to the cells for 2 h and then replaced with a fresh cell medium for an additional 22 h. After 3 PBS washes, the cells were fixed in 3.7% paraformaldehyde, and the nuclei were stained with DAPI. Stained cells were observed using CLSM with excitation wavelengths of 340, 488, 525, and 633 nm.
Detection of cell cycle arrest by flow cytometry
To evaluate the effect of each drug combination on cell cycle progression, cells were incubated with EGCG/DTX-loaded TPGS-g-HA/FD/PEG-g-GE nanoparticle samples (EGCG/DTX concentration 0.0:0.0, 5.0:1.0, 10.0:2.0, and 20.0:4.0 mg L−1) for 2 h, washed twice in PBS, incubate in a conditioned medium, and prepared for flow cytometry. For cell cycle analysis, treated cells were harvested by centrifugation, washed with PBS, fixed with cold ethanol at 4 °C overnight, incubated with propidium iodide solution (0.01 mL at 1.00 mg mL−1) in the dark for 0.5 h at 4 °C, and analyzed using a FACS Calibur flow cytometer. Data were collected from 1.0 × 10⁴ cells per sample and analyzed using Cell Quest software WinMDI. All samples were examined in triplicate from three independent experiments.
Evaluation of the antitumor activity and histological examinations in vivo
The animal care and use protocols complied with the 1996 revision of the Guide for the Care and Use of Laboratory Animals prepared by the Institute of Laboratory Animal Resources. Six-week-old male severe combined immunodeficient mice (SCID) weighing 30 g were obtained from the National Laboratory Animal Center and housed in the Laboratory Animal Center at Yang-Ming University. All animal experiments were approved by National Yang-Ming University Institutional Animal Care and Use Committee and were carried out in accordance with the approved guidelines. The xenograft prostate tumor model was established using subcutaneously implanted PC3 cells (1 × 10⁷/100 μL), and then treatments were initiated when tumors reached a volume of 50 mm3 (defined as day 0). Mice were randomly divided into four groups of six for tail vein injection of normal saline solution (control), TPGS-g-HA/FD/PEG-g-GE solution, or 15.0 mg kg−1 EGCG/3.0 mg kg−1 DTX in the form of either EGCG/DTX combination solution or EGCG/DTX-loaded TPGS-g-HA/FD/PEG-g-GE nanoparticles every 3 days. Changes in prostate tumor volume and body weight were recorded. One day after the final observation, the mice were sacrificed, and organ tissues were removed for histological examination by hematoxylin–eosin (H&E) staining or immunohistochemical staining. Briefly, paraffin-embedded tissue sections were dewaxed and rehydrated by immersing the tissue in series concentrations of ethanol and xylene. After blocking with bovine serum albumin, sections were stained with M30 CytoDeath (Peviva, United States) and Ki67 (Thermo Fisher Scientific, United States) primary antibodies and then probed with secondary peroxidase antibodies. The expression distribution of the M30 apoptosis marker and Ki67 proliferation marker and the tissue inflammatory reactions were observed at different magnifications under light microscopy.Statistical analysis
Statistical analyses to quantify the differences in the measured properties between groups were performed with one-way analysis of variance and the determination of confidence intervals using the statistical package Statistical Analysis System, version 6.08 (SAS Institute Inc., United States). All data are presented as means and standard deviations, denoted as “mean ± SD.” A p value less than 0.05 was considered to be statistically significant.Results
Preparation and characterization of TPGS-g-HA
In the spectrum of TPGS, the signal observed at δ 0.88 ppm for the methyl protons of the long-chain alkyl group and δ 2.68–2.82 ppm belongs to –CH2CH2 part of succinyl group of TPGS. Furthermore, HA, the methyl (–CH3) protons of the N-acetyl group showed a signal at δ 2.04 ppm. The broad signal between δ 3.36 to 3.94 ppm corresponds to the signals of the protons in the sugar rings-because these signals were superimposed, it is difficult to assign each proton individually. The characteristic signal at around δ 4.50 ppm belongs to two anomeric protons attached to the carbons adjacent to the two oxygen atoms. The synthesized TPGS-g-HA copolymer exhibited a combination of the methyl protons of the long-chain alkyl group in TPGS and the N-acetyl group in HA, showing signals at δ 0.88 and 2.04 ppm, respectively (Fig. 2a). The graft degrees of TPGS conjugated HA by 1H NMR results was 59.59%. The TPGS has an average molecular weight of 1513 and an amphiphilic structure of lipophilic alkyl tail and hydrophilic polar head; the PEG 1000 portion of the molecule is water soluble, while the alpha-tocopherol portion is fat soluble. The chemical structure of TPGS-g-HA was characterized using FTIR (Fig. 2b), and showed characteristic peaks at 1367 cm−1 and 2885 cm−1 corresponding with −CH2 group of PEG and –CH stretching band on TPGS, and a peak at 1415 and 1633 cm−1 reflecting contributions of C–O symmetric and C![[double bond, length as m-dash]](https://www.rsc.org/images/entities/char_e001.gif) O asymmetric stretching, corresponding to carboxyl groups on HA. These results indicate that TPGS was bound to HA during preparation of the conjugate.
O asymmetric stretching, corresponding to carboxyl groups on HA. These results indicate that TPGS was bound to HA during preparation of the conjugate.
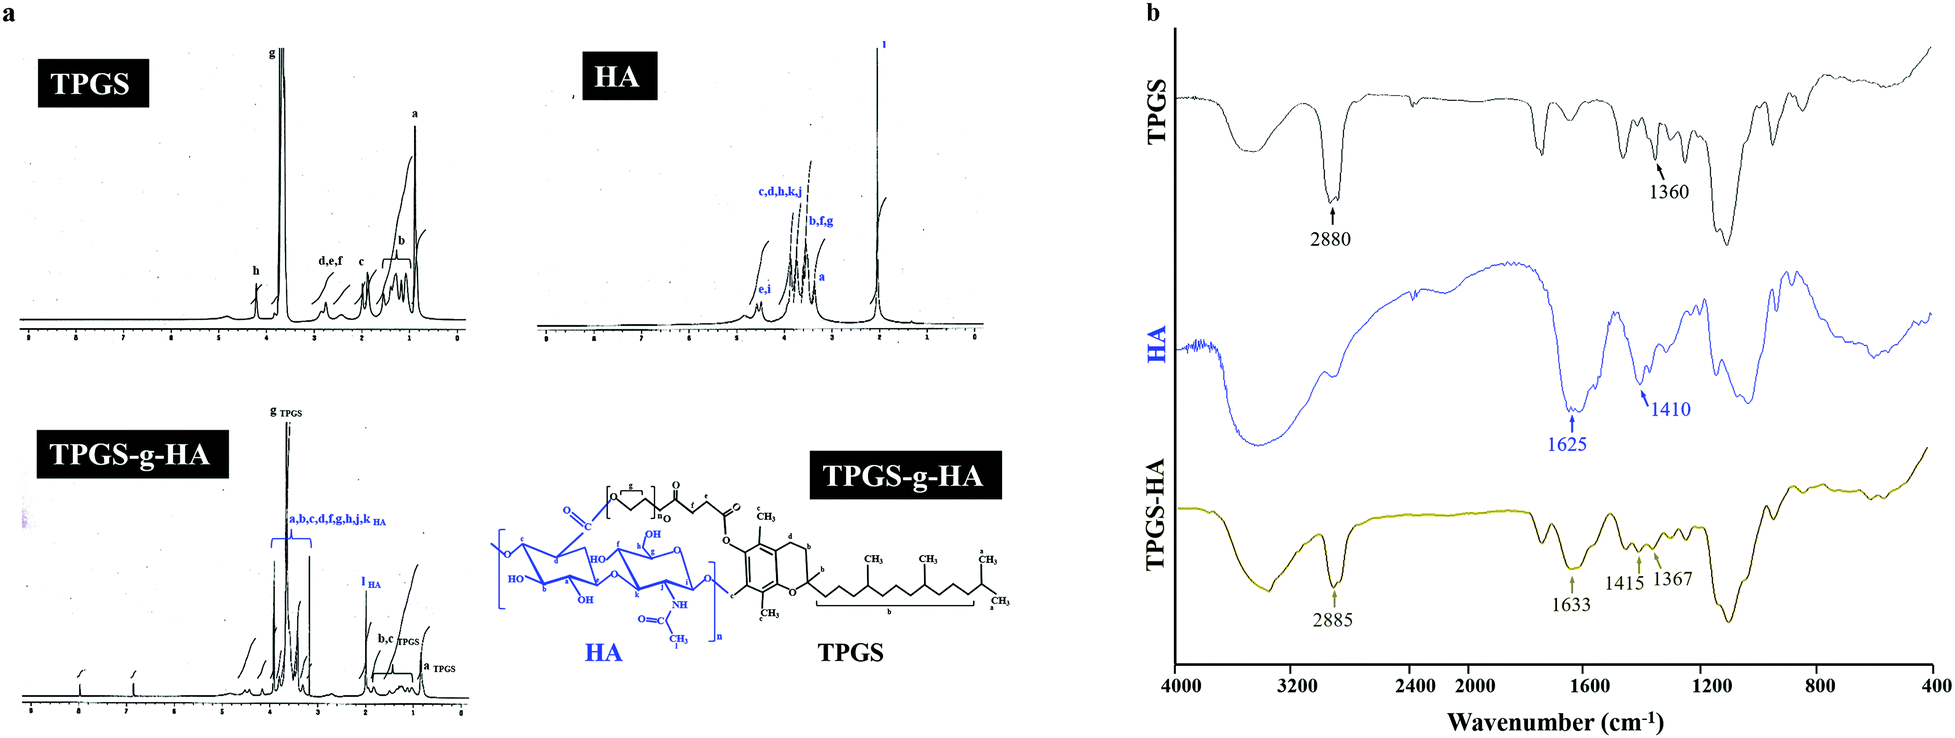 | ||
| Fig. 2 (a) Nuclear magnetic resonance spectroscopy analyses of TPGS, HA, and TPGS-g-HA; (b) Fourier transform infrared analyses of TPGS, HA, and TPGS-g-HA. | ||
Characterization of EGCG/DTX-loaded TPGS-g-HA/FD/PEG-g-GE nanoparticles and drug release profiles
To establish nanoparticles encapsulated with a combination of EGCG and DTX drugs, first, the optimum material TPGS-g-HA/FD composition ratio was determined in preparing EGCG-loaded nanoparticles, then the second drug DTX concentration was adjusted for incorporation in EGCG/DTX-loaded nanoparticles. Table 1 shows that the weight proportion of TPGS-g-HA and FD affected their particle size distribution, zeta potential values, and EGCG loading efficiency. The TPGS-g-HA:FD:PEG-g-GE:EGCG composition of 1.20:1.20:3.75:2.00 showed the least particle size (189.96 ± 7.98 nm), acceptable zeta potential value (−25.22 ± 1.74 mV), and an EGCG loading efficiency of 49.16% ± 2.41%. Although EGCG loading efficiency ability was maintained as the concentration of TPGS-g-HA/FD increased, the average particle size became larger and showed poor polydispersity index results. To further load DTX into the nanoparticles, the non-ionic surfactant TPGS was used to improve the lipid-soluble drug encapsulation efficiency.
| PEG-g-GE at 3.75 mg mL−1; EGCG at 2.00 mg mL−1 | ||||
|---|---|---|---|---|
| TPGS-g-HA:FD (mg mL−1) |
Mean particle size (nm) | Polydispersity indices | Zeta potential value (mV) | Loading efficiency (%) |
| 0.60:0.60 |
197.58 ± 18.67 | 0.36 ± 0.10 | −21.96 ± 1.75 | 40.38 ± 9.56 |
| 1.20:1.20 |
189.96 ± 7.98 | 0.21 ± 0.03 | −25.22 ± 1.74 | 49.16 ± 2.41 |
| 1.80:1.80 |
225.90 ± 25.81 | 0.28 ± 0.02 | −26.94 ± 3.24 | 56.47 ± 3.19 |
| 2.40:2.40 |
286.28 ± 28.74 | 0.36 ± 0.15 | −28.16 ± 3.56 | 65.76 ± 4.11 |
As shown in Table 2, at various drug aqueous EGCG:DTX ratios, the mean particle sizes and zeta potentials were 189.96 ± 7.98 nm to 238.98 ± 11.41 nm and −25.22 ± 1.74 mV to −27.42 ± 0.65 mV, as measured by a dynamic light scattering analyzer. With an EGCG:DTX concentration ratio of 2.00:0.20 mg mL−1, nanoparticles showed narrower distributions (polydispersity index 0.22 ± 0.04) and percentage drug loading efficiencies of 43.39% ± 2.89% for EGCG and 85.86% ± 2.62% for DTX, and these were used for the following experiments.
| EGCG:DTX (mg mL−1) |
Mean particle size (nm) | Polydispersity indices | Zeta potential value (mV) | Loading efficiency (%) | Loading capability (%) | ||
|---|---|---|---|---|---|---|---|
| EGCG | DTX | EGCG | DTX | ||||
| 2.00:0.00 |
189.96 ± 7.98 | 0.21 ± 0.03 | −25.22 ± 1.74 | 49.16 ± 2.41 | ND | 27.23 ± 2.85 | ND |
| 2.00:0.05 |
195.34 ± 8.85 | 0.18 ± 0.06 | −25.84 ± 2.32 | 46.47 ± 2.94 | 43.90 ± 11.24 | 25.96 ± 1.96 | 0.60 ± 0.13 |
| 2.00:0.10 |
201.26 ± 7.67 | 0.21 ± 0.03 | −26.80 ± 2.43 | 45.79 ± 5.06 | 64.65 ± 3.66 | 25.59 ± 3.49 | 1.89 ± 0.11 |
| 2.00:0.20 |
205.48 ± 8.52 | 0.22 ± 0.04 | −27.64 ± 1.66 | 43.39 ± 2.89 | 85.86 ± 2.62 | 24.09 ± 1.38 | 4.76 ± 0.15 |
| 2.00:0.30 |
238.98 ± 11.41 | 0.35 ± 0.06 | −27.42 ± 0.65 | 40.85 ± 5.11 | 90.11 ± 0.91 | 22.34 ± 3.07 | 7.32 ± 0.09 |
Next, to evaluate the pH-stability and drug releasing profile of the nanoparticles, the morphology and EGCG/DTX release ratios of EGCG/DTX-loaded nanoparticles were determined using HPLC and TEM (Fig. 3). At pH 7.4 and 6.5 buffer (simulating pH levels of the circulatory system or normal tissues and tumor tissues), their morphologies appeared as stable spherical shapes in the matrix structure (similar in deionized water), and the percentages of drug released from nanoparticles after 3 h incubation were 5.62% ± 2.53% (EGCG) or 4.23% ± 0.78% (DTX) at pH 7.4 and 8.41% ± 3.12% (EGCG) or 3.72% ± 0.84% (DTX) at pH 6.5. In contrast, at pH 5.0 buffer (simulating the endosomal compartment of tumor cells), –COO− groups were partially protonated in HA, affecting the electrostatic negative repulsion between nanoparticles, and leading to destabilization of the nanoparticle structural conformations. Drug release proportions were significantly increased from 17.54% ± 1.38% (EGCG) or 22.62% ± 0.28% (DTX) at 3 h, accumulating to 37.33% ± 1.33% (EGCG) or 43.75 ± 7.42% (DTX) within 24 h.
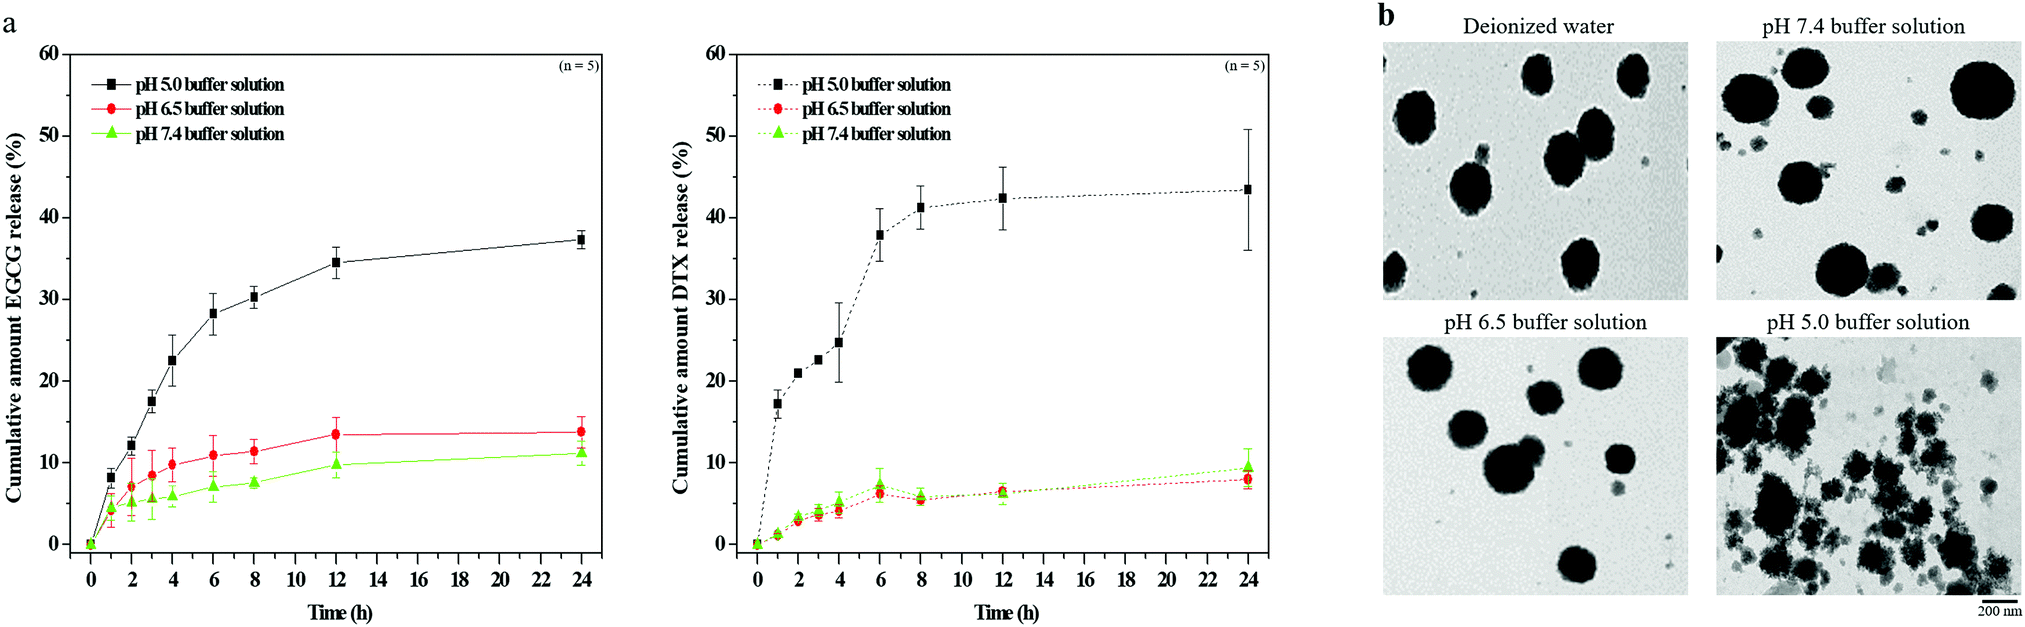 | ||
| Fig. 3 (a) In vitro EGCG and DTX release profiles from EGCG/DTX-loaded TPGS-g-HA/FD/PEG-g-GE nanoparticles in buffers with different pH values at 37 °C; (b) transmission electron microscopy micrographs from EGCG/DTX-loaded TPGS-g-HA/FD/PEG-g-GE nanoparticles in buffers with different pH values at 37 °C. | ||
Estimating the anticancer effects and combination index assay of EGCG/DTX-loaded TPGS-g-HA/FD/PEG-g-GE nanoparticles
To estimate potential inhibitory effects of the drugs EGCG or DTX in isolation and the synergistic effects of EGCG/DTX in combination, EGCG/DTX-loaded nanoparticles treatments on prostate cancer cell viability were assessed. Both EGCG and DTX shown dose-response effects and significantly influenced the cell growth at high a drug concentration of 100 mg L−1 of EGCG and 20 mg L−1 of DTX, the cell viabilities decreased to 48.24% ± 7.29% and 56.95% ± 6.33%, respectively (Fig. 4a). In addition, the CI values versus fraction affected (Fa) plot and the isobologram were presented in Fig. 4b. The EGCG/DTX treatment presented the potent synergistic effects on viabilities with the CI values of 0.24, 0.27, 0.50, and 0.96 for IC10, IC20, IC30, and IC40, respectively. We also found that the EGCG/DTX-loaded nanoparticles treatments shown better the synergistic anti-proliferation effects with CI values of 0.13 to 0.20 at IC10 to IC50 compared with only EGCG/DTX combination solutions. And the treatment half maximal inhibitory concentration (IC50) for EGCG/DTX-loaded nanoparticles was 10.0/2.0 mg L−1, which was 1/10 times of the concentration for EGCG/DTX combination solution (100/20.0 mg L−1). This reveals that the cancer-targeted EGCG/DTX-loaded TPGS-g-HA/FD/PEG-g-GE nanoparticles treatment had greater benefits than the combination drug treatment (Fig. 4a). Meanwhile, EGCG/DTX-loaded nanoparticles could reduce significantly cell number and induced morphological changes from spindle to irregular forms after 24 h, which compared with only EGCG/DTX combination solution (Fig. 4c).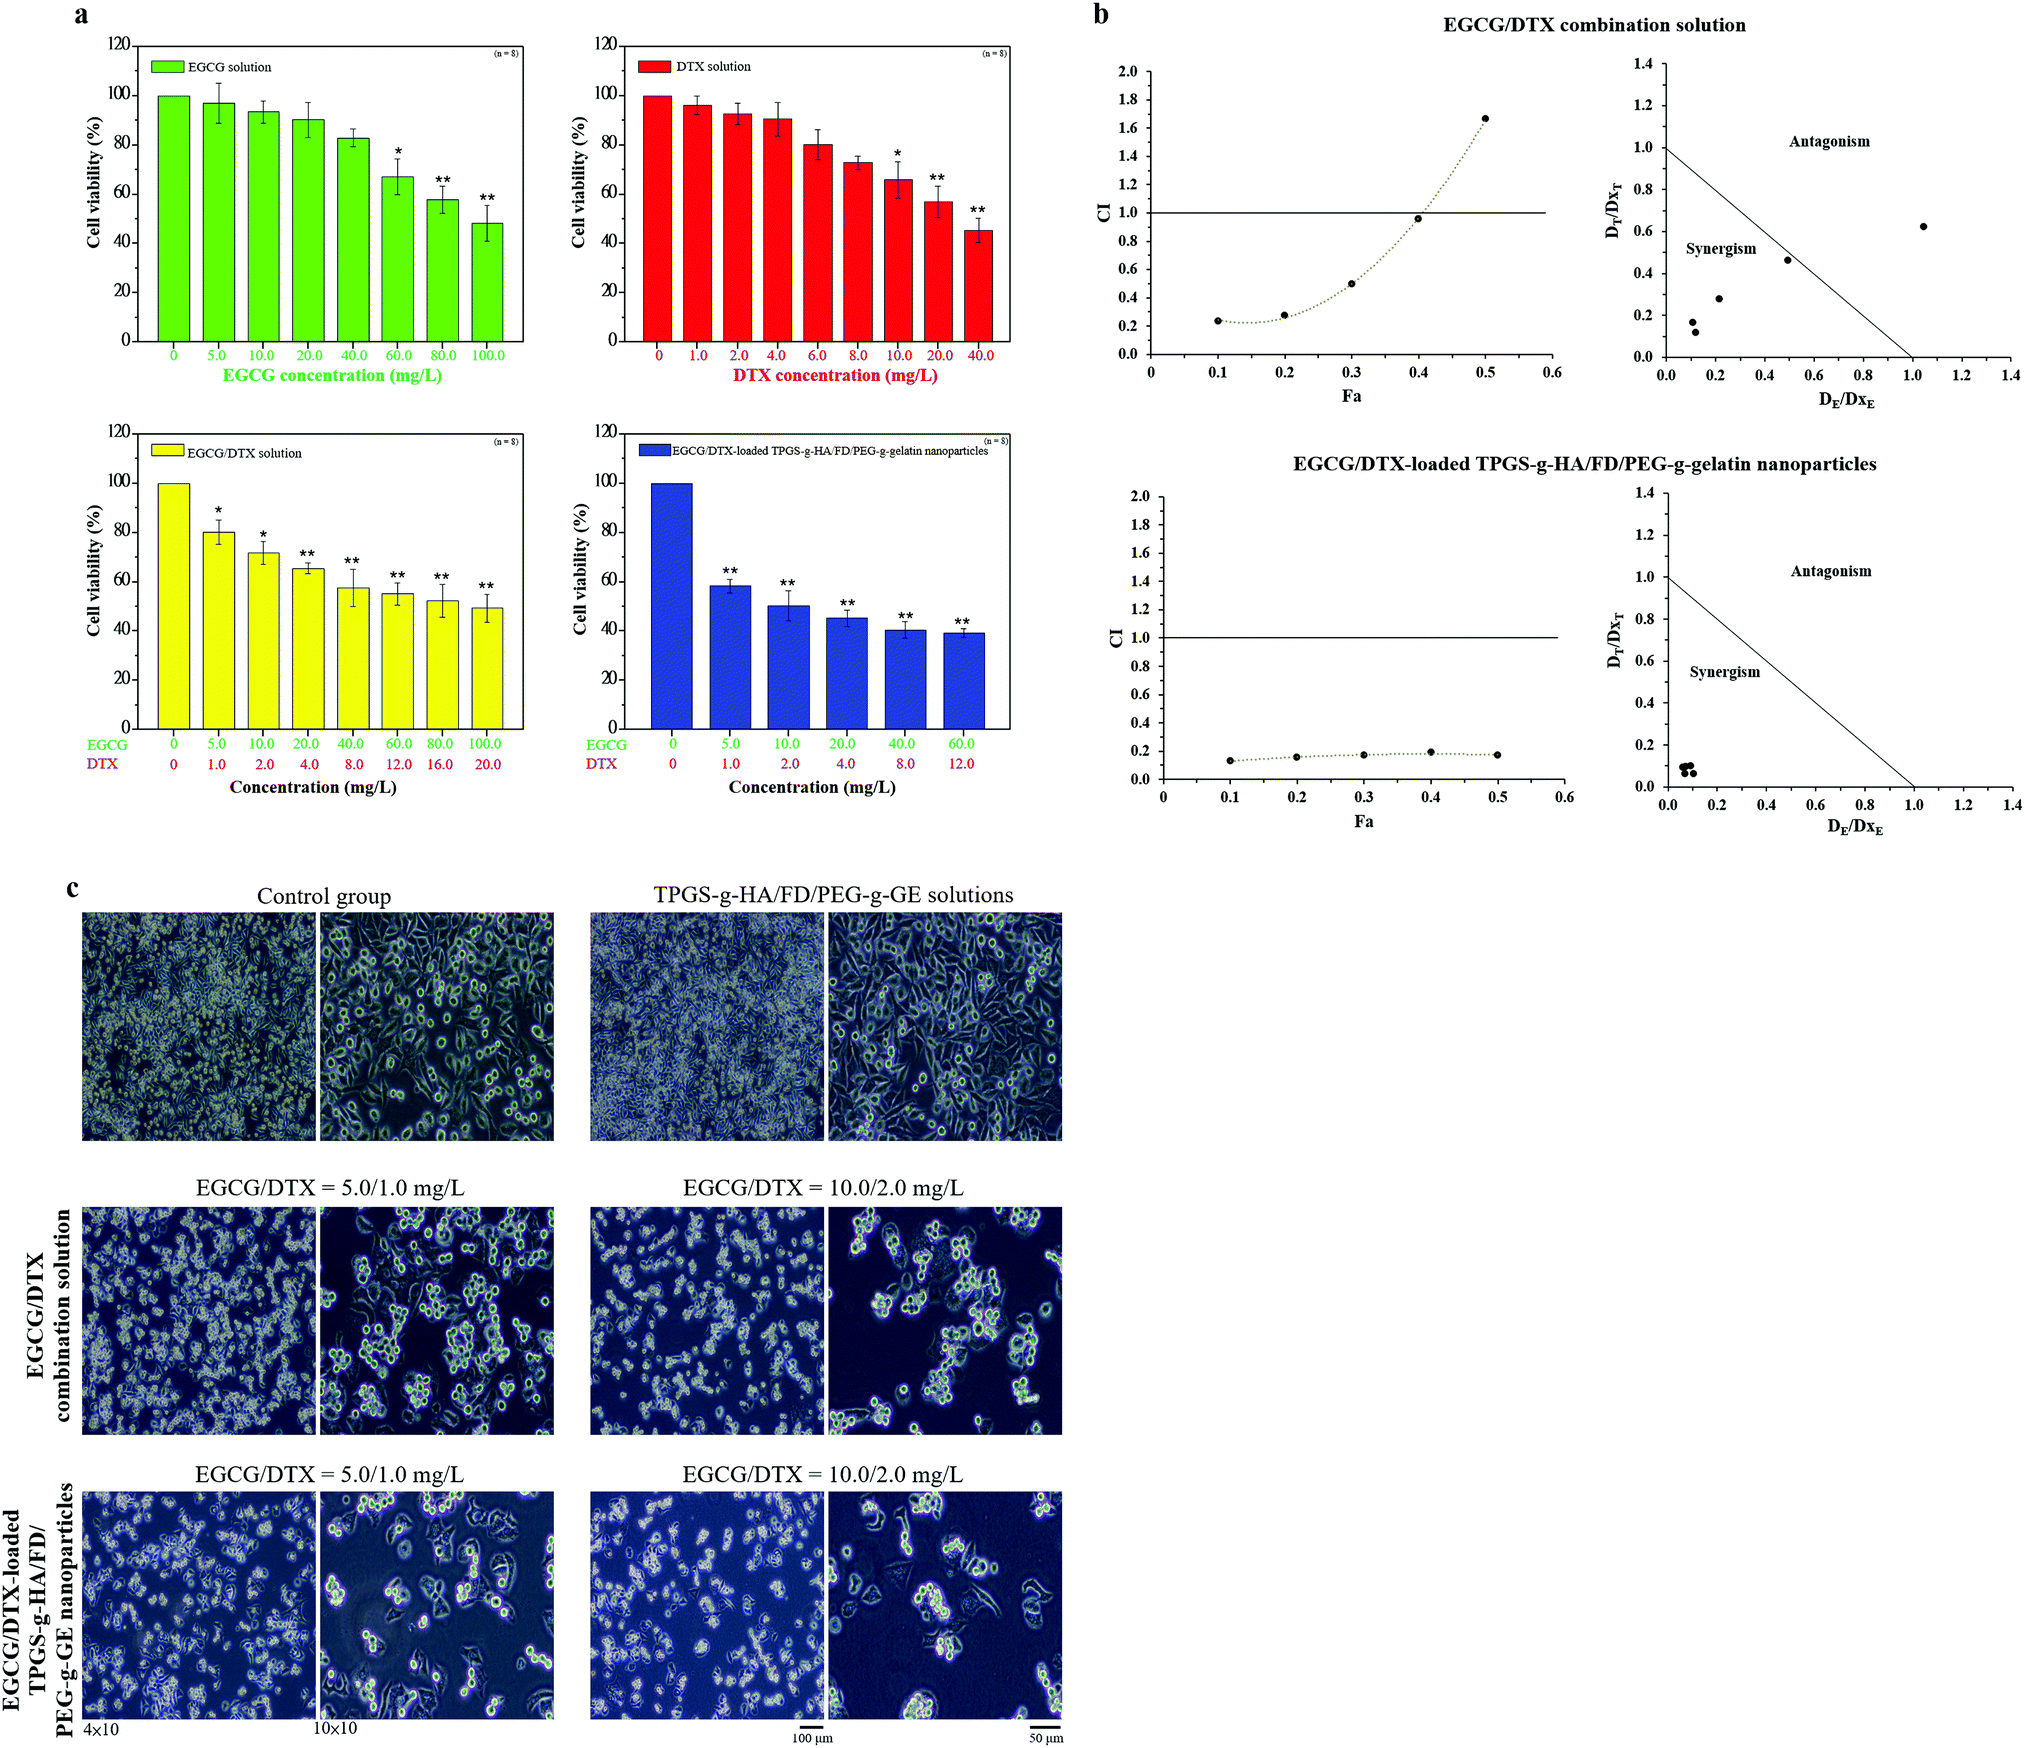 | ||
| Fig. 4 (a) Dose–response treatment of EGCG, DTX, EGCG/DTX combination solution, and EGCG/DTX-loaded TPGS-g-HA/FD/PEG-g-GE nanoparticles was performed for 2 h and cell viabilities were detected at 24 h. Data represent mean ± SD. * p value <0.05, ** p value < 0.01 compared with the control group; (b) CI-Fa plot. CI < 1.0 indicates synergistic effects. Sobologram, DE and DT were the concentrations of EGCG and DTX used in the combined treatment to achieve x% drug effect. DxE and DxT were the concentrations for single agents to achieve x% drug effect. Dots below the slanted line indicate synergistic effects. CI: combination index. Fa: fraction affected; (c) cell morphology of PC3 cells after treatment with TPGS-g-HA/FD/PEG-g-GE solutions, EGCG/DTX combination solution, and EGCG/DTX-loaded TPGS-g-HA/FD/PEG-g-GE nanoparticles. | ||
Cellular distribution and association of nanoparticle complexes observed in PC3 cells
The distribution of fluorescent nanoparticles in PC3 cells was detected via CLSM analysis. After 2 h of incubation with the EGCCG/DTX-loaded fluorescent FA-TPGS-g-HA/Rh6G-FD/Cy5-PEG-g-GE nanoparticles, intense fluorescence signals that co-localized and remained intact when internalized into the cytoplasm were observed (as indicated by superimposed red/green/purple spots, i.e., white arrows) (Fig. 5a). Herein, it was also observed by confocal laser scanning microscopy that fluorescence signals [FA-TPGS-g-HA (green) and Rh6G-FD (red)] of FA-TPGS-g-HA/Rh6G-FD/PEG-g-GE were in the intercellular spaces and cytoplasm, then they co-localized and interacted with cell surface CD44 (orange spot) and P-selectin (purple spot) in PC3 prostate cancer cells (red or blue arrows indicate superimposed green/orange or red/purple spots) (Fig. 5b).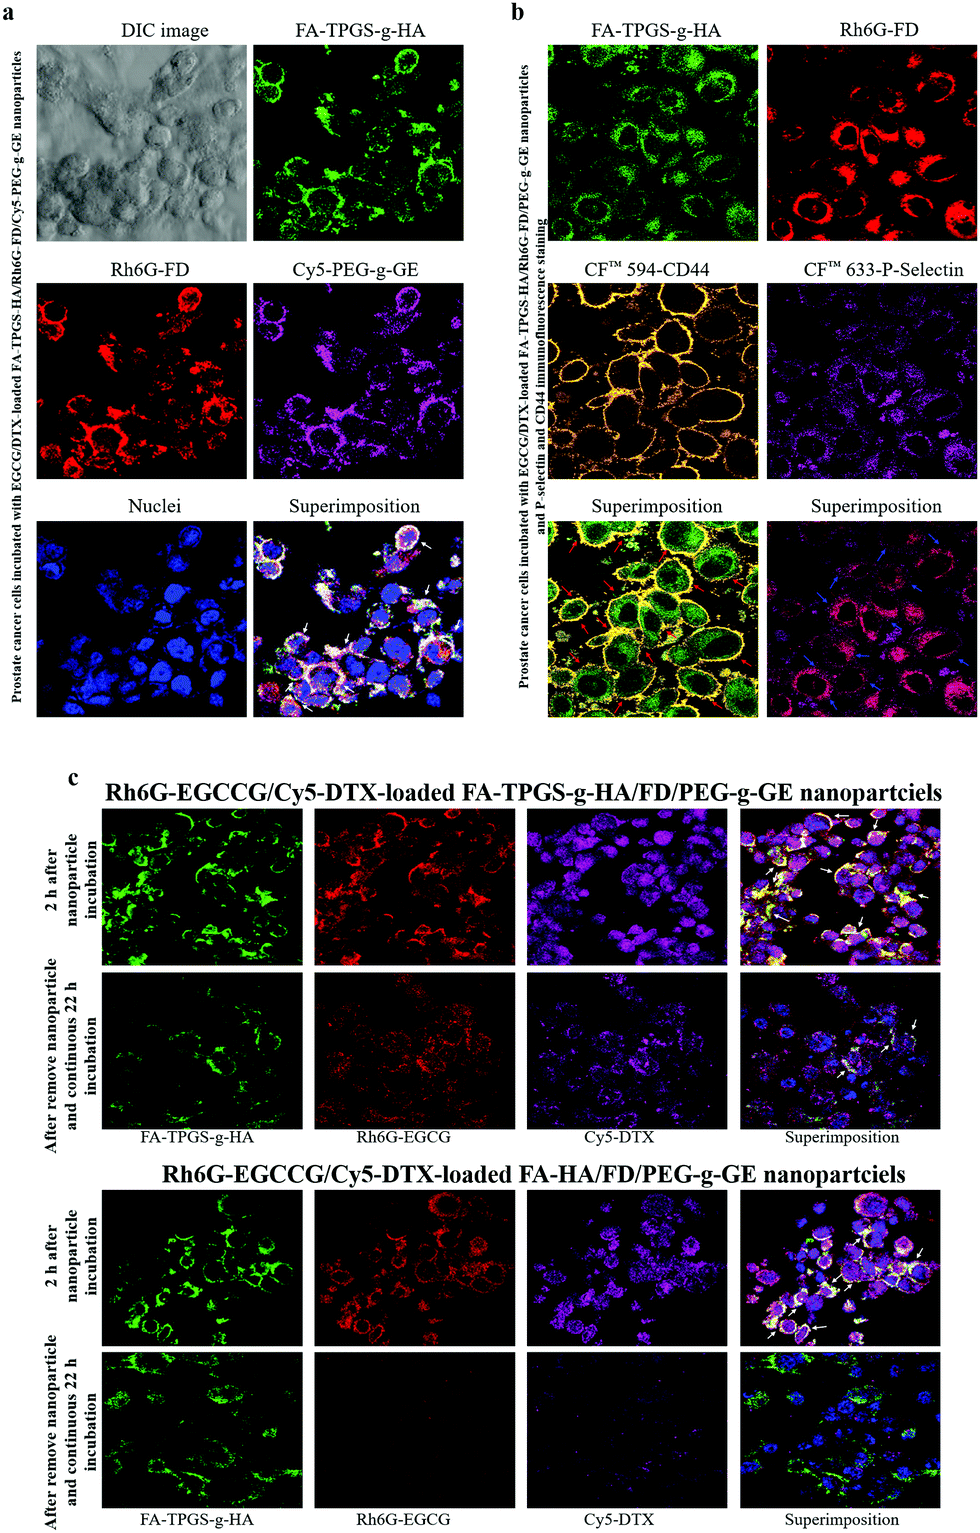 | ||
| Fig. 5 Confocal images of prostate cancer cells showing the cellular distribution of the nanoparticle preparations. (a) Treatment with EGCG/DTX-loaded FA-TPGS-g-HA/Rh6G-FD/Cy5-PEG-g-GE nanoparticles; (b) immunofluorescence staining of CD44 and P-selectin proteins in PC3 cancer cells incubated with EGCG/DTX-loaded FA-TPGS-g-HA/Rh6G-FD/PEG-g-GE nanoparticles; (c) intake of Rh6G-EGCCG/Cy5-DTX-loaded different FA-HA or TPGS-g-HA/FD/PEG-g-GE nanoparticles was observed after treatment different times. | ||
Meanwhile, subsequent fluorescence signals emitted by Rh6G-EGCCG/Cy5-DTX-loaded different FA-HA or TPGS-g-HA/FD/PEG-g-GE nanoparticles (Rh6G-EGCCG: red spot; Cy5-DTX: purple spot; FA-HA or TPGS-g-HA: green spot, i.e., white arrows) were all in contact with PC3 cells after 2 h of incubation time. After removing nanoparticles and continuing incubation for 22 h, the yellow spots in the superimposed images started to disappear in the cytoplasm and perinuclear space, indicating that the nanoparticles in the cellular spaces were no longer intact (Fig. 5c). Specifically, the fluorescence intensity of combination drugs (Rh6G-EGCCG/Cy5-DTX)-loaded TPGS-g-HA/FD/PEG-g-GE nanoparticles observed at intercellular spaces remained significantly expressed (i.e., Rh6G-EGCCG: red spot; Cy5-DTX: purple spot) compared with HA/FD/PEG-g-GE nanoparticles, indicating that the nanoparticles with TPGS-g-HA inhibit the P-gp efflux pumps and thus increase the intracellular drug accumulation (Fig. 1).
Evaluation of cell cycle arrest following EGCG/DTX-loaded TPGS-g-HA/FD/PEG-g-GE nanoparticle treatment
To determine whether exposure of prostate cancer cells to EGCG/DTX-loaded nanoparticles induced cell cycle arrest, we performed propidium iodide staining and examined cell cycle distributions (Fig. 6). We found that treatment of cells with EGCG/DTX-loaded nanoparticles for 2 h induced more cells arrested in G2/M phase (28.65% ± 1.32%, 34.52% ± 4.84%, 35.16% ± 3.65%, and 37.56% ± 3.70%) in a dose-dependent manner. Meanwhile, flow cytometry analysis revealed that PC3 cells treated with EGCG/DTX-loaded nanoparticles exhibited a significantly decreased percentage of cells in G0/G1 phase with increasing incubation times, whereas the G2/M phase proportions showed significant increases of 2.4-fold (from 28.61% ± 1.42% to 69.52% ± 1.93%) and 3.2-fold (from 27.21% ± 1.92% to 87.54% ± 1.55%) after 12 and 24 h of total incubation times, respectively. These results indicated that, following exposure, cells were impeded in their cycle progression and accumulated in the G2/M phase in a drug dose/incubation time-dependent manner.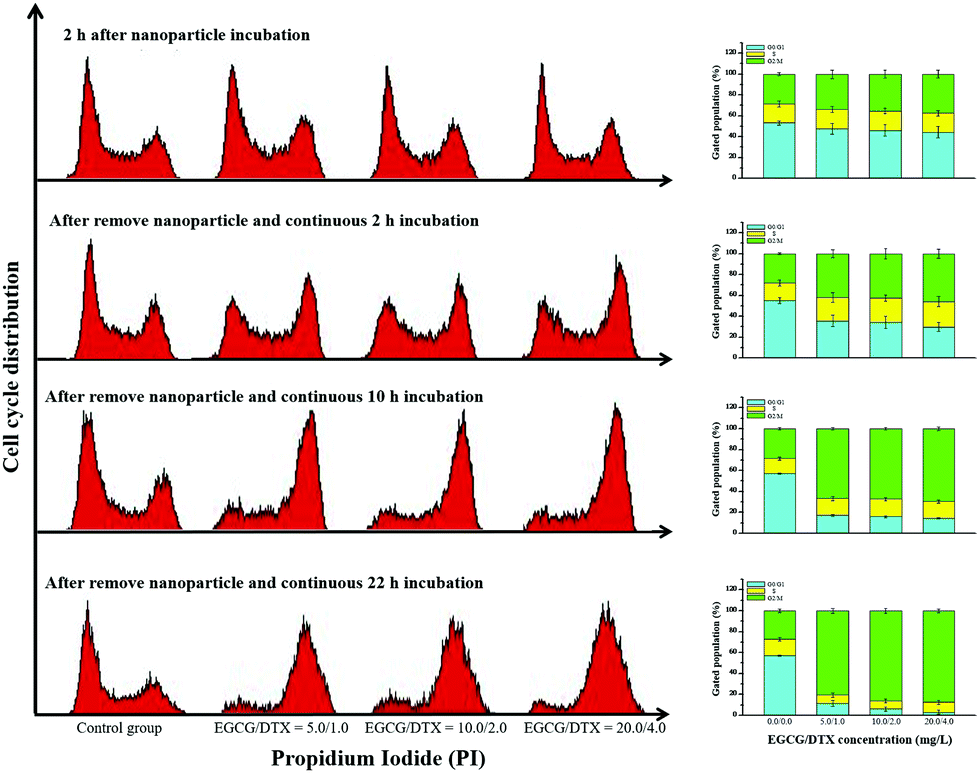 | ||
| Fig. 6 The proportions of cells in the G0/G1, S, and G2/M phases was analyzed using flow cytometry after treatment with EGCG/DTX-loaded TPGS-g-HA/FD/PEG-g-GE nanoparticles for different incubation times. | ||
Evaluation of nanoparticle antitumor activity in a mouse model
To investigate antitumor activity and drug-specific delivery of our prepared nanoparticles in vivo, we used prostate carcinoma xenograft models. We measured tumor volumes and body weights for 18 days after injection of normal saline solution (control group), TPGS-g-HA/FD/PEG-g-GE solution, EGCG/DTX combination solution, or EGCG/DTX-loaded TPGS-g-HA/FD/PEG-g-GE nanoparticles (Fig. 7). In the control and TPGS-g-HA/FD/PEG-g-GE solution groups, prostate tumor volume increased significantly over time, while growth was delayed only slightly by injection of EGCG/DTX solution. However, the proportion of tumor volume was significantly reduced with EGCG/DTX-loaded TPGS-g-HA/FD/PEG-g-GE nanoparticles compared to the EGCG/DTX combination solution-injected group (1.32 ± 0.16- and 1.93 ± 0.17-fold increases). There was no difference in body weight loss between mice treated with EGCG/DTX-loaded nanoparticles and control groups. We also found that tumor weight in the mice that received EGCG/DTX-loaded TPGS-g-HA/FD/PEG-g-GE nanoparticles was significantly lower than that of the normal saline or TPGS-g-HA/FD/PEG-g-GE solutions treatments (p < 0.05). Further, we found 31.46 to 52.84% of tumor weight inhibition in the mice that received EGCG/DTX solution or EGCG/DTX-loaded nanoparticles compared with the normal saline solution group.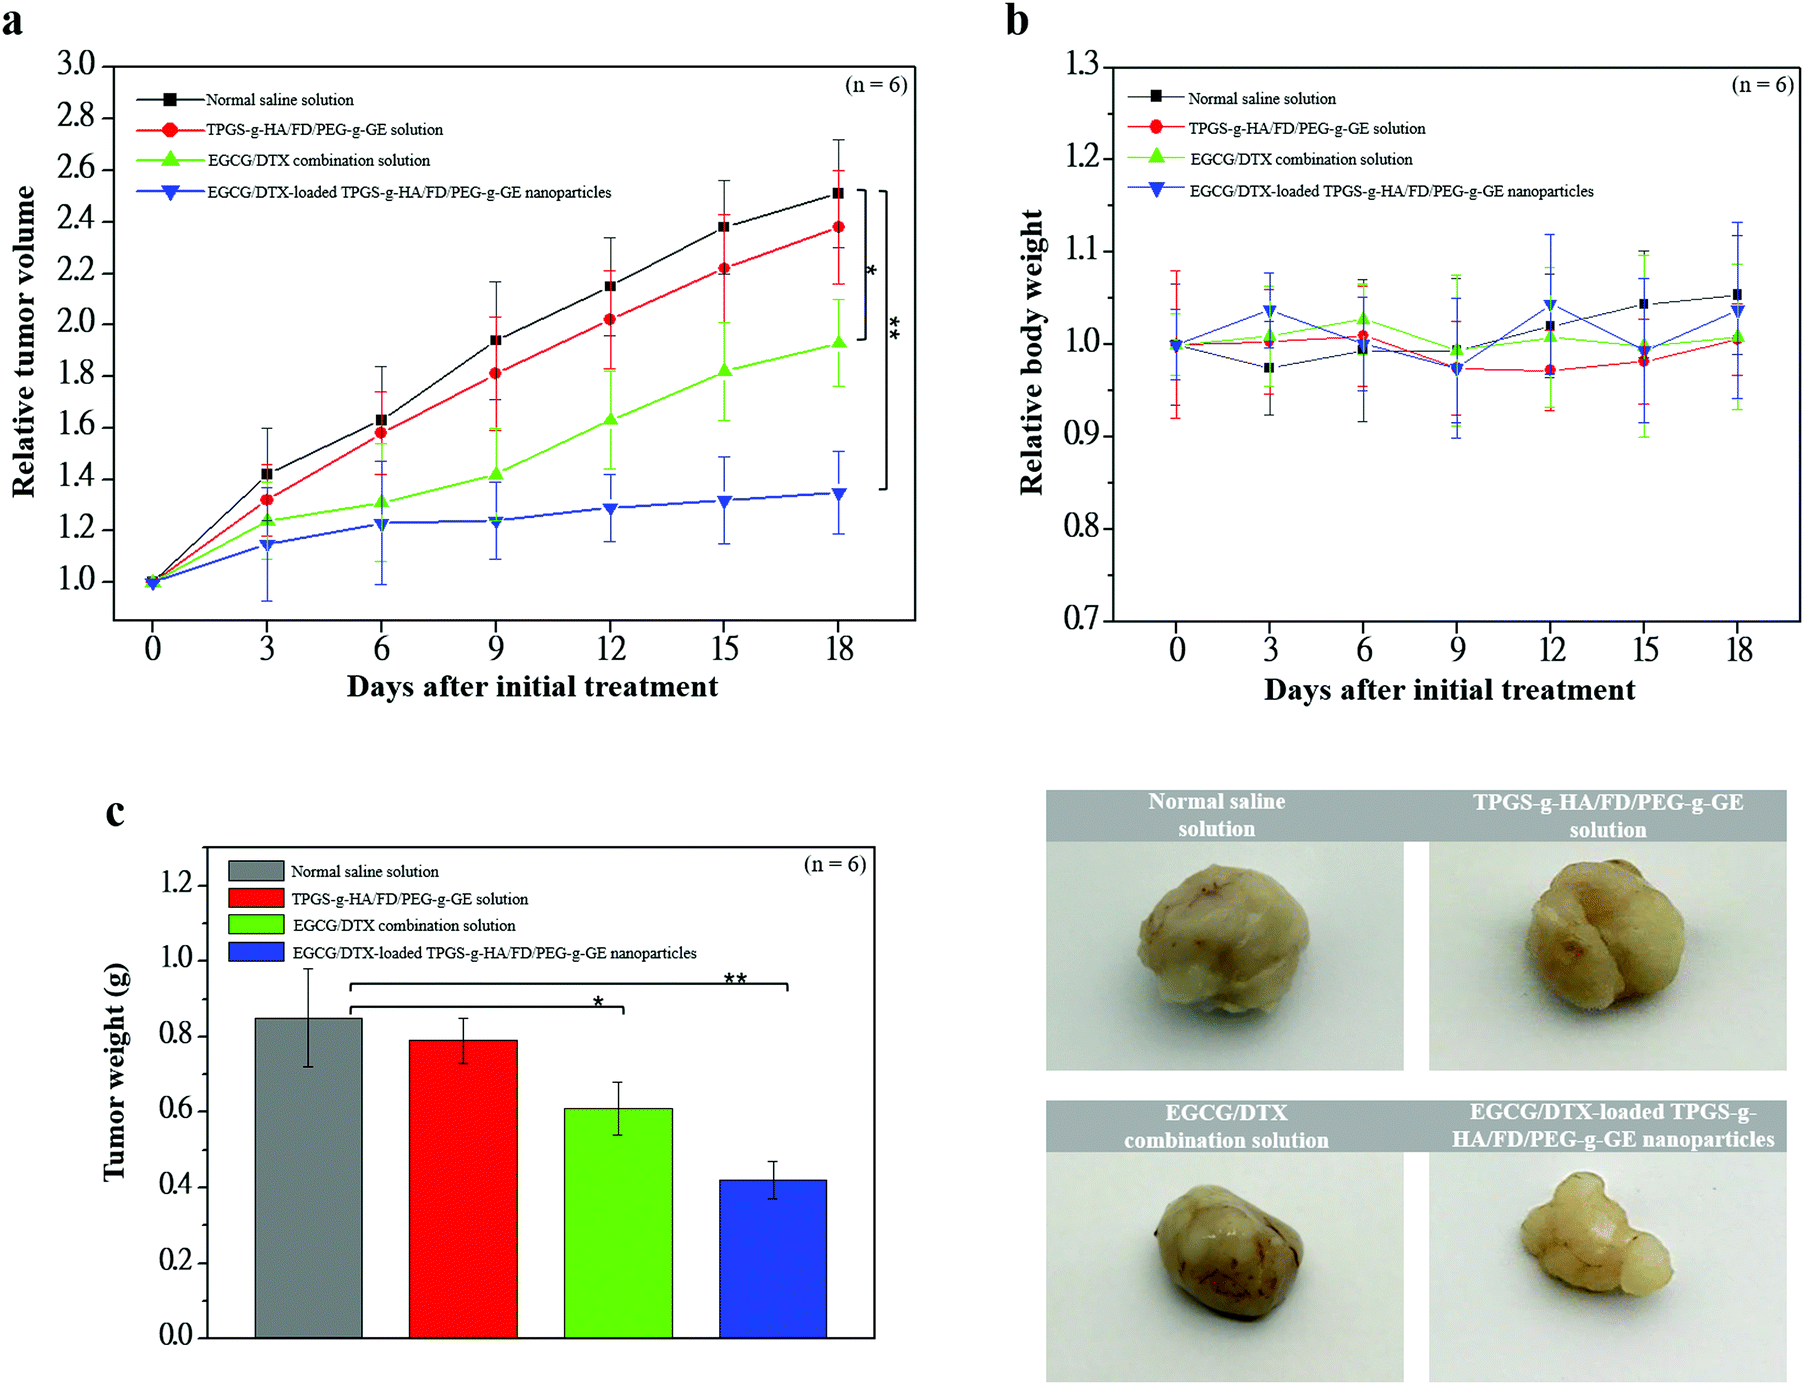 | ||
| Fig. 7 Antitumor effects of distinct samples in a xenograft prostate tumor model. Mice were divided into four groups of six mice and were treated with normal saline solution (■), TPGS-g-HA/FD/PEG-g-GE solution (●), EGCG/DTX combination solution (▲), or EGCG/DTX-loaded TPGS-g-HA/FD/PEG-g-GE nanoparticles (▼). (a) Antitumor response of changes in relative tumor volume; (b) changes in relative body weight; (c) antitumor activities of changes in tumor weight. Asterisk *, ** represents statistically significant difference of p value < 0.05, and p value < 0.01, respectively. | ||
After sacrificing the experimental mice, prostate tumor and other organ biopsies were subjected to histological examination with hematoxylin and eosin staining (Fig. 8). Tumor sections from saline solution or TPGS-g-HA/FD/PEG-g-GE solution-treated animals had more abundant granular eosinophilic cell infiltration (black arrows) compared with those in mice treated with EGCG/DTX-loaded TPGS-g-HA/FD/PEG-g-GE nanoparticles. Importantly, the degree of tumor necrosis increased in the EGCG/DTX-loaded nanoparticles group when compared with the normal saline group, and showed tissue grade 2 necrosis phenomena (necrosis or disappearance of tumor cells more than 2/3; right of black line) (Fig. 8a). Furthermore, immunohistochemical analyses showed increased cell apoptosis of M30 protein expression and diminished expression of cell proliferation Ki67 protein in tumors after treatment with EGCG/DTX-loaded TPGS-g-HA/FD/PEG-g-GE nanoparticles (coffee dots, Fig. 8b). These observations indicate that the targeted nanoparticles induced cancer cells apoptosis, leading to significantly increased antitumor activity and tumor necrosis. Importantly, since safety is crucial for drug development, our histological examination for safety verification showed that EGCG/DTX-loaded nanoparticles did not cause any damage to the major organs including heart, liver, spleen, lung, and kidney, compared to healthy mice (Fig. 8c).
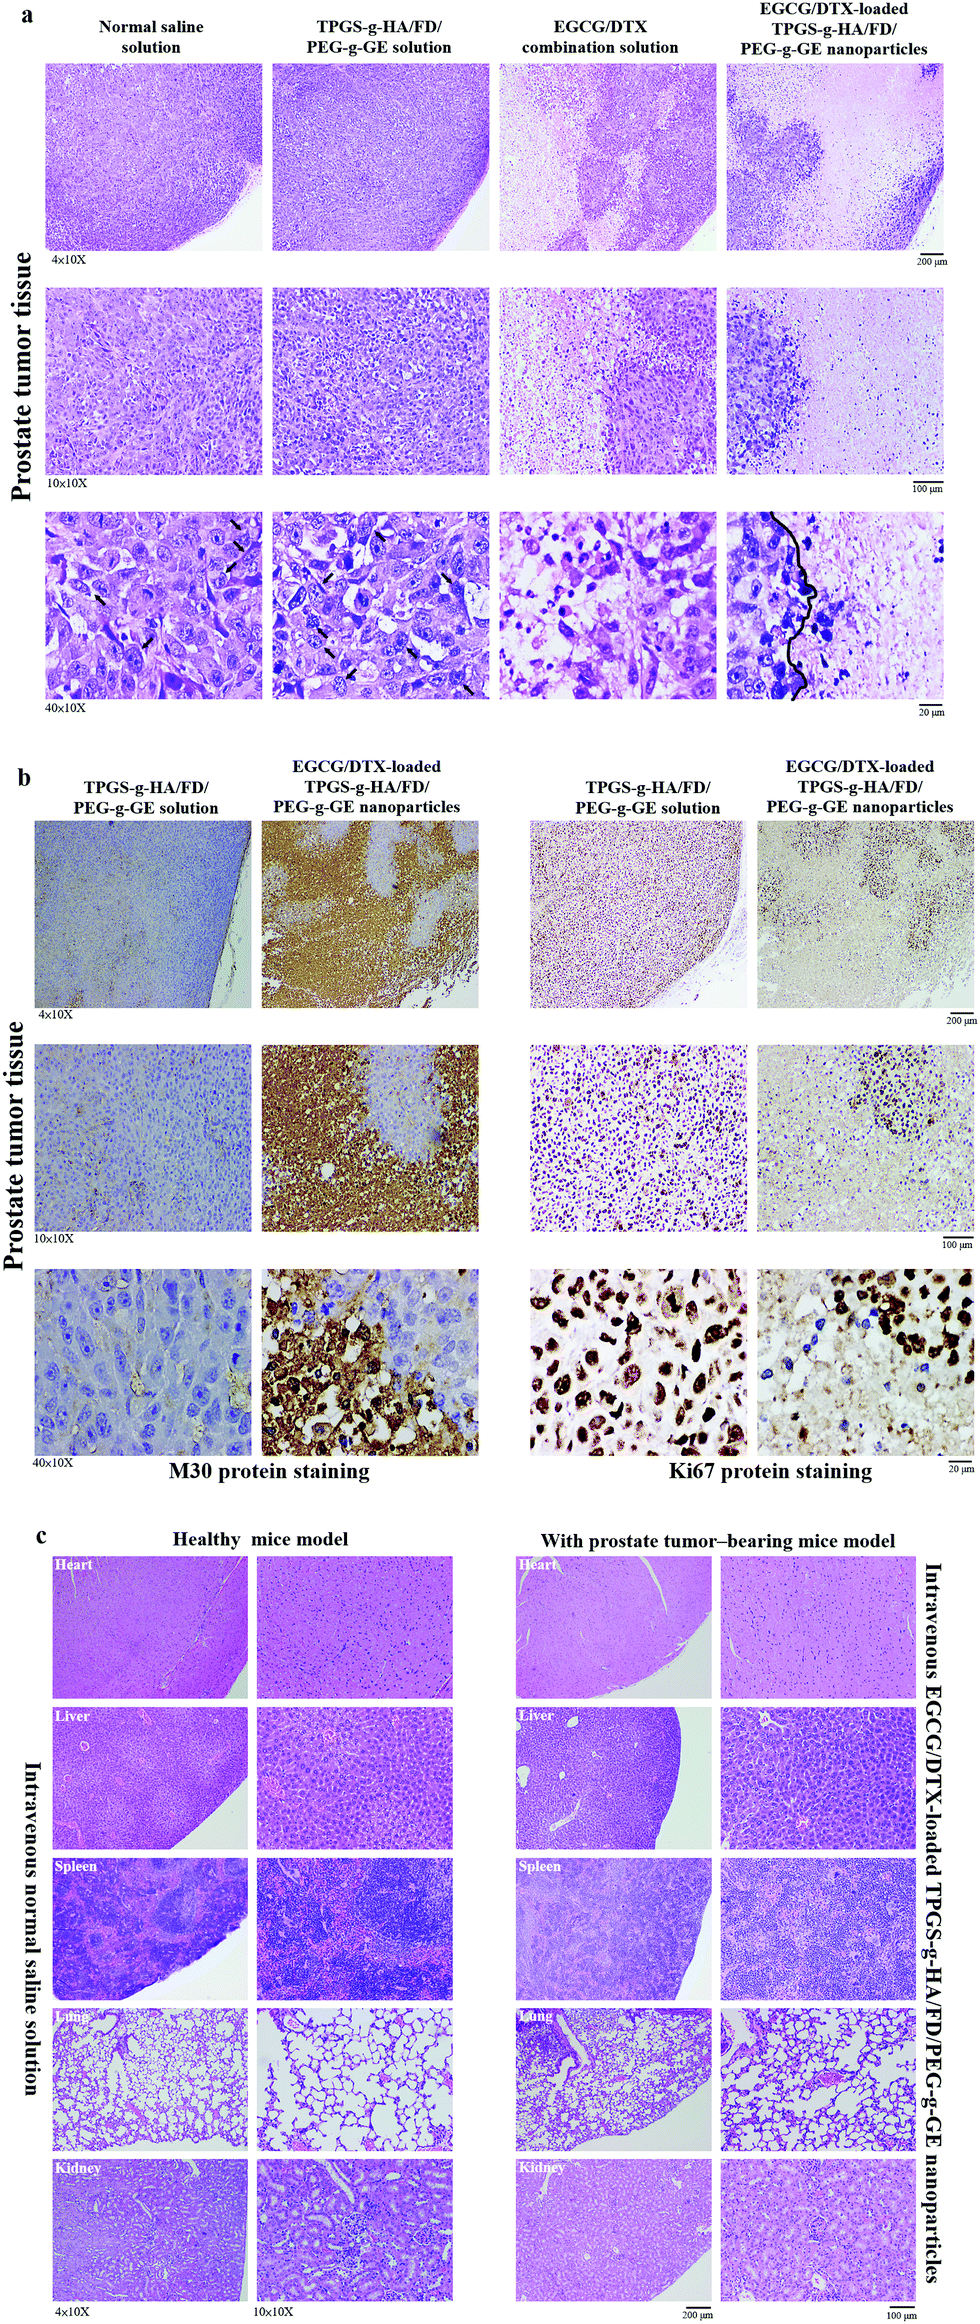 | ||
| Fig. 8 (a) Histological analyses of prostate tumor biopsy after treatment with normal saline solution, TPGS-g-HA/FD/PEG-g-GE solution, EGCG/DTX combination solution, or EGCG/DTX-loaded TPGS-g-HA/FD/PEG-g-GE nanoparticles; (b) immunohistochemical analyses of M30 (apoptosis marker) and Ki67 (proliferation marker) of prostate tumor biopsy after treatment with TPGS-g-HA/FD/PEG-g-GE solution or EGCG/DTX-loaded TPGS-g-HA/FD/PEG-g-GE nanoparticles; (c) histological analyses of organs for prostate tumor-bearing mice after treatment with EGCG/DTX-loaded TPGS-g-HA/FD/PEG-g-GE nanoparticles, compared to healthy mice. | ||
Discussion
Those prostate carcinoma cells that aberrantly express CD44 promote prostate cancer growth and enhance metastatic potential, as shown in xenograft models.40 CD62P (P-selectin) is a Ca2+-dependent endogenous lectin that can be expressed by vascular endothelium and platelets.41 The expression of P-selectin is up-regulated in many human tumor cells and active blood vessels, including the tumor vasculature, whereas normal tissues exhibit little expression.42 Meanwhile, P-selectin has been reported to bind CD44 and facilitate capture of cancer cells and leukocytes on the vascular endothelial cells.43 We used immunohistochemical double staining to confirm both CD44 and P-selectin expression in prostate tumor tissue. As shown in Fig. 1, CD44 or P-selectin were significantly expressed in tumors, both at edges and in centers. Moreover, after incubation with targeted fluorescent nanoparticles (EGCG/DTX-loaded FA-TPGS-g-HA/Rh6G-FD/PEG-g-GE), we observed significant co-localization and interaction with cell surface of FA-TPGS-g-HA binding CD44 (green/orange spot; red arrows) and Rh6G-FD binding P-selectin (red/purple spot; blue arrows) in PC3 cells (Fig. 5b). This result supports previous work by Stefanick et al. showing that refined dual-receptor-targeted liposomes can achieve selectivity in targeting cancers, while still improving cellular uptake over traditional single-receptor-targeted approaches.44The DTX is the primary chemotherapy in the treatment of prostate cancer. However, its clinical efficacy remains unsatisfactory, due to the problems of drug resistance and cytotoxicity to normal cells.45 To improve the effects of chemotherapies and decrease drug-induced toxicity, many bioactive agents have been used alone or as adjuncts to standard chemotherapies.46 One among these has been green tea, which is derived from the leaves of Camellia sinensis, and has been implicated in a wide range of health benefits due to its diverse biological and pharmacological activities.47 The major bioactive components of green tea polyphenols include (−)-epigallocatechin (EGC), (−)-epigallocatechin-3-gallate (EGCG), (−)-epicatechin (EC), and (−)-epicatechin-3-gallate (ECG), with EGCG as the main component.48 Previous studies have shown that the anticancer potency of green tea is also limited under physiological conditions, and is metabolized or degraded via interactions with hydroxyl groups on its phenol rings.49 However, improved tumor uptake and localization of compounds can be achieved using nanoparticles, which have been generated to target tumors and increase the bioavailability of various drugs.50 Studies suggest that EGCG can synergistically inhibit cancer cells in vitro and in vivo when combined with other dietary agents (such as quercetin) or chemotherapeutic agents (such as DTX).51,52 In our study, we found that this nanoparticle improved simultaneous release and co-delivery of EGCG and DTX to the targeted site, enhancing the synergistic effects. Further, we show that the anticancer synergistic efficacy of EGCG/DTX-loaded nanoparticles was better than that of EGCG/DTX combination solution in decreasing cell viability in vitro, and in inhibiting tumor growth and proliferation in vivo (Fig. 4 and 7).
Drug resistance is the foremost threat in the current era of cancer treatment. Resistance to cytotoxic drugs occurs not only to those used in therapy, but often to structurally and functionally unrelated classes of anticancer drugs. This type of resistance is called MDR, and is frequently associated with overexpression of the mdrl gene, which encodes a 170-kilodalton transmembrane P-gp.53 The P-gp is a phosphoglycoprotein and acts as an unrestrained energy-dependent efflux pump which decreases net intracellular drug accumulation.54 Cao et al. used TPGS to inhibit P-gp-mediated MDR and increase the intravenous injection bioavailability of doxorubicin drugs.55 TPGS, an amphiphilic structure containing a hydrophilic polar head portion and a lipophilic alkyl tail, can be functionalized as an excellent solubilizer, emulsifier, permeation, and bioavailability enhancer of hydrophobic drugs.56,57 In the present study, we investigated the effects of TPGS on the hydrophilic–lipophilic balance (HLB ratio, 13.2) and the formation of TPGS-g-HA/FD/PEG-g-GE nanoparticles loaded with EGCG and DTX. The prepared nanoparticles showed a narrow particle size distribution (particle size 205.48 ± 8.52 nm and polydispersity index 0.22 ± 0.04) (Table 2). When the nanoparticles were incubated with cells for 2 h and the culture medium was removed and replaced for an additional 22 h, we noted a significant expression of drugs [red (Rh6G-EGCCG)/purple (Cy5-DTX)] in the perinuclear space and cell nuclei, indicating that the nanoparticles with TPGS-g-HA could increase intracellular drug accumulation (Fig. 5c). In vivo studies confirmed that EGCG/DTX-loaded nanoparticle treatment inhibited 53% of prostate tumor growth compared with the control group, which was much better than the inhibitory efficacy of EGCG/DTX combination solution treatment (31% inhibition), and diminished expression of the proliferation marker protein Ki67 (Fig. 8b). Hence, our results verified that EGCG/DTX-loaded nanoparticles can successfully target prostate tumors in mice, and can enhance the synergistic efficacy of EGCG/DTX cancer therapy.
Conclusions
The present study indicated that TPGS-g-HA and FD-based nanoparticles with increasing hydrophobic–hydrophilic combination drugs internalize into cancer cells through CD44 and P-selectin ligand recognition, leading to significant enhancement of anti-prostate tumor activity. The multifunctional nanoparticle system we describe has the potential to provide a delivery system for improving the synergistic effects of drugs and activity targeting techniques that will facilitate novel clinical trials.Funding
This work was supported by grants MOST 107-2221-E-010-004-MY3 from Ministry of Science and Technology and CY10810 from the Cheng Hsin General Hospital, Taipei, Taiwan.Conflicts of interest
The authors declare no conflict of interest.Acknowledgements
The authors would like to thank Enago (http://www.enago.tw), for the English language review.References
- M. Tao, S. He, J. Liu, H. Li, L. Mei, C. Wu, K. Xu and W. Zhong, J. Mater. Chem. B, 2019, 7, 469–476 RSC.
- R. L. Siegel, K. D. Miller and A. Jemal, CA-Cancer J. Clin., 2017, 67, 7–30 CrossRef.
- B. J. Feldman and D. Feldman, Nat. Rev. Cancer, 2001, 1, 34–45 CrossRef CAS.
- R. A. Madan, S. K. Pal, O. Sartor and W. L. Dahut, Clin. Cancer Res., 2011, 17, 3892–3902 CrossRef CAS.
- Y. Zhu, C. Liu, C. Armstrong, W. Lou, A. Sandher and A. C. Gao, Clin. Cancer Res., 2015, 21, 4133–4142 CrossRef CAS.
- D. Zhu, W. Tao, H. Zhang, G. Liu, T. Wang, L. Zhang, X. Zeng and L. Mei, Acta Biomater., 2016, 30, 144–154 CrossRef CAS.
- M. M. Gottesman, T. Fojo and S. E. Bates, Nat. Rev., 2002, 2, 48–58 CAS.
- K. Bogman, F. Erne-Brand, J. Alsenz and J. Drewe, J. Pharm. Sci., 2003, 92, 1250–1261 CrossRef CAS.
- D. W. Miller, E. V. Batrakova and A. V. Kabanov, Pharm. Res., 1999, 16, 396–401 CrossRef CAS.
- J. M. Dintaman and J. A. Silverman, Pharm. Res., 1999, 16, 1550–1556 CrossRef CAS.
- T. Liu, X. Liu, H. Xiong, C. Xu, J. Yao, X. Zhu, J. Zhou and J. Yao, Polym. Chem., 2020, 11, 39–46 RSC.
- S. Tan, A. Yamashita, S. J. Gao and M. Kurisawa, Acta Biomater., 2019, 94, 320–329 CrossRef CAS.
- W. Li, L. Qian, J. Lin, G. Huang, N. Hao, X. Wei, W. Wang and J. Liang, Oncotarget, 2017, 8, 65143–65151 CrossRef.
- S. Amorim, I. Pashkuleva, C. A. Reis, R. L. Reis and R. A. Pires, J. Mater. Chem. B, 2020, 8, 3880–3885 RSC.
- S. Banerji, A. J. Wrigh, M. Noble, D. J. Mahoney, I. D. Campbell, A. J. Day and D. G. Jackson, Nat. Struct. Mol. Biol., 2007, 14, 234–239 CrossRef CAS.
- S. Chan, K. Friedrichs, D. Noel, T. Pintér, S. Van Belle, D. Vorobiof, R. Duarte, M. Gil Gil, I. Bodrogi, E. Murray, L. Yelle, G. von Minckwitz, S. Korec, P. Simmonds, F. Buzzi, R. González Mancha, G. Richardson, E. Walpole, M. Ronzoni, M. Murawsky, M. Alakl, A. Riva and J. Crown, J. Clin. Oncol., 1999, 17, 2341–2354 CrossRef CAS.
- F. V. Fossella, R. DeVore, R. N. Kerr, J. Crawford, R. R. Natale, F. Dunphy, L. Kalman, V. Miller, J. S. Lee, M. Moore, D. Gandara, D. Karp, E. Vokes, M. Kris, Y. Kim, F. Gamza and L. Hammershaimb, J. Clin. Oncol., 2000, 18, 2354–2362 CrossRef CAS.
- J. Picus and M. Schultz, Semin. Oncol., 1999, 26, 14–18 CAS.
- N. Mayura, S. Sunao, H. Taro, K. Masayoshi, T. Tetsuro, T. Toshiro and U. Toyoaki, Mol. Clin. Oncol, 2016, 4, 942–946 CrossRef.
- J. D. Hainsworth, Oncologist, 2004, 9, 538–545 CrossRef CAS.
- M. E. Stearn and M. Wang, Clin. Transl. Oncol., 2011, 4, 147–156 CrossRef.
- S. Aryal, C. M. J. Hu, V. Fu and L. Zhang, J. Mater. Chem., 2012, 22, 994–999 RSC.
- R. X. Zhang, H. L. Wong, H. Y. Xue, J. Y. Eoh and X. Y. Wu, J. Controlled Release, 2016, 240, 489–503 CrossRef CAS.
- M. Caldas, A. C. Santos, F. Veiga, R. Rebelo, R. L. Reis and V. M. Correlo, Acta Biomater., 2020, 105, 26–43 CrossRef CAS.
- C. M. Hu, S. Aryal and L. Zhang, Ther. Delivery, 2010, 1, 323–334 CrossRef CAS.
- Á. Artiga, I. S. Sevilla, L. De Matteis, S. G. Mitchell and J. M. De La Fuente, J. Mater. Chem. B, 2019, 7, 876–896 RSC.
- M. Ferrari, Nat. Rev. Cancer, 2005, 5, 161–171 CrossRef CAS.
- S. Thakkar, D. Sharma, K. Kalia and R. K. Tekade, Acta Biomater., 2020, 1, 43–68 CrossRef.
- Y. Shamay, M. Elkabets, H. Li, J. Shah, S. Brook, F. Wang, K. Adler, E. Baut, M. Scaltriti, P. V. Jena, E. E. Gardner, J. T. Poirier, C. M. Rudin, J. Baselga, A. Haimovitz-Friedman and D. A. Heller, Sci. Transl. Med., 2016, 8, 345ra87 CrossRef.
- H. Läubli and L. Borsig, Semin. Cancer Biol., 2010, 20, 169–177 CrossRef.
- T. Zaporozhets and N. Besednova, Pharm. Biol., 2016, 54, 3126–3135 CrossRef CAS.
- R. R. Kannan, R. Arumugam and P. Anantharaman, Int. J. Biol. Macromol., 2013, 62, 30–34 CrossRef CAS.
- M. Omata, N. Matsui, N. Inomata and T. Ohno, J. Cardiovasc. Pharmacol., 1997, 30, 717–724 CrossRef CAS.
- M. E. Preobrazhenskaya, A. E. Berman, V. I. Mikhailov, N. A. Ushakova, A. V. Mazurov, A. V. Semenov, A. I. Usov, N. E. Nifant’ev and N. V. Bovin, Biochem. Mol. Biol. Int., 1997, 43, 443–451 CAS.
- T. C. Chou, Cancer Res., 2010, 70, 440–446 CrossRef CAS.
- U. Goswami, A. Dutta, A. Raza, R. Kandimalla, S. Kalita, S. S. Ghosh and A. Chattopadhyay, ACS Appl. Mater. Interfaces, 2018, 10, 3282–3294 CrossRef CAS.
- D. H. Zhou, X. Wang, M. Yang, X. Shi, W. Huang and Q. Feng, Int, J. Mol. Sci., 2013, 14, 12023–12036 CrossRef.
- S. Park, J. H. Kim, Y. I. Hwang, K. S. Jung, Y. S. Jang and S. H. Jang, Tuberc. Respir. Dis. Yearb., 2014, 76, 114–119 CrossRef.
- T. Andreani, A. L. de Souza, C. P. Kiill, E. N. Lorenzón, J. F. Fangueiro, A. C. Calpena, M. V. Chaud, M. L. Garcia, M. P. Gremião, A. M. Silva and E. B. Souto, Int. J. Pharm., 2014, 473, 627–635 CrossRef CAS.
- C. Liu, K. Kelnar, B. Liu, X. Chen, T. Calhoun-Davis, H. Li, L. Patrawala, H. Yan, C. Jeter, S. Honorio, J. F. Wiggins, A. G. Bader, R. Fagin, D. Brown and D. G. Tang, Nat. Med., 2011, 17, 211–215 CrossRef CAS.
- S. Aigner, Z. M. Sthoeger, M. Fogel, E. Weber, J. Zarn, M. Ruppert, Y. Zeller, D. Vestweber, R. Stahel, M. Sammar and P. Altevogt, Blood, 1997, 89, 3385–3395 CrossRef CAS.
- L. Gong, H. J. Mi, H. Zhu, X. Zhou and H. Yang, Mol. Med. Rep., 2012, 5, 935–942 CrossRef CAS.
- C. Chen, Q. Zhang, S. Liu, K. R. Parajuli, Y. Qu, J. Mei, Z. Chen, H. Zhang, D. B. Khismatullin and Z. You, Prostate, 2015, 75, 883–895 CrossRef CAS.
- J. F. Stefanick, D. T. Omstead, T. Kiziltepe and B. Bilgicer, Nanoscale, 2019, 11, 4414–4427 RSC.
- T. Chandrasekar, J. C. Yang, A. C. Gao and C. P. Evans, Transl. Androl. Urol, 2015, 4, 365–380 Search PubMed.
- A. Vickers, Cancer Invest., 2002, 20, 1069–1079 CrossRef.
- J. Anand, B. Upadhyaya, P. Rawat and N. Rai, 3 Biotech, 2015, 5, 285–294 CrossRef.
- J. D. Lambert and C. S. Yang, Mutat. Res., 2003, 523–524, 201–208 CrossRef CAS.
- K. R. Landis-Piwowar, C. Huo, D. Chen, V. Milacic, G. Shi, T. H. Chan and Q. P. Dou, Cancer Res., 2007, 67, 4303–4310 CrossRef CAS.
- D. Zhi, T. Yang, J. Yang, S. Fu and S. Zhang, Acta Biomater., 2020, 102, 13–34 CrossRef CAS.
- P. Wang, D. Heber and S. M. Henning, Nutr. Cancer, 2012, 64, 580–587 CrossRef CAS.
- H. Wu, Y. Xin, Y. Xiao and J. Zhao, Cancer Biother. Radiopharm., 2012, 27, 204–209 CrossRef CAS.
- R. L. Juliano and V. Ling, Biochim. Biophys. Acta, 1976, 455, 152–162 CrossRef CAS.
- F. G. Hoosain, Y. E. Choonara, L. K. Tomar, P. Kumar, C. Tyagi, L. C. du Toit and V. Pillay, BioMed Res. Int., 2015, 2015, 484963 Search PubMed.
- N. Cao and S. S. Feng, Biomaterials, 2008, 29, 3856–3865 CrossRef CAS.
- C. Yang, T. Wu, Y. Qi and Z. Zhang, Theranostics, 2018, 8, 464–485 CrossRef CAS.
- Á. Artiga, I. S. Sevilla, L. De Matteis, S. G. Mitchell and J. M. De La Fuente, J. Mater. Chem. B, 2019, 7, 876–896 RSC.
| This journal is © The Royal Society of Chemistry 2020 |