
A cell membrane vehicle co-delivering sorafenib and doxorubicin remodel the tumor microenvironment and enhance immunotherapy by inducing immunogenic cell death in lung cancer cells
Jun
Wan
,
Jian
Wang
,
Min
Zhou
,
Zhanpeng
Rao
and
Xiean
Ling
 *
*
Department of Thoracic Surgery, The Shenzhen People's Hospital, The Second Clinical Medicine College of Jinan University, Shenzhen, Guangdong 518020, P. R. China
First published on 18th July 2020
Abstract
Cancer immunotherapy is a promising approach for cancer therapy but is usually hindered by the inhibition of the tumor microenvironment (TME). Herein, we developed a cell membrane vehicle (CV) to co-deliver doxorubicin (Dox) and sorafenib (Sfn) as a drug delivery system (CV/D–S) to regulate the TME and sensitize the immunogenic cell death (ICD)-induced immune response against tumors. The CV/D–S showed high stability, acid-responsive drug release, high biocompatibility with tumor-specific cellular uptake, and target-ability that preferably resulted in the in vitro and in vivo anticancer performance. Most importantly, the Dox in the DDS can induce significant ICD while Sfn was able to remodel the TME, downregulate Treg, activate effector T cells and relieve programmed cell death protein 1 (PD-1) expression. As a result, the synergistic effect of Dox and Sfn achieved strong immune response in CV/D–S treated mice, which is believed to open a new window for the design and development of future platforms for the more effective immunotherapy of cancer.
Introduction
Cancer immunotherapy is becoming one of the most promising approaches in the treatment of cancer, regardless of cancer type.1,2 Compared with single chemotherapy or other interventional therapies, cancer immunotherapy utilizes the endogenous immune system to cure cancer, which is believed to be more effective and safe without the threat of side effects.3 Nowadays, it is generally recognized that the combination of cancer immunotherapy with other supplementary treatments might be the best option for cancer therapy.4 However, the acquisition of proper immunity towards cancer cells with high precision remains a major challenge in cancer immunotherapy and is becoming the research center of current studies.5,6Recently, it is found that some chemotherapeutics, such as anthracyclines and oxaliplatin, have the potential to induce not only apoptosis but also immunogenic cell death (ICD) within tumor tissues.7,8 By inducing autophagy of tumor cells, three kinds of signals are released: calcinin is exposed to the cell surface and stimulates dendritic cell (DC) phagocytosis;9 adenosine triphosphate is released to recruit DC into the tumor tissue.10,11 High migration rate group protein B1 promotes the formation of stable binding between DC and dying tumor cells, and induces the body to produce specific T cell anti-tumor immunity.12 In-depth understanding and utilization of chemotherapy-induced ICD is of great significance to the improvement of immunotherapy regimens.
However, the weak immune response after chemotherapy is usually observed despite the above mentioned ICD mechanisms, which severely limits the advances of related applications.13,14 Recent studies have revealed that the tumor microenvironment (TME) is responsible for the poor immune response,15,16 not only in chemotherapy, but also in immunotherapy, such as the programmed cell death protein 1 (PD-1) inhibition17 and the DC vaccine.18 It is suggested that the specific TME can prevent infiltration of DC and downregulate the activity of effector T cells through regulatory T cells (Treg) and finally result in immune silence of current therapies.
Sorafenib (Sfn) is a small molecule generally recognized as an inhibitor of multi-kinase and is used in the treatment of various cancers through the introduction of necrotic death.19 However, recent discoveries have demonstrated its potential in the regulation of TME, including the suppression of immunosuppressive cell subsets20 and augmenting functions of tumor-specific cytotoxic T cells.21 Therefore, it was hypothesized that Sfn may be a promising drug to be administered along with anthracyclines and oxaliplatin to augment the immune response of these drugs. Upon the chemotherapy of anthracyclines and oxaliplatin, the ICD-induced immune response can be readily achieved through the TME regulation effects of Sfn.22 However, to achieve the co-delivery of both drugs in one drug delivery system (DDS) with decent drug loading capacity, as well as promising tumor targetability,23,24 the selection of optimal carrier becomes the core difficulty.
In recent decades, DDSs based on nanoparticles have shown many advantages over free drugs in drug delivery, such as elevated drug loading capacity, as well as enhanced bioavailability, which are widely recognized as indispensable tools for cancer therapy.25–27 Therefore, various DDSs have been developed and tested based on nanoparticles composed of either organic or inorganic materials.28–30 Recently, the introduction of cell membrane-derived vehicles as the main components or accessory structures (such as surface material) has become the best solution for the above-mentioned dilemma.31–33 Firstly, the cell membrane derivatives inherit the whole proteins of the mother cells, which show similar properties to the mother cells when being prepared into DDS.34 Most importantly, the same lipid bilayer structure between the cell membrane derivatives and cancer cell membrane also makes it a suitable DDS for drug delivery with enhanced cell internalization.35 Finally, the cell membrane derivatives are of natural origin with high biocompatibility and high accessibility.36 As a result, recent studies have devoted extensive efforts to exploring the DDS potential of cell membrane derivatives. In particular, the cell membrane vehicle (CV) derived from cancer cells that inherit the long circulation and tumor targetability nature of mother cells, is acquiring more and more attention in cancer therapy.37,38
Herein, we have employed the drug-resistant lung carcinoma cell line (LLC/Dox) in mice as the model and isolated its cell membrane as the vehicle (CV) for the loading of Sfn and doxorubicin (Dox), an anthracycline for the treatment of a wide spectrum of cancers (CV/D–S). It was suggested that the CV/D–S can take advantage of the tumor-homing nature of CV to target tumor tissue and deliver both drugs into the same target cells. Moreover, the Dox-induced ICD in tumor cells, while Sfn regulated the TME. It was expected that the TME regulation of Sfn would facilitate the immune response induced by the ICD of Dox, which would finally arouse the tumor-specific immunity for the effective treatment of LLC/Dox cancer. This study provides new avenues for the cascade-amplifying antitumor effects of chemotherapy-assisted cancer immunotherapy, which opens a new window for the design and development of future DDSs for the more effective immunotherapy of cancer.
Materials and methods
Chemicals, cell lines and animal models
The chemicals and reagents adopted in our study were from Sigma (M.O. USA) unless otherwise illustrated. The doxorubicin (Dox)-resistant mice lung carcinoma cell line (LLC/Dox) was purchased from ATCC (Virginia, USA) and incubated in fetal bovine serum in DMEM (Gibco, California, USA) and cultured in standard incubation conditions as previously reported.39 Male Balb/c mice were provided by the Model Animal Research Center of Nanjing University (Nanjing, China) and raised according to NIH guidelines for the use of experimental animals. All animal procedures were approved and supervised by the Animal Ethics Committee of Jinan University. The LLC/Dox tumor-bearing mice were established according to a previous report.40The multicellular tumor spheroid (MCTS) was established according to a previously reported protocol by culturing the mixed cell suspension of LLC/Dox and NIH3T3 (number ratio of 1![[thin space (1/6-em)]](https://www.rsc.org/images/entities/char_2009.gif) :1) on a 96-well plate (Corning, USA) for 2–3 days under the above-mentioned culture conditions.41
:1) on a 96-well plate (Corning, USA) for 2–3 days under the above-mentioned culture conditions.41
Preparation of CV and drug loading
The LLC/Dox cells at the logarithmic phase were collected and rinsed three times using PBS. Afterwards, the cells were incubated with PBS (107 cells per mL) containing 25 mM paraformaldehyde and 2 mM dithiothreitol at 37 °C for 2 h. The solution was then centrifuged at 500 g for 10 min (L720R-3, Cence, Changsha, China) and the supernatant was then subjected to probe sonication (600 w for 30 min) at 4 °C. The solution was finally concentrated using a centrifugal filter (30 kDa, Millipore, CA, USA) at 5000 g for 0.5 h. The collected solution containing the CV was quantified using a BCA kit (Thermo-Fisher, California, USA) according to the manufacturer's instructions and stored at 4 °C until further use.In order to load drugs, Dox (200 μL, 1 mg mL−1 in DMSO) and Sfn (200 μL, 1 mg mL−1 in DMSO) were added drop-wise into an aqueous solution of CV (2 mL, 100 μg mL−1 protein) with gentle agitation. Then, the solution was subjected to dialysis (10 kDa, 1 L × 5) to remove unloaded drugs, and the collected solution in the dialysis bag was CV/D–S. A single-drug-loaded system was prepared using the same protocol.
The drug loading (Dl) in the DDS was determined using ultraviolet spectroscopy at 480 nm (Dox) and 265 nm (Sfn) (UV5Nano, Mettler Toledo, Zurich, Switzerland).
Characterization
The distribution of particle size was studied by a size analyzer (ZS90, Malvern, UK). The morphology was viewed by a transmission electron microscope (TEM, JEM-2100Plus, JEOL, Japan). The stability of CV/D–S was monitored by its size changes in PBS and mouse plasma for 48 h. The hemolysis of nanoparticles was assessed by incubating different concentrations of CV/D–S with a 2% red blood cell suspension of New Zealand rabbit (Gibco, USA) and the absorption of the supernatant (3000 rpm, 10 min) was assessed at 545 nm.The release profiles of Dox and Sfn from CV/D–S, respectively, were investigated using a previously reported protocol.42 Briefly, CV/D–S was placed in individual dialysis bags with the molecular weight cut off (MWCO) of 7 kDa and immersed in plastic tubes containing PBS with different pH values (pH 7.4 or 5.5). Aliquots of buffer were withdrawn from the tube at predetermined times and the drug concentration in the obtained buffer was determined by ultraviolet spectroscopy as mentioned above.
To evaluate the changes in target proteins, samples (cell or vehicle) were firstly lysed by RIPA buffer (Abcam, UK) to extract the full proteins, and then quantified and normalized by a BCA kit. The samples were loaded on sodium dodecyl sulfate (SDS)-polyacrylamide gel electrophoresis (PAGE) gel for electrophoresis (120 V, 60 min). Then, all isolated proteins were transferred to a poly(vinylidene fluoride) membrane (90 V, 60 min), stained by the corresponding first and IRDyeR680CW-labeled second antibodies (Abcam, UK) and finally visualized by a Gel-Pro analyzer (Genegenius, Syngene, UK).26
Cytotoxicity assay
The cytotoxicity of various concentrations of drug-unloaded nanoparticles (10–200 μg mL−1), as well as CV/D–S (Dox concentration, 2–50 μM; Sfn concentration, 2–50 μM; the molar ratio between Dox and Sfn was fixed at 1) on LLC/Dox cells for 48 h were studied using a standard MTT assay.32MCTS at diameters of around 300 μm were treated with fresh medium containing different formulations (Dox concentration 25 μM) for 5 days at 37 °C. The diameter changes in MCTS were recorded every day and plotted against time.
Cellular uptake and in vivo distribution
LLC/Dox cells were firstly seeded in 6-well plates with 70% confluence, and then cultured in free Dox or CV/Dox for 2, 4 or 6 h. The cells were then subjected to observation under a fluorescence microscope (Axio Observer A1, Zeiss, Germany). In order to reveal the potential roles of CV in the increase of the cell uptake of DDS, LLC/Dox cells were incubated with additional CV for 2 h before the addition of free Dox or CV/Dox. At pre-determined time intervals, cells were detached and positive cells were quantified using flow cytometry (Quanteon, ACEA NovoCyte, Agilent, California, USA).43The ICG was loaded into the CV along with the drug and used as the probe to show the location of the DDS. Afterwards, LLC/Dox tumor-bearing mice were administered with CV/D–S intravenously. At different time intervals after administration (4 and 8 h), the mice were sacrificed and the distribution of DDS was revealed by detecting the ICG signal in organ and tumor tissues using the in vivo imaging instrument (ZEWTON 7.0, Vilber, France).44
In vivo anticancer efficacy
The in vivo anticancer efficacy of CV/D–S was explored using the LLC/Dox tumor xenograft mice model. Specifically, mice were randomly divided into 5 groups (n = 6): (1) saline (as control); (2) CV/Dox; (3) CV/Sfn; (4) CV/D–S. Protocols were adopted from a previous report.32 Briefly, the mice were intravenously injected with different formulations (Dox: 5 mg kg−1; Sfn: 5 mg kg−1) 5 times (every three days until day 15, primary tumor). The measurement of the tumor volume was performed before each administration. The DC infiltration and ICD of cells in the tumor tissues from different groups at day 15 were subjected to immunohistochemical staining. On day 15, the same dose of tumor cells was implanted on the other side of the mice and the tumor volumes were recorded every three days for another 15 days (distant tumor). At the end of the tests, the tumor tissues were excised from sacrificed mice at the end of the test and subjected to Ki67 or TUNEL staining.In vivo immune activation of CV/D–S
The mice were administered with CV/D–S as reported above. On days 0, 2 and 4 post-treatment, the blood of the subjects was collected and the cytokine IL-6 and TNF-α related to the immune activation were determined using the corresponding kits (Abcam, UK).Sfn regulation on the TME, Tregs and effector T cells
The mice were administered with CV/Sfn at different dosages (2, 5 and 10 mg kg−1) using the scheme in the in vivo anticancer experiment. At the end of the test, the tumor tissues were collected to prepare tumor-infiltrating lymphocytes (TIL) as reported previously.45 Tumors were minced and then digested in culture medium supplemented with collagenase Type IV (0.05 mg mL−1), collagenase Type I (0.05 mg mL−1), hyauronidase (25 mg mL−1), soybean trypsin inhibitor (1 mg mL−1) and DNase I (10 mg mL−1) at 37 °C for 30 min. Viable cells were then separated on a Ficoll-Hypaque gradient and used for further analysis. CD4+ cells were isolated using corresponding immunomagnetic beads (Thermo, USA). Purified CD4+ cells were then stained with CD4 and CD25-specific antibodies and dual positive populations were sorted by a FACSAria cell sorter (BD, San Jose, CA USA).To further study the anti-proliferation and apoptosis effects of Sfn on Tregs, the sorted CD4+CD25+ Tregs were cultured in the presence of anti-CD3 (5 mg mL−1), anti-CD28 (2 mg mL−1) antibodies, IL-2 (100 U mL−1) and the indicated concentrations of Sfn (2, 5 and 15 μM) in culture medium for 72 h. The cells were then harvested for Annexin V and [3H] thymidine incorporation assay (BD, San Jose, CA USA) staining as per instructions.
TIL were firstly stained with anti-CD8 and anti-CD25 antibodies and dual positive cells were sorted by flow cytometry. For the analysis of effector cytokine IFNγ production of tumor-specific CD8+ T cells, the IFNγ production of tumor-infiltrating CD8+ cells was determined by anti-CD8 antibody staining followed by intracellular cytokine staining for IFNγ.
The expression of the PD-1 ligand in CD8+ T cells was determined using specific primers. PD-1 ligand expression was normalized to the expression of the housekeeping gene HPRT. Primers include the following: PD-1 ligand, 5′-AATGCTGCCCTTCAGATCAC-3′ (sense) and 5′-ACCCTCGGCCTGACATATTA-3′ (antisense); HPRT, 5′-TCTCGAAGTGTTGGATACAGGCCA-3′ (sense) and 5’CAACAGGACTCCTCGTATTTGCAG-3’ (antisense).
Results and discussion
The CV was prepared by the isolation of the cell membrane from the model cell line of LLC/Dox using DTT as the separation reagent. The size of the obtained CV can be adjusted through careful adjustment of the incubation time, DTT concentrations, as well as the cell number and centrifugation speed. The drugs can be encapsulated within the hydrophobic region of the CV to afford decent drug loading and safe delivery. In this study, under the given condition, the acquired CV/D–S is shown to have a good size distribution at around 100 nm (Fig. 1A) as determined by the dynamic light scattering (DLS) method, suggesting the successful preparation of uniform nano-sized CV using this method. This conclusion was also confirmed by the TEM observation in Fig. 1B. It was shown that the CV/D–S were spherical particles with similar size, which fall within the range determined by DLS. To further determine the component of the DDS, three membrane proteins (AT1R, CXCR4 and Na+–K+ ATPase) were selected as model molecules and their expression levels in the CV, as well as in CV/D–S were studied. As shown in Fig. 1B, the protein levels were comparable in CV and CV/D–S, which suggested that the drug loading did not significantly alter the protein component of CV. Moreover, it was also suggested that the CV/D–S inherited the full protein spectrum of CV, which was beneficial for CV/D–S to serve as a biocompatible DDS for tumor-homing drug delivery. The drug loading of CV/D–S was determined to be 10.63% for Dox and 11.02% for Sfn, which was nearly equal at the weight ratio.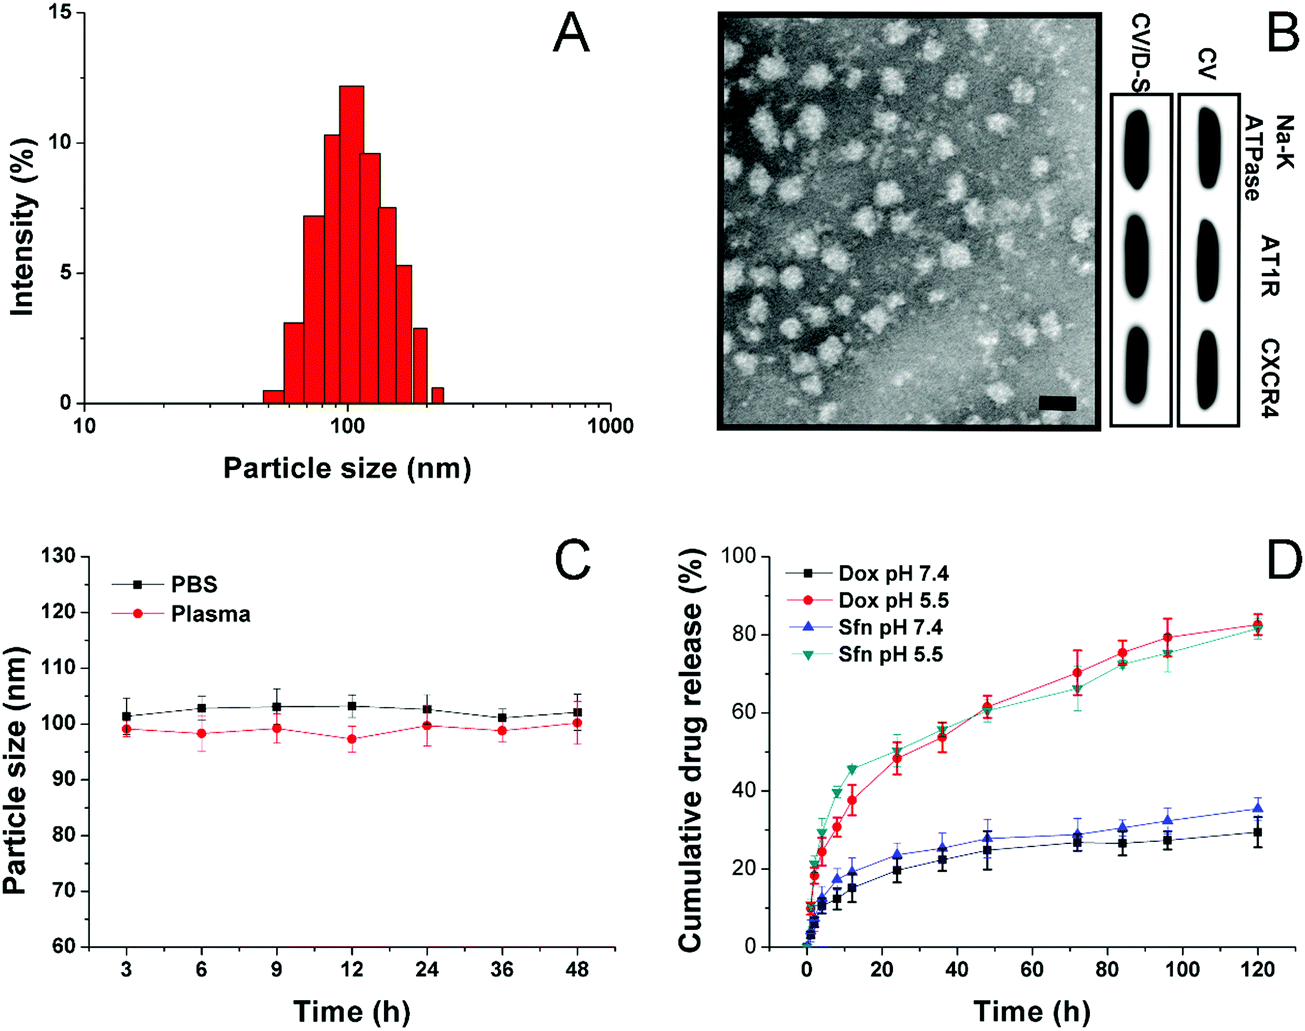 | ||
| Fig. 1 (A) The size distribution of CV/D–S. (B) TEM images (upper) of CV/D–S and western blot analysis (lower) of three representative proteins in CV and CV/D–S. Scale bar: 100 nm. (C) Colloidal stability of CV/D–S in PBS (pH 7.4) and mouse plasma at 37 °C for up to 48 h. (D) Drug release profiles of Dox and Sfn from the CV/D–S in the release media under extracellular and intracellular pH conditions (7.4 and 5.5). Data were expressed as mean ± standard deviation with three parallel experiments. | ||
Considering that the colloidal stability is a critical parameter for evaluating the performance of the DDS, the colloidal stability of CV/D–S under two physiological conditions (PBS 7.4 and mouse plasma) was therefore investigated. According to previous reports, the size of the DDS should maintain stability for a relatively long period to allow the safe delivery of loaded drug molecules to the target tissue without leakage.46,47 As a result, the particle size changes of CV/D–S were selected as the indicator to reflect the colloidal stability. As shown in Fig. 1C, during 48 h of incubation, the size of CV/D–S only showed minor variations in both PBS (pH 7.4) and mouse plasma. Considering the instrumental error, it was therefore concluded that CV/D–S was a stable DDS under physiological conditions that might be suitable for cancer-related drug delivery.
To understand the drug release profile of CV/D–S under different conditions, the Dox release of CV/D–S was evaluated under two different PBS mediums (pH 7.4, mimicking the pH of extracellular physiological condition, and pH 5.5 mimicking the intracellular acid environment of cancer cells). As displayed in Fig. 1D, under extracellular physiological conditions, the drug release of Dox and Sfn from CV/D–S was relatively slow as only 29.46% and 35.46%, respectively, of the total drugs were released at 120 h post-incubation. However, the release of drugs in the intracellular acid environment, which usually occurs in many cancer cells,48,49 was much faster than that in pH 7.4. The total drug release percentage at the end of the test (120 h) was 82.53% and 81.32%, suggesting acid-responsive drug release. The reason for this might be explained by a previous report that the acidic environment might facilitate the diffusion of drugs from the carrier and enhance the solubility of drugs.25 Therefore, it was inferred that CV/D–S was able to maintain stability at the extracellular level with minor drug leakage while being transferred to a burst release state upon entering the acidic cancer cells, which was beneficial for realizing cancer-specific drug delivery for effective cancer therapy.
Afterwards, the biocompatibility of the carrier, as well as CV/D–S, was studied. The hemolysis assay of CV/D–S was firstly investigated by incubating the DDS with 2% red blood cells (RBC) of New Zealand rabbit to reflect the irritation of nanoparticles on RBC in the blood. As illustrated in Fig. 2A, only 1.28% hemolysis rate was obtained at the highest CV/D–S concentration of 1 mg mL−1. It was also well known that the actual DDS concentration upon in vivo application would be much lower than the threshold of 1 mg mL−1 due to the dilution of body fluids (including blood and lymph). Therefore, the CV/D–S was concluded to be a safe DDS without a significant risk of inducing hemolysis on RBCs.
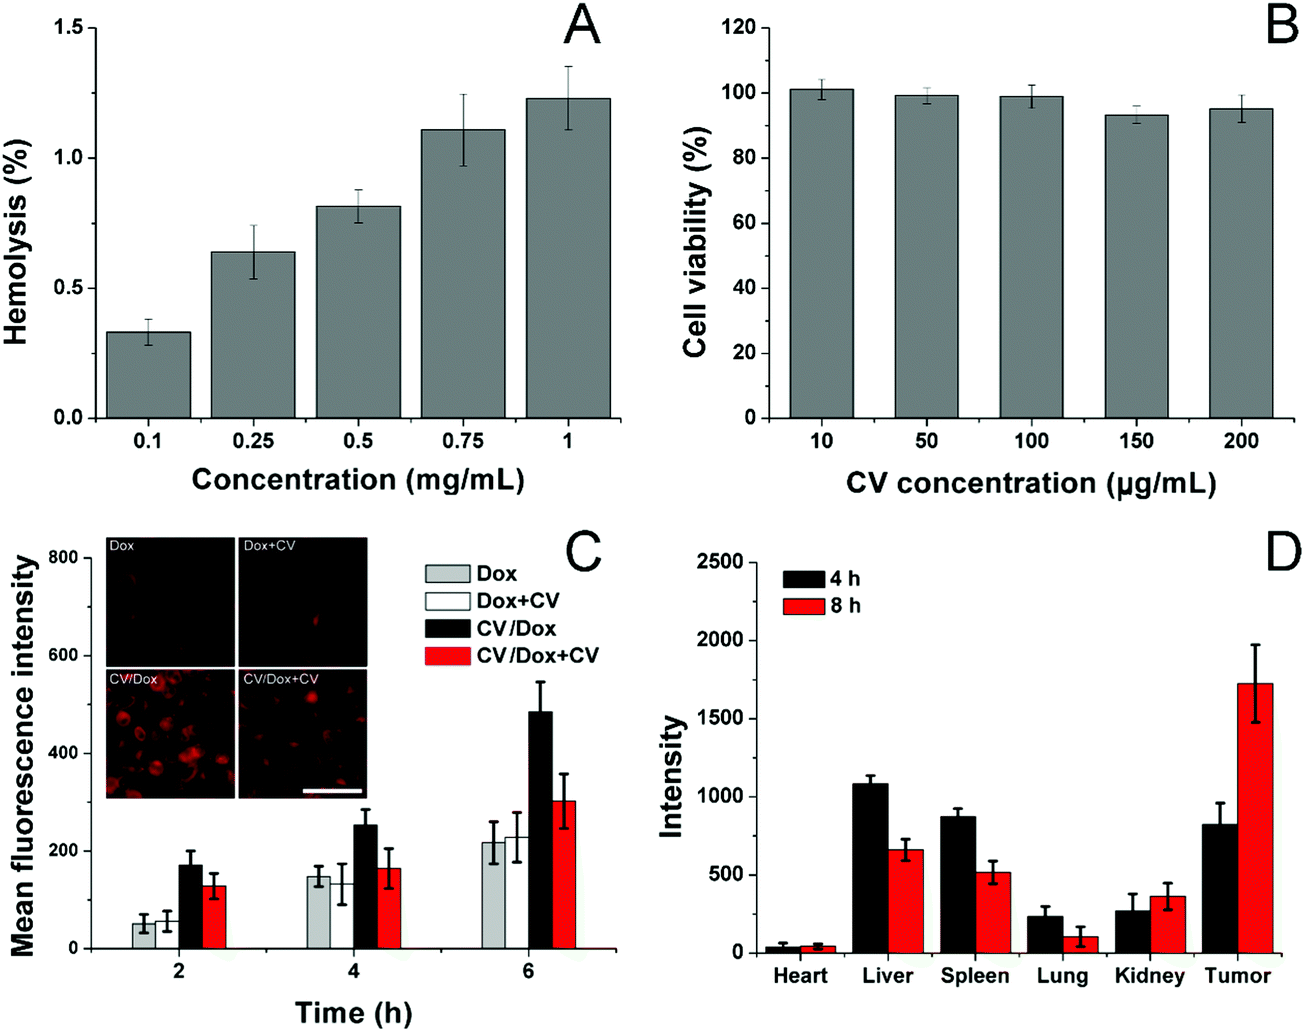 | ||
| Fig. 2 (A) Hemolysis of CV/D–S on 2% RBC under different concentrations at 37 °C for 1 h. (B) Cytotoxicity of various concentrations of CV after 48 h of incubation with LLC/Dox cells. (C) Quantitative analysis of intracellular time-dependent uptake of CV/Dox in LLC/Dox cells in comparison with free Dox and pretreated with/without CV. The inserted image is the representative intracellular fluorescence signal of Dox at 4 h post-incubation. Scale bar: 100 μm. (D) Mean fluorescence intensity of dissected tumors and major organs of mice treated with CV/D–S at 4 and 8 h post-injection. Data were expressed as mean ± standard deviation with three parallel experiments. | ||
To further determine the cytotoxicity of the drug-free carrier on cancer cells upon arrival the target tissue, the drug-free carrier (CV) incubated with LLC/Dox cells at various concentrations for 48 h and the cell viability after treatment were studied. As displayed in Fig. 2B, the cell viability of LLC/Dox cells at 48 h post-incubation remained at over 90% at the high concentration (200 μg mL−1), indicating the potential of the cell membrane-derived carrier to be a highly biocompatible carrier. Moreover, it was also suggested that the carrier showed almost no cytotoxicity effects on the cells, indicating that the results in the following assays were due to the effects of drugs but not the interference of carriers.
The cellular uptake of drugs in LLC/Dox was studied in comparison with free Dox with or without the pretreatment of CV, to understand the role of CV in the drug delivery. To exclude the potential influence of Sfn in cellular uptake, CV/Dox with similar size and surface properties was employed to replace CV/D–S and the inherent fluorescence nature of Dox was adopted to quantify the cellular accumulation of drugs. As shown in Fig. 2C, similar to previous reports, the cellular uptake of nanoparticle-based DDS was time-dependent, as more DDS would accumulate in the cells as the incubation time was extended.50,51 It was noted that free Dox showed weak cellular accumulation in drug-resistant LLC/Dox cell lines. However, the introduction of CV as the DDS can significantly reduce this disadvantage. It was suggested that nanoparticles can facilitate the endocytosis of drugs through receptor-mediated pathways, which can reverse the drug-resistant (mainly through the excretion of drug molecules) nature of cells to some extent. More importantly, significant differences in the intracellular fluorescence signals were observed in groups pretreated with or without CV. In detail, CV showed almost no impact on the cellular uptake of free Dox, indicating that the cellular accumulation of free Dox was independent of the existence of free CV. However, the ones in the CV/Dox group were significantly affected and the intracellular accumulation of Dox was greatly reduced to a lower level and this phenomenon was not relieved as time extended. For example, at 6 h, the fluorescence signal in the CV pretreated group was merely 60.2%, suggesting that free CV exerted a critical role in the cellular uptake of CV/Dox. It was reported by previous studies that CV played an important role in the recognition and mediation of CV-modified nanoparticles into cancer cells, which was in line with our results.52,53
The CV obtained from isogenous LLC/Dox was shown to hold the potential to specifically target the mother cells. Therefore, it was suggested that the in vivo targetability of CV/D–S to LLC/Dox might also be increased due to the same mechanism. To prove this, the CV was labeled with ICG and then employed to construct DDSs. After tail vein injection, the mice were sacrificed at pre-designed time intervals and the obtained tumors and major organs were studied regarding the accumulation of ICG signals. As shown in Fig. 2D, CV/D–S showed strong accumulation in the tumor tissue at merely 4 h post-injection. Moreover, due to the CV modification, the distribution of CV/D–S in the reticuloendothelial system (RES) was greatly reduced and the DDS accumulation to the tumor tissue was significantly enhanced. This tendency was further enhanced as the accumulation of ICG signal in the tumor was further increased, while the retention of nanoparticles in RES was reduced at 8 h post-administration as compared to results obtained in 4 h.
After confirming the in vitro and in vivo targetability potential of CV/D–S, the anticancer profile of the DDS was the concern of our work. The in vitro anticancer study was evaluated by the classic MTT assay. As illustrated in Fig. 3A, the LLC/Dox cells showed strong resistance to Dox. The cell viability was over 73.2%, even at the highest Dox dosage of 50 μM in the CV/Dox group. The CV/Sfn also showed certain cytotoxicity effects on LLC/Dox, which might be due to the cell-killing effects of Sfn. In particular, it was noted that that the combination of Dox and Sfn showed unparalleled decreases in cell viability at all tested concentrations and even reached 35.4% at the Dox concentration of 50 μM. The calculated combination index (CI) between Dox and siRNA was suggested to be 0.39, which was much lower than 1 and demonstrated a powerful synergistic inhibition effect on LLC/Dox cells.
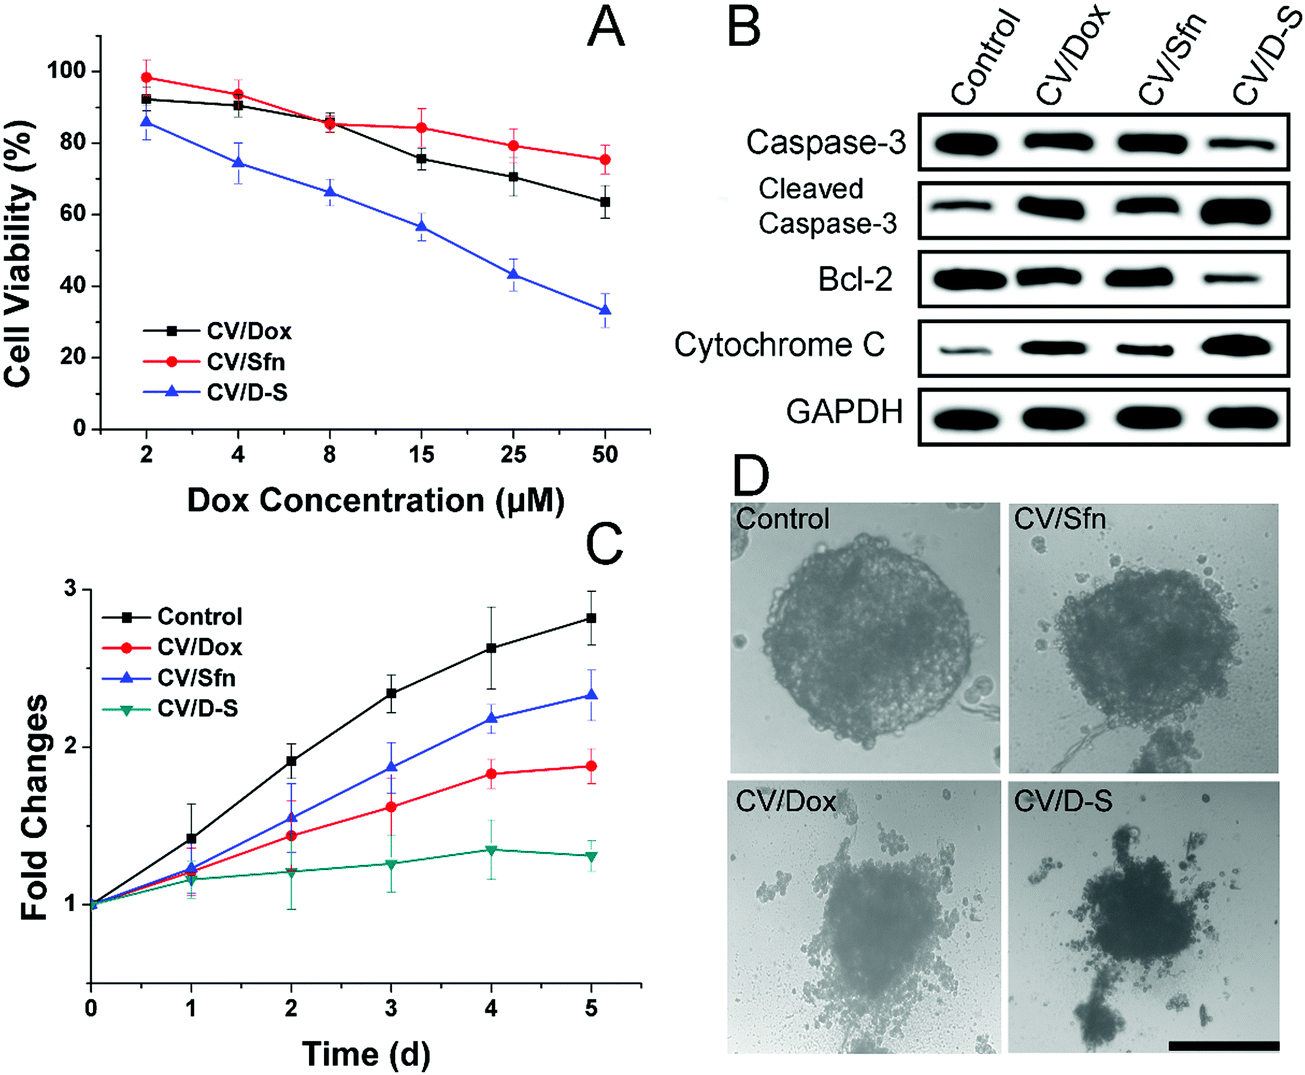 | ||
| Fig. 3 In vitro anticancer effects. (A) Cell viability of LLC/Dox cells treated with different formulations at different Dox concentrations for 48 h. (B) Western blot assays of the expression of caspase-3, cytochrome C and bcl-2 proteins after different treatments (Dox concentration: 20 μM). (C) The volume changes of MCTS after different treatments (Dox concentration: 20 μM) for 5 days. (D) The representative optical image of MCTS on day 5 after different treatments. Scale bar: 200 μm. Data were expressed as mean ± standard deviation with three parallel experiments. | ||
The western blot assay was also conducted to assess three apoptosis-related proteins (caspase-3, bcl-2 and cytochrome-3) to further reveal the cellular mechanisms responsible for the results obtained in Fig. 3A. As displayed in Fig. 3B, consistent with the MTT assay, the CV/D–S treated group showed the lowest bcl-2 level, which was responsible for the suppression of apoptosis. As a result, the highest cleaved caspase-3 and cytochrome-3 levels were observed in the CV/D–S group, indicating severe apoptosis profiles in LLC/Dox cells. The protein levels in other groups were similar to the results in Fig. 3A, which provided enhanced evidence to prove the outstanding anticancer performance of CV/D–S.54
The MCTS mimicking the in vivo solid tumor was employed to further assess the formulation-dependent anticancer efficacy. As displayed in Fig. 3C and D, in the whole experiment period, the MCTS volume showed persistent growth in the free Dox group, which suggested that the MDR of LLC/Dox could neutralize the cytotoxicity effects of Dox. Single delivery systems (CV/Dox and CV/Sfn) only exerted moderate suppression effects on MCTS with retarded growth at the end of the test. On the contrary, CV/D–S (Fig. 3C) showed the most potent efficacy on MCTS inhibition with a reverse in volume observed at day 5, which suggested that the synergetic effects of Dox and Sfn could realize powerful cytotoxicity toward MDR cells.55
To further verify the role of CV/D–S in activating immune responses in vivo, we established mice models bearing both primary and distant tumors. Mice were randomly assigned to different groups containing six subjects. Thereafter, different formulations with the same amount of drugs (both at 5 mg kg−1) were administered to mice in parallel using saline as a control. Repeated administration was performed every three days and the tumor volume was recorded before drug administration for 15 days. On day 15, the same dose of tumor cells was planted on the other side of the mice and the tumor volume was recorded every three days for another 15 days (distant tumor). At the end of the tests, the tumor tissues were excised from sacrificed mice and subjected to Ki67 or TUNEL staining. As shown in Fig. 4A, it was observed that the primary tumors were significantly inhibited within 15 days in the CV/D–S group (286 mm3) after treatment. In contrast, tumors in the CV/Dox and CV/Sfn groups steadily grew with final tumor volumes of 416 mm3 and 553 mm3, respectively, at the end of the test. The TUNEL assay indicating cell apoptosis in the tumor tissue also reached similar conclusions. As shown in Fig. 4B, the CV/D–S group showed the most significant apoptosis of tumor tissues, while a certain amount of apoptosis was observed in the CV/Dox and CV/Sfn groups and almost no apoptosis in the control group, suggesting the importance of synergistic effect on tumor inhibition.56 Most importantly, to show the acquired immunity after different treatments. The same dose of tumor cells was further inoculated on the other side of the same mice to observe the progress of tumors. As shown in Fig. 4C, in the control group without any treatment, due to the high homology of cancer cells to the body cells, the acquired immunity produced by the immune system was relatively weak and the newly inoculated cancer cells could quickly develop into solid tumors. In contrast, after CV/Dox and CV/Sfn treatment, the tumorigenicity of LCC/Dox cells was significantly decreased. However, the results in the CV/Dox group was better than that in the CV/Sfn group, which might be due to the ICD introduction nature of Dox, which can present the antigen more effectively than that in the CV/Sfn group. Most importantly, it was noted that in the CV/D–S group, the tumorigenicity of the LCC/Dox cells was very weak and after 15 days, the final tumor volume was only 101 mm3, suggesting the strongest immune response in mice treated with CV/D–S. These results were also consistent with the results obtained in the Ki67 assay. As shown in Fig. 4D, the tumor tissue in the CV/Dox group showed less proliferation than that in CV/Sfn, which was consistent with the stronger immune response of CV/Dox treatment on mice. As expected, the lowest level of proliferation was also observed in CV/D–S groups as compared to other groups, which further confirmed the superiority of CV/D–S in cancer immunotherapy.
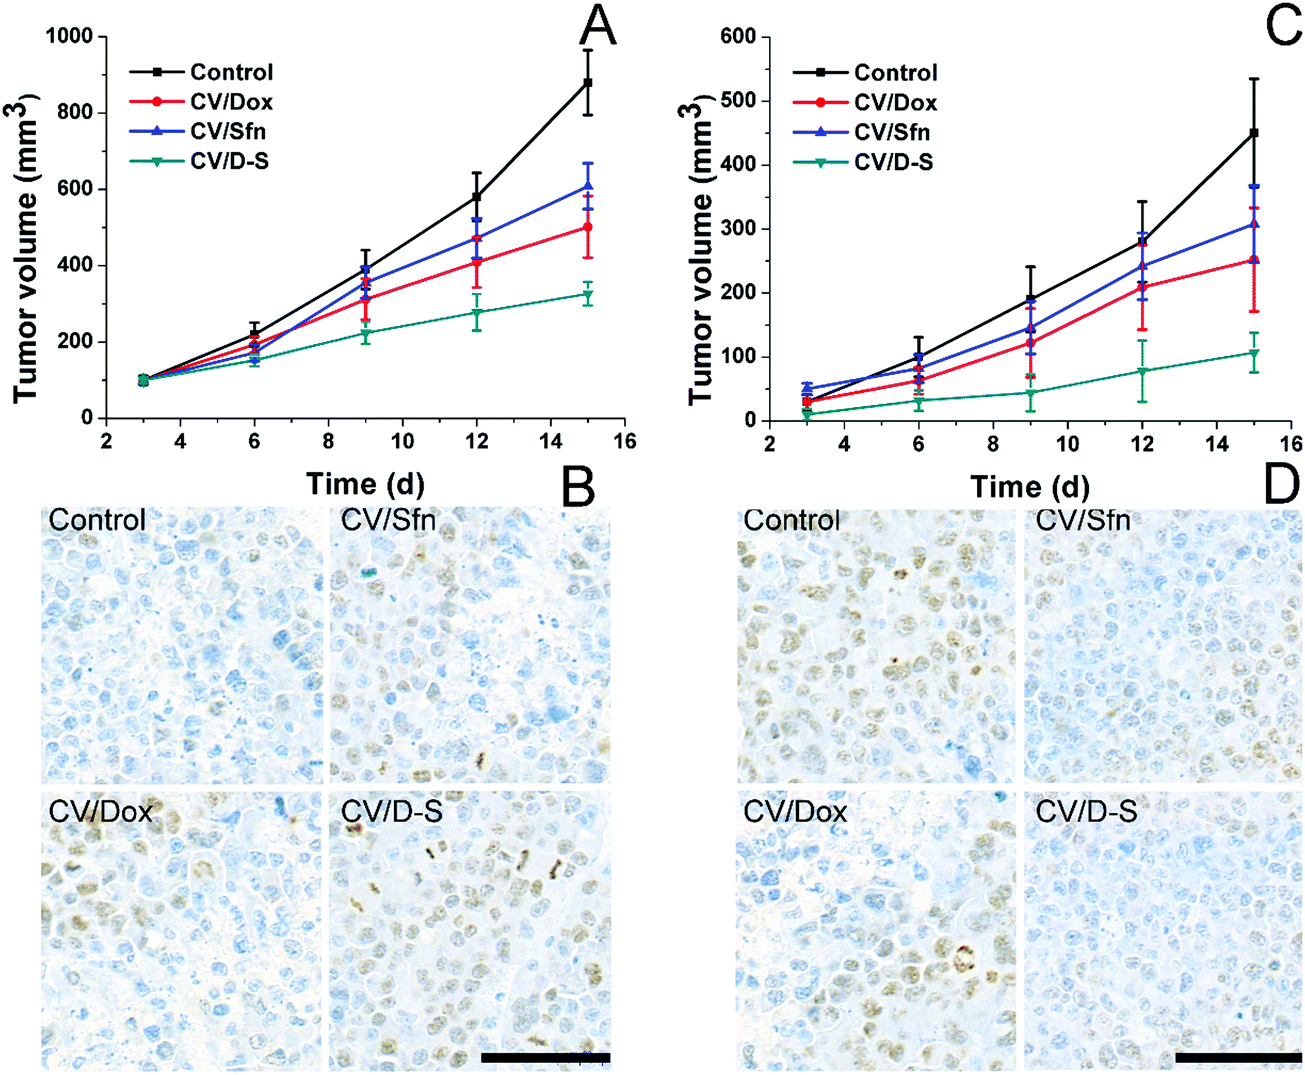 | ||
| Fig. 4 In vivo antitumor efficacy of different formulations for LLC/Dox tumor-bearing Balb/c mice. Tumor volume changes of primary (A) and distant tumors (C) after different treatments as a function of time were recorded. Data were expressed as mean ± standard deviation with six parallel experiments. TUNEL staining of the primary tumor (B) and the Ki67 staining of distant tumors (D) at the end of the test after different treatments. | ||
To understand the immune response mechanism of CV/D–S and the roles of each drug in the immune response, two representative cytokines (IL-6 and TNF-α) were chosen and their concentrations in plasma at different time points were measured using the ELISA kit to assess the DC maturation level in different groups. IL-6 and TNF-α are proteins secreted by activated DC, and their contents are closely related to the activation level of DC. TNF-α plays an important role in anticancer performance, whereas IL-6 plays play a crucial role in the activation of CD8+ T lymphocytes and natural killer cells. As shown in Fig. 5A and B, compared with the control group, the plasma levels of IL-6 and TNF-α increased significantly over time after different treatments, and continued to maintain relatively high concentrations at 4 days post-treatment, indicating that the DC were activated by the in situ vaccination and persistently released the corresponding cytokines to trigger subsequent immune responses. Most importantly, the CV/D–S group showed the highest cytokine levels as compared to the other groups, suggesting that CV/D–S can preferably serve as an in situ vaccine to significantly induce an immune response.42 As expected, the cytokine level in the CV/Sfn group was lower than that in the CV/Dox group, which was in line with the results in Fig. 4. To further confirm the positive relation between ICD and the immune response effect, the ICD of tumor tissues after different treatments was assessed. As expected, Fig. 5C revealed that Dox can significantly induce ICD as compared to Sfn and the control group, which is in line with its stronger immune response in the above assays. However, the DC infiltration assay at the end of the tests showed interesting results. As shown in Fig. 5D, as expected, the DC infiltration in CV/D–S was the best among all groups. However, it was noted that the DC infiltration in CV/Sfn was better than that in CV/Dox, suggesting the better TME remodeling effects. As a result, the exact roles of Sfn in the regulation of TME, Tregs and effector T cells were studied.
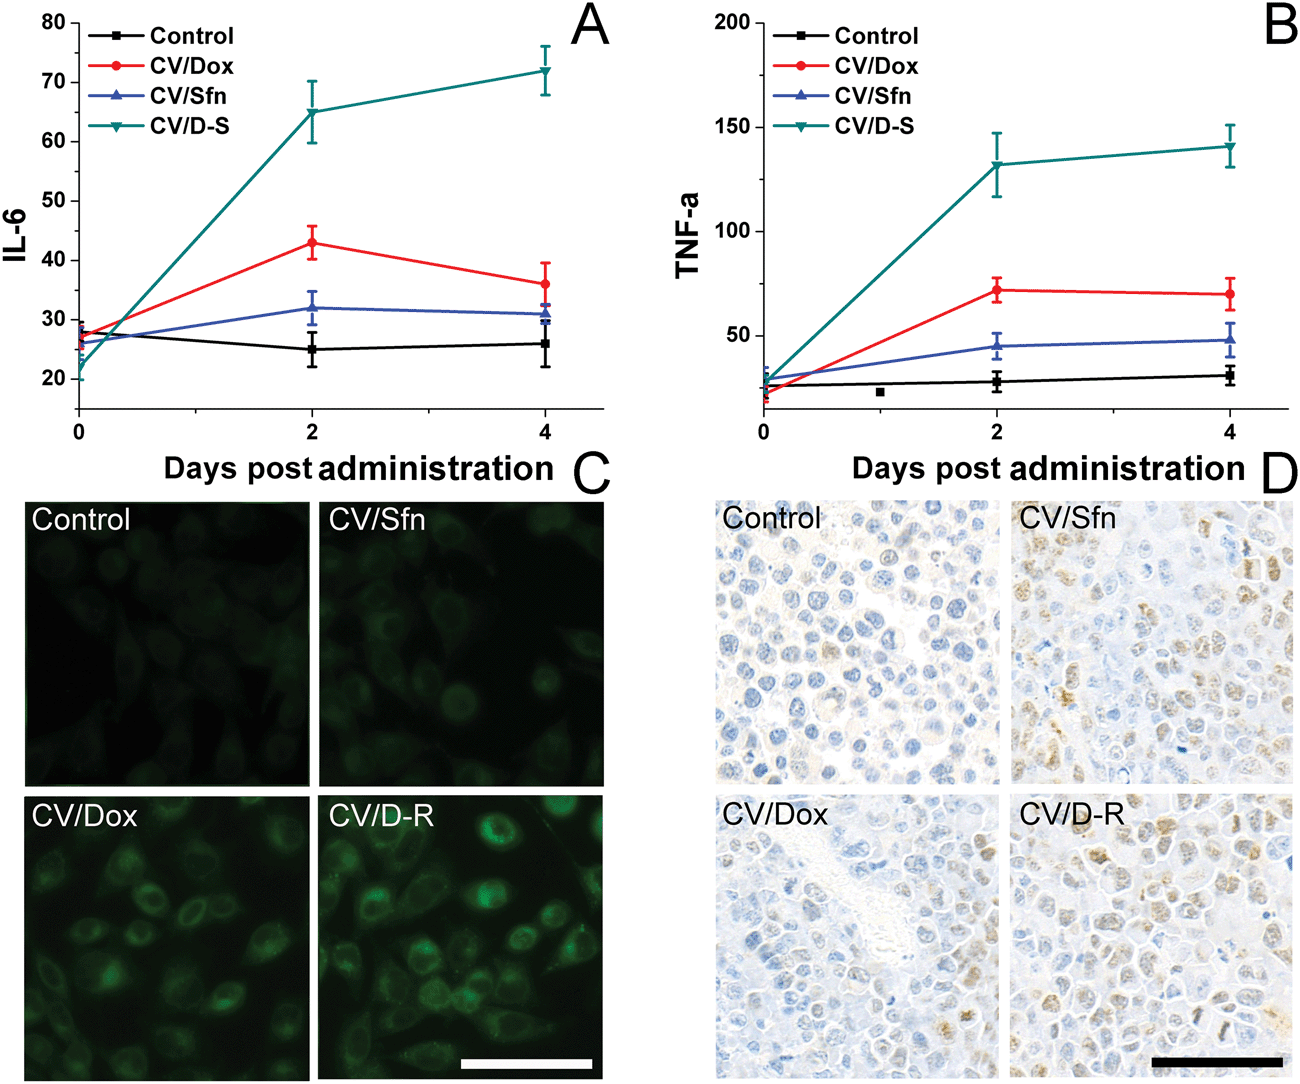 | ||
| Fig. 5 Cytokine IL-6 (A) and TNF-α (B) levels in peripheral blood serum (indicating in vivo DC stimulation) after different time intervals of treatment. Data were expressed as mean ± standard deviation with three parallel experiments. The ICD (C) and DC infiltration (D) of tumor tissues at the end of the test after different treatments. Scale bar: 100 μm. | ||
After treatment with different dosages of CV/Sfn using the same scheme, the CD4+CD25+ Treg in the tumor tissues were sorted and their percentage and number as a function of Sfn concentration were assessed. As shown in Fig. 6A and B, significant reductions in the CD4+CD25+ Treg percentage and number in tumor-infiltrating lymphocytes (TIL) were observed after Sfn treatment and this tendency was positively related to the Sfn dosage. As further proof, the sorted CD4+CD25+ Treg were cultured and the effects of Sfn on Treg proliferation and function as well as apoptosis were also studied. As shown in Fig. 6C and D, the proliferation capacity of Treg was negatively related to the Sfn dosage, which suggested that Sfn can significantly reduce the proliferation of Treg. As expected, the apoptosis of Treg was positively related to the given Sfn concentration, indicating that the decreased Treg proliferation effects of Sfn were at least partially achieved through the increase in cell apoptosis. Since CD4+CD25+ Treg were reported to negatively regulate the activated effector T cells in TME, the Treg suppression effect of Sfn was believed to restore the function of activated effector T cells in tumor tissue to fully exert the anticancer effects.57
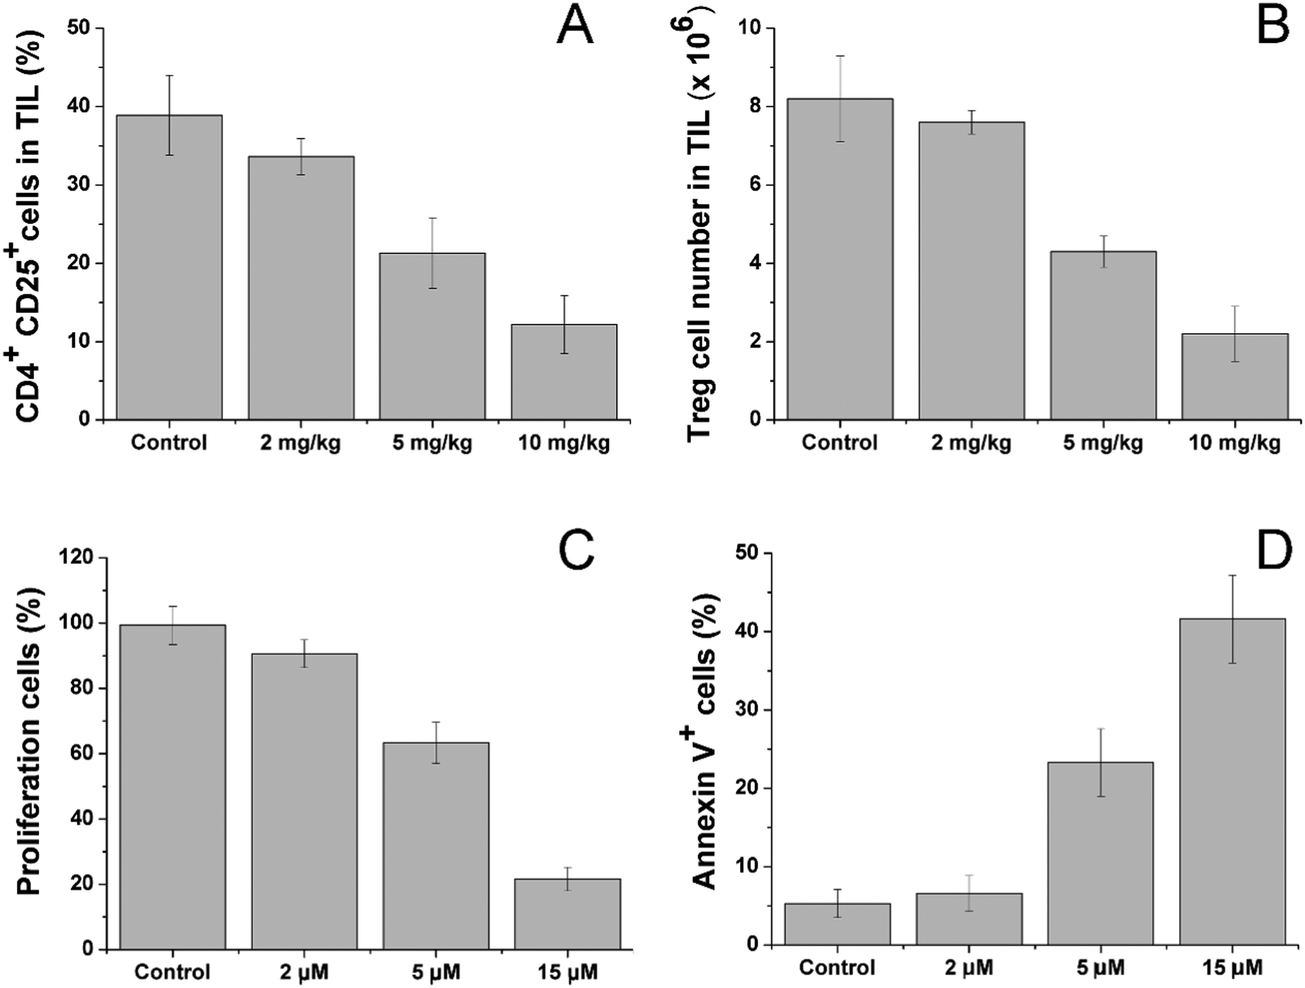 | ||
| Fig. 6 Sfn downregulates Tregs in tumor-bearing mice. (A) Percentage of CD4+CD25+ Tregs in tumor tissues with different dosages of Sfn. (B) The number of CD4+CD25+ Tregs cells among the CD4+ T cell population in the tumor tissues after different treatment dosages of Sfn. Sfn inhibits Treg proliferation and function as well as induces their apoptosis. (C) The effects of different concentrations of Sfn on Treg proliferation in vitro. (D) The effects of different concentrations of Sfn on Treg apoptosis in vitro. Data were expressed as mean ± standard deviation with three parallel experiments. | ||
We then investigated the effects of Sfn on effector T cells. Cytotoxic (CD8+) T lymphocytes (CTLs) play an important role in mediating immune responses and are responsible for the killing of target cancer cells through the release of cytolytic effector molecules and effector cytokines to trigger inflammatory responses and target cell apoptosis.58 As seen in Fig. 7A, Sfn showed strong effects on increasing the activated cell number among CD8+ cells in a concentration-dependent manner. To further determine the effects of Sfn on functions of tumor-specific effector T cells in tumor microenvironments, TILs were isolated after different doses of Sfn and the cytokine production among these effector T cells was analyzed. As shown in Fig. 7B, The IFNγ+ positive cells in tumor-specific effector T cells increased with the increase of the Sfn concentration, suggesting that Sfn could exert beneficial effects on tumor-specific effector T maturation and activation. Due to the important role of PD-1 signaling in the immune escape of tumors, the CD8+ T cells in TME expressed higher levels of PD-1, which is usually negatively correlated with the functional impairment of the T cells. We, therefore, examined the PD-1 positive CD8+ T cells in TME to further identify the regulatory role of Sfn on effector T cells. As shown in Fig. 7C, the PD-1+ CD8+ T cell percentage in the TME decreased drastically with the increase in Sfn dosing, suggesting that Sfn can regulate the PD-1 expression in the effector T cells to block the PD-1/PD-L1 pathways in the major cases of tumor immune escape. In summary, as shown in Fig. 7D, Sfn can exert beneficial TME remodeling effects on the LCC/Dox tumors. The effector function of tumor-specific CD8+ T cells was elevated, whereas the proportion and proliferation of PD-1+ CD8+ effector T cells and Treg cells were decreased, suggesting that Sfn treatment reverses both cell-intrinsic and non-cell-autonomous inhibitions of effector T cells, which sensitize the ICD-induced immune responses against tumors.59
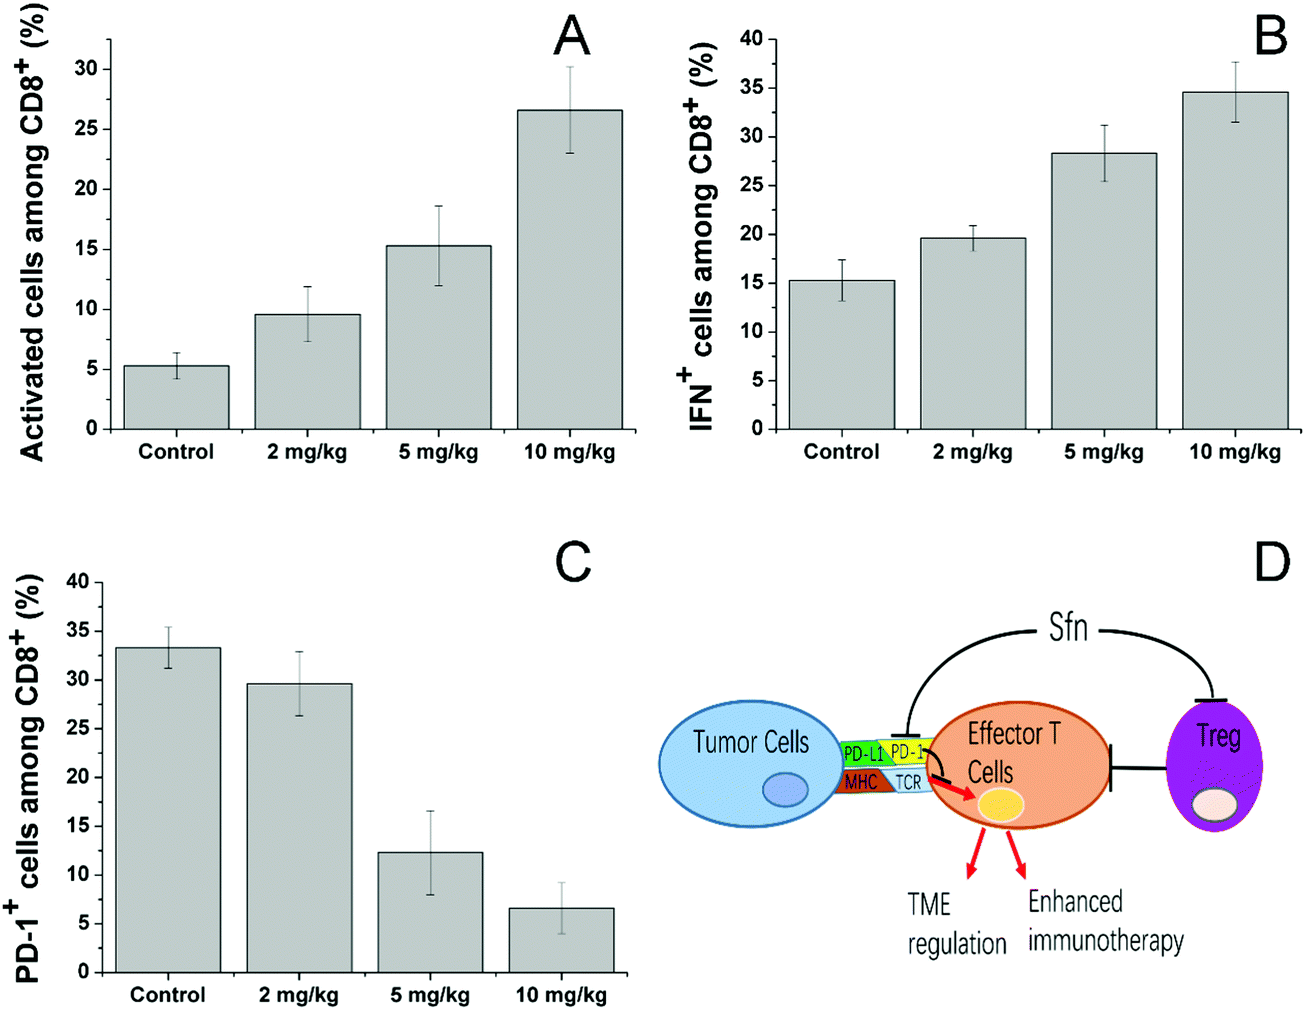 | ||
| Fig. 7 Sfn treatment augmented the effector function of tumor-specific T cells and downregulated the PD-1 expression of CD8+ T cells in TME. (A) The mean percentage of CD25 (activation marker) expressing cells among tumor-infiltrating CD8+ T cells. (B) Mean percentage of tumor-specific IFNγ+ cells among tumor-infiltrating CD8+ T cells. (C) Percentage of PD-1-expressing CD81 T cells in tumor-draining lymph nodes of tumor-bearing mice. (D) A model illustrating the mechanisms by which Sfn augments antitumor immunity, Treg-mediated inhibitions and relieves PD-1 in TME. Data were expressed as mean ± standard deviation with three parallel experiments. | ||
Conclusion
In this article, we successfully developed a CV for the co-delivery of Dox and Sfn (CV/D–S). The CV/D–S are spherical nanoparticles with a size of around 100 nm, with high stability, acid-responsive drug release and high biocompatibility. Moreover, the CV-mediated cellular uptake and tumor targetability, as well as the synergistic effect of Dox and Sfn, endowed CV/D–S with preferable in vitro and in vivo anticancer performance as compared to single delivery systems (CV/Dox and CV/Sfn). Most importantly, the CV/D-S induced a strong immune response after treatment, which was ascribed to the combination of the ICD-inducing effects of Dox and TME remodeling and Treg inhibitions/effector T cells activation/PD-1 relieving effects of Sfn. The application of this platform is believed to open a new window for the design and development of future DDSs for more effective cancer immunotherapy.Conflicts of interest
There are no conflicts to declare.Acknowledgements
We acknowledge the financial support from Natural Science Foundation of Guangdong Province (grant no. 2018A0303130247).References
- R. S. Riley, C. H. June, R. Langer and M. J. Mitchell, Nat. Rev. Drug Discovery, 2019, 18, 175–196 CrossRef CAS PubMed.
- A. Ribas and J. D. Wolchok, Science, 2018, 359, 1350–1355 CrossRef CAS PubMed.
- U. Sahin and Ö. Türeci, Science, 2018, 359, 1355–1360 CrossRef CAS PubMed.
- J. Nam, S. Son, K. S. Park, W. Zou, L. D. Shea and J. J. Moon, Nat. Rev. Mater., 2019, 4, 398–414 CrossRef.
- J. Li, J. Van Valkenburgh, X. Hong, P. S. Conti, X. Zhang and K. Chen, Theranostics, 2019, 9, 7849 CrossRef CAS PubMed.
- K. Graham and E. Unger, Int. J. Nanomed., 2018, 13, 6049 CrossRef CAS PubMed.
- T.-F. Li, Y.-H. Xu, K. Li, C. Wang, X. Liu, Y. Yue, Z. Chen, S.-J. Yuan, Y. Wen and Q. Zhang, Acta Biomater., 2019, 86, 381–394 CrossRef CAS PubMed.
- B. Halamoda-Kenzaoui and S. Bremer-Hoffmann, Int. J. Nanomed., 2018, 13, 5419 CrossRef CAS PubMed.
- S. Zhang, G. Pang, C. Chen, J. Qin, H. Yu, Y. Liu, X. Zhang, Z. Song, J. Zhao and F. Wang, Carbohydr. Polym., 2019, 205, 192–202 CrossRef CAS PubMed.
- X. Li, X. Wang, G. Qian and A. Ito, Appl. Mater. Today, 2019, 16, 102–111 CrossRef.
- S. Golchin, R. Alimohammadi, M. Rostami Nejad and S. A. Jalali, J. Cell. Physiol., 2019, 234, 19866–19874 CrossRef CAS PubMed.
- H. Phuengkham, L. Ren, I. W. Shin and Y. T. Lim, Adv. Mater., 2019, 31, 1803322 CrossRef PubMed.
- A. Showalter, A. Limaye, J. L. Oyer, R. Igarashi, C. Kittipatarin, A. J. Copik and A. R. Khaled, Cytokine, 2017, 97, 123–132 CrossRef CAS PubMed.
- C. Xia, S. Yin, S. Xu, G. Ran, M. Deng, L. Mei, X. Tang, J. Rao, M. Li and Z. Zhang, Theranostics, 2019, 9, 337 CrossRef CAS PubMed.
- X. Li and X. Su, J. Mater. Chem. B, 2018, 6, 4714–4730 RSC.
- M. Saeed, J. Gao, Y. Shi, T. Lammers and H. Yu, Theranostics, 2019, 9, 7981 CrossRef CAS PubMed.
- Y. Li, Y. Du, X. Liang, T. Sun, H. Xue, J. Tian and Z. Jin, Nanoscale, 2018, 10, 16738–16749 RSC.
- B. Zhou, J. Song, M. Wang, X. Wang, J. Wang, E. W. Howard, F. Zhou, J. Qu and W. R. Chen, Nanoscale, 2018, 10, 21640–21647 RSC.
- Y. Ke and C. Xiang, Int. J. Nanomed., 2018, 13, 8339 CrossRef CAS.
- D. Fukumura, J. Kloepper, Z. Amoozgar, D. G. Duda and R. K. Jain, Nat. Rev. Clin. Oncol., 2018, 15, 325 CrossRef CAS PubMed.
- L.-C. Lu, Y.-H. Lee, C.-J. Chang, C.-T. Shun, C.-Y. Fang, Y.-Y. Shao, T.-H. Liu, A.-L. Cheng and C.-H. Hsu, Liver Cancer, 2019, 8, 110–120 CrossRef CAS PubMed.
- S. Maman and I. P. Witz, Nat. Rev. Drug Discovery, 2018, 17, 13–30 CrossRef.
- M.-D. Zhao, J.-Q. Li, F.-Y. Chen, W. Dong, L.-J. Wen, W.-D. Fei, X. Zhang, P.-L. Yang, X.-M. Zhang and C.-H. Zheng, Int. J. Nanomed., 2019, 14, 9453 CrossRef PubMed.
- D. Tang, X. Zhao, T. Yang and C. Wang, RSC Adv., 2018, 8, 380–389 RSC.
- C. Wang, Z. Wang, X. Zhao, F. Yu, Y. Quan, Y. Cheng and H. Yuan, Acta Biomater., 2019, 85, 218–228 CrossRef CAS PubMed.
- C. Wang, F. Yu, X. Liu, S. Chen, R. Wu, R. Zhao, F. Hu and H. Yuan, Adv. Healthcare Mater., 2019, 8, 1900501 CrossRef PubMed.
- D. Wang, M. M. S. Lee, W. Xu, R. T. K. Kwok, J. W. Y. Lam and B. Z. Tang, Theranostics, 2018, 8, 4925 CrossRef CAS PubMed.
- C. Wang, S. Chen, Y. Wang, X. Liu, F. Hu, J. Sun and H. Yuan, Adv. Mater., 2018, 30, 1706407 CrossRef PubMed.
- E.-H. Lee, S.-J. Lim and M.-K. Lee, Carbohydr. Polym., 2019, 224, 115143 CrossRef CAS PubMed.
- W. Xie, S. Zhu, B. Yang, C. Chen, S. Chen, Y. Liu, X. Nie, L. Hao, Z. Wang and J. Sun, Int. J. Nanomed., 2019, 14, 9377 CrossRef PubMed.
- J. Zhang, Y. Miao, W. Ni, H. Xiao and J. Zhang, Artif. Cells, Nanomed., Biotechnol., 2019, 47, 2298–2305 CrossRef CAS PubMed.
- Z. Zhao, M. Ji, Q. Wang, N. He and Y. Li, Carbohydr. Polym., 2020, 238, 116073 CrossRef CAS PubMed.
- J. Yang, Y. Teng, Y. Fu and C. Zhang, Int. J. Nanomed., 2019, 14, 5061 CrossRef CAS PubMed.
- X. Zhao, D. Tang, Y. Wu, S. Chen and C. Wang, Nanoscale, 2020, 12, 10189–10195 RSC.
- P. Wang, X. Wang, Q. Luo, Y. Li, X. Lin, L. Fan, Y. Zhang, J. Liu and X. Liu, Theranostics, 2019, 9, 369 CrossRef CAS PubMed.
- S. E. Enderami, M. Soleimani, Y. Mortazavi, S. Nadri and A. Salimi, J. Cell. Physiol., 2018, 233, 4327–4337 CrossRef CAS PubMed.
- A. C. Dumitru, M. A. Poncin, L. Conrard, Y. F. Dufrêne, D. Tyteca and D. Alsteens, Nanoscale Horiz., 2018, 3, 293–304 RSC.
- G. Jin, R. He, Q. Liu, M. Lin, Y. Dong, K. Li, B. Z. Tang, B. Liu and F. Xu, Theranostics, 2019, 9, 246 CrossRef CAS PubMed.
- C. Wang, S. Chen, Q. Yu, F. Hu and H. Yuan, J. Mater. Chem. B, 2017, 5, 2068–2073 RSC.
- C. F. Deng, X. H. Xu, D. Tashi, Y. M. Wu, B. Y. Su and Q. Zhang, J. Mater. Chem. B, 2018, 6, 3163–3180 RSC.
- C. Wang, S. Chen, L. Bao, X. Liu, F. Hu and H. Yuan, Int. J. Nanomed., 2020, 15, 4049–4062 CrossRef PubMed.
- C. Wang, M. Han, X. Liu, S. Chen, F. Hu, J. Sun and H. Yuan, Int. J. Nanomed., 2019, 14, 1503–1517 CrossRef CAS PubMed.
- M. Xuan, J. Shao, J. Zhao, Q. Li, L. Dai and J. Li, Angew. Chem., Int. Ed., 2018, 57, 6049–6053 CrossRef CAS PubMed.
- H. Li, Y. Zhao, Y. Jia, C. Qu and J. Li, Chem. Commun., 2019, 55, 15057–15060 RSC.
- Y. Kawakami, S. Eliyahu, C. H. Delgado, P. F. Robbins, K. Sakaguchi, E. Appella, J. R. Yannelli, G. J. Adema, T. Miki and S. A. Rosenberg, Proc. Natl. Acad. Sci. U. S. A., 1994, 91, 6458–6462 CrossRef CAS PubMed.
- X. Zhao, D. Tang, T. Yang and C. Wang, Colloids Surf., B, 2018, 170, 355–363 CrossRef CAS PubMed.
- Z. Zhang, H. Q. Qian, J. Huang, H. Z. Sha, H. Zhang, L. X. Yu, B. R. Liu, D. Hua and X. P. Qian, Int. J. Nanomed., 2018, 13, 4961–4975 CrossRef CAS PubMed.
- L. Zhao, Y. H. Xu, H. Qin, S. Abe, T. Akasaka, T. Chano, F. Watari, T. Kimura, N. Komatsu and X. Chen, Adv. Funct. Mater., 2014, 24, 5348–5357 CrossRef CAS.
- Z. Yang, J. Song, W. Tang, W. Fan, Y. Dai, Z. Shen, L. Lin, S. Cheng, Y. Liu and G. Niu, Theranostics, 2019, 9, 526 CrossRef CAS PubMed.
- Q. Zhang, B. Gao, K. Muhammad, X. Zhang, X.-K. Ren, J. Guo, S. Xia, W. Zhang and Y. Feng, J. Mater. Chem. B, 2019, 7, 1906–1919 RSC.
- S. Yu, Q. Li, J. Wang, J. Du, Y. Gao, L. Zhang, L. Chen, Y. Yang and X. Liu, J. Mater. Res., 2018, 33, 2565–2575 CrossRef CAS.
- M. Nejabat, M. Mohammadi, K. Abnous, S. M. Taghdisi, M. Ramezani and M. Alibolandi, Carbohydr. Polym., 2018, 197, 157–166 CrossRef CAS PubMed.
- Q. Chen, Y. Chen, Y. Sun, W. He, X. Han, E. Lu and X. Sha, Nanoscale, 2019, 11, 5377–5394 RSC.
- R. Chen, Q. Chen, H. Qin and D. Xing, Nanoscale, 2019, 11, 1423–1436 RSC.
- H. He, R. Zhu, W. Sun, K. Cai, Y. Chen and L. Yin, Nanoscale, 2018, 10, 2856–2865 RSC.
- M. Rahimi, V. Shafiei-Irannejad, K. D. Safa and R. Salehi, Carbohydr. Polym., 2018, 196, 299–312 CrossRef CAS PubMed.
- S. Abdolmohammadi Vahid, M. Ghaebi, M. Ahmadi, M. Nouri, S. Danaei, L. Aghebati-Maleki, R. Mousavi Ardehaie, B. Yousefi, P. Hakimi and M. Hojjat-Farsangi, J. Cell. Physiol., 2019, 234, 4924–4933 CrossRef CAS PubMed.
- L. H. Glimcher, M. J. Townsend, B. M. Sullivan and G. M. Lord, Nat. Rev. Immunol., 2004, 4, 900–911 CrossRef CAS PubMed.
- A. Salmaninejad, S. F. Valilou, A. G. Shabgah, S. Aslani, M. Alimardani, A. Pasdar and A. Sahebkar, J. Cell. Physiol., 2019, 234, 16824–16837 CrossRef CAS PubMed.
| This journal is © The Royal Society of Chemistry 2020 |