 Open Access Article
Acylselenoureato bis(chelates) of lead: synthesis, structural characterization and microwave-assisted formation of PbSe nano- and microstructures†
Karsten
Klauke
 ab,
Alexa
Schmitz
b,
Ann-Christin
Swertz
 a,
Björn B.
Beele
 a,
Beatriz
Giesen
b,
Carsten
Schlüsener
b,
Christoph
Janiak
 *b and
Fabian
Mohr
 *a
*a
aFakultät für Mathematik und Naturwissenschaften, Anorganische Chemie, Bergische Universität Wuppertal, 42119 Wuppertal, Germany. E-mail: fmohr@uni-wuppertal.de
bInstitut für Anorganische Chemie und Strukturchemie, Heinrich-Heine-Universität Düsseldorf, 40204 Düsseldorf, Germany. E-mail: janiak@hhu.de
First published on 17th April 2020
Abstract
We report the synthesis of three lead(II) bis(acylselenoureato) complexes (1a–3a), which were prepared by the reaction of the respective acylselenourea compounds ArC(O)NHC(Se)NR2 [Ar = 4-MeC6H4, R = Et (1); 4-ClC6H4, R = nBu (2), iBu (3)] with Pb(OAc)2. All three compounds were confirmed by NMR spectroscopy, elemental analysis and single crystal X-ray diffraction. Furthermore, the lead(II) complex 3a was transformed into PbSe nanostructures in a microwave-assisted synthesis using either a mixture of trioctylphosphine (TOP), octadecene (ODC) and the ionic liquid 1-butyl-3-methylimidazolium bis(trifluoromethylsulfonyl)imide, [BMIm][NTf2], a mixture of [BMIm][NTf2] and propylene carbonate (PC), pure [BMIm][NTf2] or pure PC. The analyses of the resulting particle dispersions indicated formation of either small PbSe nanoparticles of 19 nm, PbSe submicro-cubes between 178 nm and 366 nm as well as strongly intergrown structures depending on the stabilizing reagent used during the synthesis. The prepared PbSe particle suspensions were characterized by powder X-ray diffraction (PXRD), transmission electron microscopy (TEM), scanning electron microscopy (SEM), energy dispersive X-ray spectrocopy (EDX) as well as by selected area electron diffraction (SAED).
Introduction
As an IV–VI compound semiconductor, lead selenide is one of the oldest known semiconductor materials which has been used for more than 100 years for the production of electronic and optoelectronic components.1 Despite the toxicity of lead compounds, the excellent thermoelectric and semiconducting properties of PbSe still make it a very sought-after material for modern applications such as LEDs,2 photovoltaic cells3 or photodetectors.4 The aforementioned properties include an advantageous bulk bandgap of 0.28 eV, high charge carrier mobilities and a particularly strong quantum confinement due to relatively large Bohr radii of about 23, 23 and 46 nm for electron, hole and exciton, respectively.5 Especially the phenomenon of multi-exciton generation (MEG), which was first observed in PbSe quantum dots in 2004, has recently generated great interest.3The conventional route to PbSe typically involves chemical vapour deposition processes using volatile (gaseous) and highly toxic precursors. Efforts have thus been directed towards the development of easy to handle single-source precursors, allowing a convenient and intrinsic control of the stoichiometry and reactivity. In this respect, the group of the late O’Brien reported the use of lead(II) acylselenoureas in the aerosol-assisted preparation of PbSe thin films as well as the synthesis of PbSe nanoparticles using trioctylphosphine (TOP) as stabilizing reagent.6–10
Ionic liquids (ILs) represent an interesting and by now quite established option for the stabilization of colloidal systems besides conventional stabilizing agents such as TOP or hexadecylamine (HDA), which are strongly bound to the particle surface.11–13 Because of this, nanoparticles are electrosterically stabilized by various directed intermolecular interactions, or in other words, by a combination of steric and electrostatic effects. Although a large number of inorganic nanostructures has been prepared in ionic liquids, including PbS,14–17 to our knowledge only very few syntheses of PbSe nanoparticles using this novel group of compounds have been described in the literature.18 Therefore, on basis of O’Brien's work6–10 and our experience with microwave-assisted synthesis of various nanoparticles in ionic liquids, we report herein a study of acylselenoureato lead(II) complexes as potential precursors compounds for PbSe nanomaterials in ionic liquids as well as the effect of the IL 1-butyl-3-methylimidazolium bis(trifluoromethylsulfonyl)imide, [BMIm][NTf2] on particle shape and size compared to TOP-stabilized nanoparticles.
Results and discussion
Synthesis, spectroscopic and structural characterization
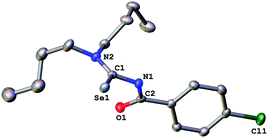
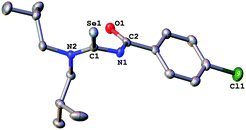
The acylselenourea compounds ArC(O)NHC(Se)NR2 [Ar = 4-MeC6H4, R = Et (1); 4-ClC6H4, R = nBu (2), iBu (3)] were prepared following the method by Douglass from the corresponding acyl chlorides, KSeCN and the secondary amines in acetone (Scheme 1).19 The compounds were obtained in low to moderate yields as yellow, crystalline solids. Characterization by NMR spectroscopy unambiguously confirmed the identity and purity of the compounds. The signal for the N–H proton can be observed in the 1H-NMR spectra as a sharp signal at around 8–9 ppm. The 77Se-NMR spectra of the compounds feature singlet resonances in the range of 480–500 ppm. The two new acylselenoureas 4-ClC6H4C(O)NHC(Se)NR2 [R = nBu (2), iBu (3)] were also characterized by single crystal X-ray diffraction (Fig. 1 and 2).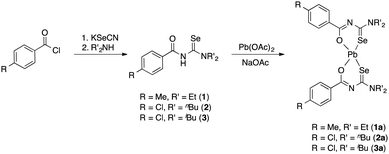 | ||
| Scheme 1 Synthetic methodology for the preparation of the lead(II)bis(acylselenoureato) complexes (1a–3a) | ||
The C–O and C–Se bond lengths in these compounds are consistent with the presence of the expected carbon–chalcogen double bonds and are similar to those observed in the molecular structures of other acylselenoureas.20,21 The C–O and C–Se moieties in the molecules are rotated away from each other with Se![[double bond, length as m-dash]](https://www.rsc.org/images/entities/char_e001.gif) C–N–C-torsion angles of around 121° (2) and 127° (3). Similar torsion angles are observed in the related acylselenoureas PhC(O)NHC(Se)NnBu2 and 2-FC6H4C(O)NHC(Se)NiBu2.20,21
C–N–C-torsion angles of around 121° (2) and 127° (3). Similar torsion angles are observed in the related acylselenoureas PhC(O)NHC(Se)NnBu2 and 2-FC6H4C(O)NHC(Se)NiBu2.20,21
The reaction of the acylselenoureas 1–3 with Pb(OAc)2 in EtOH in the presence of sodium acetate afforded the corresponding lead(II) bis(acylselenoureato) complexes [Pb{ArC(O)NC(Se)NR2}2] (1a–3a) as yellowish, air- and moisture stable solids in good yields (Scheme 1).
The compounds were fully characterized by NMR spectroscopy and also by X-ray diffraction. From the proton NMR spectra of the complexes it is apparent that the signal due to the N–H proton has disappeared, consistent with deprotonation of the acylselenourea upon coordination to the metal. The observed signals in the proton NMR spectra of the complexes are slightly shifted upon deprotonation and coordination, however, their multiplicity remains unchanged as expected. Similarly, the observed singlet resonances in the 77Se NMR spectra are shifted upfield by almost 200 ppm in the lead complexes.
| 1a | 2a | 3a | |
|---|---|---|---|
| *Symmetry related atom. | |||
| Pb–Se | 2.8669(7) | 2.8631(7) | 2.8546(5) |
| Pb–O | 2.414(3) | 2.429(5) | 2.418(3) |
| Se–Pb–O | 80.80(8) | 81.32(11) | 78.86(7) |
| O–Pb–O* | 150.34(18) | 149.7(2) | 150.38(14) |
| Se–Pb–Se* | 91.18(3) | 91.49(3) | 92.08(2) |
In order to unambiguously confirm the compositions of 1a–3a, single crystal X-ray diffraction experiments were performed (Fig. 3–5).
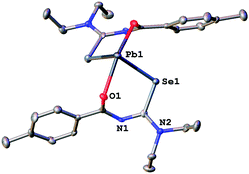 | ||
| Fig. 3 Molecular structure of 1a. Thermal ellipsoids are drawn at the 50% probability level. Hydrogen atoms have been omitted for clarity. | ||
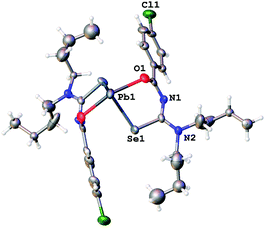 | ||
| Fig. 4 Molecular structure of 2a. Thermal ellipsoids are drawn at the 50% probability level. Only one part of the disordered nBu chains is shown. | ||
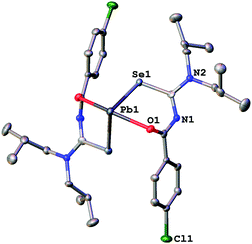 | ||
| Fig. 5 Molecular structure of 3a. Thermal ellipsoids are drawn at the 50% probability level. Hydrogen atoms have been omitted for clarity. | ||
Since the general structural features are quite similar, they will be discussed together in the following section. The lead complexes contain two deprotonated acylselenoureas bound via oxygen and selenium atoms to the metal in a distorted trigonal bipyramidal arrangement. The two selenium atoms and the lone pair of the lead atom lie in the equatorial plane (angle Se–Pb–Se* = 91.5°), whilst the oxygen atoms are located on the axial positions of the bipyramid (angle O–Pb–O* = 149.7°). There are only three examples for Pb(II)-acylselenoureato bis(chelates) that have been structurally characterized. These include [Pb{PhC(O)NC(Se)NEt2}2], [Pb{4-O2NC6H4C(O)NC(Se)NiBu2}2] and [Pb{2-napC(O)NC(Se)NEt2}2].9,22,23 The Pb–Se and Pb–O bond distances in complexes 1a–3a of 2.86 Å and 2.4 Å, respectively are very similar to those found in the other lead acylselenoureato bis(chelates). Similarly, the bite angle of the acylselenoureato ligand (i.e. the angle Se–Pb–O) of around 80° is typical for this class of ligands (Table 1).
Nanoparticle synthesis
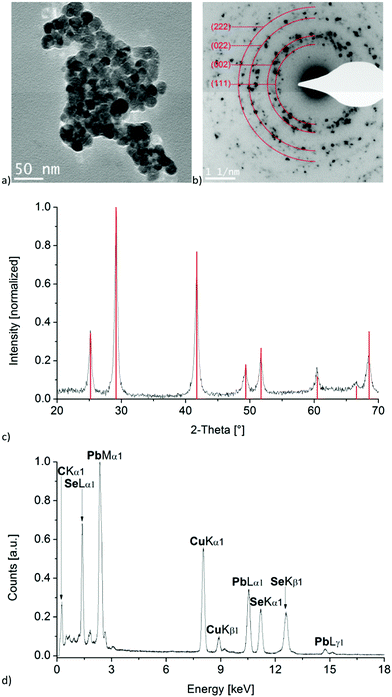
Since we were interested in using these lead compounds as single-source precursors for PbSe nanomaterials, we initially examined their thermal behaviour by TGA. As can be seen in Fig. S1 (ESI†), the compounds 1a–3a undergo clean decomposition above 170°, the residual mass being consistent with the formation of PbSe. With this data in hand, we figured that the preparation of PbSe nanomaterials by thermal decomposition of these complexes would be feasible under relatively mild conditions.Therefore, following the work of the late Paul O'Brien, as a proof of principle compound 3a was selected and decomposed in a microwave-assisted synthesis with a mixture of octadecene (ODC) and TOP as solvent and stabilizing reagent. Due to the strong dipole moment of ionic liquids, [BMIm][NTf2] was added to the solution for efficient absorption of microwave radiation. As expected, the corresponding selected area electron diffraction, SAED and powder pattern confirms the formation of PbSe nanoparticles with crystal sizes of about 20 nm (Fig. 6b and c), using the Scherrer equation with a form factor of 1. This agrees well to the particle size of 19 ± 4 nm, determined from TEM images (Fig. 6a and Fig. S2, ESI†). EDX analysis of the particles also indicates a ratio of Pb to Se of nearly 1![[thin space (1/6-em)]](https://www.rsc.org/images/entities/char_2009.gif) :
:![[thin space (1/6-em)]](https://www.rsc.org/images/entities/char_2009.gif) 1 and shows no impurities besides signals of carbon and copper, which originate from the used TEM-grid (Fig. 6d).
1 and shows no impurities besides signals of carbon and copper, which originate from the used TEM-grid (Fig. 6d).
Compared to the formation of PbSe nano-cubes with an edge length of 11 ± 9 nm, as was previously reported by O'Brien for the thermal decomposition of a structurally related complex,9 the microwave assisted synthesis led to spherical and slightly larger particles. Furthermore, the particles exhibit a significantly greater degree of aggregation, which might not necessarily be a result of the synthesis but could also be related to a different sample preparation used for the TEM measurements from that used by O'Brien.9 An influence of the ionic liquid on the particle shape, size or aggregation is rather unlikely due to the very small amount of [BMIm][NTf2] compared to that of TOP, but cannot be completely ruled out.
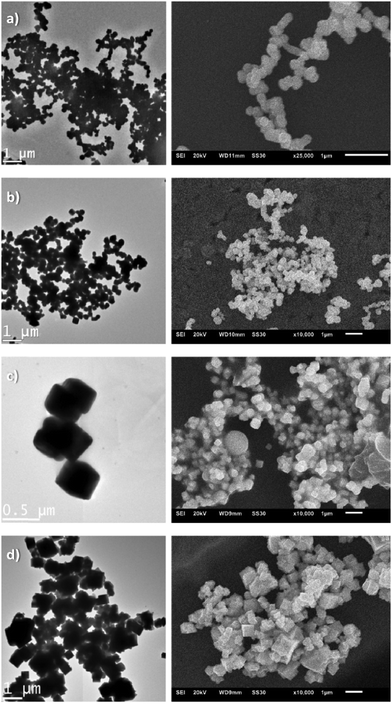
In order to further investigate the capability of [BMIm][NTf2] to stabilize PbSe nanoparticles and to evaluate its influence on other factors such as particle growth or morphology, a total of four additional experiments were carried out using 3a for proof of principle (Table 2). The choice of propylene carbonate (PC) as solvent resulted from to its desirable properties in terms of microwave absorption and nanoparticle stabilization as well as its excellent miscibility with ionic liquids.
| Decomposition parameters | Particle sizea [nm] | |
|---|---|---|
| a The particle size distribution results from a size determination of at least 90 particles from the TEM images. b A precise determination of the particle size was not possible due to the formation of strongly intergrown agglomerates. | ||
| a | [BMIm][NTf2], 180 °C, 50 W | 178 ± 90 |
| b | [BMIm][NTf2], 200 °C, 50 W | 186 ± 116 |
| c | [BMIm][NTf2] in PC (50 vol%), 200 °C, 50 W | 366 ± 90 |
| d | PC, 200 °C, 50 W | —b |
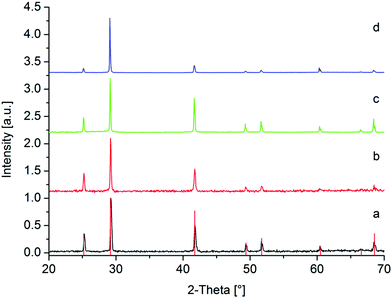
As expected, the respective powder patterns of the prepared samples show the formation of cubic PbSe (Fig. 7). However, unlike when using TOP, the diffraction lines are relatively narrow and sharp, indicating the formation of much larger particles. The PbSe sample, which was produced in pure propylene carbonate, displays an intensity increase of the line at 29.17° from the (200) plane compared to the other lines, which may suggest a preferential growth along the respective plane.
The corresponding TEM and SEM images (Fig. 8) as well as EDX spectra (Fig. S3–S6, ESI†) confirm the previously made assumptions.
The TEM images show either aggregated particles with an average size of 178 nm, 186 nm or 366 nm and a mostly cubic morphology in in the presence of the ionic liquid or significantly larger and strongly intergrown structures without the use of [BMIm][NTf2]. Considering the cubic elementary cell of PbSe, the particle shape is not particularly unusual, as already shown in previous publications. In all cases, the EDX spectra confirm the expected ratio of Pb to Se of about 1![[thin space (1/6-em)]](https://www.rsc.org/images/entities/char_2009.gif) :
:![[thin space (1/6-em)]](https://www.rsc.org/images/entities/char_2009.gif) 1. In addition to these results, SAED analyses also verify the formation of cubic PbSe (Fig. S3–S6, ESI†).
1. In addition to these results, SAED analyses also verify the formation of cubic PbSe (Fig. S3–S6, ESI†).
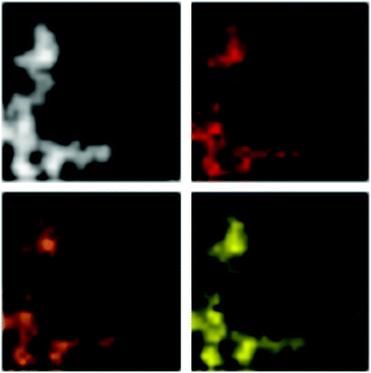
An exemplary STEM-EDX mapping (Fig. 9) of the particles obtained by decomposition of the lead compound at 200 °C in [BMIm][NTf2] shows that Pb and Se are both homogeneously distributed within the particles. This clearly illustrates the homogeneity of the prepared particles and also confirms their composition based on a ratio of the two elements of 1![[thin space (1/6-em)]](https://www.rsc.org/images/entities/char_2009.gif) :
:![[thin space (1/6-em)]](https://www.rsc.org/images/entities/char_2009.gif) 1 according to the EDX analyses.
1 according to the EDX analyses.
With regard to the microwave-assisted synthesis of PbSe nanoparticles, the present results show that, on one hand, compound 3a is very well suited as a precursor compound and, on the other hand, that under the selected conditions the ionic liquid is only capable of stabilizing large particles rather than nano-sized PbSe. Presumably, the weakly coordinating interactions of the ionic liquid are not sufficient enough to obtain particles below 100 nm. Therefore, [BMIm][NTf2] is an ideal additive for the microwave assisted synthesis of PbSe nanoparticles rather than a stabilizing reagent, due to its very good absorption properties towards microwave irradiation and its very weak interaction with the growing particles.
Experimental
General
Reagents and solvents (HPLC grade) were obtained from commercial suppliers and were used as received. Reactions were carried out under ambient conditions without exclusion of air or moisture. Acylselenourea 1 was prepared as previously reported.24NMR spectra were recorded on a Bruker Avance 400 or a Bruker Avance III 600 spectrometer. Chemical shifts are referenced externally against Me4Si (1H and 13C) and Me2Se (77Se). Elemental analyses were carried out by staff of the in-house facility using an Elementar Vario EL analyser. TGA-DSC curves were recorded on a Netzsch STA 449 F5 Jupiter system over a temperature range from 25 to 1000° with a heating rate of 8 K min−1. The powder X-ray diffraction (PXRD) patterns of the PbSe nanostructures were measured at ambient temperature on a Bruker D2-Phaser using a flat sample holder for 1 h with a Cu-K Kα radiation (λ = 1.54182 Å, 35 kV). HR-TEM imaging was performed on a FEI Tecnai G2 F20 electron microscope operated at 200 kV accelerating voltage.25 Digital images were recorded by a Gatan UltraScan 1000P detector. Samples were prepared using 200 μm carbon-coated copper grids. The TEM-EDX spectra, high-angle annular dark-field scanning transmission electron microscopy (HAADF-STEM) images, EDX-mapping and SAED patterns were also recorded on the FEI Tecnai G2 F20 with an exposure time of 3 min for the individual EDX spectra. The spectra always showed traces of oxygen as a result of the preparation of the grids in air. For each acquisition, a sample region with a significant amount of material was placed inside the aperture. The diffraction images were calibrated with Debye–Scherrer patterns recorded from a gold reference sample (S106, Plano GmbH, Wetzlar, Germany).
SEM images were aquired on a JEOL JSM-6510 advanced electron microscope, with a LaB6 cathode at 5–20 keV. The microscope was equipped with a XFlash 410 silicon drift detector.
Synthesis of the acylselenourea compounds
To a solution of KSeCN (3.6 g, 25 mmol) in acetone (200 mL) the corresponding acid chloride (25 mmol) was added. After ca. 5 minutes at room temperature the secondary amine (25 mmol) was slowly added to the suspension. After stirring for a further 10–15 min at room temperature, the entire mixture was poured into cold 0.1 M HCl, resulting in precipitation of the crude product. This was isolated by filtration and was recrystallised from EtOH or acetone.Synthesis of the lead complexes
Caution! Lead compounds are highly toxic materials. Appropriate personal protective equipment must be worn and waste must be disposed off according to local regulations.To a solution of the acylselenourea in EtOH (10 mL) was added a solution of Pb(OAc)2 (0.5 equiv.) in water (10 mL). To this was added a solution of NaOAc (2.5 equiv.) in water (2 mL) and the resulting mixture was left to stand in a refrigerator for ca. 24 h. The resulting solid was isolated by filtration and dried. The product was purified by dissolving the crude material in CH2Cl2 and filtration through Celite. Addition of hexanes to the filtrate and cooling afforded the products in crystalline form.
Synthesis of PbSe nanoparticles
All synthetic experiments were carried out under nitrogen or argon atmosphere using Schlenk techniques. The ionic liquid [BMIm][NTf2] was synthesized according to literature procedures26 by the reaction of 1-methylimidazole with 1-chlorbutane following an ion-exchange reaction with LiNTf2. 19.2 mg of complex 3a were suspended overnight in a mixture of 0.5 mL TOP (1.12 mmol), 0.3 mL octadecene (0.94 mmol) and 30 mg (0.07 mmol) of the ionic liquid. The resulting suspension was then heated in a microwave reactor and compound 3a was decomposed at 200 °C (50 W) for 15 minutes.Synthesis of PbSe submicrostructures
19.8 mg of complex 3a (corresponding to an amount of 0.5 weight% Pb.) was suspended overnight in a either 1.00 g (2.38 mmol) [BMIm][NTf2], propylene carbonate (9.79 mmol) or [BMIm][NTf2] in propylene carbonate (50 vol%). The resulting suspensions were then heated in a microwave reactor and compound 3a was decomposed at 200 °C (50 W) for 15 minutes. Additionally, another suspension of the complex in [BMIm][NTf2] was decomposed for 15 minutes at 180 °C (50 W). For the investigations of the particles, the particle dispersions were first precipitated with acetonitrile, washed three times with 1 mL acetonitrile each and were then dried under vacuum to give a powdery product, that could be redispersed if needed.X-ray crystallography
Data were collected at 150 K using a Rigaku Oxford Diffraction Gemini E Ultra diffractometer, equipped with an EOS CCD area detector and a four-circle kappa goniometer. For the data collection, the Mo source emitting graphite-monochromated Mo-Kα radiation (λ = 0.71073 Å) was used. Data integration, scaling and empirical absorption correction was carried out using the CrysAlis Pro program package.27 The structure was solved using Direct Methods and refined by Full-Matrix-Least-Squares against F2. The non-hydrogen atoms were refined anisotropically and hydrogen atoms were placed at idealized positions and refined using the riding model. All calculations were carried out using ShelXS and ShelXT within the Olex2 graphical interface.28 Important crystallographic and refinement details are collected in Table S1, ESI.† The butyl chains in the structure of the lead complex [Pb{4-ClC6H4C(O)NC(Se)NnBu2}2] (2a) were found to be disordered over two positions. Refinement of the occupancy factor of the two atom positions resulted in an approximate ratio of 60![[thin space (1/6-em)]](https://www.rsc.org/images/entities/char_2009.gif) :
:![[thin space (1/6-em)]](https://www.rsc.org/images/entities/char_2009.gif) 40. Anisotropic refinement of all of the nBu chain carbon atoms proved unsuccessful, therefore some atoms could only be refined isotropically. The structural data has been deposited with the CCDC 1586974–1586978.†
40. Anisotropic refinement of all of the nBu chain carbon atoms proved unsuccessful, therefore some atoms could only be refined isotropically. The structural data has been deposited with the CCDC 1586974–1586978.†
Conclusions
In summary, three lead(II) bis(acylselenoureato) complexes (1a–3a) were prepared by the reaction of the respective acylselenoureas and Pb(OAc)2. These complexes were fully characterized by NMR spectroscopy, elemental analysis and single crystal diffraction.The lead(II) compound 3a was successfully decomposed in a microwave-assisted reaction in either a mixture of TOP/octadecene/[BMIm][NTf2], a mixture of [BMIm][NTf2]/PC, in pure [BMIm][NTf2] or in pure PC, resulting in the formation of different PbSe nanostructures. The respective TEM and SEM analysis showed the formation of nanoparticles, sub-microstructures or strongly aggregated and intergrown structures depending on the stabilizing reagent used, indicating that the ionic liquid [BMIm][NTf2] is rather an ideal additive than an exceptional stabilizing reagent for the microwave-assisted synthesis of PbSe nanoparticles.
Conflicts of interest
There are no conflicts to declare.Acknowledgements
This work has been supported by the German Science Foundation (DFG) within the priority program SPP 1708 “Material Synthesis Near Room Temperature” (grant JA 466/31-1/2 for CJ). We also want to thank Dr Juri Barthel at the Ernst Ruska-Centre, Forschungszentrum Jülich GmbH (FZ Jülich), Germany for his technical support at the TEM facility under project number ER-C A-060 and Retorte GmbH for a generous donation of elemental selenium.Notes and references
- (a) Wiley Encyclopaedia of Electrical and Electronics Engineering, ed. J. G. Webster, Wiley, Hoboken, 2014 Search PubMed; (b) D. Khokhlov, Lead Chalcogenides: Physics and Applications, CRC Press, New York, 2002 Search PubMed; (c) C. K. Miskin, S. D. Deshmukh, V. Vasiraju, K. Bock, G. Mittal, A. Dubois-Camacho, S. Vaddiraju and R. Agrawal, ACS Appl. Nano Mater., 2019, 2, 1242–1252 CrossRef CAS; (d) W. D. Lawson, J. Appl. Phys., 1951, 22, 1444–1447 CrossRef CAS.
- (a) C. R. Kagan, E. Lifshitz, E. H. Sargent and D. V. Talapin, Science, 2016, 353, aac5523 CrossRef PubMed; (b) X. Dai, Z. Zhang, Y. Jin, Y. Niu, H. Cao, X. Liang, L. Chen, J. Wang and X. Peng, Nature, 2014, 515, 96–99 CrossRef CAS PubMed; (c) X. Xing, C. Liu, W. Shang, H. Qin, Z. Chen and F. Cao, Infrared Phys. Technol., 2019, 98, 315–322 CrossRef CAS.
- (a) W. Ahmad, J. He, Z. Liu, K. Xu, Z. Chen, X. Yang, D. Li, Y. Xia, J. Zhang and C. Chen, Adv. Mater., 2019, 31, 1900593 CrossRef PubMed; (b) R. Schaller and V. Klimov, Phys. Rev. Lett., 2004, 92, 186601 CrossRef CAS PubMed; (c) O. E. Semonin, J. M. Luther, S. Choi, H. Y. Chen, J. Gao, A. J. Nozik and M. C. Beard, Science, 2011, 334, 1530–1533 CrossRef CAS PubMed; (d) O. E. Semonin, J. M. Luther and M. C. Beard, Mater. Today, 2012, 15, 508–515 CrossRef CAS.
- (a) T. Zhu, L. Zheng, X. Yao, L. Liu, F. Huang, Y. Cao and X. Gong, ACS Appl. Mater. Interfaces, 2019, 11, 9205–9212 CrossRef CAS PubMed; (b) V. Sukhovatkin, S. Hinds, L. Brzozowski and E. H. Sargent, Science, 2009, 324, 1542–1544 CrossRef CAS PubMed; (c) G. Xiao, Y. Wang, J. Ning, Y. Wei, B. Liu, W. W. Yu, G. Zoua and B. Zou, RSC Adv., 2013, 3, 8104–8130 RSC; (d) M. Dolatyari, A. Rostami, S. Mathur and A. Klein, J. Mater. Chem. C, 2019, 7, 5658–5669 RSC.
- (a) R. Li, J. Zhang, Y. Xu, X. Miao and D. Zhang, RSC Adv., 2014, 4, 14221–14226 RSC; (b) S. V. Kershaw, A. S. Susha and A. L. Rogach, Chem. Soc. Rev., 2013, 42, 3033–3087 RSC; (c) I. Moreels, K. Lambert, D. Smeets, D. De Muynck, T. Nollet, J. C. Martins, F. Vanhaecke, A. Vantomme, C. Deleruell, G. Allan and Z. Hens, ACS Nano, 2009, 3, 3023–3030 CrossRef CAS PubMed.
- S. A. Saah, P. D. McNaughter, M. A. Malik, J. A. M. Awudza, N. Revaprasadu and P. O’Brien, J. Mater. Sci., 2018, 53, 4283–4293 CrossRef CAS.
- S. A. Saah, M. D. Khan, P. D. McNaughter, J. A. M. Awudza, N. Revaprasadu and P. O’Brien, New J. Chem., 2018, 42, 16602–16607 RSC.
- T. E. Ezenwa, P. D. McNaughter, J. Raftery, D. J. Lewis and P. O’Brien, Dalton Trans., 2018, 47, 16938–16943 RSC.
- J. Akhtar, M. A. Malik, S. K. Stubbs, P. O'Brien, M. Helliwell and D. J. Binks, Eur. J. Inorg. Chem., 2011, 2984–2990 CrossRef CAS.
- J. Akhtar, J. C. Bruce, M. A. Malik, K. R. Koch, M. Afzaal and P. O’Brien, Mater. Res. Soc. Symp. Proc., 2009, 1148E Search PubMed , 1148-PP12-08.
- C. Vollmer and C. Janiak, Coord. Chem. Rev., 2011, 255, 2039–2057 CrossRef CAS.
- Z. He and P. Alexandridis, Phys. Chem. Chem. Phys., 2015, 17, 18238–18261 RSC.
- S. Wegner and C. Janiak, Top. Curr. Chem., 2017, 375, 65, DOI:10.1007/s41061-017-0148-1.
- (a) C. Verma, E. E. Ebenso and M. A. Quraishi, J. Mol. Liq., 2019, 276, 826–849 CrossRef CAS; (b) J. Łuczak, M. Paszkiewicz, A. Krukowska, A. Malankowska and A. Zaleska-Medynska, Adv. Colloid Interface Sci., 2016, 230, 13–28 CrossRef PubMed; (c) J. Łuczak, M. Paszkiewicz, A. Krukowska, A. Malankowska and A. Zaleska-Medynska, Adv. Colloid Interface Sci., 2016, 227, 1–52 CrossRef PubMed.
- (a) M. Siebels, L. Mai, L. Schmolke, K. Schütte, J. Barthel, J. Yue, J. Thomas, B. Smarsly, A. Devi, R. A. Fischer and C. Janiak, Beilstein J. Nanotechnol., 2018, 9, 1881–1894 CrossRef CAS PubMed; (b) K. Klauke, I. Gruber, T.-O. Knedel, L. Schmolke, J. Barthel, H. Breitzke, G. Buntkowsky and C. Janiak, Organometallics, 2018, 37, 298–308 CrossRef CAS; (c) K. Schütte, H. Meyer, C. Gemel, J. Barthel, R. A. Fischer and C. Janiak, Nanoscale, 2014, 6, 5532–5544 RSC.
- (a) P. Voepel, M. Weiss, B. M. Smarsly and R. Marschall, J. Photochem. Photobiol., A, 2018, 366, 34–40 CrossRef CAS; (b) Y. Kim, B. Heyne, A. Abouserie, C. Pries, C. Ippen, C. Günter, A. Taubert and A. Wedel, J. Chem. Phys., 2018, 148, 193818 CrossRef PubMed.
- (a) Z. Tshemese, M. D. Khan, S. Mlowe and N. Revaprasadu, Mater. Sci. Eng., B, 2018, 227, 116–121 CrossRef CAS; (b) B. Rodríguez-Cabo, E. Rodil, H. Rodríguez, A. Soto and A. Arce, Angew. Chem., 2012, 124, 1453–1456 CrossRef; (c) K. Biswas and C. N. R. Rao, Chem. – Eur. J., 2007, 13, 6123–6129 CrossRef CAS PubMed.
- K. Ding, H. Lu, Y. Zhang, M. L. Snedaker, D. Liu, J. A. Maciá-Agulló and G. D. Stucky, J. Am. Chem. Soc., 2014, 136(44), 15465–15468 CrossRef CAS PubMed.
- I. B. Douglass, J. Am. Chem. Soc., 1937, 59, 740–742 CrossRef CAS.
- J. C. Bruce and K. R. Koch, Acta Crystallogr., Sect. C: Cryst. Struct. Commun., 2008, C64, m1–m4 CrossRef PubMed.
- M. Kampf, R. Richter, L. Hennig, A. Eidner, J. Baldamus and R. Kirmse, Z. Anorg. Allg. Chem., 2004, 630, 2677–2686 CrossRef CAS.
- M. Schuster and W. Bensch, Z. Naturforsch., B: J. Chem. Sci., 1994, 49, 1615–1619 CAS.
- J. Akhtar, M. Akhtar, M. A. Malik, P. O'Brien and J. Raftery, J. Am. Chem. Soc., 2012, 134, 2485–2487 CrossRef CAS PubMed.
- A. Molter, J. Rust, C. W. Lehmann and F. Mohr, ARKIVOC, 2011, vi, 10–17 Search PubMed.
- M. Luysberg, M. Heggen and K. Tillmann, Ernst Ruska-Centre for Microscopy and Spectroscopy with Electrons. FEI Tecnai G2 F20, Journal of Large-Scale Research Facilities, 2016, 2, A77, DOI:10.17815/jlsrf-2-138.
- (a) A. K. Burrell, R. E. D. Sesto, S. N. Baker, T. M. McCleskey and G. A. Baker, Green Chem., 2007, 9, 449–454 RSC; (b) L. Cammarata, S. G. Kazarian, P. A. Salter and T. Welton, Phys. Chem. Chem. Phys., 2001, 3, 5192–5200 RSC; (c) P. Bonhôte, A.-P. Dias, N. Papageorgiou, K. Kalyanasundaram and M. Grätzel, Inorg. Chem., 1996, 35, 1168–1178 CrossRef PubMed.
- CrysAlisPro, Rigaku Oxford Diffraction Ltd., Oxford (UK), 2019 Search PubMed.
- O. V. Dolomanov, L. J. Bourhis, R. J. Gildea, J. A. K. Howard and H. Puschmann, J. Appl. Crystallogr., 2009, 42, 339–341 CrossRef CAS.
Footnote |
| † Electronic supplementary information (ESI) available: Thermal analysis, further PbSe particle characterization, crystallographic solution and refinement details. CCDC 1586974–1586978. For ESI and crystallographic data in CIF or other electronic format see DOI: 10.1039/d0nj01433h |
| This journal is © The Royal Society of Chemistry and the Centre National de la Recherche Scientifique 2020 |

