
 Open Access Article
 This Open Access Article is licensed under a Creative Commons Attribution-Non Commercial 3.0 Unported Licence
Loss of allergy-protective capacity of raw cow's milk after heat treatment coincides with loss of immunologically active whey proteins
Suzanne
Abbring†
 a,
Ling
Xiong†
b,
Mara A. P.
Diks
a,
Ton
Baars
c,
Johan
Garssen
ad,
Kasper
Hettinga‡
b and
Betty C. A. M.
van Esch‡
*ad
a,
Ling
Xiong†
b,
Mara A. P.
Diks
a,
Ton
Baars
c,
Johan
Garssen
ad,
Kasper
Hettinga‡
b and
Betty C. A. M.
van Esch‡
*ad
aDivision of Pharmacology, Utrecht Institute for Pharmaceutical Sciences, Faculty of Science, Utrecht University, Utrecht, The Netherlands. E-mail: e.c.a.m.vanesch@uu.nl; Tel: +31(0)6-25732735
bDairy Science and Technology, Food Quality and Design Group, Wageningen University, Wageningen, The Netherlands
cResearch Institute of Organic Agriculture (FiBL), Frick, Switzerland
dDanone Nutricia Research, Utrecht, The Netherlands
First published on 9th June 2020
Abstract
The allergy-protective capacity of raw cow's milk was demonstrated to be abolished after heat treatment. The heat-sensitive whey protein fraction of raw milk is often implied to be the source of this allergy-protective effect, but a direct link between these proteins and the protection against allergic diseases is missing. This study therefore aimed at investigating the mechanistic relation between heat damage to whey proteins and allergy development. Raw cow's milk was heated for 30 min at 50, 60, 65, 70, 75, or 80 °C and the native whey protein profile of these differentially heated milk samples was determined using LC-MS/MS-based proteomics. Changes in the native protein profile were subsequently related to the capacity of these milk samples to prevent the development of ovalbumin-induced food allergy in a murine animal model. A substantial loss of native whey proteins, as well as extensive protein aggregation, was observed from 75 °C. However, whey proteins with immune-related functionalities already started to denature from 65 °C, which coincided with the temperature at which a loss of allergy protection was observed in the murine model. Complement C7, monocyte differentiation antigen CD14, and polymeric immunoglobulin receptor concentrations decreased significantly at this temperature, although several other immunologically active whey proteins also showed a decrease around 65 °C. The current study demonstrates that immunologically active whey proteins that denature around 65 °C are of importance for the allergy-protective capacity of raw cow's milk and thereby provides key knowledge for the development of microbiologically safe alternatives to raw cow's milk.
Introduction
Allergic diseases are a serious health problem. They affect the lives of more than a billion people worldwide and their prevalence is expected to rise to four billion by 2050. Because of the large number of people affected, society faces huge healthcare costs and major socio-economic consequences.1The vast increase in the prevalence of allergic diseases is mainly evident in industrialized countries and is often linked to the Western lifestyle.2,3 This lifestyle is accompanied by the loss of rural living conditions resulting in a decreased microbial exposure in early life. In accordance with this so-called hygiene hypothesis, epidemiological studies have consistently shown that children growing up on a farm are at a significantly lower risk of developing allergic diseases than children living in the same rural area but not growing up on a farm.3–9 Several farm exposures have been associated with this protective ‘farm effect’,10–13 but particularly the consumption of raw, unprocessed, cow's milk is of interest, since this effect was found to be independent of living on a farm. This suggests that a general, non-farming, population might equally benefit from the consumption of raw cow's milk.13–16 Raw cow's milk consumption can thus be considered a possible allergy-preventive measure. However, due to the potential presence of pathogens, its consumption is discouraged by regulatory agencies.17
A wide range of components have been hypothesized to contribute to the allergy-protective effects of raw cow's milk.18–20 Since recent research clearly demonstrates a loss of protection upon heat treatment, heat-sensitive raw milk components, like whey proteins, are the most likely candidates.15,16,21,22 In contrast to caseins, whey proteins are susceptible to heat treatment.23 Heating of these proteins induces processes like denaturation and aggregation which results in structural alterations that can lead to loss of functionality.24–26 Particularly immunologically active whey proteins, like lactoferrin and immunoglobulins, are heat-sensitive.27 Since these components have immune-related functionalities that can be linked to the allergy-protective effects of raw cow's milk, abolishing them by heat treatment could be underlying the loss of protection.19 In addition to destroying immunologically active whey proteins, heat treatment can also induce the formation of new protein structures. Heating, for example, leads to aggregation of β-lactoglobulin and α-lactalbumin, both with themselves as well as with casein micelles.25,26,28 Aggregation of these whey proteins has been demonstrated to result in a shift in uptake from enterocytes to Peyer's patches thereby leading to increased immunogenicity29 A better understanding of the heat sensitivity of whey proteins is key for the development of optimized processing parameters, that may lead to a safe and protective product in the future.
Although the effect of milk processing on whey proteins is widely studied, a direct link demonstrating the consequences on the allergy-protective effects associated with raw milk is lacking. Providing this link is crucial to gain more insight in the actual whey protein(s) involved in the allergy-protective effects of raw cow's milk. In the present study, native proteomics was therefore combined with a functional readout for allergic diseases. This study hereby aimed at achieving a better understanding of the underlying mechanism between heat damage to whey proteins and allergy development and is, to our knowledge, the first to compare different heating temperatures (instead of high heat vs. no heat).
Materials and methods
Mice
Specific pathogen-free, three-week-old, female C3H/HeJ mice were purchased from The Jackson Laboratory (Bar Harbor, ME, USA). Upon arrival, mice were randomly assigned to the control or experimental groups. They were housed at the animal facility of Utrecht University (Utrecht, The Netherlands) in filter-topped makrolon cages (one cage per group, n = 6–8 per cage) on a 12 h light/dark cycle with access to food (‘Rat and Mouse Breeder and Grower Expanded’; Special Diet Services, Witham, UK) and water ad libitum. Animal procedures were approved by the Ethical Committee for Animal Research of the Utrecht University and conducted in accordance with the European Directive 2010/63/EU on the protection of animals used for scientific purposes (AVD108002015346).Milk collection and heat treatment
Raw cow's milk was collected from a biodynamic dairy farm (Hof Dannwisch, Horst, Germany). Upon collection, part of the raw milk was heated to obtain the 50 °C, 60 °C, 65 °C, 70 °C, 75 °C, and 80 °C milk samples. For each of these heat treatments, three 50 mL aliquots were placed in a water bath and as soon as the milk reached the target temperature, heating was continued for 30 min. After these 30 min, the milk was cooled on ice. The milk used for the animal experiment was then aliquoted and stored at −20 °C until further use. The milk used for protein analysis was immediately used to obtain the whey fraction. An overview of all milk processing steps is shown in Fig. 1A. | ||
| Fig. 1 Schematic overview of the experimental setup. (A) Flow chart of the various milk processing steps. (B) Experimental timeline of the animal study. OVA, ovalbumin; CT, cholera toxin. | ||
Whey fraction preparation
After heat treatment, milk samples used for protein analysis were skimmed by centrifugation at 1500g for 20 min at 10 °C (Avanti J-26 XP, rotor 25.15; Beckman Coulter, Miami, FL, USA). Caseins and denatured proteins were subsequently removed as described previously.30 After ultracentrifugation, samples were separated into three phases. The top layer was remaining milk fat, the middle layer was milk serum with the native whey proteins (the whey fraction), and the bottom layer (pellet) was micellar casein with denatured/aggregated proteins. The whey fraction was collected and used for further analysis as described below.Protein characterization by BCA assay and SDS-PAGE
The soluble protein content remaining in the native whey fraction was determined by using the Pierce BCA Protein Assay Kit according to the manufacturer's instructions (Thermo Fisher Scientific, Paisley, Scotland). In addition, whey fraction samples were loaded onto an SDS-PAGE and proteins were visualized using CBB R-250 Staining Solution (Bio-Rad, Veenendaal, The Netherlands), as described previously,31 to determine the abundance of milk proteins in the native whey fraction. Gels were scanned using the ChemiDoc XRS + Imaging System (Bio-Rad) with Image Lab Software (Bio-Rad).Sample preparation for proteomics
The Filter Aided Sample Preparation (FASP) method was carried out according to Wiśniewski et al.,32 with adaptations according to Hettinga et al. and Lu et al.33,34 Briefly, protein samples (10 μg), after reduction and alkylation, were transferred to a Pall 3K Omega filter (Pall Corporation, Port Washington, NY, USA), where they were washed with 8 M urea and ABC. The filter unit was then transferred to a new low-binding microcentrifuge tube and 100 μL ABC containing 0.5 μg trypsin (Roche, Penzburg, Germany) was added to digest the protein. Finally, 6 μL trifluoroacetic acid (TFA; Sigma-Aldrich) was added to the resulting peptide solutions to adjust the pH of the samples to around 2. These samples were then ready for LC-MS/MS.Proteomics by LC-MS/MS
The LC-MS/MS parameters used were the same as described previously.35,36 Samples were analyzed by injecting 18 μL of trypsin-digested whey protein fractions in a 0.10 × 30 mm Magic C18AQ 200A 5 μm beads (Michrom BioResources Inc., Auburn, CA, USA) pre-concentration column (prepared in house) at a maximum pressure of 800 bar. Peptides were eluted from the pre-concentration column onto a 0.10 × 200 mm ReproSil-Pur 120 C18-AQ 1.9 μm beads analytical column. Between the pre-concentration and analytical column, an electrospray potential of 3.5 kV was applied directly to the eluent through a stainless steel needle fitted into the waste line of the micro cross. Full scan positive mode FTMS spectra were measured between m/z 380 and 1400 on an LTQ-Orbitrap XL (Thermo Electron, San Jose, CA, USA). CID-fragmented MS/MS scans of the four most abundant doubly- and triply-charged peaks in the FTMS scan were recorded in data-dependent mode in the linear trap.Data analysis proteomics
Each run with all MS/MS spectra obtained was analyzed with MaxQuant 1.6.0.1 with the Andromeda search engine.37 Trypsin was set as the digestion enzyme. Carbamidomethylation of cysteines was set as a fixed modification. Oxidation of methionine, N-terminal acetylation and de-amidation of asparagine or glutamine were set as variable modifications for both identification and quantification. The bovine (taxonomy ID: 9913) reference database for peptide and protein searches was downloaded as fasta file from Uniprot with reverse sequences generated by MaxQuant (fasta file downloaded from Uniprot in 2013![[thin space (1/6-em)]](https://www.rsc.org/images/entities/char_2009.gif) 38). A set of 31 protein sequences of common contaminants was used as well. A maximum of two missed cleavages were allowed and a mass deviation of 0.5 Da for fragment MS/MS peaks, and 20 ppm and 4.5 ppm for the peptide MS peaks during the first and main search, respectively. The false discovery rate (FDR) was set to 1% on both peptide and protein level. The length of peptides was set to at least seven amino acids. Finally, proteins were identified based on minimally two distinct peptides of which at least one unique and at least one unmodified. The intensity based absolute quantification (iBAQ) algorithm, which has been reported to have a good correlation with known absolute protein concentrations, was used to reflect the quantitative effect of heating on the proteins.39 The proteomics data was further analyzed by Perseus 1.6.2.3.40
38). A set of 31 protein sequences of common contaminants was used as well. A maximum of two missed cleavages were allowed and a mass deviation of 0.5 Da for fragment MS/MS peaks, and 20 ppm and 4.5 ppm for the peptide MS peaks during the first and main search, respectively. The false discovery rate (FDR) was set to 1% on both peptide and protein level. The length of peptides was set to at least seven amino acids. Finally, proteins were identified based on minimally two distinct peptides of which at least one unique and at least one unmodified. The intensity based absolute quantification (iBAQ) algorithm, which has been reported to have a good correlation with known absolute protein concentrations, was used to reflect the quantitative effect of heating on the proteins.39 The proteomics data was further analyzed by Perseus 1.6.2.3.40
Experimental design animal study
A schematic representation of the experimental timeline is depicted in Fig. 1B. Mice were orally exposed, by using a blunt needle, to 0.5 mL raw milk, the milk samples heated at 50 °C, 60 °C, 65 °C, 70 °C, 75 °C, 80 °C or PBS (as a control) for eight consecutive days (days-9 to -2). Subsequently, mice (n = 8 per group) were orally (by means of gavage) sensitized to 20 mg ovalbumin (OVA; 20 mg per 0.5 mL PBS; grade V; Sigma-Aldrich) using 15 μg cholera toxin (CT; List Biological Laboratories, Campbell, CA, USA) as an adjuvant (days 0, 7, 14, 21, and 28). Sham-sensitized control mice (n = 6) received CT alone (15 μg per 0.5 mL PBS). OVA solutions were passed through Pierce High Capacity Endotoxin Removal Resin (Thermo Fisher Scientific) to remove lipopolysaccharide. Five days after the last sensitization (day 33), all mice were intradermally and orally (50 mg per 0.5 mL PBS) challenged with OVA. Sixteen hours after the oral challenge (day 34), a blood sample was taken via cheek puncture and mice were killed by cervical dislocation.Assessment of the acute allergic skin response
All mice were intradermally challenged in both ear pinnae with OVA (10 μg OVA per 20 μL PBS) to determine the magnitude of the acute allergic skin response. The acute allergic skin response is expressed as Δ ear swelling (μm) and was calculated by subtracting mean basal ear thickness from mean ear thickness 1 h after intradermal challenge. Ear thickness at both timepoints was measured in duplicate for each ear using a digital micrometer (Mitutoyo, Veenendaal, The Netherlands). Measurements were carried out by a researcher blinded to treatment. To be able to perform the intradermal challenge and both ear measurements, mice were anesthetized using inhalation of isoflurane (Abbott, Breda, The Netherlands).Detection of OVA-specific IgE in serum
Serum OVA-specific IgE levels were quantified by means of ELISA as described elsewhere.22 Results are expressed in arbitrary units, calculated based on an internal standard curve of pooled sera.Flow cytometric analysis of immune cells
Lymphocytes were isolated from spleen by crushing tissue through a 70 μm nylon cell strainer and removing red blood cells using lysis buffer (8.3 g NH4Cl, 1 g KHC3O, and 37.2 mg EDTA dissolved in 1 L demi water, filter sterilized). The obtained single cell suspensions were subsequently incubated for 15 min on ice with anti-mouse CD16/CD32 (Mouse BD Fc Block; BD Biosciences, Alphen aan de Rijn, The Netherlands) in PBS/1% BSA (Sigma-Aldrich)/5% fetal bovine serum (FBS; Bodinco, Alkmaar, The Netherlands) buffer to block non-specific binding sites. Cells were then extracellularly stained with the following antibodies (all purchased from eBioscience, Breda, The Netherlands, unless otherwise stated): CD4-PerCP-Cy5.5, CXCR3-PE, T1ST2-FITC (MD Bioproducts, St Paul, MN, USA), CD25-Alexa Fluor® 488, latency-associated peptide (LAP)-PE-Cy7, F4/80-APC-eFluor® 780, CD11c-PerCP-Cy5.5, MHCII-FITC or CD45-PE-Cy7 for 30 min on ice. Fixable Viability Dye-eFluor® 780 (eBioscience) was used to exclude dead cells from analysis. Cells only needed to be stained extracellularly were fixed using Intracellular Fixation Buffer (eBioscience). Cells also to be stained intracellularly were fixed and permeabilized using the FoxP3 Transcription Factor Staining Buffer Set (eBioscience) and then stained with FoxP3-APC or IL-10-PE (eBioscience). Fluorescently stained cells were measured with the FACS Canto II (BD Biosciences) and analyzed using FlowLogic Software (Inivai Technologies, Mentone, Australia). To detect LAP expression and IL-10 production, spleen-derived lymphocytes were polyclonally stimulated with anti-CD3 (10 μg mL−1)/CD28 (1 μg mL−1; eBioscience) for 24 h at 37 °C and 5% CO2, of which the last 4 h in the presence of monensin (eBioscience), prior to staining.Statistical analysis
Statistical analysis related to the protein analysis was performed using R 3.5.41 Packages ‘ggplot2’, ‘gplots’, and ‘ggbiplot’ were used for graphical representation of the data. Results on the total native whey protein content are presented as mean ± SD of triplicates. Dunnett's multiple comparisons test was used to identify statistical differences between raw and heated milk samples. The hierarchical clustered heat maps, based on Z score normalized iBAQ values of the protein profiles, were created using the R package ‘gplots’. Hierarchical clustering of both milk samples and proteins was performed using the complete agglomeration method and a Euclidean distance metric. Principal component analysis (PCA) was performed based on iBAQ values of the identified proteins using the R package ‘prcomp’ and plotted using the package ‘ggbiplot’. For the statistical analyses related to the animal experiment, GraphPad Prism software (version 7.03; GraphPad Software, San Diego, CA, USA) was used. These data are presented as mean ± SEM or as box-and-whisker Tukey plots when data were not normally distributed. Differences between pre-selected groups were statistically determined using one-way ANOVA, followed by Bonferroni's multiple comparisons test. For OVA-specific IgE levels, the Kruskal–Wallis test for non-parametric data followed by Dunn's multiple comparisons test for pre-selected groups was used. For all results, P < 0.05 was considered statistically significant.Results
Substantial loss of native whey proteins at heating temperatures of 70 °C and above
To determine the remaining amount of native whey proteins present in milk after various heat treatments, the protein concentration of the native whey fraction was determined. The results of the BCA assay show that the total native protein content gradually decreased from raw, unheated, milk to milk heated at 80 °C (Fig. 2A). However, a significant decrease in native whey protein concentration was only observed from 70 °C. To get a first indication about the effect of the different heat treatments on the most abundant whey proteins, the whey fraction was analyzed with a reducing SDS-PAGE. The two major whey proteins present in cow's milk, β-lactoglobulin and α-lactalbumin, denatured at 80 °C, as demonstrated by reduced protein band intensities on the reducing SDS-PAGE. For BSA, denaturation occurred around 75 °C. For whey proteins with immunomodulatory functionalities, such as immunoglobulins and lactoferrin, denaturation already happened at 70 and 65 °C, respectively (Fig. 2B). In addition, heat-induced aggregate formation through disulfide interchange, in both skim milk and whey fraction samples, was assessed using a non-reducing SDS-PAGE. This showed that proteins started to aggregate from 75 °C and aggregates were more abundantly present in milk heated at 80 °C (Fig. 2C). As expected, aggregates were not visible on the non-reducing SDS-PAGE of whey fraction samples, since they were removed during acidified ultracentrifugation, after which only the native proteins remained (Fig. 2D). | ||
| Fig. 2 Reduced native whey protein concentration after heating at 70 °C or higher. (A) Total protein concentration in the native whey fraction after different heat treatments. (B) Reducing SDS-PAGE of the different native whey fraction samples after heat treatment and (C) non-reducing SDS-PAGE of the different skim milk samples and (D) whey fraction samples, with the main proteins that can be identified on the gel indicated. Protein concentrations are presented as mean ± SD of triplicates. *P < 0.05 compared to raw milk as analyzed with Dunnett's multiple comparisons test. M, marker; raw, raw cow's milk; 50–80 °C, raw cow's milk heated at the indicated temperature for 30 min; IgG, immunoglobulin G; LF, lactoferrin; BSA, bovine serum albumin; IgG-H, heavy chain of immunoglobulin G; αs2-CN, αs2-casein; β-CN, β-casein; αs1-CN, αs1-casein; κ-CN, κ-casein; β-LG, β-lactoglobulin; α-LA, α-lactalbumin. | ||
Cluster analysis of the native protein profile separated 75 and 80 °C from lower heating temperatures
To further analyze the impact of heating on the native whey protein composition, proteomics was performed by means of LC-MS/MS. As expected, results showed that the protein profile has a reduced number of native proteins remaining after increasing heating intensity. A heat map was subsequently created which visualized the native protein profile of the different heat-treated milk samples. According to the clusters presented in the heat map, the native protein profile of samples heated at 75 and 80 °C differed from samples heated at lower temperatures (Fig. 3). No clear distinction could be made among samples heated below 75 °C (Fig. 3). To determine more in detail whether the differentially heat-treated milk groups could be distinguished, a PCA plot was created. Based on principal component 1, which accounted for 57.5% of the total variation, milk samples heated at 75 and 80 °C differed from samples heated at lower temperatures (Fig. 4). Unheated and ≤70 °C heat-treated milk groups differed from each other mainly on principal component 2, which accounted for 9.9% of the total variation, whereas milk heated at 50 and 60 °C could not be distinguished from each other (Fig. 4). | ||
| Fig. 3 Hierarchical cluster analysis separated 75 and 80 °C from lower heating temperatures based on native proteomics pattern. Protein profile of whey fraction samples based on Z score normalized iBAQ values. Columns reflect individual samples. The number indicates the heating temperature, while the number after the underscore indicates the replicate. Rows reflect individual proteins. Hierarchical clustering was performed using complete agglomeration method and a Euclidean distance metric. The color scale reflects the iBAQ value-based Z score. | ||
 | ||
| Fig. 4 Principal Component Analysis (PCA) distinguished different heat-treated milk groups based on native protein profile. Milk heated at 50 and 60 °C could not be distinguished from each other. Colored symbols refer to the seven milk groups tested. The first two principal axes explained 67.4% of the variance. The variation (%) explained by each PCA axis is in parentheses. PC1, principal component 1; PC2, principal component 2. | ||
Loss of allergy protection in murine OVA-induced food allergy model already evident from 65 °C
To assess whether a reduction in the amount of native whey proteins results in a loss of the allergy-protective capacity, the same milk samples were tested in a murine OVA-induced food allergy model. As expected, intradermal challenge with OVA increased the acute allergic skin response in OVA-sensitized allergic control mice compared to PBS-sensitized control mice (Fig. 5A). Treating mice with raw milk prior to OVA-sensitization significantly reduced the acute allergic skin response compared to PBS-treated allergic control mice. A shift in allergy protection appeared to occur from 60 to 65 °C; mice treated with milk heated at 60 °C still showed a significant reduction in the acute allergic skin response compared to PBS-treated allergic control mice, whereas milk heated at 65 °C was no longer protective. A loss of allergy-protection was also observed in mice treated with milk heated at 70, 75, and 80 °C (Fig. 5A). Although not significant, OVA-specific IgE levels were higher in OVA-sensitized allergic control mice compared to PBS-sensitized control mice. No differences in OVA-IgE levels were observed between milk-treated mice (Fig. 5B). | ||
| Fig. 5 Heat treatment at 65 °C or higher destroyed allergy-protective capacity of raw milk in murine OVA-induced food allergy model. (A) The acute allergic skin response (expressed as Δ ear swelling) measured 1 h after intradermal challenge in both ear pinnae with OVA. (B) OVA-specific IgE levels measured in serum 16 h after oral challenge with OVA. Data are presented as mean ± SEM for the acute allergic skin response and as box-and-whisker Tukey plot (in which outliers are shown as separately plotted points) for OVA-specific IgE levels, n = 6 in PBS group and n = 6–8 in all other groups. *P < 0.05, **P < 0.01, ****P < 0.0001 as analyzed with one-way ANOVA followed by Bonferroni's multiple comparisons test for pre-selected groups (A) or Kruskal–Wallis test for non-parametric data followed by Dunn's multiple comparisons test for pre-selected groups (B). OVA, ovalbumin; raw, raw cow's milk; 50–80 °C, raw cow's milk heated at the indicated temperature for 30 min; AU, arbitrary units. | ||
Induction of regulatory Tr1 cells correspond to acute allergic skin response
Since regulatory T cells (Tregs) are key for the induction of oral tolerance to food proteins,42 the effect of the different milk types on Treg subsets in the spleen was assessed. The percentage of CD25+FoxP3+ Treg cells was significantly decreased in OVA-sensitized allergic control mice compared to PBS-sensitized control mice. CD25+FoxP3+ Treg cell frequency did, however, not differ between milk-treated mice (Fig. 6A). Interestingly, the percentage of IL-10-producing Tr1 cells increased significantly in raw milk- and 50 °C milk-treated mice compared to PBS-treated allergic control mice (Fig. 6B). This increase coincided with the reduced acute allergic skin response observed in these groups (Fig. 5A). Although protection against allergic symptoms was also observed for milk heated at 60 °C, the percentage of Tr1 cells was not increased simultaneously (Fig. 6B). Compared to raw milk, milk heated at 65, 75 and 80 °C showed a reduction in Tr1 cell frequency (Fig. 6B), which is in line with the observed loss of protection against the OVA-induced acute allergic skin response (Fig. 5A). For the percentage of TGF-β-producing Th3 cells, the highest heating temperatures showed the lowest cell frequency, but differences were not significant (Fig. 6C).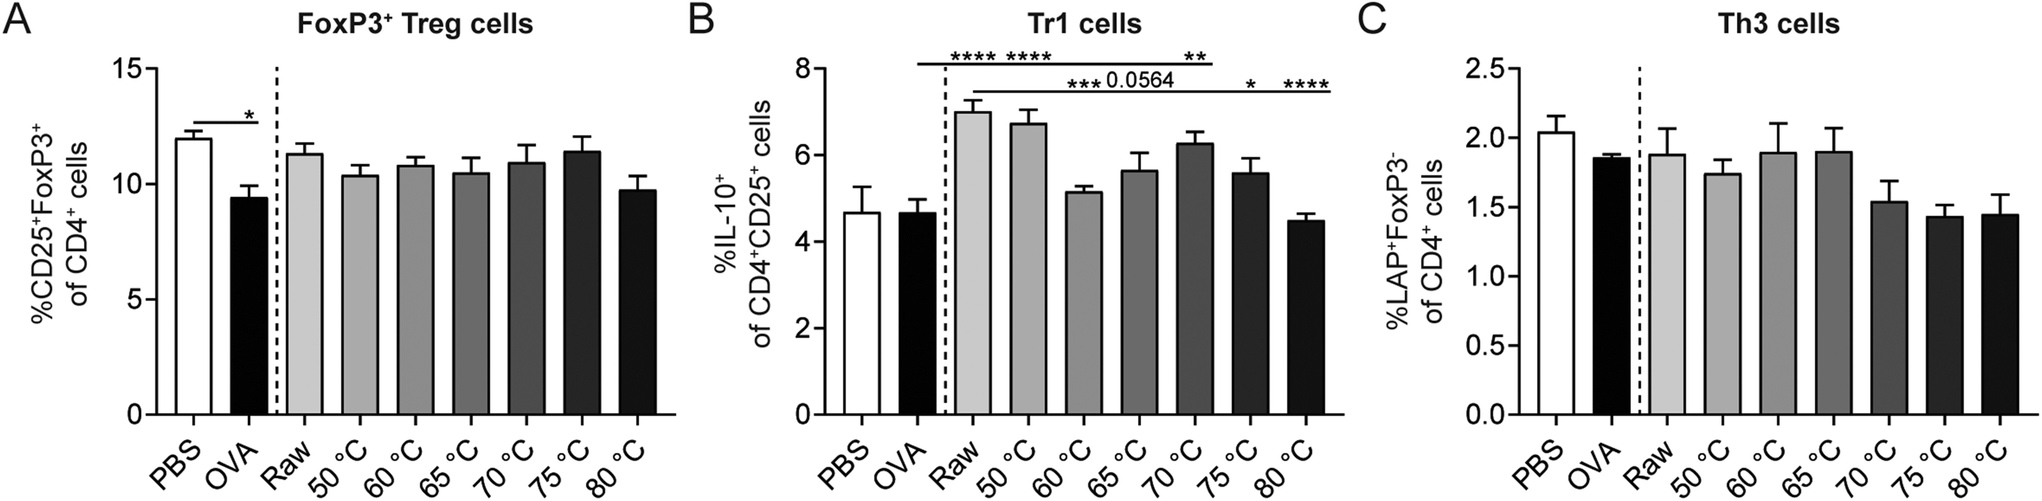 | ||
| Fig. 6 Percentage of regulatory Tr1 cells coincided with acute allergic skin response. Percentage of (A) FoxP3+ Treg cells (CD25+FoxP3+ of CD4+ cells), (B) Tr1 cells (IL-10+ of CD4+CD25+ cells), and (C) Th3 cells (LAP+FoxP3− of CD4+ cells) in the spleen. Data are presented as mean ± SEM, n = 6 in PBS group and n = 6–8 in all other groups. *P < 0.05, **P < 0.01, ***P < 0.001, ****P < 0.0001 as analyzed with one-way ANOVA followed by Bonferroni's multiple comparisons test for pre-selected groups. OVA, ovalbumin; raw, raw cow's milk; 50–80 °C, raw cow's milk heated at the indicated temperature for 30 min. | ||
Milk heated at 70 °C or higher associated with increased percentages of Th1, Th2, and dendritic cells (DCs)
Besides Tregs, also other immune cells influence the strength of the allergic response. In order to investigate the effect of the different heating temperatures on Th1 cells, Th2 cells, and DCs, splenocytes were isolated and analyzed by flow cytometry. A decrease in Th1 cells was observed in OVA-sensitized allergic control mice compared to PBS-sensitized control mice (Fig. 7A). Th2 and DC frequency did not differ between these control groups (Fig. 7B and C). Although raw milk treatment protected against allergic symptoms, which was associated with an increased percentage of regulatory Tr1 cells, it also tended to increase the percentage of Th2 cells (Fig. 7B). In addition, CD11c+MHCII+ DCs were elevated in raw milk-treated mice compared to PBS-treated allergic control mice (Fig. 7C). Milk heated at 70 °C or higher increased the percentages of Th1, Th2, and DCs compared to PBS-treated allergic control mice (Fig. 7A–C). These increased immune responses coincided with a loss of allergy protection (Fig. 5A) and low numbers of regulatory Tr1 cells (Fig. 6B).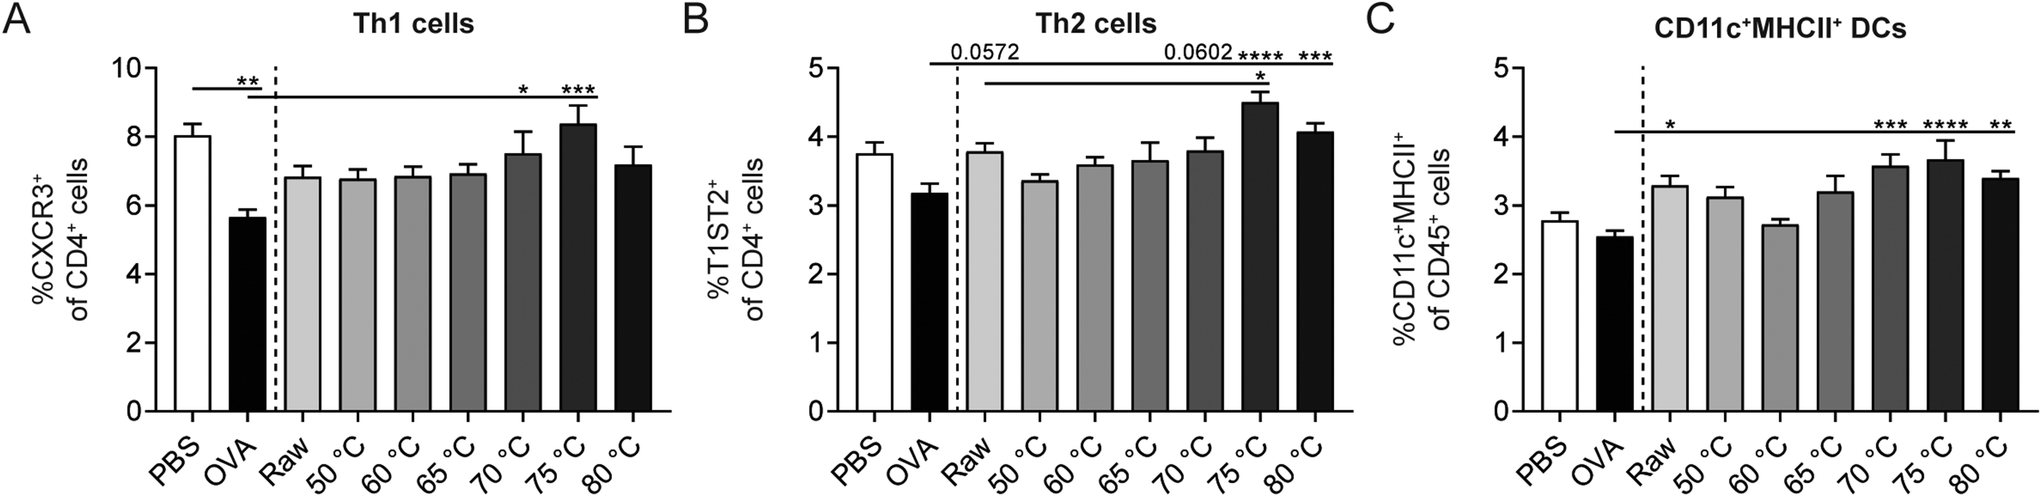 | ||
| Fig. 7 Increased Th1, Th2, and DC percentages at heating temperatures of 70 °C and above. Percentage of (A) Th1 cells (CXCR3+ of CD4+ cells), (B) Th2 cells (T1ST2+ of CD4+ cells), and (C) CD11c+MHCII+ DCs (CD11c+MHCII+ of CD45+ cells) in the spleen. Data are presented as mean ± SEM, n = 6 in PBS group and n = 6–8 in all other groups. *P < 0.05, **P < 0.01, ***P < 0.001, ****P < 0.0001 as analyzed with one-way ANOVA followed by Bonferroni's multiple comparisons test for pre-selected groups. OVA, ovalbumin; raw, raw cow's milk; 50–80 °C, raw cow's milk heated at the indicated temperature for 30 min. | ||
Denaturation of several immunologically active whey proteins already started at 60/65 °C
Even though the overall protein profile (BCA assay, clustered heat map, and PCA) showed major differences in the native protein profile from 70/75 °C onwards, a loss of allergy protection was already demonstrated at 65 °C. To get a more detailed perspective on changes in immunologically active whey proteins, a heat map solely focusing on these specific whey proteins was created. In this heat map, a relatively clear difference is observed between milk samples heated at temperatures below 65 °C and milk samples heated at temperatures of 65 °C and above (Fig. 8), which corresponds to the loss of allergy protection observed in the murine OVA-induced food allergy model (Fig. 5A).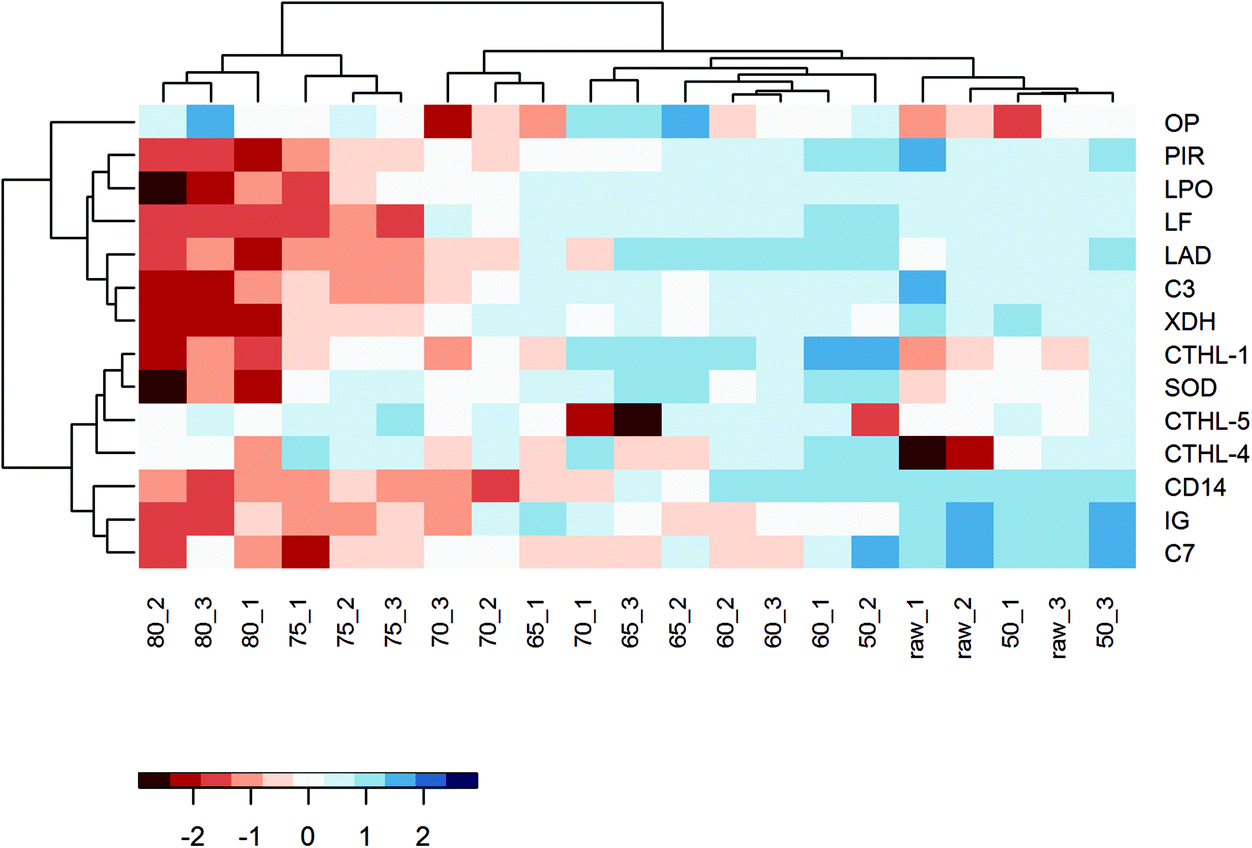 | ||
| Fig. 8 Hierarchical cluster analysis of immunologically active whey proteins demonstrated that the denaturation of these proteins already starts at 65 °C. Protein profile of whey fraction samples based on Z score normalized iBAQ values. Columns reflect individual samples. The number indicates the heating temperature, while the number after the underscore indicates the replicate. Rows reflect immunologically active whey proteins. Hierarchical clustering was performed using complete agglomeration method and a Euclidean distance metric. The color scale reflects the iBAQ value-based Z score. OP, osteopontin; PIR, polymeric immunoglobulin receptor; LPO, lactoperoxidase; LF, lactoferrin; LAD, lactadherin; C3, complement component 3; XDH, xanthine dehydrogenase/oxidase; CTHL-1, cathelicidin-1; SOD, superoxide dismutase; CTHL-5, cathelicidin-5; CTHL-4, cathelicidin-4; CD14, monocyte differentiation antigen CD14; IG, immunoglobulin; C7, complement component 7. | ||
To zoom in on the effects of the various heat treatments on the immunologically active whey proteins, and to get an idea about their concentration, Table 1 was compiled to show the differences in iBAQ intensities for these proteins. Interestingly, complement component 7 (C7) decreased significantly at 60 °C and polymeric immunoglobulin receptor and monocyte differentiation antigen CD14 at 65 °C. For immunoglobulins, denaturation also started already around 60/65 °C, but due to a larger variation between replicates, the reduction only reached significance at 75 °C. Most of the other immunologically active whey proteins only decreased significantly from 75 °C, although they already started to decrease, to varying extents, from lower temperatures. For superoxide dismutase, cathelicidins, and osteopontin, no clear decrease with increasing temperature was observed (Table 1).
| Log10 (iBAQ) | Raw | 50 °C | 60 °C | 65 °C | 70 °C | 75 °C | 80 °C |
|---|---|---|---|---|---|---|---|
| Protein name | |||||||
| *P < 0.05 compared to raw milk as analyzed with Dunnett's multiple comparisons test. Raw, raw cow's milk; 50–80 °C, raw cow's milk heated at the indicated temperature for 30 min. | |||||||
| Complement C7 | 3.86 ± 0.22 | 4.06 ± 0.14 | 2.96 ± 0.30* | 2.95 ± 0.34* | 2.99 ± 0.09* | 2.38 ± 0.58* | 2.38 ± 0.54* |
| Monocyte differentiation antigen CD14 | 5.02 ± 0.08 | 5.07 ± 0.20 | 4.98 ± 0.14 | 3.82 ± 0.69* | 2.50 ± 0.44* | 2.70 ± 0.18* | 2.36 ± 0.28* |
| Polymeric immunoglobulin receptor | 7.14 ± 0.61 | 6.92 ± 0.20 | 6.79 ± 0.11 | 6.03 ± 0.28* | 5.64 ± 0.52* | 4.99 ± 0.25* | 3.96 ± 0.20* |
| Lactadherin | 5.49 ± 0.10 | 5.85 ± 0.15 | 5.97 ± 0.07* | 5.83 ± 0.19 | 4.93 ± 0.15* | 4.62 ± 0.07* | 4.30 ± 0.38* |
| Immunoglobulin | 4.70 ± 0.15 | 4.29 ± 0.63 | 3.35 ± 0.35 | 3.71 ± 0.68 | 3.32 ± 0.99 | 2.54 ± 0.31* | 2.12 ± 0.58* |
| Complement C3 | 5.90 ± 0.70 | 5.68 ± 0.09 | 5.71 ± 0.05 | 5.29 ± 0.36 | 5.03 ± 0.32 | 4.23 ± 0.38* | 3.36 ± 0.74* |
| Lactoperoxidase | 6.49 ± 0.15 | 6.54 ± 0.19 | 6.70 ± 0.08 | 6.61 ± 0.21 | 6.19 ± 0.25 | 4.74 ± 1.08* | 3.49 ± 1.10* |
| Xanthine dehydrogenase/oxidase | 5.40 ± 0.18 | 5.32 ± 0.33 | 5.37 ± 0.05 | 5.22 ± 0.26 | 4.98 ± 0.18 | 4.30 ± 0.22* | 2.77 ± 0.19* |
| Lactoferrin | 6.58 ± 0.02 | 6.61 ± 0.28 | 6.75 ± 0.11 | 6.44 ± 0.31 | 6.03 ± 0.23 | 2.85 ± 0.24* | 2.16 ± 0.33* |
| Superoxide dismutase | 4.28 ± 0.15 | 4.66 ± 0.19 | 4.68 ± 0.20 | 4.87 ± 0.16* | 4.52 ± 0.21 | 4.59 ± 0.18 | 3.47 ± 0.40* |
| Cathelicidin-1 | 4.44 ± 0.13 | 4.90 ± 0.29 | 5.05 ± 0.15* | 4.87 ± 0.30 | 4.70 ± 0.39 | 4.66 ± 0.09* | 4.10 ± 0.26* |
| Cathelicidin-4 | 3.10 ± 0.77 | 4.04 ± 0.30* | 4.09 ± 0.09* | 3.55 ± 0.09 | 3.96 ± 0.46 | 4.12 ± 0.06* | 3.65 ± 0.24 |
| Cathelicidin-5 | 4.49 ± 0.14 | 4.29 ± 0.72 | 4.88 ± 0.07 | 4.08 ± 1.22 | 4.18 ± 0.92 | 4.89 ± 0.13 | 4.60 ± 0.07* |
| Osteopontin | 6.54 ± 0.11 | 6.54 ± 0.25 | 6.61 ± 0.08 | 6.69 ± 0.30 | 6.49 ± 0.34 | 6.65 ± 0.04 | 6.79 ± 0.20* |
Discussion
The present study demonstrates that heat treatment of milk results in a substantial loss of native whey proteins due to denaturation and aggregation processes. A considerable decrease in the amount of native whey proteins was observed from 75 °C and above, but immunologically active whey proteins already started to decrease from 65 °C. Interestingly, the loss of immunologically active whey proteins coincided with the loss of allergy protection observed in a murine OVA-induced food allergy model. In this model, we observed a clear shift in allergy protection from 60 to 65 °C, where milk heated at 65 °C or higher was no longer protective.Raw cow's milk consumption has repeatedly been reported to protect against childhood asthma and allergies,13–16,21,22 which has often been related to the bioactive whey protein fraction of the milk,18,19 although a direct link between individual proteins and this protection has never been demonstrated. The whey protein fraction of raw cow's milk consists of hundreds of proteins and each of these proteins has its own denaturation kinetics.23 Heating milk at different temperatures may therefore result in different native protein profiles. Relating the changes in these native protein profiles to the capacity of the milk to prevent the development of allergic diseases may give an indication of the proteins responsible for the protective effect. The current study therefore used small differences in heating temperature (50, 60, 65, 70, 75, and 80 °C, chosen to be ranging from almost no to almost full whey protein denaturation) and tested the various heat-treated milk samples for their native protein profile and their allergy-protective capacity.
As expected, the number of denatured proteins increased with increased heating intensity. Consequently, the native protein profile differed considerably between the different heat-treated milk samples. The different data analyses of the overall native protein profile (BCA assay, clustered heat map, and PCA) showed a significant difference between milk heated ≥75 °C and milk heated <75 °C, which is in line with our previous results.31 Similar effects were also reported by Brick et al. who demonstrated a decrease in detectable native whey proteins after heating with an intensity higher than pasteurization (72 °C for 20 s).23 According to the BCA assay, a significant decrease in the native whey protein concentration was also observed in milk heated at 70 °C. However, due to a larger variation between replicates, this group was not clustered with milk heated at 75 and 80 °C in the subsequent analyses. When specifically focusing on immunologically active whey proteins, their denaturation already started at a lower temperature. This is in accordance with previous studies, which demonstrated that particularly the immunoactive proteins present in the whey fraction have a high heat sensitivity.27 Although also for these proteins a sharp decrease was observed from 75 °C, a gradual decrease was already visible from 65 °C.
To determine the consequences of the heat-induced reduction in native whey proteins on the allergy-protective effects associated with raw milk, milk samples were tested in a murine OVA-induced food allergy model. As demonstrated before, treating mice with raw milk prior to sensitization and challenge with OVA significantly reduced the acute allergic skin response.22,43 The current study shows that this protective effect lasted up to 60 °C. Interestingly, a loss of allergy protection was observed at heating temperatures of 65 °C and above, thereby coinciding with the denaturation of immunologically active whey proteins. The effects on the acute allergic skin response were not reflected in OVA-IgE levels but did correspond with regulatory Tr1 cell numbers, involved in the induction of oral tolerance to food proteins.42
As mentioned earlier, particularly immunologically active whey proteins were shown to denature from 65 °C onwards. A closer look at these proteins revealed that the concentration of complement C7, monocyte differentiation antigen CD14, and polymeric immunoglobulin receptor decreased significantly from this temperature. Complement C7 is a protein involved in the complement system of the innate immune system and is part of the membrane attack complex. How complement C7 may be involved in the allergy-protective effect of raw cow's milk remains unclear, although a role of the complement pathway in the development of asthma and allergy has been described.44 Monocyte differentiation antigen CD14 is also a molecule of the innate immune system and acts as a receptor and carrier for bacterial endotoxin. Interestingly, CD14 expression was markedly higher in farmers’ children than in non-farmers’ children.45 In addition, polymorphisms in the CD14 gene have been demonstrated to modify the effect of raw cow's milk consumption on allergic diseases.46,47 Polymeric immunoglobulin receptor is an Fc receptor which facilitates the transcytosis of soluble IgA and immune complexes. Breast milk immune complexes are shown to be potent inducers of oral tolerance and prevented asthma development in mice.48 Whether the formation of immune complexes also contributes to the allergy-protective effect of raw cow's milk remains to be elucidated.
The significant decrease in complement C7, CD14, and polymeric immunoglobulin receptor concentrations after heat treatment at 65 °C may partly explain the loss of allergy protection at the same temperature. However, many other immunologically active whey proteins also showed a, non-significant, decrease around 65 °C. Because of the many immunologically active whey proteins present in raw cow's milk, even small changes in each of them could affect the final allergic response. In addition, we have to acknowledge that some proteins like enzymes with a relatively low abundance but a high activity, such as alkaline phosphatase, were not detected with the method used. The wide variety of proteins and the subtle changes in each of them after the different heat treatments makes it hard to pinpoint one unique protein responsible for the allergy-protective effect. Eventually, the synergistic effect of changes in several proteins simultaneously probably underlies the loss of protection.
In addition to the observed loss of protection from 65 °C, this study also demonstrates that raw milk can be heated up to 60 °C (for 30 min) without negative consequences for its allergy-protective capacity. Immunologically active whey proteins were hardly affected by these temperatures and although milk heated at 50 °C did not significantly reduce the acute allergic skin response, the PCA could not distinguish between 50- and 60 °C-treated milk samples. This knowledge can be very relevant for the development of mildly processed milk in which bioactive raw milk components are retained and future studies should investigate whether the observed effects also hold for other allergens. However, heat treatment at these low temperatures is not considered safe and has only been used to gain a better understanding of the immunologically active whey proteins involved in the allergy-protective effects of raw cow's milk.
Besides the loss of immunologically active whey proteins, the formation of protein aggregates can also underlie the loss of allergy protection upon heat treatment. These protein aggregates were reported to have an increased immunogenicity compared to their native counterparts because of a shifted uptake from enterocytes to Peyer's patches.29 Heat-induced protein aggregate formation, through disulphide interchange, was therefore assessed in the differentially heated milk samples. Protein aggregates started to form from 75 °C onwards and might therefore be responsible for the enhanced immune response, demonstrated by increased percentages of Th1 cells, Th2 cells, and DCs, observed in mice treated with milk samples heated at the same temperature. However, since the loss of allergy protection was already demonstrated from 65 °C, the formation of immunogenic protein aggregates is most likely not responsible for this effect.
In conclusion, we demonstrated that the allergy-protective effect of raw cow's milk is lost after heating milk for 30 min at 65 °C or higher. This loss of protection coincided with a reduction in native immunologically active whey proteins. A significant reduction was demonstrated for complement C7, monocyte differentiation antigen CD14, and polymeric immunoglobulin receptor, but many other immunologically active whey proteins also showed a decrease around 65 °C. As, possible immunogenic, aggregates were not yet formed at this temperature, they probably do not play a role in the allergy-protective effect of raw cow's milk. The current study provides a better understanding of the mechanistic relation between heat damage to whey proteins and allergy development, which is essential for the development of microbiologically safe alternatives to raw cow's milk that still retain its protective capacity.
Conflicts of interest
J. G. and B. C. A. M. v. E. are partly employed at Danone Nutricia Research. All other authors report no conflicts of interest.Acknowledgements
This research was financially supported by Danone Nutricia Research, the Sino Dutch Dairy Development Centre (http://www.sdddc.org) and Sino-Dutch Doctoral Program on Sustainable Dairy from China Scholarship Council and the Software AG Foundation Germany.References
- European Academy of Allergy and Clinical Immunology, Global atlas of allergy, 2014, available from: http://www.eaaci.org/GlobalAtlas/GlobalAtlasAllergy.pdf, accessed on: June 2019 Search PubMed.
- W. Eder, M. J. Ege and E. von Mutius, The asthma epidemic, N. Engl. J. Med., 2006, 355, 2226–2235 CrossRef CAS PubMed.
- T. Alfvén, C. Braun-Fahrlander, B. Brunekreef, E. von Mutius, J. Riedler, A. Scheynius, M. van Hage, M. Wickman, M. R. Benz, J. Budde, K. B. Michels, D. Schram, E. Ublagger, M. Waser and G. Pershagen, Allergic diseases and atopic sensitization in children related to farming and anthroposophic lifestyle - The PARSIFAL study, Allergy, 2006, 61, 414–421 CrossRef PubMed.
- C. Braun-Fahrlander, M. Gassner, L. Grize, U. Neu, F. H. Sennhauser, H. S. Varonier, J. C. Vuille and B. Wuthrich, Prevalence of hay fever and allergic sensitization in farmer's children and their peers living in the same rural community. SCARPOL team. Swiss Study on Childhood Allergy and Respiratory Symptoms with Respect to Air Pollution, Clin. Exp. Allergy, 1999, 29, 28–34 CrossRef CAS PubMed.
- M. Kilpelainen, E. O. Terho, H. Helenius and M. Koskenvuo, Farm environment in childhood prevents the development of allergies, Clin. Exp. Allergy, 2000, 30, 201–208 CrossRef CAS PubMed.
- J. Riedler, W. Eder, G. Oberfeld and M. Schreuer, Austrian children living on a farm have less hay fever, asthma and allergic sensitization, Clin. Exp. Allergy, 2000, 30, 194–200 CrossRef CAS PubMed.
- O. S. von Ehrenstein, E. von Mutius, S. Illi, L. Baumann, O. Bohm and R. von Kries, Reduced risk of hay fever and asthma among children of farmers, Clin. Exp. Allergy, 2000, 30, 187–193 CrossRef CAS PubMed.
- P. Ernst and Y. Cormier, Relative scarcity of asthma and atopy among rural adolescents raised on a farm, Am. J. Respir. Crit. Care Med., 2000, 161, 1563–1566 CrossRef CAS PubMed.
- E. von Mutius and D. Vercelli, Farm living: effects on childhood asthma and allergy, Nat. Rev. Immunol., 2010, 10, 861–868 CrossRef CAS PubMed.
- S. T. Remes, K. Iivanainen, H. Koskela and J. Pekkanen, Which factors explain the lower prevalence of atopy amongst farmers’ children?, Clin. Exp. Allergy, 2003, 33, 427–434 CrossRef CAS PubMed.
- M. J. Ege, M. Mayer, A. C. Normand, J. Genuneit, W. O. Cookson, C. Braun-Fahrlander, D. Heederik, R. Piarroux and E. von Mutius, Exposure to environmental microorganisms and childhood asthma, N. Engl. J. Med., 2011, 364, 701–709 CrossRef CAS PubMed.
- J. Riedler, C. Braun-Fahrlander, W. Eder, M. Schreuer, M. Waser, S. Maisch, D. Carr, R. Schierl, D. Nowak and E. von Mutius, Exposure to farming in early life and development of asthma and allergy: a cross-sectional survey, Lancet, 2001, 358, 1129–1133 CrossRef CAS.
- M. J. Ege, R. Frei, C. Bieli, D. Schram-Bijkerk, M. Waser, M. R. Benz, G. Weiss, F. Nyberg, M. van Hage, G. Pershagen, B. Brunekreef, J. Riedler, R. Lauener, C. Braun-Fahrlander and E. von Mutius, Not all farming environments protect against the development of asthma and wheeze in children, J. Allergy Clin. Immunol., 2007, 119, 1140–1147 CrossRef PubMed.
- M. R. Perkin and D. P. Strachan, Which aspects of the farming lifestyle explain the inverse association with childhood allergy?, J. Allergy Clin. Immunol., 2006, 117, 1374–1381 CrossRef PubMed.
- G. Loss, S. Apprich, M. Waser, W. Kneifel, J. Genuneit, G. Buchele, J. Weber, B. Sozanska, H. Danielewicz, E. Horak, R. J. van Neerven, D. Heederik, P. C. Lorenzen, E. von Mutius and C. Braun-Fahrlander, The protective effect of farm milk consumption on childhood asthma and atopy: the GABRIELA study, J. Allergy Clin. Immunol., 2011, 128, 766–773 CrossRef PubMed.
- T. Brick, Y. Schober, C. Bocking, J. Pekkanen, J. Genuneit, G. Loss, J. C. Dalphin, J. Riedler, R. Lauener, W. A. Nockher, H. Renz, O. Vaarala, C. Braun-Fahrlander, E. von Mutius, M. J. Ege and P. I. Pfefferle, Omega-3 fatty acids contribute to the asthma-protective effect of unprocessed cow's milk, J. Allergy Clin. Immunol., 2016, 137, 1699–1706 CrossRef CAS PubMed.
- Committee on Infectious Diseases & Committee on Nutrition & American Academy of Pediatrics, Consumption of raw or unpasteurized milk and milk products by pregnant women and children, Pediatrics, 2014, 133, 175–179 Search PubMed.
- R. J. van Neerven, E. F. Knol, J. M. Heck and H. F. Savelkoul, Which factors in raw cow's milk contribute to protection against allergies?, J. Allergy Clin. Immunol., 2012, 130, 853–858 CrossRef CAS PubMed.
- S. Abbring, G. Hols, J. Garssen and B. C. A. M. van Esch, Raw cow's milk consumption and allergic diseases - The potential role of bioactive whey proteins, Eur. J. Pharmacol., 2019, 843, 55–65 CrossRef CAS PubMed.
- C. Braun-Fahrländer and E. von Mutius, Can farm milk consumption prevent allergic diseases?, Clin. Exp. Allergy, 2011, 41, 29–35 CrossRef PubMed.
- S. Abbring, K. A. T. Verheijden, M. A. P. Diks, A. Leusink-Muis, G. Hols, T. Baars, J. Garssen and B. C. A. M. van Esch, Raw cow's milk prevents the development of airway inflammation in a murine house dust mite-induced asthma model, Front. Immunol., 2017, 8, 1045 CrossRef PubMed.
- S. Abbring, J. T. Ryan, M. A. P. Diks, G. Hols, J. Garssen and B. C. A. M. van Esch, Suppression of food allergic symptoms by raw cow's milk in mice is retained after skimming but abolished after heating the milk - A promising contribution of alkaline phosphatase, Nutrients, 2019, 11, 1499 CrossRef CAS PubMed.
- T. Brick, M. Ege, S. Boeren, A. Bock, E. von Mutius, J. Vervoort and K. Hettinga, Effect of processing intensity on immunologically active bovine milk serum proteins, Nutrients, 2017, 9, 963 CrossRef PubMed.
- E. Li-Chan, A. Kummer, J. N. Losso, D. D. Kitts and S. Nakai, Stability of bovine immunoglobulins to thermal-treatment and processing, Food Res. Int., 1995, 28, 9–16 CrossRef CAS.
- W. L. Chen, M. T. Hwang, C. Y. Liau, J. C. Ho, K. C. Hong and S. J. T. Mao, Beta-Lactoglobulin is a thermal marker in processed milk as studied by electrophoresis and circular dichroic spectra, J. Dairy Sci., 2005, 88, 1618–1630 CrossRef CAS PubMed.
- M. K. McGuffey, K. L. Epting, R. M. Kelly and E. A. Foegeding, Denaturation and aggregation of three alpha-lactalbumin preparations at neutral pH, J. Agric. Food Chem., 2005, 53, 3182–3190 CrossRef CAS PubMed.
- L. N. Zhang, S. Boeren, M. Smits, T. van Hooijdonk, J. Vervoort and K. Hettinga, Proteomic study on the stability of proteins in bovine, camel, and caprine milk sera after processing, Food Res. Int., 2016, 82, 104–111 CrossRef CAS.
- M. Beaulieu, Y. Pouliot and M. Pouliot, Thermal aggregation of whey proteins in model solutions as affected by casein/whey protein ratios, J. Food Sci., 1999, 64, 776–780 CrossRef CAS.
- F. Roth-Walter, M. C. Berin, P. Arnaboldi, C. R. Escalante, S. Dahan, J. Rauch, E. Jensen-Jarolim and L. Mayer, Pasteurization of milk proteins promotes allergic sensitization by enhancing uptake through Peyer's patches, Allergy, 2008, 63, 882–890 CrossRef CAS PubMed.
- A. J. Law and J. Leaver, Effect of pH on the thermal denaturation of whey proteins in milk, J. Agric. Food Chem., 2000, 48, 672–679 CrossRef CAS.
- L. Xiong, C. Li, S. Boeren, J. Vervoort and K. Hettinga, Effect of heat treatment on bacteriostatic activity and protein profile of bovine whey proteins, Food Res. Int., 2020, 127, 108688 CrossRef.
- J. R. Wiśniewski, A. Zougman, N. Nagaraj and M. Mann, Universal sample preparation method for proteome analysis, Nat. Methods, 2009, 6, 359 CrossRef PubMed.
- K. Hettinga, H. Van Valenberg, S. De Vries, S. Boeren, T. Van Hooijdonk, J. van Arendonk and J. Vervoort, The host defense proteome of human and bovine milk, PLoS One, 2011, 6, e19433 CrossRef CAS PubMed.
- J. Lu, S. Boeren, S. De Vries, H. Van Valenberg, J. Vervoort and K. Hettinga, Filter-aided sample preparation with dimethyl labeling to identify and quantify milk fat globule membrane proteins, J. Proteomics, 2011, 75, 34–43 CrossRef CAS PubMed.
- L. Zhang, S. Boeren, J. A. Hageman, T. van Hooijdonk, J. Vervoort and K. Hettinga, Bovine milk proteome in the first 9 days: protein interactions in maturation of the immune and digestive system of the newborn, PLoS One, 2015, 10, e0116710 CrossRef PubMed.
- L. Zhang, S. Boeren, J. A. Hageman, T. van Hooijdonk, J. Vervoort and K. Hettinga, Perspective on calf and mammary gland development through changes in the bovine milk proteome over a complete lactation, J. Dairy Sci., 2015, 98, 5362–5373 CrossRef CAS PubMed.
- J. Cox and M. Mann, MaxQuant enables high peptide identification rates, individualized p.p.b.-range mass accuracies and proteome-wide protein quantification, Nat. Biotechnol., 2008, 26, 1367 CrossRef CAS PubMed.
- C. UniProt, Universal protein resource (Uniprot), 2013, available from: http://www.uniprot.org/, accessed on: March 2019 Search PubMed.
- B. Schwanhausser, D. Busse, N. Li, G. Dittmar, J. Schuchhardt, J. Wolf, W. Chen and M. Selbach, Global quantification of mammalian gene expression control, Nature, 2011, 473, 337–342 CrossRef PubMed.
- S. Tyanova, T. Temu, P. Sinitcyn, A. Carlson, M. Y. Hein, T. Geiger, M. Mann and J. Cox, The Perseus computational platform for comprehensive analysis of (prote)omics data, Nat. Methods, 2016, 13, 731–740 CrossRef CAS PubMed.
- The R Development Core Team, R: a language and environment for statistical computing, 2013, available from: https://www.R-project.org/, accessed on: March 2019 Search PubMed.
- O. Pabst and A. M. Mowat, Oral tolerance to food protein, Mucosal Immunol., 2012, 5, 232–239 CrossRef CAS.
- S. Abbring, J. Wolf, V. Ayechu-Muruzabal, M. A. P. Diks, B. Alashkar Alhamwe, F. Alhamdan, H. Harb, H. Renz, H. Garn, J. Garssen, D. P. Potaczek and B. C. A. M. van Esch, Raw cow's milk reduces allergic symptoms in a murine model for food allergy - A potential role for epigenetic modifications, Nutrients, 2019, 11, 1721 CrossRef CAS PubMed.
- N. P. Gerard and C. Gerard, Complement in allergy and asthma, Curr. Opin. Immunol., 2002, 14, 705–708 CrossRef CAS.
- R. P. Lauener, T. Birchler, J. Adamski, C. Braun-Fahrlander, A. Bufe, U. Herz, E. von Mutius, D. Nowak, J. Riedler, M. Waser and F. H. Sennhauser, Expression of CD14 and Toll-like receptor 2 in farmers’ and non-farmers’ children, Lancet, 2002, 360, 465–466 CrossRef CAS.
- C. Bieli, W. Eder, R. Frei, C. Braun-Fahrlander, W. Klimecki, M. Waser, J. Riedler, E. von Mutius, A. Scheynius, G. Pershagen, G. Doekes, R. Lauener and F. D. Martinez, A polymorphism in CD14 modifies the effect of farm milk consumption on allergic diseases and CD14 gene expression, J. Allergy Clin. Immunol., 2007, 120, 1308–1315 CrossRef CAS PubMed.
- M. J. Ege, D. P. Strachan, W. O. Cookson, M. F. Moffatt, I. Gut, M. Lathrop, M. Kabesch, J. Genuneit, G. Buchele, B. Sozanska, A. Boznanski, P. Cullinan, E. Horak, C. Bieli, C. Braun-Fahrlander, D. Heederik and E. von Mutius, Gene-environment interaction for childhood asthma and exposure to farming in Central Europe, J. Allergy Clin. Immunol., 2011, 127, 138–144 CrossRef PubMed.
- E. Mosconi, A. Rekima, B. Seitz-Polski, A. Kanda, S. Fleury, E. Tissandie, R. Monteiro, D. D. Dombrowicz, V. Julia, N. Glaichenhaus and V. Verhasselt, Breast milk immune complexes are potent inducers of oral tolerance in neonates and prevent asthma development, Mucosal Immunol., 2010, 3, 461–474 CrossRef CAS PubMed.
Footnotes |
| † These authors have contributed equally to this work. |
| ‡ Shared last author. |
| This journal is © The Royal Society of Chemistry 2020 |