
 Open Access Article
 This Open Access Article is licensed under a Creative Commons Attribution-Non Commercial 3.0 Unported Licence
Roasting carob flour decreases the capacity to bind glycoconjugates of bile acids
Phylyne
van Rijs
and
Vincenzo
Fogliano
 *
*
Food quality and design group, AFSG department Wageningen University and Research, Wageningen, The Netherland. E-mail: vincenzo.fogliano@wur.nl
First published on 3rd July 2020
Abstract
Carob is the fruit obtained from Ceratonia siliqua L. and it is a source of bioactive compounds that have been linked to several health promoting effects, including lowering blood cholesterol concentration. The objective of this study was to connect the physicochemical changes of carob flour occurring during roasting with its capacity to bind glycoconjugates of bile acids. Carob flour samples were roasted for different times at 150 °C and chemically characterized by measuring the concentrations of tannins and polyphenols. Data showed that carob flour binds high amounts of bile acids: 732.6 μmol of bound bile acid per g of carob flour which is comparable to the 836.2 μmol per g bound by cholestyramine, a known cholesterol lowering drug. The carob flour ability to bind cholesterol decreases up to 40% during roasting. Data suggested that tannins and insoluble components play a major role in binding bile salts, as a result of hydrophobic interactions.
Introduction
The carob pod, also known as algarroba, locust pod and St. John's bread, is the fruit obtained from a leguminous evergreen tree (Ceratonia siliqua L.). Carob pods are widely cultivated in the Mediterranean area, including Spain, Italy, Portugal, Greece and Morocco as principal producing countries.1 Its production is estimated at approximately 310![[thin space (1/6-em)]](https://www.rsc.org/images/entities/char_2009.gif) 000 tons per year.2 The carob pod consists of two major parts: approximately 90% pulp and 10% seeds (see Fig. 1). The seeds contribute to more than 60% of the pod market price and are used for the production of locust bean gum, which is obtained from the endosperm.3 Locust bean gum forms a viscous solution at relatively low concentration and is added as a thickener or stabilizer in many food products. The carob pulp has lower value and, up to now, is mainly used for animal feed and the production of sugar syrup.4,5 Recently some papers try to valorize carob pulp as source of many valuable components such as dietary fiber, polyphenols, minerals, cyclitols and contains low amounts of fat.6–10 Consumption of carob pulp was also related to several health promoting effects: it exhibits high antioxidant activity, improves glucose tolerance and attenuates cholesterol levels.11–16 The chemical composition of the pulp strongly depends on the cultivar, origin and harvesting time.3,17 Due to the high free sugar content (>48% of which more than 65% sucrose), the pulp is gaining popularity as a natural sweetener in foods, with a flavor profile and appearance similar to cocoa powder.18 In this vein, carob pulp is used as an alternative ingredient in some chocolate products leveraging on the peculiarity that it does not contain psychostimulants such as caffeine and the obromine.
000 tons per year.2 The carob pod consists of two major parts: approximately 90% pulp and 10% seeds (see Fig. 1). The seeds contribute to more than 60% of the pod market price and are used for the production of locust bean gum, which is obtained from the endosperm.3 Locust bean gum forms a viscous solution at relatively low concentration and is added as a thickener or stabilizer in many food products. The carob pulp has lower value and, up to now, is mainly used for animal feed and the production of sugar syrup.4,5 Recently some papers try to valorize carob pulp as source of many valuable components such as dietary fiber, polyphenols, minerals, cyclitols and contains low amounts of fat.6–10 Consumption of carob pulp was also related to several health promoting effects: it exhibits high antioxidant activity, improves glucose tolerance and attenuates cholesterol levels.11–16 The chemical composition of the pulp strongly depends on the cultivar, origin and harvesting time.3,17 Due to the high free sugar content (>48% of which more than 65% sucrose), the pulp is gaining popularity as a natural sweetener in foods, with a flavor profile and appearance similar to cocoa powder.18 In this vein, carob pulp is used as an alternative ingredient in some chocolate products leveraging on the peculiarity that it does not contain psychostimulants such as caffeine and the obromine.
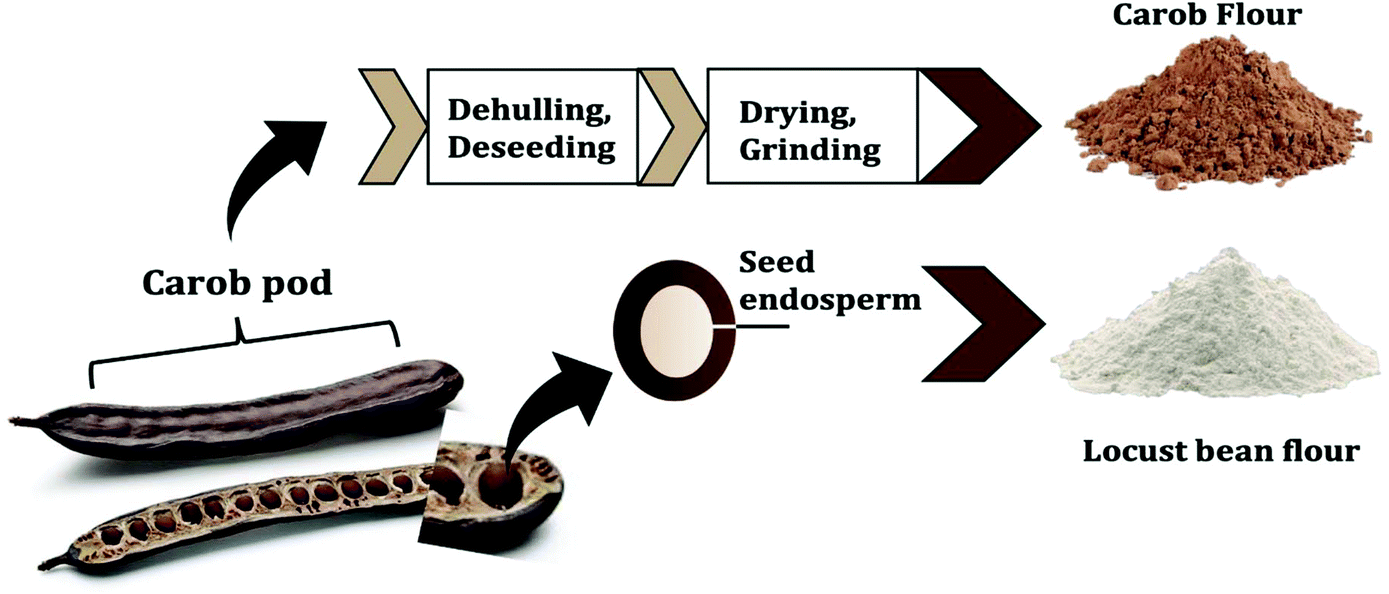 | ||
| Fig. 1 The different parts of carob pods and their respective production into carob and locust bean flour. | ||
After dehulling and deseeding, the pulp is dried in ventilated ovens and mechanically milled to obtain commercial carob flour (see Fig. 1). Optional processing steps include further thermal treatment of the carob flour (e.g. roasting) to improve flavour and wettability. Thermal treatment may have major effects on the techno functional properties of the food products as a result of the Maillard reaction (MR), caramelization reactions and thermal degradation of polyphenols.19–21 The MR can be used to design ingredients having specific technological functionalities or to target some health function.22 An interesting health function is the capacity of some food components to reduce blood cholesterol absorption by interfering with the bile acids’ enterohepatic cycle. Studying the capacity of carob flour to bind bile acids is physiologically relevant, as high amounts of adsorbed bile acids in vitro are related to a decrease in LDL cholesterol in vivo.15,23
Dongowski, (2007)24 reported bile acid absorption by dietary fiber-rich preparations, including carob fiber. This paper does not specify which carob flour component is responsible for bile acid absorption; however, considering its composition the role of insoluble tannins can be hypothesized. Up to now it is also not yet investigated which phenolic compounds may influence bile acid binding and which are the potential mechanisms. The physical absorption of steroidal moiety (like the one of bile acids) on the hydrophobic region of condensed polyphenol can be one of the possibilities.25
The objective of this study was to connect changes in physicochemical properties of carob flour during roasting with its capacity to bind glycoconjugates of bile acids in vitro. Changes in physicochemical properties during roasting were investigated by measuring the difference in solubility, color, viscosity, formation of 5-hydroxymethylfurfural (HMF), total polyphenol and tannin content. In addition, changes in the fraction of bound and free polyphenols were examined.
Materials and methods
Material
Carob flour, obtained from BioFertil (C. da Renna, Itali). Standards of phenolic compounds were purchased from Sigma Aldrich (Steinheim, Germany): gallic acid (G-7384) and 5-(hydroxymethyl)furfural (H-40806). Cholestyramine resin and glychodeoxycholic acid (GDCA) were purchased from Sigma, St Louis, MO, USA. The Sigma bile acid assay kit was used to analyze the concentration of free bile acids.Roasting process
Carob flour was roasted in a pre-heated oven at five different time intervals: five grams of powder were placed in an aluminium tray and roasted for 0, 5, 10, 30 and 60 minutes at 150 °C.Color evaluation of roasted carob flour
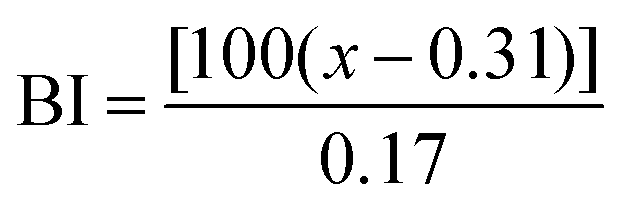
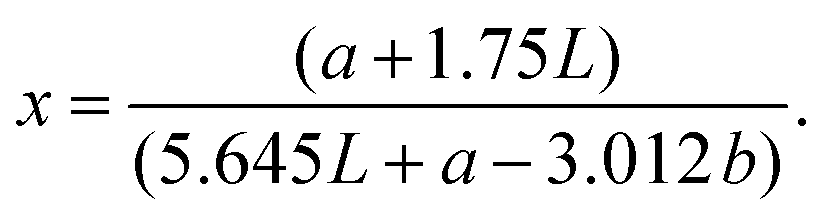
Reflectance measurements were performed with a Colorflex EZ (Elscolab, Netherlands). The instrument was calibrated with a supplied white standard traceable to the National Bureau of Standard's perfect white diffuser. CIELAB parameters were calculated for the CIE illuminant D65 and 10° standard observer conditions. Parameters used were L* (lightness), a* (from green to red), b* (from blue to yellow). Universal software 4.1 was used for analysis. All samples were measured in triplicate. To determine whether the flours were roasted homogenously, standard deviations were calculated and the significance of the differences of the means were determined for P < 0.05 using analysis of variance one-way (ANOVA). The browning index of each sample was also calculated to estimate the color change during roasting, as performed by Medeni, 2001:26where
Effect of roasting on the solubility of carob flour
For best comparison with the quantification of bound bile acids, the same extraction solvent was used to quantify the insoluble content; carob flour was mixed with a buffer solution (0.1 M phosphate buffer at pH 7.0) to obtain a 20 mg mL−1 suspension. The suspension was extracted at 37 °C for 15 minutes. Subsequently, the soluble fraction was separated from the insoluble moiety by centrifuging for 6.30 minutes 4700g. Procedure was repeated until a clear solution was obtained. Subsequently, the insoluble fraction was dried at 85 °C for 5 h. The difference in weight before and after extraction was recorded and the procedure was performed in duplicate.Determination of changes in viscosity
The rheological behavior was measured by applying an in-house developed method using a rotational rheometer Physica MCR 501 (Anton Paar, Austria) with a titanium double gap concentric cylinder DG26.7 geometry. The geometry has an outer cylinder with internal and external radius of 11.910 mm and 13.801 mm, inner cylinder with an internal and external radius of 12.329 mm and 13.335 mm, and an effective bob length of 40 mm. This geometry measures differences already at a very low viscosity and was therefore most suitable. Samples were allowed to equilibrate at 37 °C for 3 minutes before measurements. A temperature of 37 °C was used to simulate viscosity at body T. A constant shear rate of 20 s−1 was applied and viscosities were measured for 0.1, 0.5 and 1.0% w/w of low (0 min), medium (30 min) and high (60 min) roasted carob flour. A comparison was made with Locust bean meal, obtained from NatuurlijkNatuurlijk (Ede, Netherlands). Locust bean meal (from the seeds) was used as comparing material to the carob flour. We wanted to check if viscosity could also influence bile acid binding. With this test, it was found that viscosity of carob flour does not play a role in bile acid binding.Quantification of the amount of free and protein-bound HMF
For quantification of free and protein-bound 5-hydroxymethylfurfural (HMF), the same method as performed by Fiore et al., 201227 was used according to the quantification of free and bound phenolic compounds (as described below). In short, carob flour was extracted using acidified methanol in a 1:10 solid to liquid ratio (g mL−1) and analyzed with HPLC-UV. Protein-bound HMF was analyzed after 4 h alkaline hydrolysis (2 M NaOH:methanol 50:50 v/v).
Spectrophotometric quantification of total polyphenols
Carob flour was extracted with acidified methanol (trifluoracetic acid, pH 2.5) to prevent fast oxidation of oxidative sensitive phenolic compounds. A liquid to solid ratio (mL g−1) of 10:1 was used. The mixture was extracted using ultrasound-assisted extraction (UAE) at 280 W with an extraction temperature of 30 °C for 30 minutes. Subsequently, the mixture was centrifuged at 15133g for 5 minutes. The total polyphenol content (TPC) of extracts were determined according to the Folin–Ciocalteu colorimetric method. A calibration curve was obtained using gallic acid in a concentration range of 31.25–1000 μg mL−1. Results were expressed as mg per g of gallic acid equivalents. Measurements of sample extracts were performed in duplicate.
Estimation of total hydrolysable tannin content
The total hydrolysable tannin content (TTC) (gallo- and ellagitannins) was determined after a reaction with potassium iodide, as reported by Hartzfeld, Forkner, Hunter, & Hagerman, (2002)28 with some modifications. Carob flour was mixed with 50/50 2 M NaOH/methanol. A solid to liquid ratio (g mL−1) of 1:10 was used, under strict oxygen free conditions by removing air with nitrogen preliminary to hydrolysis. After 4 h all samples were brought to a pH of 5.5 ± 0.1 with 2 M HCl and 3 M acetate buffer. Subsequently, samples were allowed to react 50 min with potassium iodide at 30 °C. A calibration curve was obtained using tannic acid in a concentration range of 10–100 μg mL−1. The absorbance was recorded at 525 nm and results were expressed as tannic acid equivalents (TAE). Measurements of sample extracts were performed in duplicate.
Quantification of the amount of free and bound phenolic compounds by HPLC
Since the HPLC data was compared to the data obtained from the spectrophotometric assays, the same extraction solvent was used; carob flour was extracted with acidified methanol (trifluoracetic acid, pH 2.5) using ultrasound-assisted extraction (UAE) at 280 W with a temperature of 30 °C for 30 minutes. A solid to liquid ratio of 1:10 (g mL−1) was used. The extract was collected in vials after filtration with 25 μm PTFE membranes and polyphenols were measured by HPLC-UV (Thermo Scientific Dionex Ultimate 3000 model, Ultimate 3000 pump and Diode 3000 Array Detection). The column used was a Varian Polaris C18A, 150 × 4.6 mm (Phenomenex, UK). Column temperature was maintained at 30 °C. Sample injection was 20 μL and elution was performed at a flowrate of 1 mL min−1. For the mobile phase a mixture of water and trifluoracetic acid (TFA) at a pH of 2.5 was used as a modifier to prevent ionization of phenolic groups (A) and acetonitrile (B). The samples were eluted by the following gradient: 100% A as initial conditions with a linear gradient to 42% B after 20 minutes. 48% A and 42% B were maintained from 20–25 minutes. Detection was performed at 290, 330, 350 and 530 nm. Standards of gallic acid and HMF were prepared as stock solutions with a concentration between 5–200 and 0.1–20 μg mL−1 respectively. Pyrogallol was identified as a main phenolic compound in carob flour, as already reported by previous authors.2,6,13
After the extraction of soluble phenolic compounds, the pellet was rinsed with methanol to eliminate residues and dried under nitrogen gas. After that the pellet was hydrolyzed with 2 M NaOH and methanol (50:50 v/v) under nitrogen for 4 h. After alkaline hydrolysis, solutions were neutralized with 2 M HCl and 1 M phosphate buffer at pH 7. The mixture was centrifuged at 20600g for 10 minutes. The extract was collected in vials after filtration with 25 μm PTFE membranes and analyzed by HPLC-UV as described above.
Carob flour bile acid binding capacity
The binding capacity of carob flour was determined according to the kit manufacturer procedure.29 A buffer solution (0.1 M phosphate buffer at pH 7.0 or 0.1 M acetate buffer pH 5.5) containing 2 mM glycodeoxycholic acid (GDCA) was added to carob flour and cholestyramine (positive control) to obtain a 5 mg mL−1 suspension. Suspensions were incubated at 37 °C for 2 h under shaking. After incubation, the samples were centrifuged at 10500g for 5 minutes. Three times 40 μL of sample solution was transferred to new tubes and solutions were diluted to be in a range of 2–150 μM bile acid concentration. A calibration curve was made using a linear range of 10, 20, 40, 80 and 100 μM GDCA solutions. All of the above solutions were prepared in ultrapure water.
Concentrations of GDCA were measured using the Sigma bile acid assay kit. All samples were performed at least in duplicate. The fluorescence intensity was measured at λex = 530 nm/λem = 585 nm. Black flat bottom multi well plates with a clear bottom were used for analysis. The calibration curve was used to obtain the conversion factor of GDCA.
The concentration of unbound bile acids of a sample was measured as:

Extraction of untreated carob flour (0 minutes of roasting) was performed using ultrapure water. Fractions were separated by centrifuging for 10 minutes at 4700g. The pellet was rinsed until the liquid fraction became clear. The pellet (IC) and liquid fraction (SC) were both freeze dried (Christ Alpha 2–4 LD plus) and analyzed for the capacity to bind GDCA separately.
Statistics
Measurements were performed at least in duplicate. Results were expressed as mean values ± SD. One-way analysis of variance (ANOVA) was applied to determine significant differences with at least P < 0.05. Tukey's test was conducted to determine significant differences between all possible pairs of means.Results and discussion
Physicochemical characterization of roasted carob flour
| Roasting time (min) | L* | a | b | BI |
|---|---|---|---|---|
| 0 | 55.23 ± 0.06 | 11.35 ± 0.02 | 26.08 ± 0.05 | 76.89 ± 0.25 |
| 5 | 47.79 ± 0.05 | 12.51 ± 0.03 | 27.13 ± 0.10 | 99.02 ± 0.54 |
| 10 | 40.98 ± 0.04 | 12.87 ± 0.04 | 25.12 ± 0.09 | 112.26 ± 0.63 |
| 30 | 34.08 ± 0.03 | 11.31 ± 0.04 | 20.03 ± 0.03 | 108.17 ± 0.33 |
| 60 | 26.32 ± 0.03 | 9.11 ± 0.07 | 13.94 ± 0,03 | 97.55 ± 0.26 |
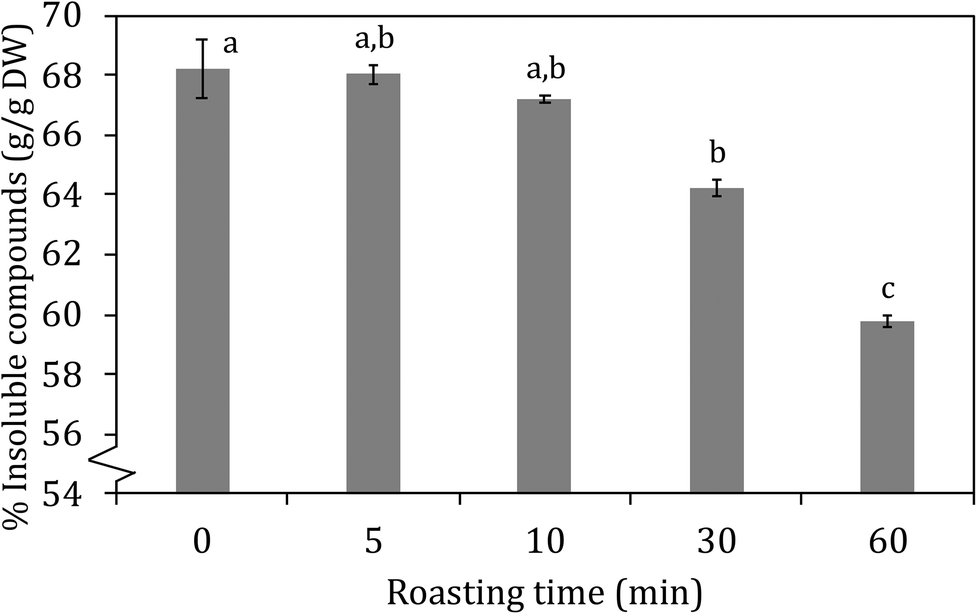 | ||
| Fig. 2 insoluble compounds (% w/w) in carob flour as a function of roasting time at 150 °C. Different letters indicate significant differences (p < 0.05). | ||
| TTC | TIC | TGA | FGA | |
|---|---|---|---|---|
| TTC | 1 | |||
| TIC | 0.9872 | 1 | ||
| TGA | 0.9845 | 0.9998 | 1 | |
| FGA | −0.9363 | −0.9734 | −0.9768 | 1 |
 | ||
| Fig. 3 Concentration of total, free and protein-bound 5-HMF as a function of roasting time. Different letters in the same series indicate significant differences (p < 0.05). | ||
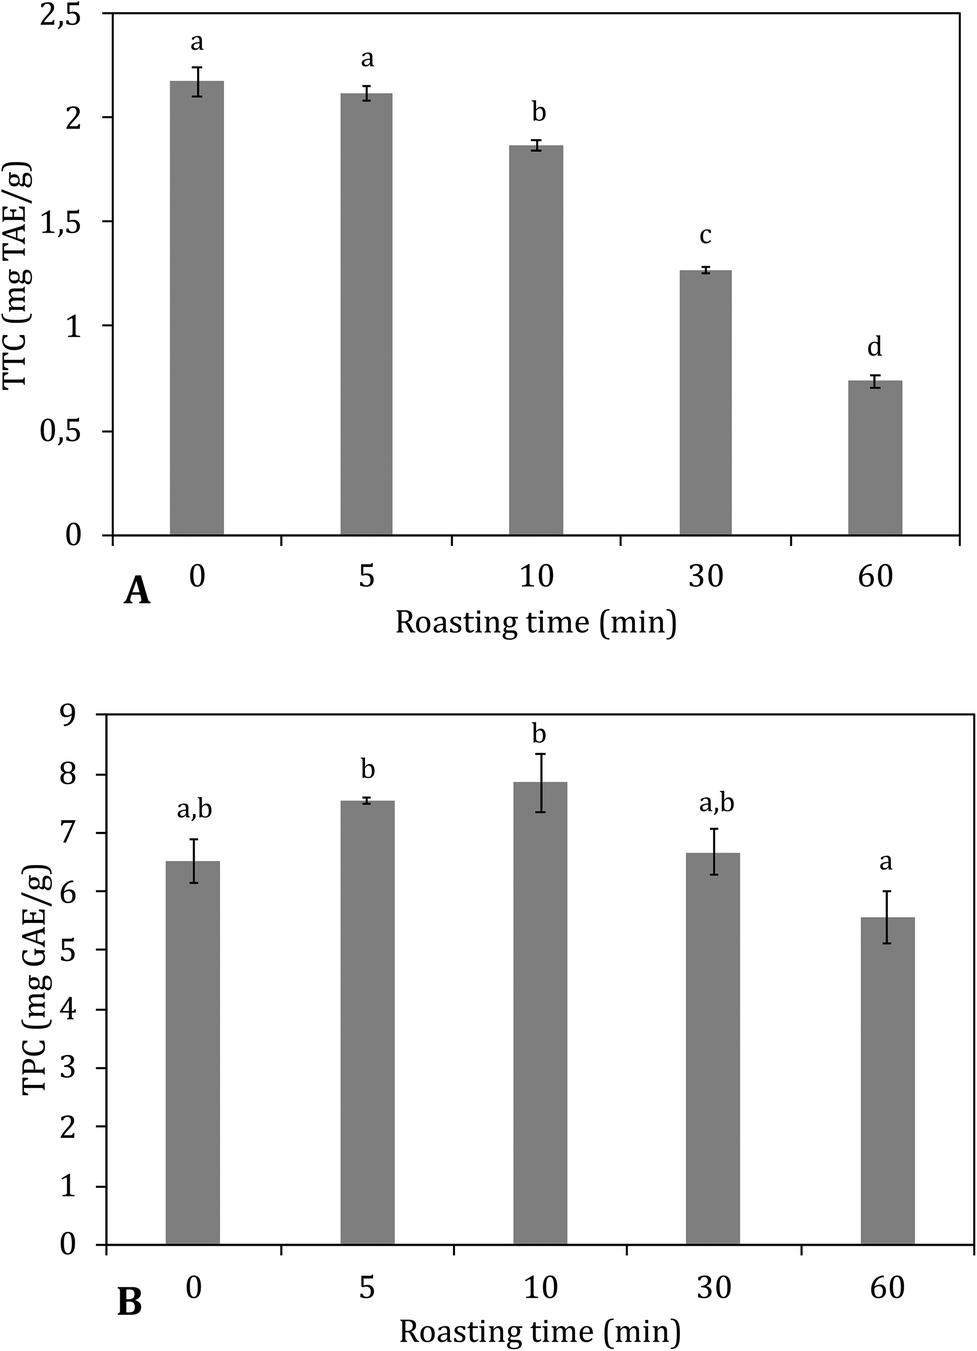 | ||
| Fig. 4 Changes in the total hydrolysable tannin content (A) and total phenolic content (B) of carob flour obtained after roasting at 150 °C. Different letters indicate significant differences (p < 0.05). | ||
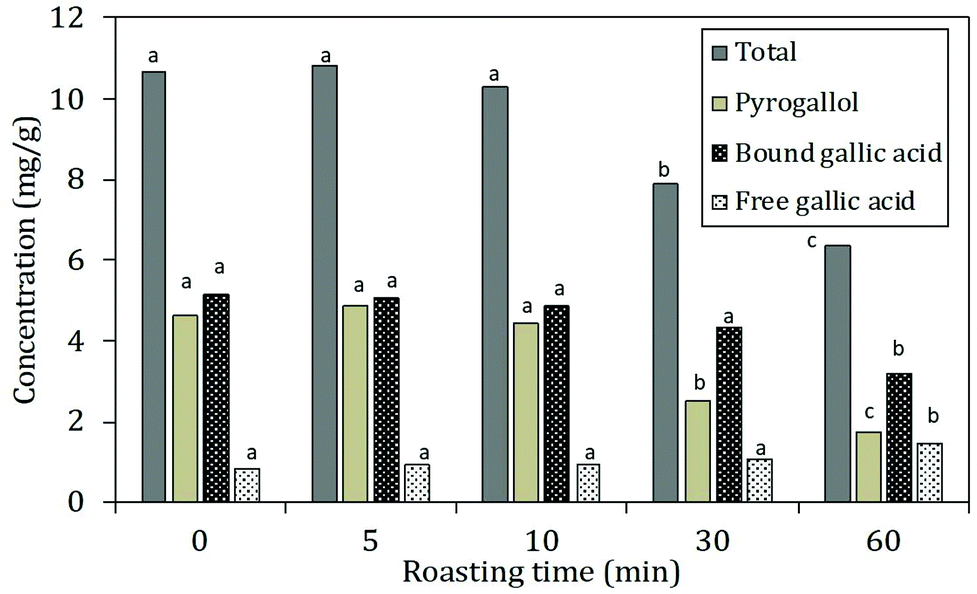 | ||
| Fig. 5 Phenolic content obtained after ultrasonic extraction with acidified methanol (pH = 2.5). The total, pyrogallol, bound and free gallic acid content were expressed as mg g−1 of carob flour as a function of roasting. Different letters in the same series indicate significant differences (p < 0.05). | ||
The decreases in total hydrolysable tannins (Fig. 4B) together with the shift of bound towards free gallic acid (Fig. 5) indicated that a thermally induced degradation of gallo- and ellagitannins happened in the carob flour. The initial increase in TPC after extraction with acidified methanol could be explained by (i) degradation of insoluble and bound phenolics (e.g. tannins and lignin as seen in grape seed21,44) during roasting led to the formation of more soluble products, free phenolics and derivatives that were detected by this assay, in line with TTC and bound/free gallic acid. (ii) Formation of MRP's with a phenolic type of structure induced roasting. The TPC measured by the Folin–Ciocalteu method lacks specificity and detects all reducing compounds. The MR in sugar-rich environment favour the formation of reductones, a class of MRPs with a general reducing capacity,45 which are likely to be detected by the reagent used.
Similar findings were already observed by Şahin et al., 2009,32 who showed roasting led to increased TPC and a positive correlation between BI and TPC. Papagiannopoulos et al., 20049 not only reported an increase in TPC for roasted carob products compared to raw carob kibbles, but also a decrease in the amount of hydrolysable tannins that paralleled an increase in free gallic acid. Finally Tomaz et al., 201946 reported a decrease in the tannin content and an increase in the gallic acid concentration with increased processing.
Next to free and bound gallic acid, also pyrogallol was identified by HPLC analysis after extraction of the carob flour samples. The amount of pyrogallol slightly increased at 5 min of roasting and decreased subsequently. The increase in pyrogallol at the onset of roasting is the consequence of thermal decarboxylation of free gallic acid.47 The total phenolic content decreased after 5 minutes of roasting when decarboxylation reactions ultimately led to the degradation of gallic acid and pyrogallol. These results were in line with the trend of TPC reported in Fig. 4: after 10 minutes of roasting, where the decrease could be explained by the thermal degradation of polyphenols due to the decarboxylation reactions.48 Moreover, the incorporation of phenolic compounds/phenolic type of MRP's in melanoidins49 should be considered.
Carob flour binding to bile acids glycoconjugates
In Fig. 6 the amount of glycodeoxycholic acid (GDCA) bound to the carob powder is shown in comparison to that of cholestyramine, a resin which is a known binder of bile acids and it is used as cholesterol-lowering drug. Carob flour showed a good ability to bind bile acids glycoconjugates. Unroasted carob flour bound 92% of GDCA compared to cholestyramine. Increased roasting resulted in significantly (p < 0.05) decreased bile acid binding; from 92 to 81, 79, 67 and 55% after 5, 10, 30, and 60 minutes of roasting, respectively. Decreasing from physiological pH (pH = 7), to pH = 5.5 resulted in an increase in bile acid binding which fail to reach statistical significance (see Fig. 6, Panel B). Bile acids were mainly bound by the insoluble compounds (IC) compared to the soluble compounds (SC) being the latter almost negligible: as shown in Table 3 there is a high correlation between the total bound bile acids (TBBA), tannins (TTC) and insoluble compounds (TIC) as a function of roasting. Relevant factors contributing to the high GDCA binding capacity can be (i) tannins and insoluble compounds in general, which have a large impact on the capacity to bind bile salts, (ii) minerals and (iii) other components that may be involved in the stabilization of binding bile acids such as melanoidins or cellulose. Carob fiber treatment was able to decrease total and LDL cholesterol in hypercholesterolemic patients.23 Minerals in carob flour could play an important role in enhancing the binding of bile salts, especially as carob flour is rich in calcium and iron.6,17,50 Other components that could have supported the adsorption of bile acids were cellulose and melanoidins. Ragot, Russell, & Schneeman, 199251 reported already that melanoidins from several heated protein–glucose solutions could interact with GDCA. It was observed that especially high molecular weight melanoidins interacted with bile acids. This is in line with data from tannins; especially HMW insoluble tannins are able to interact with bile acids. Finally cellulose could have contributed to support of binding bile acids, although actual values on the capacity to bind bile acids were low.52,53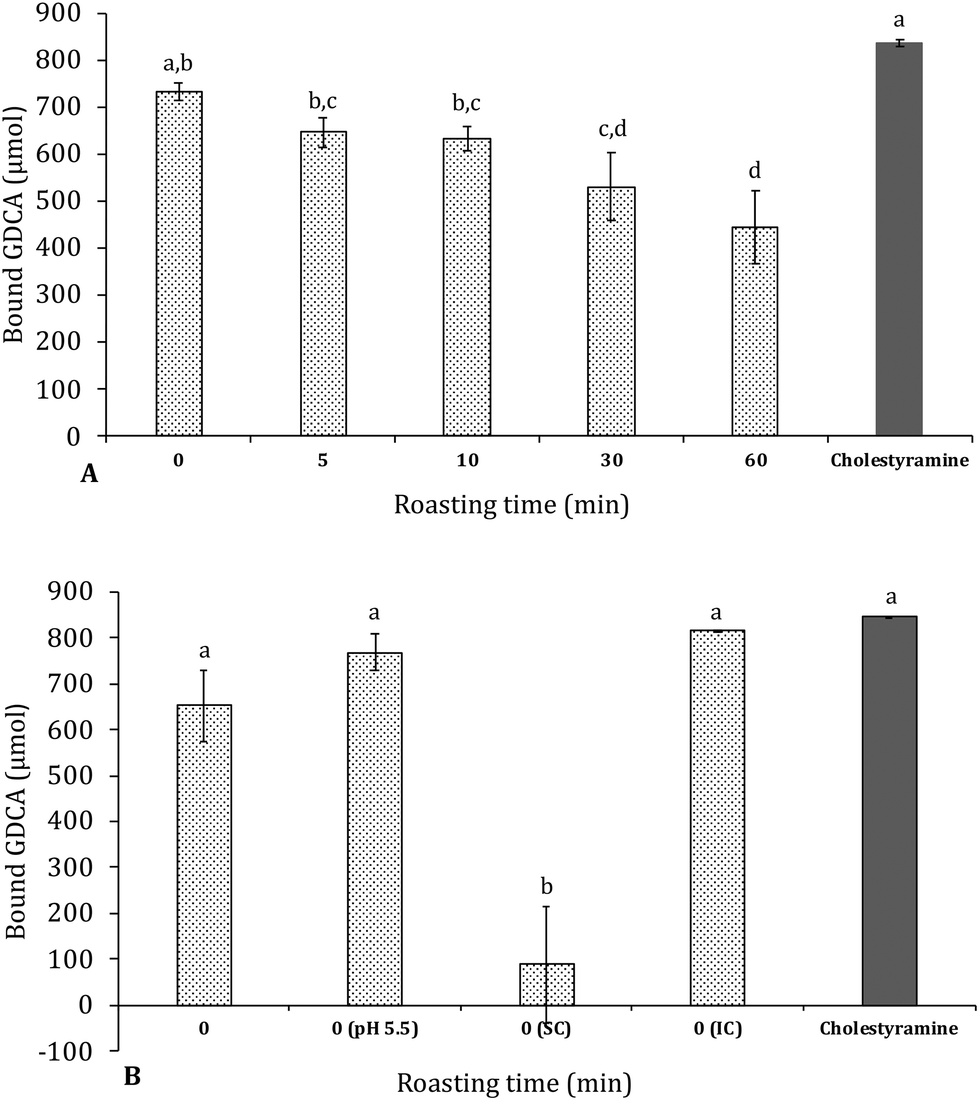 | ||
| Fig. 6 Effect of roasting on the amount of bound glycodeoxycholic acid (GDCA) at a concentration of 2 mM at pH = 7 per g of carob flour. In Panel A the effect of roasting on bile acid adsorption is reported while in Panel B the effect of pH of unroasted carob powder (time 0) on bile acid adsorption is shown. The ability of soluble- and insoluble content (IC/SC) were measured separately. Different letters are significantly different p < 0.05. Cholestyramine represents 100% bile acid adsorption as a positive control. | ||
| TBBA | TTC | TIC | |
|---|---|---|---|
| TBBA | 1 | ||
| TTC | 0.9697 | 1 | |
| TIC | 0.9480 | 0.9872 | 1 |
Another paper by Dongowski, (2007)24 before ours investigated the relation between tannins in carob and the capacity to bind bile acids. They found high amounts of bile acids were bound in a commercial carob fiber preparation and removal of tannins resulted in a sharp decrease in the amount of bound bile acids. This relation was not deeply investigated in the Dongowski's paper; however, our data reported in Table 3 and Fig. 6 clearly suggested that insoluble hydrolysable tannins can play a significant role. When these hydrolysable tannins are broken down by roasting, the degree of bound bile acids drops significantly. Despite the capacity of melanoidins to bind GDCA, roasting carob flour resulted in lower amounts of bound bile acids indicating the ability of insoluble tannins are far better than that of the neo-formed melanoidins.
It was reported that there are three mechanisms explaining the incomplete re-absorption of bile salts into the enterohepatic circulation at the end of the small intestine: the first mechanism explains that (in)soluble dietary fiber increases the barrier properties of the unstirred water layer between micelles and intestinal absorptive cells.54 Secondly, it was reported that (in)soluble compounds might interact at a molecular level, including hydrophobic interactions.55 Last, soluble dietary fiber might form a local viscous or gelatinous matrix that entraps the bile salt micelles.56 All these mechanisms entail an increased loss of bile salts in the feces; therefore, they must be newly synthesized in the liver and this in turn leads to a reduction of the free cholesterol pool.
The probability that the formation of a local viscous or gelatinous network could contribute to lower LDL cholesterol in vivo was excluded, since increasing the concentration of carob flour, nor roasting had an effect on viscosity. On the other hand, although bile acids have amphipathic properties, hydrophobic interactions play a major role. Not only because bile acids mainly bind to insoluble material and tannins in carob flour, but they also bind stronger at lower pH. Similar findings of higher amounts of bound bile acids at lower pH were reported by Drzikova et al., 2005.55 Camire, Zhao, & Violette, (1993)57 and Dziedzic, Górecka, Kucharska, & Przybylska, (2012)58 reported that trihydroxy bile acids (GDCA) had lower adsorption capacities compared to dihydroxy bile acids (cholic acid).
Conclusions
The objective of this study was to investigate the mechanisms underpinning the cholesterol lowering effect of carob flour and the role of insoluble tannins. To this purpose the influence of roasting on the capacity of carob flour to bind glycoconjugates of bile acids in vitro was investigated. We found a high correlation between the capacity of carob flour to adsorb bile acids and their respective tannin and insoluble content. This study supports the evidence that carob has the capacity to bind high amounts of bile salts and that tannins and insoluble compounds are important for interactions between bile salts and carob flour. Roasting decreases the capacity of carob flour to adsorb bile acids (GDCA), mainly as roasting breaks down the HMW tannins in carob flour. Therefore, the bile acid lowering capacity of carob flour is mainly due to hydrophobic interactions exerted by insoluble tannins.Abbreviations
| LDL | Low density lipoprotein |
| BI | Browning index |
| GDCA | glycodeoxycholic acid |
| TTC | Total hydrolysable tannin content |
| TPC | Total phenolic content |
| TFA | Trifluoracetic acid |
| UAE | Ultrasound-assisted extraction |
| IC | Insoluble compounds |
| SC | Soluble compounds |
| HMF | 5-Hydroxymethylfurfural |
| TGA | Total gallic acid |
| FGA | Free gallic acid |
| TBBA | Total bound bile acids |
Conflicts of interest
There are no conflicts to declare.References
- S. M. Nasar-Abbas, Z. e-Huma, T. H. Vu, M. K. Khan, H. Esbenshade and V. Jayasena, Carob Kibble: A Bioactive-Rich Food Ingredient, Compr. Rev. Food Sci. Food Saf., 2016, 15(1), 63–72 CrossRef CAS.
- K. Rtibi, S. Selmi, D. Grami, M. Amri, B. Eto and J. El-benna, et al., Chemical constituents and pharmacological actions of carob pods and leaves (Ceratonia siliqua L.) on the gastrointestinal tract: A review, Biomed.Pharmacother., 2017, 93, 522–528, DOI:10.1016/j.biopha.2017.06.088.
- M. J. Cantalejo, Effects of Roasting Temperature on the Aroma Components of Carob (Ceratonia siliqua L.), J. Agric. Food Chem., 2002, 45(4), 1345–1350 CrossRef.
- M. D. Petit and J. M. Pinilla, Production and purification of a sugar syrup from carob pods, LWT–Food Sci. Technol., 1995, 28(1), 145–152 CrossRef CAS.
- M. N. N.-E. Gobindram, M. Bognanno, G. Luciano, M. Lanza and L. Biondi, Carob pulp inclusion in lamb diets: Effect on intake, performance, feeding behaviour and blood metabolites, Anim. Prod. Sci., 2016, 56(5), 850–858 CrossRef CAS.
- M. Kamal, E. Youssef, M. M. El-Manfaloty and H. M. Ali, Assessment of Proximate Chemical Composition, Nutritional Status, Fatty Acid Composition and Phenolic Compounds of Carob (Ceratonia Siliqua L.), Food Public Health, 2013, 2013(6), 304–308 Search PubMed . Available from: http://journal.sapub.org/fph.
- V. Goulas, E. Stylos, M. V. Chatziathanasiadou, T. Mavromoustakos and A. G. Tzakos, Functional components of carob fruit: Linking the chemical and biological space, Int. J. Mol. Sci., 2016, 17(11), 1875 CrossRef PubMed.
- R. Avallone, M. Plessi, M. Baraldi and A. Monzani, Determination of chemical composition of carob (Ceratonia siliqua): protein, fat, carbohydrates, and tannins, J. Food Compos. Anal., 1997, 10(2), 166–172 CrossRef CAS.
- M. Papagiannopoulos, H. R. Wollseifen, A. Mellenthin, B. Haber and R. Galensa, Identification and quantification of polyphenols in carob fruits (Ceratonia siliqua L.) and derived products by HPLC-UV-ESI/MSn, J. Agric. Food Chem., 2004, 52(12), 3784–3791 CrossRef CAS PubMed.
- N. Tetik, I. Turhan, H. R. Oziyci and M. Karhan, Determination of D-pinitol in carob syrup, Int. J. Food Sci. Nutr., 2011, 62(6), 572–576 CrossRef CAS PubMed.
- I. Rached, L. Barros, I. P. Fernandes, C. Santos-Buelga, A. E. Rodrigues and A. Ferchichi, et al., Ceratonia siliqua L. hydroethanolic extract obtained by ultrasonication: Antioxidant activity, phenolic compounds profile and effects in yogurts functionalized with their free and microencapsulated forms, Food Funct., 2016, 7(3), 1319–1328 RSC.
- F. A. Ayaz, J. Grúz, H. Torun, N. Colak and M. Strnad, Phenolic Acid Content and Free Radical-Scavenging Activity of Two Differently Processed Carob Tree (Ceratonia siliqua L.) Pod, Food Nutr. Sci., 2013, 04(05), 547–553 Search PubMed.
- K. Rtibi, M. A. Jabri, S. Selmi, A. Souli, H. Sebai and J. El-Benna, et al., Carob pods (Ceratonia siliqua L.) inhibit human neutrophils myeloperoxidase and in vitro ROS-scavenging activity, RSC Adv., 2015, 5(102), 84207–84215 RSC.
- L. Custódio, E. Fernandes, A. L. Escapa, A. Fajardo, R. Aligué and F. Alberício, et al., Antioxidant and cytotoxic activities of carob tree fruit pulps are strongly influenced by gender and cultivar, J. Agric. Food Chem., 2011, 59(13), 7005–7012 CrossRef PubMed.
- J. C. Quintela, L. Pérez-Olleros, B. Ruiz-Roso, E. de la Fuente and J. Haya, Insoluble Carob Fiber Rich in Polyphenols Lowers Total and LDL Cholesterol in Hypercholesterolemic Sujects, Plant Foods Hum. Nutr., 2010, 65(1), 50–56 CrossRef PubMed.
- K. Rtibi, S. Selmi, D. Grami, K. Saidani, H. Sebai and M. Amri, et al., Ceratonia siliqua L. (immature carob bean) inhibits intestinal glucose absorption, improves glucose tolerance and protects against alloxan-induced diabetes in rat, J. Sci. Food Agric., 2017, 97(8), 2664–2670 CrossRef CAS PubMed.
- M. Khlifa, A. Bahloul and S. Kitane, Determination of chemical composition of carob pod (Ceratonia siliqua L) and its morphological study, J. Mater. Environ. Sci., 2013, 4(3), 348–353 CAS.
- A. K. Yousif and H. M. Alghzawi, Processing and characterization of carob powder, Food Chem., 2000, 69(3), 283–287 CrossRef CAS.
- Y. H. Hui, W. K. Nip, L. M. L. Nollet, G. Paliyath and B. K. Simpson, in Food Biochemistry and Food Processing, Blackwell Publishing, Iowa, USA, 2007 Search PubMed.
- K. S. Woo, H. Y. Kim, I. G. Hwang, S. H. Lee and H. S. Jeong, Characteristics of the thermal degradation of glucose and maltose solutions, Prev. Nutr. Food Sci., 2015, 20(2), 102–109 CrossRef CAS PubMed.
- K. Sólyom, R. Solá, M. J. Cocero and R. B. Mato, Thermal degradation of grape marc polyphenols, Food Chem., 2014, 159, 361–366 CrossRef PubMed.
- N. Pellegrini, E. Vittadini and V. Fogliano, Designing food structure to slow down digestion in starch-rich products. Vol. 32, in Current Opinion in Food Science, Elsevier Ltd, 2020, pp. 50–57 Search PubMed.
- H. J. F. Zunft, W. Lüder, A. Harde, B. Haber, H. J. Graubaum and C. Koebnick, et al., Carob pulp preparation rich in insoluble fibre lowers total and LDL cholesterol in hypercholesterolemic patients, Eur. J. Nutr., 2003, 42(5), 235–242 CrossRef CAS PubMed.
- G. Dongowski, Interactions between dietary fibre-rich preparations and glycoconjugated bile acids in vitro, Food Chem., 2007, 104(1), 390–397 CrossRef CAS.
- J. A. Domínguez-Avila, A. Wall-Medrano, G. R. Velderrain-Rodríguez, C. Y. O. Chen, N. J. Salazar-López and M. Robles-Sánchez, et al., Gastrointestinal interactions, absorption, splanchnic metabolism and pharmacokinetics of orally ingested phenolic compounds, in Food and Function, Royal Society of Chemistry, 2017, pp. 15–38 Search PubMed.
- M. Medeni, Kinetics of colour change of kiwifruits during hot air and microwave drying, J. Food Eng., 2001, 48(2), 169–175 CrossRef . Available from: http://www.sciencedirect.com/science/article/pii/S0260877400001540.
- A. Fiore, A. D. Troise, B. Ataç Mogol, V. Roullier, A. Gourdon and S. El Mafadi Jian, et al., Controlling the maillard reaction by reactant encapsulation: Sodium chloride in cookies, J. Agric. Food Chem., 2012, 60(43), 10808–10814, DOI:10.1021/jf3026953.
- P. W. Hartzfeld, R. Forkner, M. D. Hunter and A. E. Hagerman, Determination of hydrolyzable tannins (gallotannins and ellagitannins) after reaction with potassium iodate, J. Agric. Food Chem., 2002, 50(7), 1785–1790 CrossRef CAS PubMed.
- T. Kato, M. Yoneda, K. Nakamura and I. Makino, Enzymatic determination of serum 3α-sulfated bile acids concentration with bile acid 3α-sulfate sulfohydrolase, Dig. Dis. Sci., 1996, 41(8), 1564–1570 CrossRef CAS PubMed.
- I. Boublenza, H. A. Lazouni, L. Ghaffari, K. Ruiz, A. S. Fabiano-Tixier and F. Chemat, Influence of Roasting on Sensory, Antioxidant, Aromas, and Physicochemical Properties of Carob Pod Powder (Ceratonia siliqua L.), J. Food Qual., 2017, 2017, 4193672 CrossRef.
- O. E. Shan, W. Zzaman and T. A. Yang, Impact of different temperature-time profiles during superheated steam roasting on some physical changes of Robusta coffee, Pertanika J. Trop. Agric. Sci., 2016, 39(3), 311–320 Search PubMed.
- H. Şahin, A. Topuz, M. Pischetsrieder and F. Özdemir, Effect of roasting process on phenolic, antioxidant and browning properties of carob powder, Eur. Food Res. Technol., 2009, 230(1), 155–161 CrossRef.
- M. J. González, J. L. Torres and I. Medina, Impact of thermal processing on the activity of gallotannins and condensed tannins from hamamelis virginiana used as functional ingredients in seafood, J. Agric. Food Chem., 2010, 58(7), 4274–4283 CrossRef PubMed.
- F. Shafizadeh and A. G. W. Bradbury, Thermal degradation of cellulose in air and nitrogen at low temperatures, J. Appl. Polym. Sci., 1979, 23(5), 1431–1442 CrossRef CAS.
- V. A. Alvarez and A. Vázquez, Thermal degradation of cellulose derivatives/starch blends and sisal fibre biocomposites, Polym. Degrad. Stab., 2004, 84(1), 13–21 CrossRef CAS.
- V. I. Sharypov, N. Marin, N. G. Beregovtsova, S. V. Baryshnikov, B. N. Kuznetsov and V. L. Cebolla, et al., Co-pyrolysis of wood biomass and synthetic polymer mixtures. Part I: Influence of experimental conditions on the evolution of solids, liquids and gases, J. Anal. Appl. Pyrolysis, 2002, 64(1), 15–28 CrossRef CAS.
- B. Fallico, M. Zappalà, E. Arena and A. Verzera, Effects of conditioning on HMF content in unifloral honeys, Food Chem., 2004, 85(2), 305–313 CrossRef CAS.
- A. Agila and S. Barringer, Effect of Roasting Conditions on Color and Volatile Profile Including HMF Level in Sweet Almonds (Prunus dulcis), J. Food Sci., 2012, 77(4), C461–C468 CrossRef CAS PubMed.
- R. A. Oral, M. Mortas, M. Dogan, K. Sarioglu and F. Yazici, New approaches to determination of HMF, Food Chem., 2014, 143, 367–370, DOI:10.1016/j.foodchem.2013.07.135.
- A. G. Newsome, Y. Li and R. B. Van Breemen, Improved Quantification of Free and Ester-Bound Gallic Acid in Foods and Beverages by UHPLC-MS/MS, J. Agric. Food Chem., 2016, 64(6), 1326–1334 CrossRef CAS PubMed.
- F. Shahidi and J. D. Yeo, Insoluble-bound phenolics in food, Molecules, 2016, 21(9), UNSP 1216 CrossRef PubMed.
- B. A. Acosta-Estrada, J. A. Gutiérrez-Uribe and S. O. Serna-Saldívar, Bound phenolics in foods, a review, Food Chem., 2014, 152, 46–55, DOI:10.1016/j.foodchem.2013.11.093.
- C. F. Ross, C. Hoye and V. C. Fernandez-Plotka, Influence of Heating on the Polyphenolic Content and Antioxidant Activity of Grape Seed Flour, J. Food Sci., 2011, 76(6), C884–C890 CrossRef CAS PubMed.
- S. Y. Kim, S. M. Jeong, W. P. Park, K. C. Nam, D. U. Ahn and S. C. Lee, Effect of heating conditions of grape seeds on the antioxidant activity of grape seed extracts, Food Chem., 2006, 97(3), 472–479 CrossRef CAS.
- G. P. Rizzi, Electrochemical Aspects of the Maillard Reaction and Related Reactions, Food Rev. Int., 2013, 29(2), 178–191 CrossRef CAS.
- I. Tomaz, I. Šikuten, D. Preiner, Ž Andabaka, N. Huzanić and M. Lesković, et al., Stability of polyphenolic extracts from red grape skins after thermal treatments, Chem. Pap., 2019, 73(1), 195–203 CrossRef CAS.
- J. S. Boles, D. A. Crerar, G. Grissom and T. C. Key, Aqueous thermal degradation of gallic acid, Geochim. Cosmochim. Acta, 1988, 52(2), 341–344 CrossRef CAS.
- J. M. G. Galvez, M. Fechtal and B. Riedl, Gallic acid a model of tannins in condensation with formaldehyde, Thermochim. Acta, 1996, 274(1–2), 149–163 CrossRef.
- A. S. P. Moreira, F. M. Nunes, M. R. Domingues and M. A. Coimbra, Coffee melanoidins: Structures, mechanisms of formation and potential health impacts, Food Funct., 2012, 3(9), 903–915 RSC.
- T. Pandolf and F. M. Clydesdale, Dietary Fiber Binding of Bile Acid through Mineral Supplementation, J. Food Sci., 1992, 57(5), 1242–1246 CrossRef CAS.
- F. I. J. Ragot, G. F. Russell and B. O. Schneeman, Effect of Maillard Reaction Products on Bile Acid Binding, Plasma and Hepatic Lipids, and Weight of Gastrointestinal Organs, J. Agric. Food Chem., 1992, 40(9), 1634–1640 CrossRef CAS.
- T. S. Kahlon and C. L. Woodruff, In vitro binding of bile acids by soy protein, pinto beans, black beans and wheat gluten, Food Chem., 2002, 79(4), 425–429 CrossRef CAS.
- T. S. Kahlon, M. H. Chapman and G. E. Smith, In vitro binding of bile acids by okra, beets, asparagus, eggplant, turnips, green beans, carrots, and cauliflower, Food Chem., 2007, 103(2), 676–680 CrossRef CAS.
- P. Gunness and M. J. Gidley, Mechanisms underlying the cholesterol-lowering properties of soluble dietary fibre polysaccharides, Food Funct., 2010, 1(2), 149–155 RSC.
- B. Drzikova, G. Dongowski, E. Gebhardt and A. Habel, The composition of dietary fibre-rich extrudates from oat affects bile acid binding and fermentation in vitro, Food Chem., 2005, 90(1–2), 181–192 CrossRef CAS.
- C. Zacherl, P. Eisner and K. H. Engel, In vitro model to correlate viscosity and bile acid-binding capacity of digested water-soluble and insoluble dietary fibres, Food Chem., 2011, 126(2), 423–428, DOI:10.1016/j.foodchem.2010.10.113.
- M. E. Camire, J. Zhao and D. A. Violette, In Vitro Binding of Bile Acids by Extruded Potato Peels, J. Agric. Food Chem., 1993, 41(12), 2391–2394 CrossRef CAS.
- K. Dziedzic, D. Górecka, M. Kucharska and B. Przybylska, Influence of technological process during buckwheat groats production on dietary fibre content and sorption of bile acids, Food Res. Int., 2012, 47(2), 279–283, DOI:10.1016/j.foodres.2011.07.020.
| This journal is © The Royal Society of Chemistry 2020 |