DOI:
10.1039/C9RA07758H
(Paper)
RSC Adv., 2019,
9, 36726-36741
Optoelectronic, femtosecond nonlinear optical properties and excited state dynamics of a triphenyl imidazole induced phthalocyanine derivative†
Received
24th September 2019
, Accepted 5th November 2019
First published on 11th November 2019
Abstract
A novel zinc phthalocyanine derivative [2(3), 9(10), 16(17), 23(24) tetrakis-4-((4-(1,4,5-triphenyl-1H-imidazol-2-yl)phenyl)ethynyl)phthalocyanine zinc(II) (PBIPC)] was synthesized by incorporating a triphenyl imidazole moiety at its peripheral positions. The detailed mechanisms of absorption, emission, electrochemical, nonlinear optical (NLO) and photophysical (excited state dynamics) properties of PBIPC were explored. The absorption and emission properties of the compound were studied in different solvents. The incorporation of a triphenyl imidazole moiety at the peripheral position of the zinc phthalocyanine slightly broadened the Soret band. The emission studies revealed fluorescence quantum yields to be in the range of 0.11–0.22. The time-resolved fluorescence data established the radiative lifetimes to be in the nanosecond range. The oxidation and reduction processes were found to be ring centered, which were studied using the cyclic voltammetry (CV) technique. The energy optimized structures and HOMO–LUMO levels were calculated using DFT, TD-DFT analysis and were employed by means of hybrid functional theory (B3LYP) at 6-31G (d,p) basis set in the Gaussian 09 package. Two-photon absorption was observed in the NLO studies performed in the visible wavelength range of 600–800 nm while the nonlinear absorption was dominated by three- and four-photon absorption processes in the NIR wavelength range (1.0–1.5 μm). The molecule exhibited self-focusing behavior for all the wavelengths. Finally, the excited state dynamics of the title molecule PBIPC were investigated using femtosecond transient absorption spectroscopy and the results obtained were understood on the basis of a simple three kinetic model, for excitation wavelengths of 400 nm (Soret band) and 650 nm (Q-band). Both the spectra demonstrated a broad positive transient absorption (TA) data which overlapped with the ground state bleach (GSB), which in turn displayed a red shift over a delay of ∼2 ns. The lifetimes revealed a possibility of intersystem crossing (τ > 1 ns) owing to the triplet state transition.
Introduction
The design and synthesis of organic materials (solutions, thin films) with strong nonlinear optical (NLO) coefficients has received considerable attention from various chemists and material scientists over the last couple of decades leading to the evolution of photonics, optoelectronic technologies and biomedicine.1–6 Many of the optical devices developed for such applications have been realized with π-conjugated organic materials such as phthalocyanines, metallophthalocyanines and porphyrins.7,8 The NLO properties have been widely investigated in the case of phthalocyanines and metallophthalocyanines. The extended de-localized π-electron conjugation is a structural prerequisite for the observation of strong third-order NLO phenomena in organic molecules. Phthalocyanines have been found to possess fabulous thermal, chemical and optical stability and the ability to hold non-metallic and metallic ions in its cavity through several synthetic procedures leading to a tremendous interest in the NLO properties of new molecules designed and/or synthesized.9–13 To realize NLO devices for optical signal processing and telecommunications a number of new materials have been developed and investigated.14,15 Additionally, phthalocyanines demonstrate an optical limiting (OL) mechanism realized through reverse saturable absorption (RSA) and/or two-photon absorption (2PA) processes.16–18 Phthalocyanines are favorable for the functionalization of various substituent groups at their peripheral positions which might be the reason for their solubility in common organic solvents in addition to the minimization of aggregation. Generally, 600–700 nm (Q band) region is the potential absorption for phthalocyanine due to the π–π transitions that are the responsible transitions for this Q band along with a less intense Soret band at 300–400 nm. Usually Q bands have large molar extinction coefficients and, therefore, due to their longer visible absorption phthalocyanines are used in different fields of applications such as in chemical sensors, photodynamic therapy (PDT), liquid crystals, catalysis etc.19–21
Zinc phthalocyanine and its derivatives have proved to be very efficient photosensitizers (PS) for PDT22 where the PS is generally administered in a tissue which undergoes a photochemical reaction when activated by visible light irradiation and generates cytotoxic species in the presence of oxygen. PDT can be used to treat cancerous tumors and noncancerous diseases such as age-related macular degeneration, psoriasis, atherosclerosis, and infectious diseases.23–27 The efficacy of PDT relies on the solubility in different solvents, chemical nature and the photophysical properties of the PS in solution which can be studied through its excited state dynamics.28 The solubility and aggregation are the two main factors of the phthalocyanines which influences its optical properties. Even at low concentrations, the highly planar phthalocyanines form aggregates, which leads to a reduced capability for device applications. Therefore, the scientific community has concerted their efforts towards the design and development of highly soluble and non-aggregating phthalocyanines.29–35 In this regard, our group has also investigated many phthalocyanines to understand the structure and NLO properties correlation for identifying potential molecules for various photonic applications.36–47 over the last few years. To this end our group has been involved in investigating and optimizing the NLO properties of different phthalocyanine, Corrole37 molecules in the form of thin films, nanoparticles (NPs) and solutions. We have studied them with nanosecond (ns), picosecond (ps), and femtosecond (fs) pulses and MHz (derived from a fs oscillator)/kHz (derived from amplifier and optical parametric amplifier) repetition rates. The motivation here being understanding of the structure–NLO property relationship in these molecules and tailoring them for suitable potential photonic applications.
Kumar et al. studied two alkyl phthalocyanine solutions (Pc1 and Pc2) with 10 Hz, 6 ns pulses at 532 nm and 82 MHz, 80 fs pulses at 800 nm.12 These molecules exhibited strong 2PA with ns excitation [2PA coefficients of 310–420 cm GW−1] and 3PA for fs pulse regime with 3PA coefficient of 10−5 cm3 GW−2. Anusha et al. investigated unsymmetrical alkyl (PCH001) and alkoxy phthalocyanines (PCH003) using picosecond (2 ps) pulses at a repetition rate of 1 kHz pulses and excited at 800 nm.43 The 2PA coefficient was found to be ∼0.1 cm GW−1 and the molecules demonstrated self-defocussing behavior [n2 ∼ 10−15 cm2 W−1]. These studies revealed that such phthalocyanines are ideal for saturable absorbers and optical limiters. They further compared the above results with a symmetrical zinc phthalocyanine (ZnOPc) and found that they exhibited 3PA behavior in water.44 Swain et al. performed a detailed study of optical and electrochemical behavior of a thio zinc phthalocyanine solution in THF employing again 2 ps, 1 kHz laser pulses and 150 fs, 80 MHz pulses in wavelength range of 600–820 nm.38 The molecule demonstrated a switching behavior from saturable absorption (SA) at lower input peak intensities (60 GW cm−2) to reverse saturable absorption (RSA) at >120 GW cm−2 with 2PA absorption coefficient of ∼10−11 cm W−1. The molecule essentially possessed self-defocusing behavior with n2 being 10−16 cm2 W−1 for 2 ps, 1 kHz pulse excitation and 10−13 cm2 W−1 for 150 fs, 80 MHz pulse excitation. Krishna et al. reported similar studies on phenyl substituted ZnPc, TFM-Pc in DCM solvent. The NLO studies were performed with 2 ps pulses (800 nm) and 70 fs pulses (690 nm excitation) both at 1 kHz repetition rate to achieve strong 2PA at 82 GW cm−2 for ps pulse regime and strong saturable absorption in fs pulse regime.39 In both these regimes the molecule essentially demonstrated self-defocusing behavior with n2 of ∼10−17 cm2 W−1 using fs pulses and ∼10−12 cm2 W−1 using ps pulses. The larger nonlinearity of n2 for ps regime is due to additional effects other than pure electronic contribution due to longer pulse duration.40 Krishna et al. again studied the optical and electrochemical behavior of a triphenyl substituted ZnPc, TPA–ZnPc. They investigated the NLO properties with 2 ps, 1 kHz pulse and 150 fs, 80 MHz pulse at 800 nm.41 With fs pulses, the molecule demonstrated 2PA absorption with a coefficient of 10−7 cm W−1 and self-defocusing with n2 being ∼10−12 cm2 W−1 while ps pulses demonstrated a 2PA absorption coefficient of 10−11 cm W−1 and self-defocusing with n2 of ∼10−14 cm2 W−1. Very recently Bhattacharya et al.47 have reported the usage of carboxyl group at the peripheral position of ZnPc to synthesize novel phthalocyanines (CBZPc1 and CBZPc2) and investigated their optical and electrochemical properties. Their NLO studies were performed using both ∼150 fs, 80 MHz pulses and ∼70 fs, 1 kHz pulses in the wavelength range of 700–900 nm and 600–800 nm, respectively. Both the studies demonstrated strong 2PA for their molecules at all wavelengths with nonlinear absorption coefficient of ∼10−8 cm W−1 for MHz pulses and ∼10−11 cm W−1 for kHz pulses. CBZPc1 in THF solvent displayed self-focusing behavior with typical n2 values of ∼10−16 cm2 W−1 for kHz pulse excitation while CBZPc2 in DCM demonstrated self-defocusing behavior with n2 value of ∼10−16 cm2 W−1.
In this work, we have focused our efforts on understanding the ultrafast NLO studies of an imidazole substituted ZnPc through an ethynyl bridge using 70 fs, 1 kHz pulses. We have recorded the NLO data in visible wavelengths of 600–800 nm in addition to the near infrared spectral region of 1.0–1.5 μm. There are very few reports on the near-infrared NLO studies of organic molecules, in general, and phthalocyanines, in particular. Detailed, broadband NLO studies accompanied with transient absorption data elucidated the dynamics and magnitude of the third-order optical nonlinearity. Imidazole substituted phthalocyanines have been widely studied due to their possible applications in photonics, opto-electronics. However, no one has so far investigated the NLO properties in the near infrared (NIR) wavelengths which find applications, for example, in the field of multi-photon imaging. In the present work, for the first time to the best of our knowledge, we provide a detailed NLO analyses of an imidazole substituted ZnPc, PBIPC in the visible as well as NIR wavelength excitations. With the aim of achieving superior NLO and photophysical properties with significant triplet state lifetimes we have designed and synthesized a triphenyl imidazole induced phthalocyanine through the ethynyl bridge i.e., PBIPC (as illustrated in the Fig. 1). The integration of phthalocyanine molecule with triphenyl imidazole deeply influences the electronic and sterical properties of the macromolecule. Moreover, it has solubility in many polar aprotic solvents. Further, it is established to shift the redox processes towards positive potentials. Herein, we have performed detailed absorption and emission (both the steady-state and time-resolved) studies in a variety of solvents and varying concentrations and, furthermore, we have investigated the electrochemical and spectroelectrochemical studies. The photophysical and NLO studies of the PBIPC were performed using transient absorption spectroscopy and Z-scan techniques, respectively with femtosecond (fs) laser pulses. We have also evaluated the nonlinear absorption coefficients, cross-sections (two-photon, three-photon, and four-photon absorption related), third-order NLO susceptibilities of the molecule at all the wavelengths investigated. Such studies will enable us to not only identify molecules with potential applications but also provide guidelines for designing superior molecules.
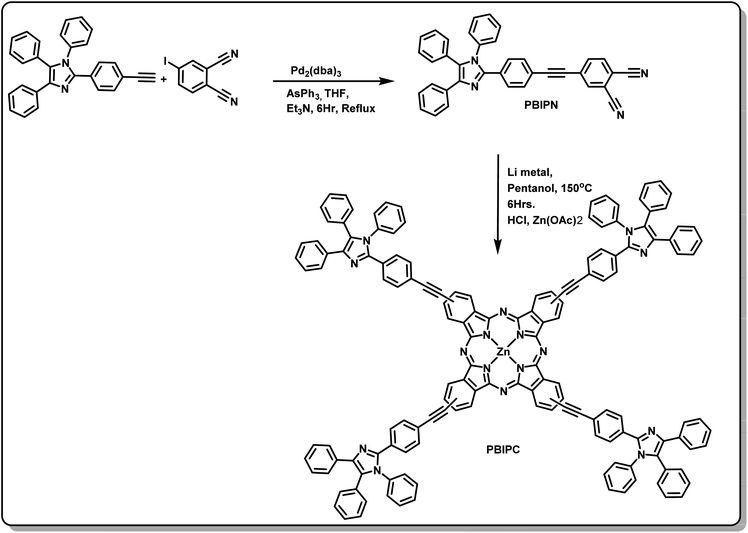 |
| | Fig. 1 Synthetic route utilized for the preparation of PBIPC. | |
Experimental section
Materials
4-Iodophthalonitrile, [Pd2(dba)3], AsPh3, 1-pentanol, HCl, Li metal were procured from TCI and were used in their original form. All the solvents (dichloromethane, toluene, methanol, tetrahydrofuran (THF), dimethyl sulfoxide, potassium carbonate, chloroform, N,N-dimethylformamide, triethyl amine, and n-hexane) were purchased from local company (SD Fine Chemicals Limited, India) and were dried prior to their usage. Zinc Acetate was procured from Qualigens Chemicals Ltd, India. 2-(4-Ethynylphenyl)-1,4,5-triphenyl-1H-imidazole was synthesized as per the reported procedure.48
Instrumentation and characterization
1H NMR spectra of the molecule were recorded in solutions of CDCl3 and on a 300 MHz spectrophotometer (AVANCE). Electron spray ionization-mass spectra of the molecule were recorded on The Waters 2996 Photodiode array detector. MALDI-TOF mass spectrometry measurements were performed on Shimadzu system (Biotech Axima Performance 2.9.3.20110624: Mode Reflectron-Hi Res, Power: 85) using TMS as the standard. FT-IR spectra (in KBr pellets) were obtained using a Bruker spectrometer.
Optical studies
A UV-Visible-NIR spectrometer (Shimadzu UV-3600) was utilized to record the absorption spectra. We have recorded the steady-state emission spectra with a Fluorolog-3 Spectrofluorometer (Spex model, JobinYvon) from the solutions prepared with an optical density being ≫0.06 at the wavelength of excitation (lex). Zinc tert-butyl phthalocyanine (ϕf of 0.37 in benzene) was utilized as a reference to estimate the fluorescence quantum yields (ϕf) through integration of the fluorescence bands.48
Picosecond time-correlated single photon counting (TCSPC)
The fluorescence lifetime measurements were performed using a picosecond (ps) light emitting diode laser (NanoLED, λex of 670 nm) as the excitation source and a spectrometer (FluoroLog3-Triple Illuminator model, IBH Horiba JobinYvon) and a photomultiplier tube (R928P, Hamamatsu) served as the detector. The decay curves were obtained by observing the fluorescence emission maxima of the macrocycle (λem of 700 nm). The instrument response function (IRF) was obtained by placing a dilute solution of Ludox (in water) in lieu of the sample and. It was estimated to be equal to the full-width at half maximum (FWHM) of the excitation source, which was ∼635 ps at 670 nm. The decay curves were scrutinized using nonlinear least-squares iteration procedure and decay analysis software IBH DAS6 (version 2.3). The quality of the theoretical fits was adjudicated by the χ2 values along with the residual's distribution.
Electrochemical studies
System-controlled CH instrument model CHI 620C electrochemical analyzer was used to perform the electrochemical measurements. The experiments were performed on 1 mM concentration PBIPC solutions in dry dichloromethane solvent. A scan rate of 100 mV s−1 was used and 0.1 M tetrabutyl ammonium perchlorate (TBAP) was used as a supporting electrolyte. The working electrode was glassy carbon in this case with standard calomel electrode (SCE) being the reference electrode and platinum wire being the auxiliary electrode. Subsequent to the recording of cyclic voltammogram (CV), ferrocene was added and a second voltammogram was recorded. The optical thin layer electrochemical studies were performed using a Maya 2000 Ocean Optics spectrometer and using UV-VIS-NIR LIGHTSOURCE (9 DT-MINI-2-GS).
Theoretical calculations
Gaussian 09 package on a personal computer was used for performing all the theoretical analysis.49 The optimized energy minimized structures of PBIPC were stable with global minimal energy. These studies were achieved using the Density Functional Theory (DFT). B3LYP hybrid functional50 theory at 6-31G(d,p) basis set51 of the Gaussian program was used. The excited state properties such as (a) percentage of molecular contribution (b) oscillatory strength (c) singlet transition energy in the THF solvent were obtained by performing the time-dependent DFT. The integral equation formalism polarizable continuum model (PCM)52,53 inside the self-consistent reaction field (SCRF) theory was utilized in the TD-DFT calculations to describe the M06-2X function and solvation of the dyes in THF. The software of GaussSum 2.2.5 was engaged to simulate major features of the absorption spectra and also to interpret the nature of various transitions.54,55
Synthesis
Synthesis of 4-((4-(1,4,5-triphenyl-1H-imidazol-2-yl)phenyl)ethynyl)phthalonitrile (PBIPN). The compound PBIPN was synthesized by adding 2-(4-ethynylphenyl)-1,4,5-triphenyl-1H-imidazole (750 mg, 1.89 mmol), 4-iodophthalonitrile (254 mg, 1.89 mmol), tris(dibenzylideneacetone) dipalladium(0) (86.46 mg, 0.0945 mmol) and triphenylarsine (28.91 mg, 2.7 0.0945 mM) in 100 ml round bottomed flask. 10 ml of THF and 25 ml of triethylamine were added to this solution. Later it was purged for 20 minutes under the influence of nitrogen atmosphere. Subsequently, it was stirred for 4 h at reflux temperature. Post completion of the reaction the mixture was cooled to room temperature and was dried under reduced pressure followed by the extraction in ethyl acetate and water.Column chromatography was performed using hexane and ethyl acetate (3![[thin space (1/6-em)]](https://www.rsc.org/images/entities/char_2009.gif) :1) (yield 63%). ESI-MS (m/z) = 522 (calculated mass = 521), FT-IR (KBr) νmax (cm−1) = 3111.03, 3071.14, 2957.17, 2923.08, 2853.02, 2350.64, 2237.26, 1726.86, 1597.74, 1531.40, 1481.11, 1377.27, 1218.74, 1070.98, 980.03, 905.01, 843.14, 772.16; 1H-NMR (CDCl3, 400 MHz, TMS) δ (ppm) = 7.88 (s, 1H) 7.78 (d, 2H) 7.58 (d, 2H) 7.43 (dd, 2H) 7.40 (dd, 2H) 7.67 (t, 2H) 7.28 (m, 4H) 7.24 (d, 2H) 7.20 (m, 3H) 7.14 (d, 2H) 7.12 (d, 2H).
:1) (yield 63%). ESI-MS (m/z) = 522 (calculated mass = 521), FT-IR (KBr) νmax (cm−1) = 3111.03, 3071.14, 2957.17, 2923.08, 2853.02, 2350.64, 2237.26, 1726.86, 1597.74, 1531.40, 1481.11, 1377.27, 1218.74, 1070.98, 980.03, 905.01, 843.14, 772.16; 1H-NMR (CDCl3, 400 MHz, TMS) δ (ppm) = 7.88 (s, 1H) 7.78 (d, 2H) 7.58 (d, 2H) 7.43 (dd, 2H) 7.40 (dd, 2H) 7.67 (t, 2H) 7.28 (m, 4H) 7.24 (d, 2H) 7.20 (m, 3H) 7.14 (d, 2H) 7.12 (d, 2H).
Synthesis of 2(3), 9(10), 16(17), 23(24) tetrakis 4-((4-(1,4,5-triphenyl-1H-imidazol-2-yl)phenyl)ethynyl)phthalocyanine zinc(II) (PBIPC). PBIPC was synthesized by adding PBIPN (300 mg, 0.57 mmol) to 10 ml of 1-pentanol and 40 mg of Li metal. This was stirred for ∼5 hours at a temperature of 140 °C. Subsequently, the reaction mixture was cooled to room temperature and was stirred for 1 hour by adding small amount of HCl (2 ml). Then the reaction mixture was extracted from DCM and water. Afterwards, the solvent was removed using a rotary evaporator. Then the compound was collected in 50 mL round-bottomed flask and to this 10 mL of DMF was added and stirred at 150 °C for 3 hours by adding zinc acetate (525 mg, 2.57 mM). Then the reaction mixture was cooled to room temperature followed by the removal of solvent again under reduced pressure. Later the compound was extracted using DCM and water. Finally, a column chromatography was performed with hexane, followed by 1:1 ratio of hexane and DCM, later with pure DCM (yield = 76%). MOLDI-TOF (m/z) = 2155.77 (calculated mass = 2156). FT-IR (KBr) νmax (cm−1) = 3060.40, 2954.56, 2924.83, 2855.22, 1725.70, 1644.58, 1599.30, 1597.96, 1495.17, 1446.19, 1414.95, 1390.23, 1317.98, 1219.45, 1146.87, 1093.68, 1071.17, 1017.08, 981.40, 840.53, 772.10, 696.05.
Results and discussion
Synthesis and characterization
The phthalonitrile of 4-((4-(1,4,5-triphenyl-1H-imidazol-2-yl)phenyl)ethynyl)phthalonitrile (PBIPN) was synthesized following the Sonogashira coupling reaction and the phthalocyanine was engineered through cyclotetramerization of PBIPN in 1-pentanol at reflux temperature (under nitrogen atmosphere) in the presence of a non-nucleophilic base catalyst (Li-metal). The crude portion was purified using column chromatography. Later, HCl was added and stirred in RT followed by extraction in DCM and water, after that Zn(OAc)2 and DMF were added and stirred at reflux (Fig. 1). Then recrystallization was achieved and characterized by (a) elemental analysis (b) mass [Fig. S1, ESI†] (c) 1H-NMR (Fig. S2, ESI†) (d) FT-IR (Fig. S3 and S5 of ESI†) (e) UV-Visible absorption and emission spectroscopic as well as electrochemical techniques. The elemental analysis data was found to be satisfactory and is presented in the Experimental section. The MALDI-TOF spectrum of PBIPC consisted of a molecular ion peak at 2155.77 which is assigned to the existence of corresponding phthalocyanine (see ESI Fig. S4†). During the course of tetramerization reaction there is a possibility of formation of a mixture of positional isomers. We did not isolate any single isomer. The measurements performed were on the mixture.
UV-visible absorption studies
The distinguishing features of the PBIPC were exposed by electronic absorption spectra. The typical absorption spectrum shows two featured bands i.e., Soret band (B band) in the 300–400 nm spectral region and intense Q band in the 600–800 nm spectral region. The deeper π-levels to LUMO transition and a HOMO to LUMO transition (π–π*) results in Soret band and Q band respectively (see Fig. 2). Metallation, substitution of donor groups at the peripheral position and aggregation of phthalocyanine macrocycle amends the absorption maxima and the intensity of Q-band.31,32
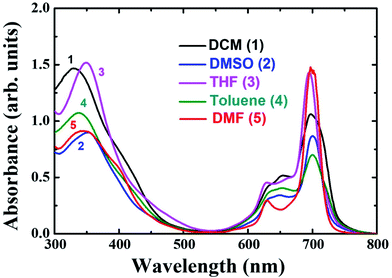 |
| | Fig. 2 Absorption spectra of PBIPC in diffèrent solvents. | |
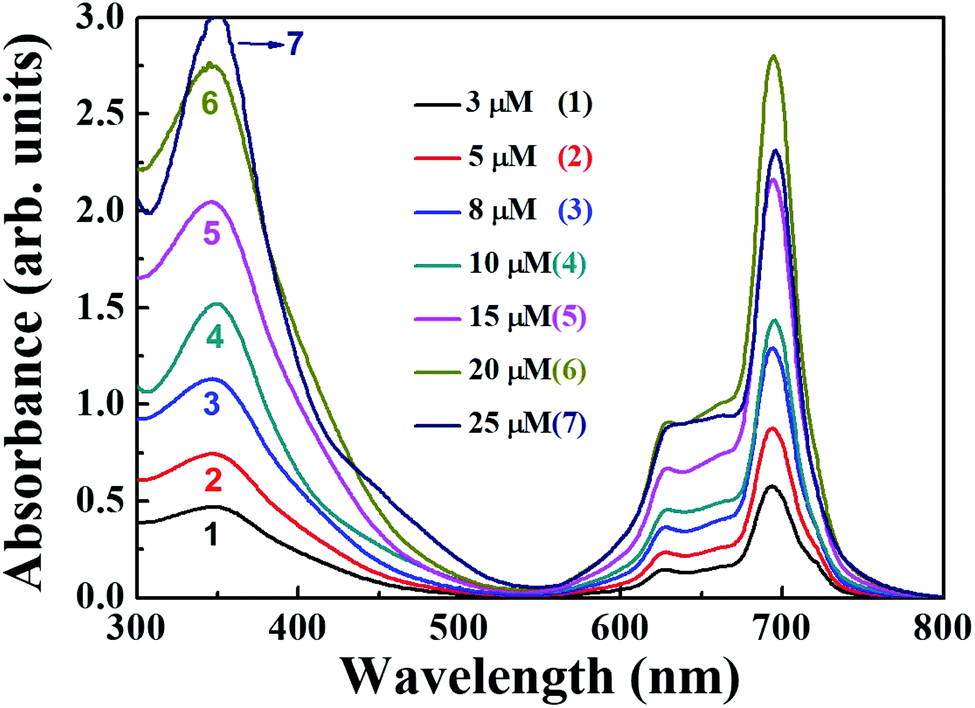
The absorption spectra for PBIPC in various solvents with a concentration of 1.0 × 10⁻⁵ M is depicted in Fig. 2 and corresponding λmax and logarithmic of molar extinction coefficient (ε) are given in Table 1. The absorption spectrum in DMF was also recorded at lower concentrations (absorbance < 0.3) and the data is provided in Fig. S6 of ESI file.† The coordinated solvents viz., DMF, DMSO, and THF supports the coordination at the axial position of phthalocyanine with metal, which leads to suppression of the aggregation. The ε of Q band at 700 nm is enhanced drastically in DCM solvent, when compared in toluene, which can possibly be attributed to the presence of aggregation. However, further investigations are necessary to identify the type of aggregation in this macrocyclic molecule. The occurrence of a shoulder at the higher energy side of Q band also possibly designates the presence of aggregated species. Due to the incorporation of the triphenyl imidazole group the Soret band was observed to be broadened. Aggregation is generally influenced by the nature of the substituents and solvent along with other parameters such as concentration, central metal ion and temperature.56 The aggregation behavior of the PBIPC was inspected in THF solvent at several concentrations as shown in Fig. 3. From these concentration-dependent studies we concluded that in phthalocyanine no new blueshift was observed, possibly owing to aggregation, and as the concentration increased the Q band absorption maxima (at 695 nm) remained the same. Therefore, the molar extinction coefficient was virtually constant and obeyed the Beer–Lambert's Law at dilute concentrations. Similar studies were performed in DCM solvent (Fig. S7, ESI†) and those too followed the Beer–Lambert's Law at low concentrations. With increasing concentration, absorption also increased without change of ratio of Q band peak and shoulder at 645 nm (Fig. S7†) as was the case observed in our earlier reports too.38–41
Table 1 Absorption, emission data of PBIPC in different solvents
| Sample |
Solvent |
λmaxa, nm (logε) |
Emission λmaxb, nm |
ϕfc |
τd, ns (A%) |
| Error limits: λmax, ±1 nm, ε ± 10%. Error limits: λem, ±1 nm. ϕ, ±0.01%. Error limits in τ are ±10%; ε units are in M−1 cm−1. |
| PBIPC |
DCM |
697 (3.7) |
721 |
0.22 |
1.37 (21) |
| 5.00 (79) |
| DMF |
695 (4.2) |
707 |
0.11 |
1.16 (22) |
| 3.30 (78) |
| DMSO |
700 (3.6) |
711 |
0.12 |
3.03 (100) |
| THF |
695 (3.8) |
704 |
0.22 |
3.68 (100) |
| Toluene |
700 (3.5) |
720 |
0.19 |
1.73 (32) |
| 3.86 (68) |
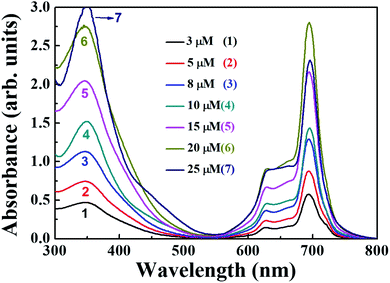 |
| | Fig. 3 Absorption spectral changes of PBIPC in THF at different concentrations of (1) 3 μM, (2) 5 μM, (3) 8 μM, (4) 10 μM, (5) 15 μM, (6) 20 μM and (7) 25 μM. | |
Emission studies
In order to understand the peripheral substitution on phthalocyanine, qualitative and quantitative analysis of the fluorescence spectra and determination of the quantum yields (ϕf) was performed for PBIPC. Fig. 4 validates the emission spectra of PBIPC in various solvents (toluene, DCM, THF, DMF and DMSO) by exciting at ∼690 nm. The resultant emission maxima and quantum yields are accessible in Table 1. The fluorescence quantum yields were determined following the equation below
where ϕsample is the quantum yield of the sample, ϕstandard is the quantum yield of the standard, Fsample is the fluorescence intensity of the sample, Fstandard is the fluorescence intensity of the standard, Abssample is the absorbance of the sample at excitation wavelength, Absstandard is the absorbance of the standard at the excitation wavelength.
 |
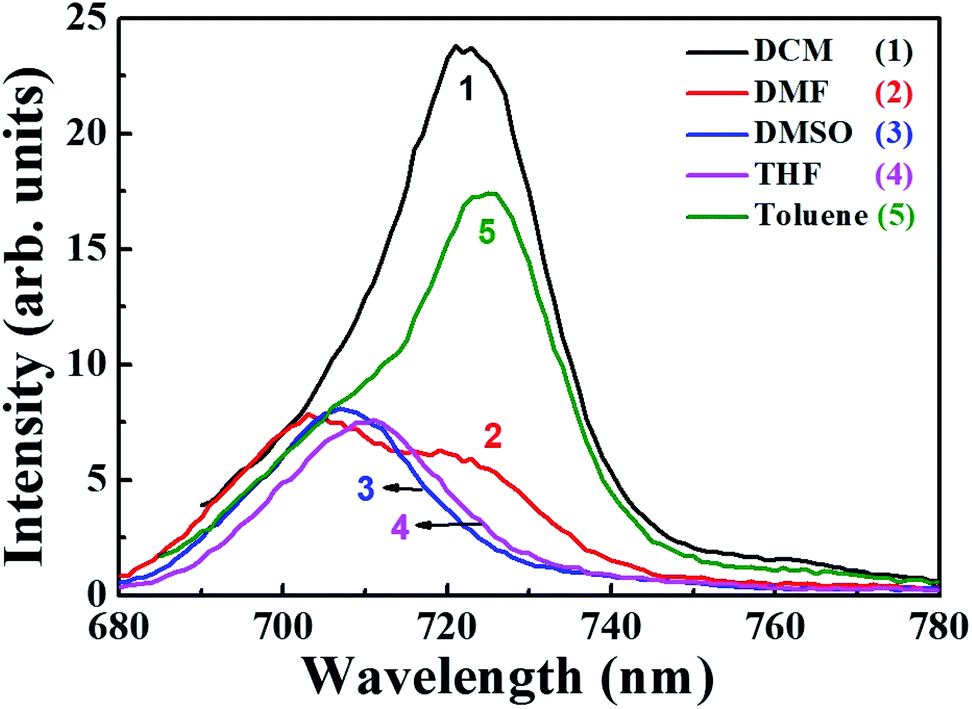
| | Fig. 4 Steady state fluorescence spectra of PBIPC in different solvents. | |
The steady state fluorescence spectra of PBIPC is presented in the Fig. 4 and it is apparent that the emission spectra are reliable within (a) the limits of Stokes rule and (b) the regulations of mirror symmetry between the absorption, fluorescence bands. The data presented in Table 1 evaluates the polarity of solvents. It is also observed that as the solvents polarity increased, the quantum yield reduced and this could be due to an increase in aggregation in polar solvents, which diminishes the likelihood of radiative deactivation (i.e. fluorescence through dissipation of energy from the aggregates) and it impacts directly the excited state life times of the phthalocyanine macrocycle. The excited state life times (radiative) of the PBIPC in various solvents (toluene, DMF, DCM, THF and DMSO) are illustrated in Fig. S9† and the corresponding excited singlet state lifetimes data is summarized in Table 1. Further, the polarity of the solvents is bound to affect the excited state lifetimes.
Electrochemical studies
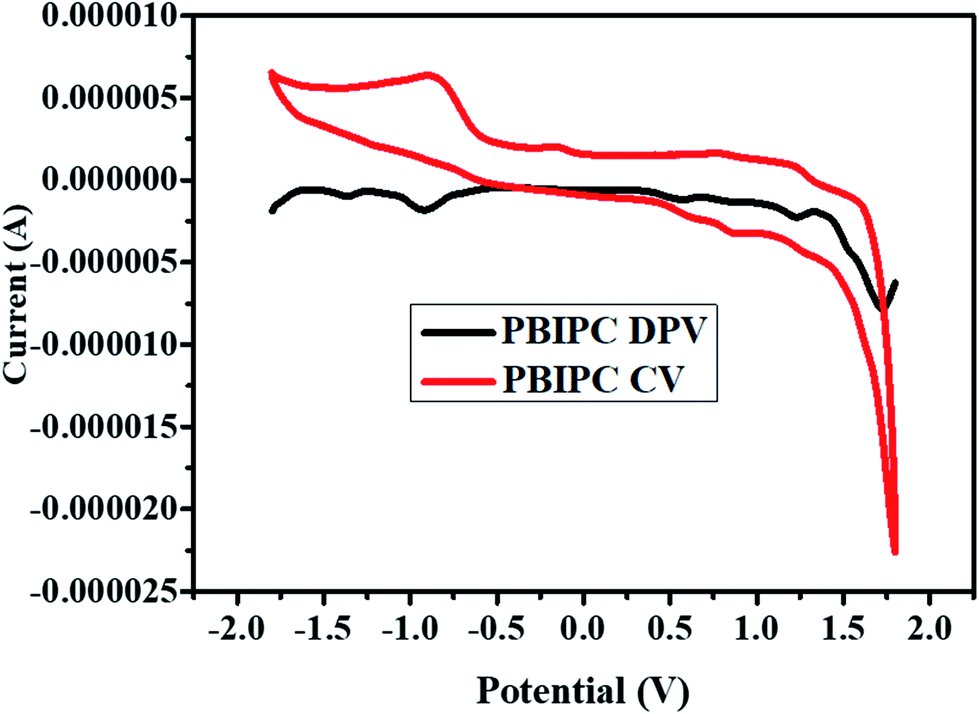
The redox behavior of PBIPC was studied by engaging the cyclic voltammetric studies. Generally, phthalocyanines are 18 π-electron aromatic systems and this brings two negative charges in the molecules common oxidation state. The aromatic system in phthalocyanines can get oxidized by losing one/two electrons and can be reduced by gaining 1–4 electrons. The present phthalocyanine (PBIPC) underwent two one electron reversible oxidations besides two one electron either reversible or quasi-reversible reductions. The deviations in electron density of the phthalocyanine brought by the substituent groups present on the macrocycle, which influences the relative positions of the HOMO, LUMO levels. The redox potentials of PBIPC carried out by cyclic voltammetry and differential pulse voltammetric techniques in anhydrous dichloromethane solvent by using 0.1 M tetrabutylammonium perchlorate (TBAP) as a supporting electrolyte and ferrocene as an external standard (Fig. 5).
 |
| | Fig. 5 Cyclic voltammogram of PBIPC in THF using a glassy carbon electrode. | |
From these detailed studies, the oxidation and reduction potentials for PBIPC were found to be 0.57 & 1.21 V and −0.95 & −1.37 V, respectively. Based on the redox couples of PBIPC one can explain that phthalocyanines have the eminent electrochemical behavior and which are assigned to the phthalocyanine molecular ring. Further, the redox couples' nature was confirmed using the spectroelectrochemical studies.
Spectroelectrochemical studies
Fig. 6(a)–(d) elucidate the spectral changes of PBIPC at particular applied potentials in DCM solvent. For an applied potential of 0.65 V, the intensity of the Q-band (at 695 nm) was reduced and there was a slight decline in the intensity of both B-bands (at 344 nm and a shoulder peak at 636 nm). The clear isosbestic points were observed at 460, 612, 729 nm. But, no change in the shape of both Q-band and B-bands were observed. The oxidation of the [ZnIIPc2−] to [ZnIIPc1−]1+ is responsible for these absorption changes. Further oxidation at an applied potential of 1.35 V [Fig. 6(b)], the Q-band at wavelength 695 nm reduced in its intensity without any further shift, which supports the characteristic ring oxidation process. On the other hand, at wavelength 329 nm a rise in its intensity was observed and the shoulder peak at 632 nm almost diminished. Clear isosbestic points were recorded at 354 nm, 424 nm, 608 nm, 727 nm and this was due to further oxidation of monocationic species, sustaining the CV assessment of couple to [ZnIIPc1−]1+/[ZnIIPc0]2+.
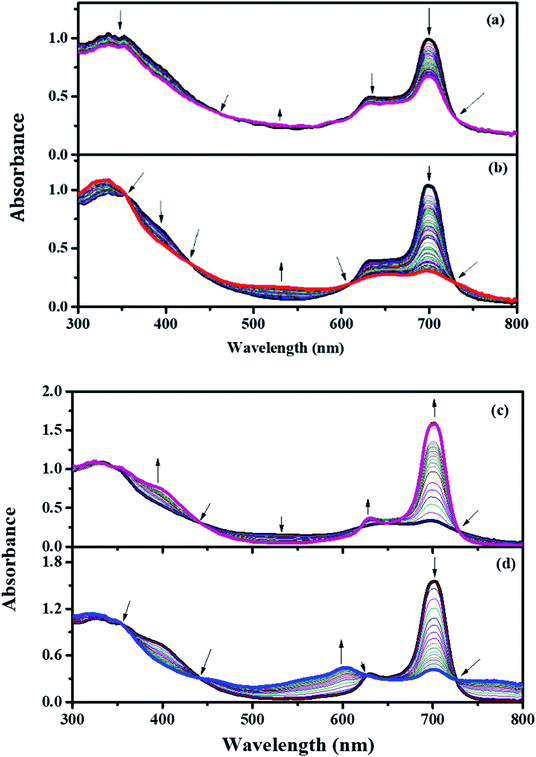 |
| | Fig. 6 In situ UV-visible spectro-electrochemical changes of PBIPC Eapp = 0.65 V (a) Eapp = 1.35 V (b) Eapp = −1.05 V (c) Eapp = −1.50 V (d). | |
The spectroelectrochemical graph recorded at a potential of −1.05 V [Fig. 6(c)] illustrates the spectral changes at 695 nm with a new shoulder peak at 629 nm and with increasing intensity a new band at 396 nm was observed. However, at 329 nm there were not many changes in the intensity of B-band. The distinct isosbestic points were observed at wavelengths of 442 nm, 622 nm, 651 nm and 727 nm. While performing the reduction process one can tell that there was formation of single product. The changes were attributed to the ring-based oxidation and are assigned to [ZnIIPc2−]/[ZnIIPc3−]1−.56–58 Similarly, at −1.50 V potential [Fig. 6(d)] a further reduction of the monocationic species confirmed the cyclovoltametric assignment of couple to [ZnIIPc3−]1−/[ZnIIPc4−]2−. At this second reduction potential, the B band intensities were found to be decreased and the Q-band intensities were found to be raised, which explains the characteristic reduction in the macrocycle.
Theoretical calculations
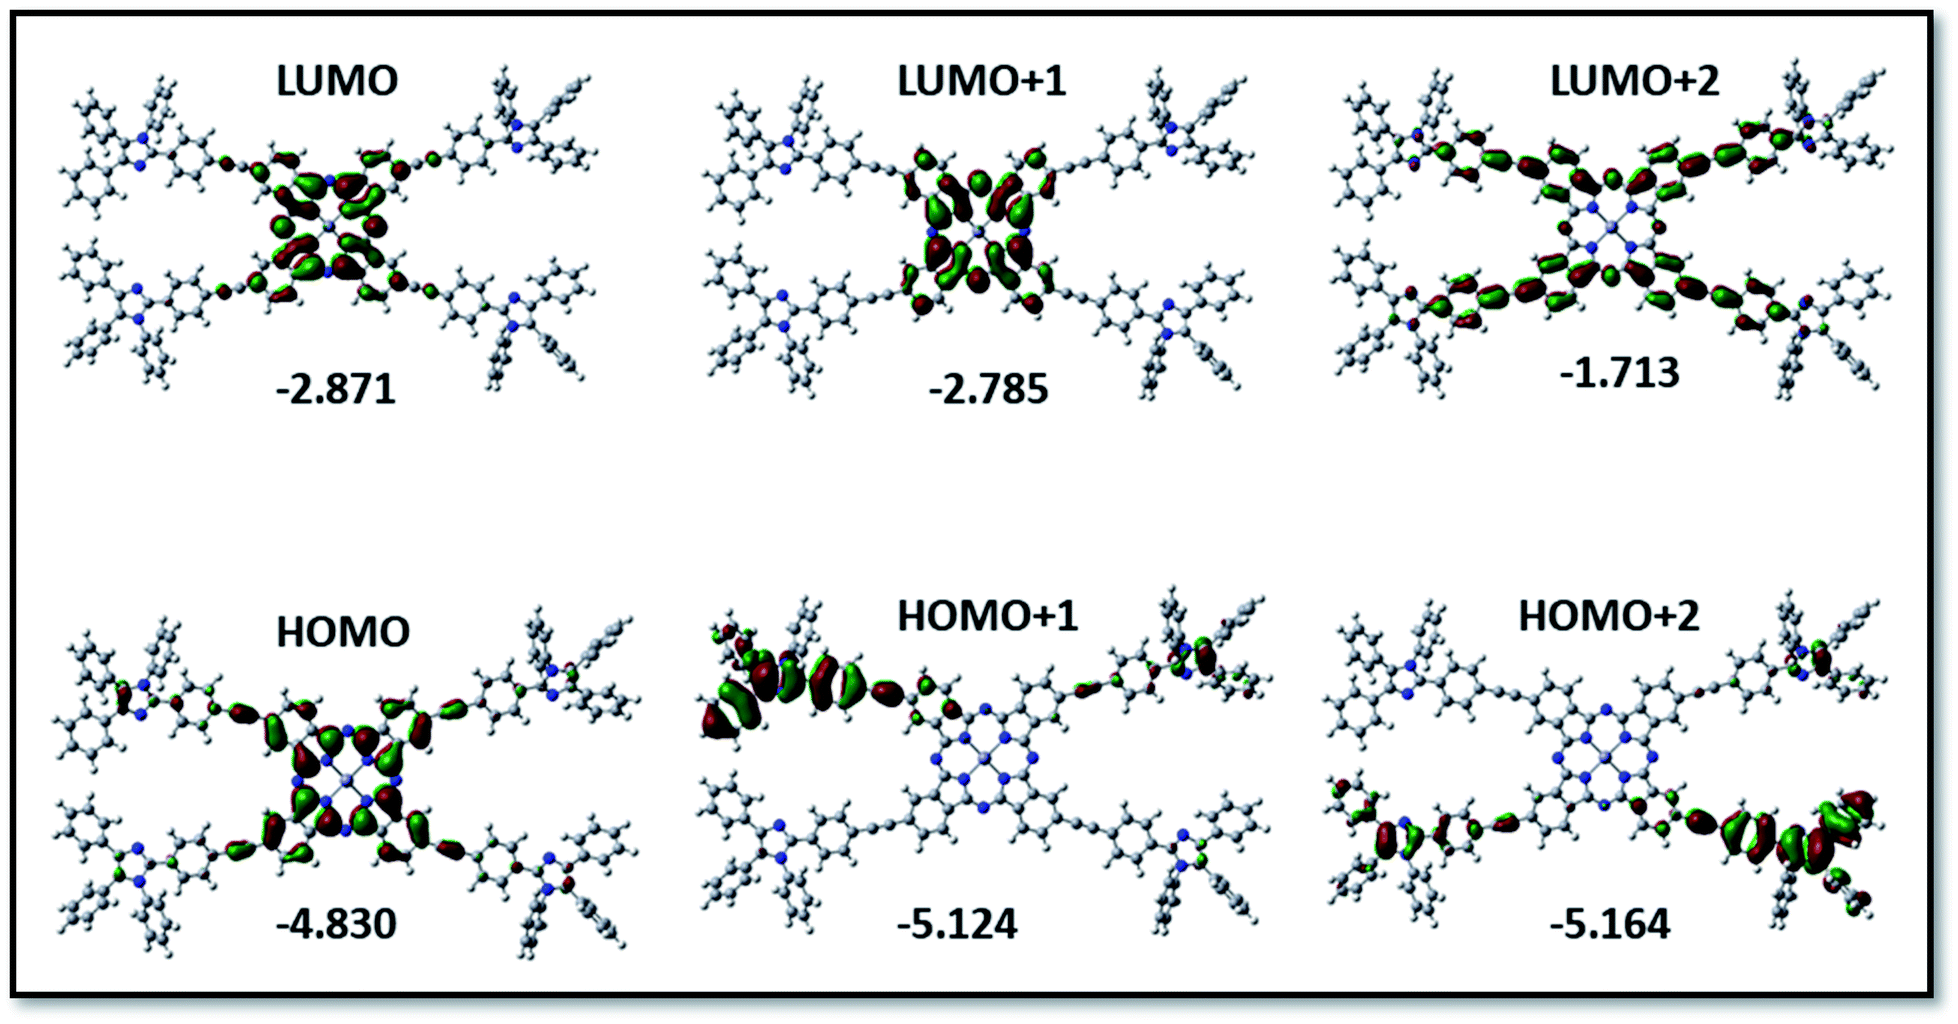
The structural, optical along with the redox properties of PBIPC were evaluated using the DFT and time-dependent DFT with a functional basis set of B3LYP/6-31G (d,p) level from the Gaussian 09 package. The ground state optimized structure for PBIPC is shown in Fig. S10,† which clearly explains the spatial arrangement of the triphenyl imidazole group on the phthalocyanine macrocycle. The minimum energy conformation suggesting the optimized PBIPC derivatives exhibited the highest occupied molecular orbital (HOMO) besides the lowest unoccupied molecular orbital (LUMO) levels. HOMO, LUMO, and the HOMO–LUMO gap energies and ground state dipole moment (in Debye units) are depicted in Fig. 7 and Table S1,† respectively. In the present PBIPC phthalocyanine, electron density of HOMO, LUMO are situated on the phthalocyanine ring at −4.830 and −2.871, respectively, and that of HOMO−1 (−5.124) and LUMO+1 (−2.785) are occupied in the phthalocyanine ring and triphenyl imidazole moiety, respectively. At HOMO−2 (−5.164) and LUMO+2 (−1.713) the electron cloud is present on triphenyl imidazole moiety and the phthalocyanine, respectively. However, the electron density distribution is indistinct to distinguish the electron donor and acceptor and, consequently, trivial changes of charge generation occurred in PBIPC. The TD-DFT studies of PBIPC were employed at the B3LYP/6-31G(d,p) level and polarizable continuum model (PCM) in THF as the solvent and M06-2X function. These results are in excellent agreement with the obtained experimental values (Fig. S8 of ESI†). The calculated vertical excitation energies for the singlet along with the calculated oscillator strengths are summarized in Table S2.†
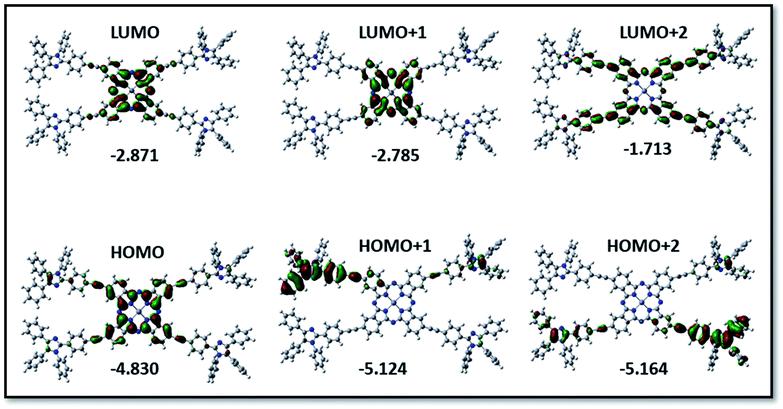 |
| | Fig. 7 Isodensity plots of FMOs and the energy values in eV by using the B3LYP method 6-31G (d,p) for PBIPC. | |
Nonlinear optical studies
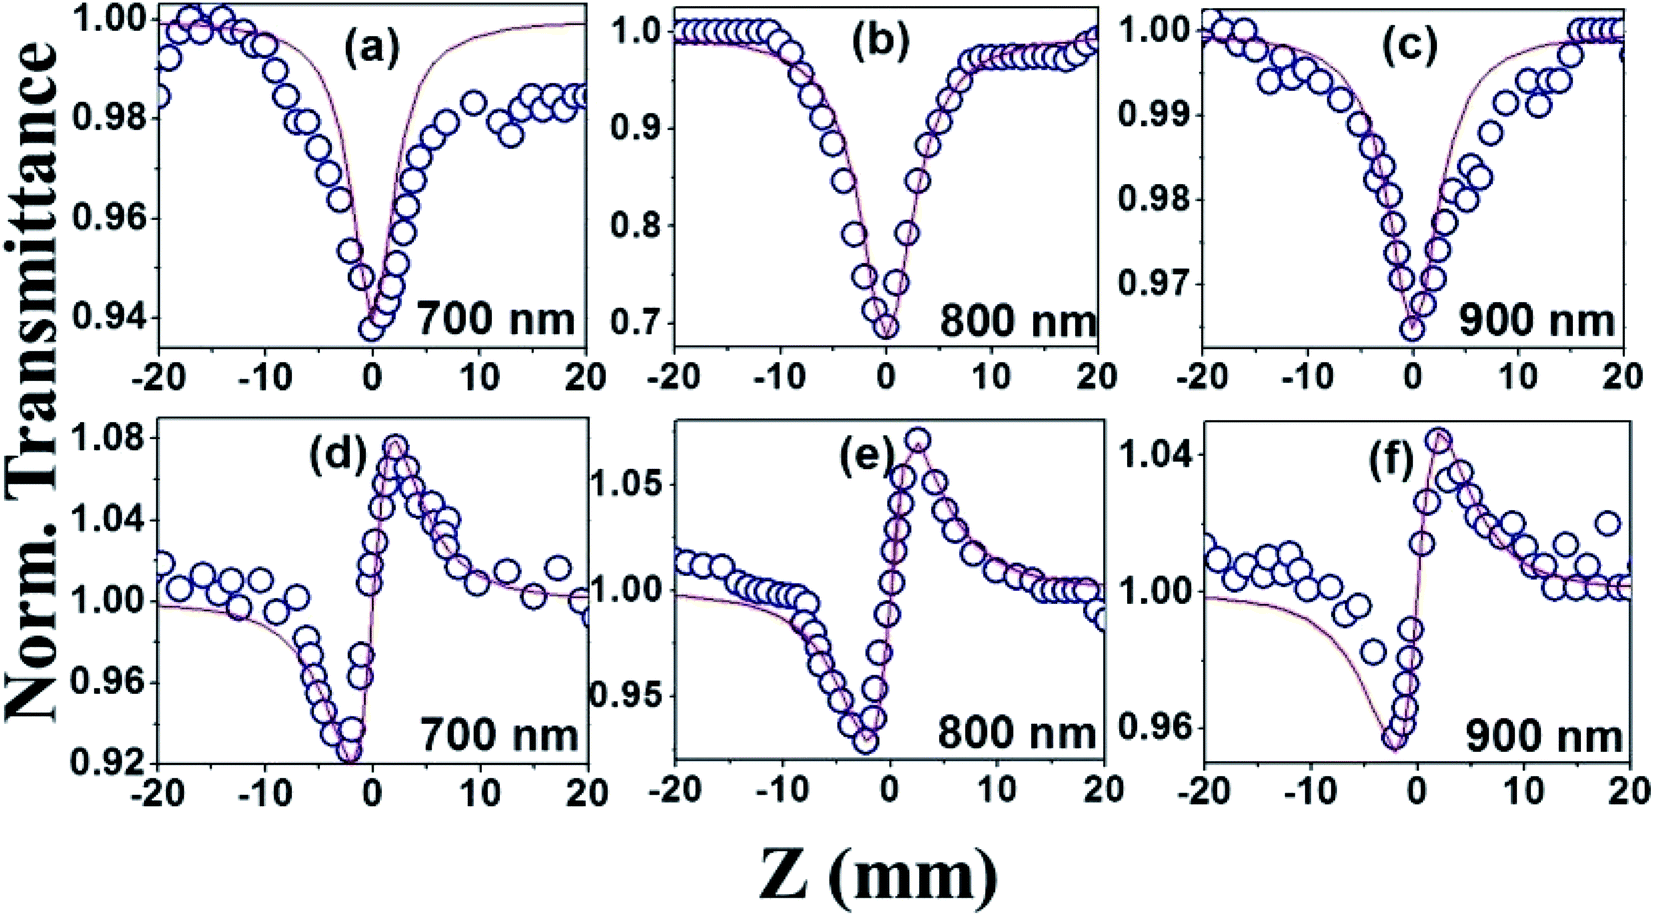
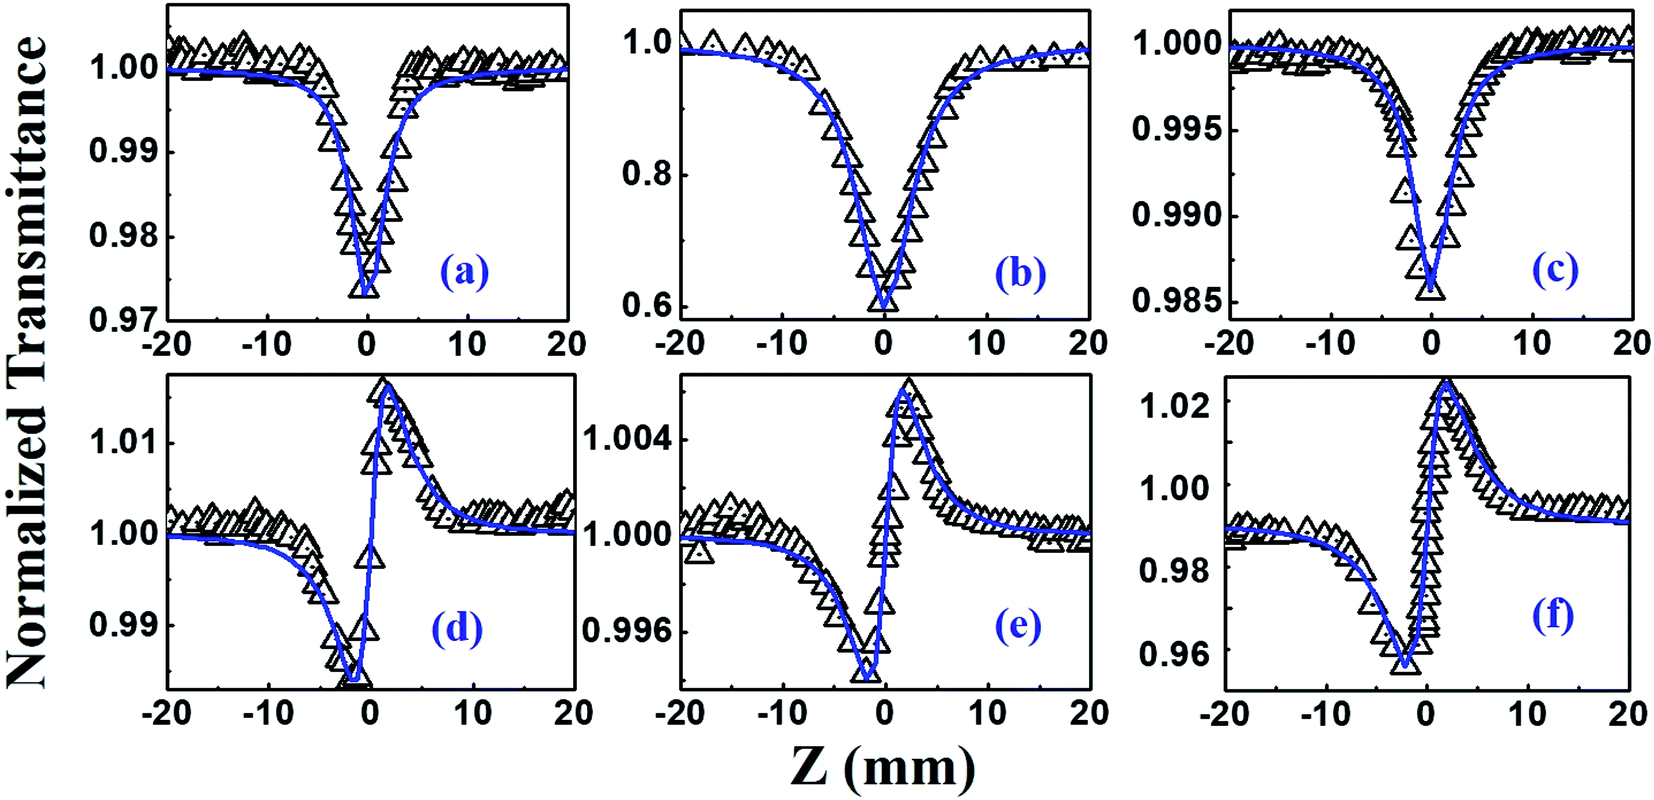
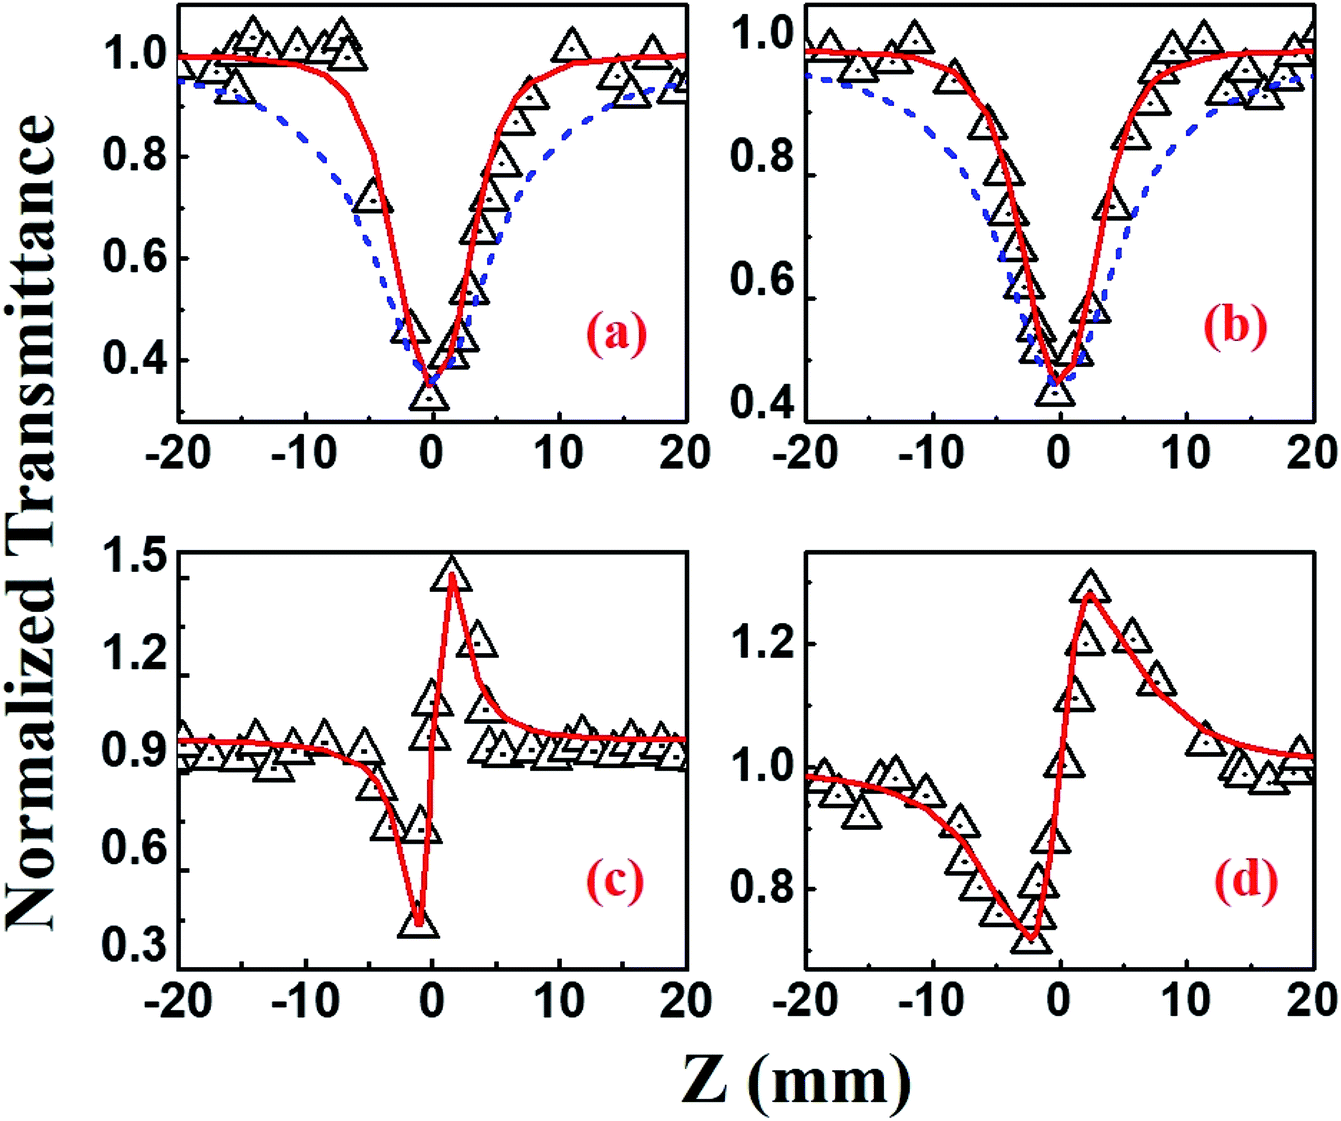
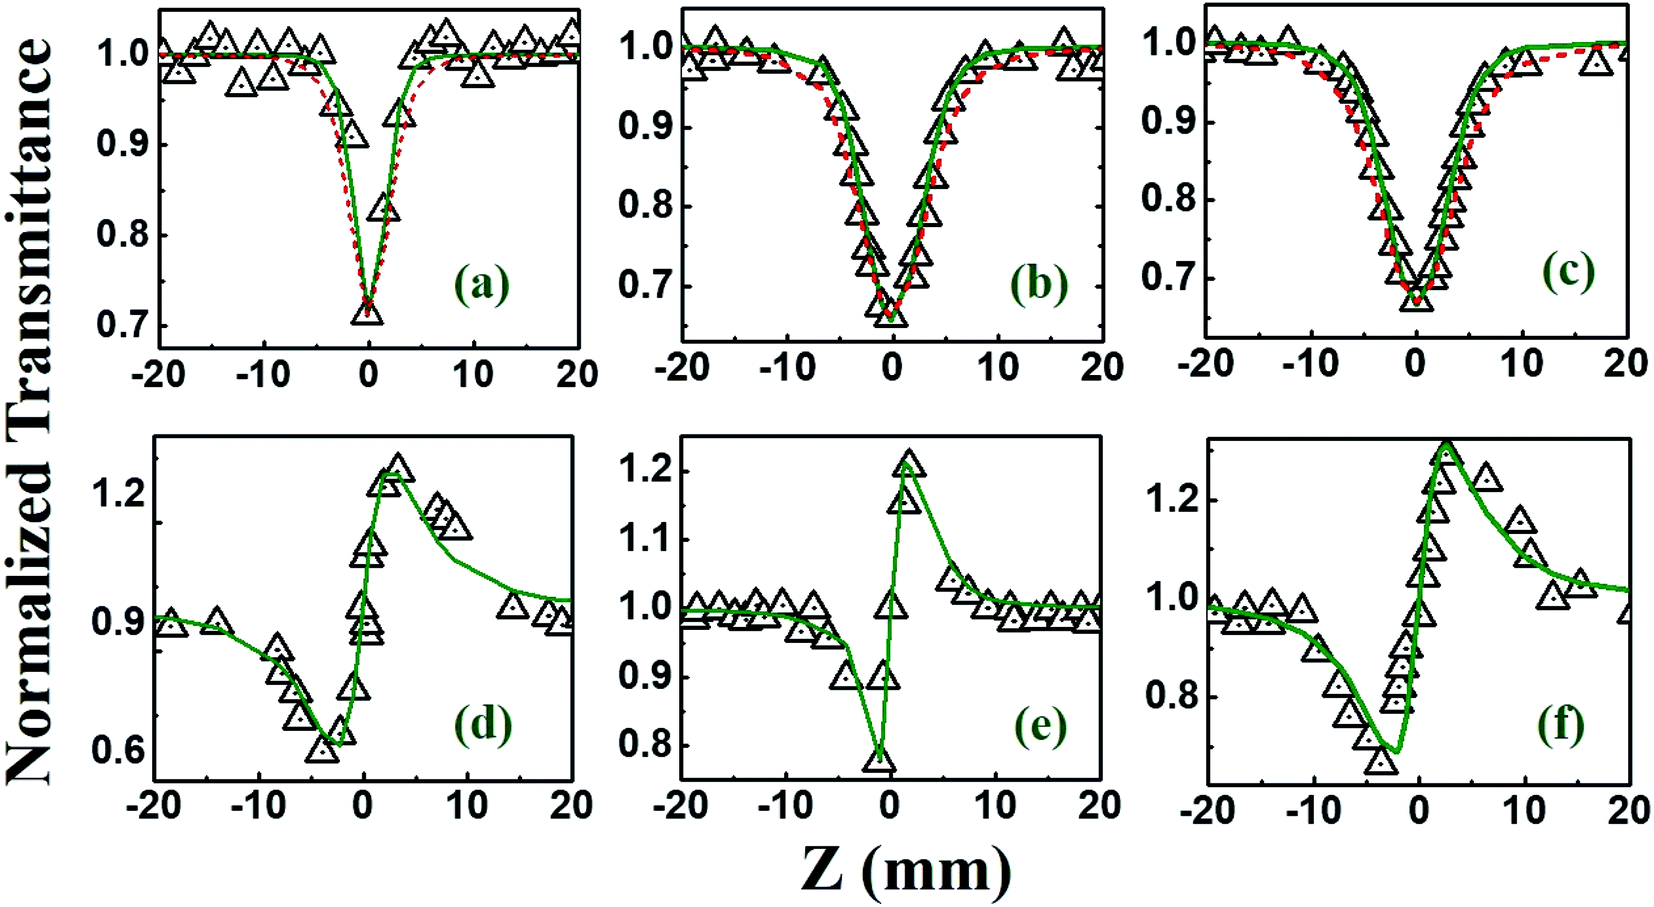
The NLO studies for 0.07 mM solution of PBIPC in THF solvent were initially performed with 150 fs, 80 MHz pulses (obtained from a fs oscillator). All the details of the Z-scan experiments are documented in our earlier works.46,47 The solutions were placed in a 1 mm cuvette (thickness was less than the Rayleigh range), satisfying the thin-sample approximation during the Z-scan data analysis. The input peak intensities used were 20–60 GW cm−2 and the Rayleigh range was in the 1.9–2.8 mm range for the 700–900 nm spectral window. The concentrations of the solutions used in the NLO and TAS studies (presented in a later section) were low (typically <70 μM) and the possibility of aggregate formation in such a case is highly improbable. Fig. 8(a)–(c) illustrate the open aperture Z-scan data while Fig. 8(d)–(f) illustrate the closed aperture Z-scan data of PBIPC in the 700–900 nm spectral range. PBIPC exhibited RSA for all the cases at the reported peak intensities with 2PA as the best fit. The corresponding absorption coefficients (α2) were found to be in the range of (2.48–5.00) × 10−8 cm W−1. PBIPC in THF exhibited positive nonlinearity for all wavelengths with nonlinear refractive index (n2) values in the range (0.76–1.75) × 10−8 esu. Corresponding third order nonlinear susceptibilities [χ(3)] and 2PA cross sections (σ2) were estimated and are summarized in Table 2. However, due to high repetition rate, there are possibly cumulative effects accompanying the nonlinearity such as thermal lensing or thermo-acoustic effects, affecting the NLO coefficients by few orders of magnitude.59 Our earlier studies on similar molecules demonstrated that the major contribution to the nonlinear absorption when excited with nJ, MHz, 800 nm pulses (from fs oscillator) was from the instantaneous TPA and/or partial contributions from excited state absorption (minimal) and thermal lensing.39,46 Hence, we performed the NLO studies with a much lower repetition rate (1 kHz, ∼70 fs, obtained from a fs amplifier/optical parametric amplifier) laser pulses. Here, we recorded the Z-scan data from the visible to NIR (600 nm to 1.2 μm) wavelength range. Fig. 9 and 10 illustrate both the open aperture and closed aperture Z-scan data obtained in these spectral regions. The input peak intensities were maintained in the 139–370 GW cm−2 range and the Rayleigh range varied from 1.9 mm to 4.7 mm. The NLO studies in kHz regime, recorded for 600–800 nm, exhibited two-photon absorption with nonlinear absorption coefficient, α2 as (2.0–12.0) × 10−11 cm W−1 and positive nonlinearity of refractive index, n2 in the range of (0.43–2.9) × 10−13 esu. In the NIR spectral range, we observed that for wavelengths of 1.0 μm and 1.2 μm, 3PA equation fitted the experimental data better then 2PA [see Fig. 10 data] with the magnitude of nonlinear absorption coefficient, α3, to be 2.7 and 4.6 × 10⁻²¹ cm3 W−2, respectively. The n2 was found to be of same sign as for the visible range with self-focusing n2 values of (20.0 and 54.0) × 10−13 esu (Fig. 9).
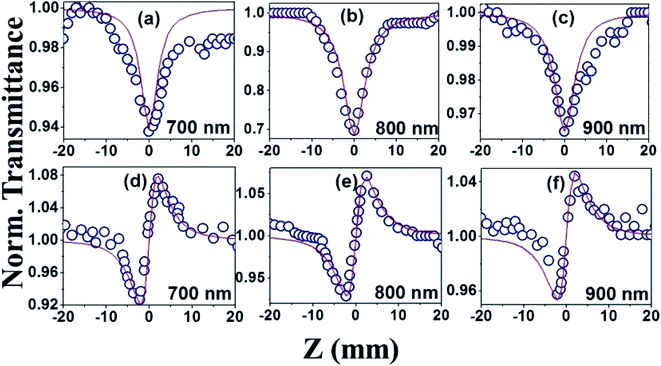 |
| | Fig. 8 (a), (b) and (c) Open aperture Z-scan data and (d), (e) and (f) closed aperture Z-scan data of PBIPC recorded at wavelengths of 700 nm, 800 nm and 900 nm, respectively, with 150 fs, 80 MHz pulses. The experimental data (blue, open circles) are best fitted (red, solid lines) for 2PA and positive nonlinear refraction. | |
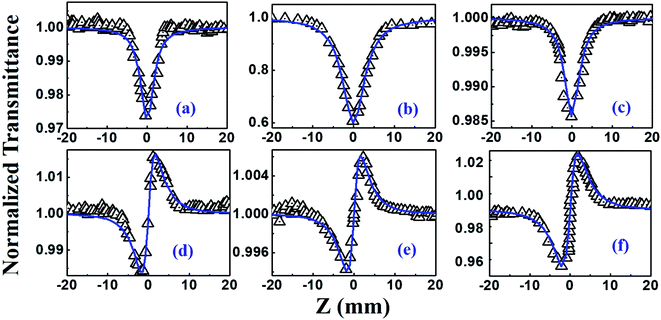 |
| | Fig. 9 (a), (b) and (c) Open aperture Z-scan data (d), (e) and (f) closed aperture Z-scan data of PBIPC recorded at wavelengths of 700 nm, 800 nm and 900 nm, respectively, with 70 fs, 1 kHz pulses. The experimental data (in black, open triangles) are best fitted (blue, solid lines) for 2PA and positive nonlinear refraction. | |
Table 2 Summary of NLO coefficients of PBIPC for different wavelengths at both kHz and MHz pulse regime
| λ (nm) |
n2 cm2 W−1) × 10−16 |
n2 (esu) × 10−13 |
Re|χ(3)| m2 V−2 × 10⁻²³ |
α2 (cm W−1) × 10−11 |
α3 (cm3 W−2) × 10−21 |
α4 (cm5 W−3) × 10−32 |
σ2P (GM) |
σ3P (cm6 s2) × 10−78 |
σ4P (cm8 s3) × 10−108 |
Im|χ(3)| m2 V−2 × 10⁻²³ |
χ(3) esu × 10−15 |
| PBIPC kHz pulses |
| 600 |
0.12 |
0.43 |
0.14 |
2.0 |
— |
— |
1570 |
— |
— |
1.14 |
1.31 |
| 700 |
0.81 |
2.90 |
0.97 |
3.0 |
— |
— |
2019 |
— |
— |
1.99 |
7.08 |
| 800 |
0.92 |
0.57 |
0.19 |
12.0 |
— |
— |
7080 |
— |
— |
9.13 |
6.68 |
| 1000 |
5.65 |
20.0 |
6.69 |
— |
2.7 |
— |
— |
2.53 |
— |
— |
— |
| 1200 |
15.2 |
54.0 |
18.4 |
— |
4.6 |
— |
— |
2.99 |
— |
— |
— |
| 1300 |
38.6 |
13.8 |
4.60 |
— |
— |
7.4 |
— |
— |
62.7 |
— |
— |
| 1400 |
31.9 |
11.4 |
3.81 |
— |
— |
0.49 |
— |
— |
3.32 |
— |
— |
| 1500 |
28.9 |
10.3 |
3.45 |
— |
— |
2.2 |
— |
— |
12.1 |
— |
— |
| λ (nm) |
n2 (cm2 W−1) × 10−12 |
n2 (esu) × 10−8 |
Re|χ(3)| m2 V−2 × 10⁻¹⁸ |
α2 (cm W−1) × 10−8 |
σ2 × 10⁴ (GM) |
Im|χ(3)| m2 V−2 × 10⁻²⁰ |
χ(3) esu × 10−10 |
| PBIPC MHz pulses |
| 700 |
2.14 |
0.76 |
2.55 |
2.48 |
1.67 |
16 |
1.83 |
| 800 |
2.14 |
0.76 |
2.55 |
5.00 |
2.94 |
38 |
1.85 |
| 900 |
4.89 |
1.75 |
5.84 |
3.20 |
1.67 |
27 |
4.19 |
 |
| | Fig. 10 (a) and (b) Open aperture Z-scan data (c) and (d) closed aperture Z-scan data of PBIPC at wavelengths of 1000 nm and 1200 nm, respectively, and kHz excitation. Black triangles represent the experimental data while red, solid lines represent the 3PA fits. Blue, dashed lines represent 2PA fits in (a) and (b). | |
Beyond 1.2 μm, the NLO data recorded in the range of 1.3–1.5 μm depicted 4-photon absorption (4PA) as the predominant nonlinear absorption phenomenon with positive nonlinearity [Fig. 11]. The four-photon absorption coefficient, α4, range was (0.49–7.4) × 10−32 cm5 W−3 while n2 was in the range of (10.3–13.8) × 10−13 esu. Using these parameters, we further calculated the corresponding third-order NLO susceptibilities [χ(3)] and nonlinear absorption cross-sections (σn), which are summarized in Table 2. The errors in all these measurements were approximated to be ±7%, arising from errors in (a) the estimation of beam waist and, subsequently, the input peak intensity (b) fitting procedures and (c) fluctuations in the input laser intensity. Further, the contribution of the solvent THF to the magnitude of NLO coefficients [measured separately using the solvent alone in both the MHz (oscillator) and kHz (amplifier) Z-scan studies] was quite small (at least 1 order of magnitude lower) and, hence, has been neglected in all these studies. Earlier comprehensive NLO studies have confirmed the true magnitude of n2 in THF to be ∼10−17 cm2 W−1 obtained with fs, kHz pulse excitation.60,61 From Table 2 data we can see that PBIPC possesses strong NLO properties with large 2PA cross-sections in the range of 1570–7080 GM in the kHz regime, which are on par with a few of the recently reported potential two-photon excitation (TPE) PDT molecules62–64 making it ideal for applications in TPE PDT. Recently, bisphthalocyanine sandwich complexes have also attracted the attention of NLO community due to their enhanced conjugation leading to overlapping of π-orbitals of their ligands and large ionic radius of the rare earth central metals. These complexes have been studied in detail and they exhibited superior NLO properties when compared to monomeric phthalocyanine complexes.65–67 Table 2 also summarizes the strong three-photon and four-photon absorption coefficients and cross-sections of PBIPC in the NIR wavelength range. These NLO coefficients and cross-sections obtained for PBIPC are found to be superior in comparison with some of the recently reported phthalocyanine moieties making it an ideal candidate for probing its capability in applications such as (a) three-photon pumped (3PP) and frequency upconverted lasing (b) three-photon absorption (3PA) based optical power limiting and stabilization (c) 3PA-based bio-imaging by means of IR to visible conversion (d) data storage and others.68–71
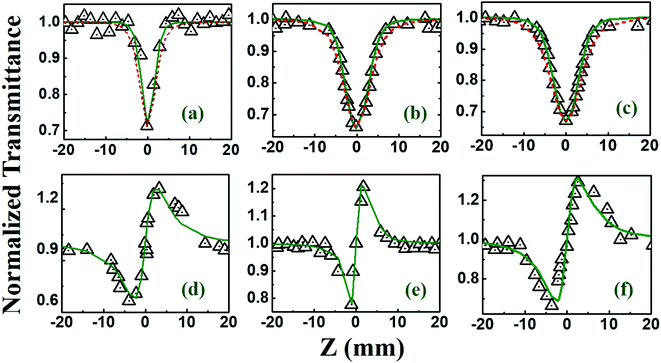 |
| | Fig. 11 (a), (b) and (c) Open aperture Z-scan data (d), (e) and (f) Closed aperture Z-scan data of PBIPC recorded at wavelengths of 1300 nm, 1400 nm and 1500 nm, respectively, for kHz pulse regime. Black triangles represent the experimental data while green, solid lines represent the 4PA fits. Red, dashed lines represent 3PA fitted curves in (a), (b), and (c). | |
A direct comparison with the recent studies74 performed under similar experimental conditions (fs pulse duration and kHz repetition rate pulses near 800 nm) on a tetraoxa[22]porphyrin(2.1.2.1)s clearly reveals that the 2PA cross-sections obtained in our case (1570–7080 GM) are superior than theirs (13–29 GM). Two sterically demanding zinc phthalocyanines were earlier investigated by our group39 and the β values obtained in that case were 2.3–6.5 × 10⁻¹¹ cm W−1 obtained with 1.5 picosecond pulses (much longer pulses than those used here) where in the present case we obtained values of 2–12 × 10−11 cm W−1. The 2PA cross-sections retrieved were slightly higher in that case but were achieved with much longer laser pulses. A maximum of 550 GM was obtained for zinc(II) 2,10,16,24-tetrakis(9-phenyl-9H-carbazol-2-yl)-phthalocyanine and zinc(II) 2,10,16,24-tetrakis(4-(9H-carbazol-9-yl)phenyl)phthalocyanine investigated by our group47 under similar experimental conditions. Additionally, here we have demonstrated strong 3PA and 4PA coefficients and cross-section suggesting the possible application of our molecule in the nonlinear bio-imaging applications. We believe that the large macrocycle structure (with peripheral constituents) providing a large number of delocalized π-electrons has contributed to the observed large third-order nonlinear coefficients. Very recently twisted π-conjugated chromophores demonstrated large NLO coefficients (e.g. α3 = 1.4 × 10⁻³³ esu) making them ideal for applications in organic photovoltaics and OLEDs.72 However, Table 2 data clearly suggests our molecule to be superior to the twisted π-conjugated chromophores.
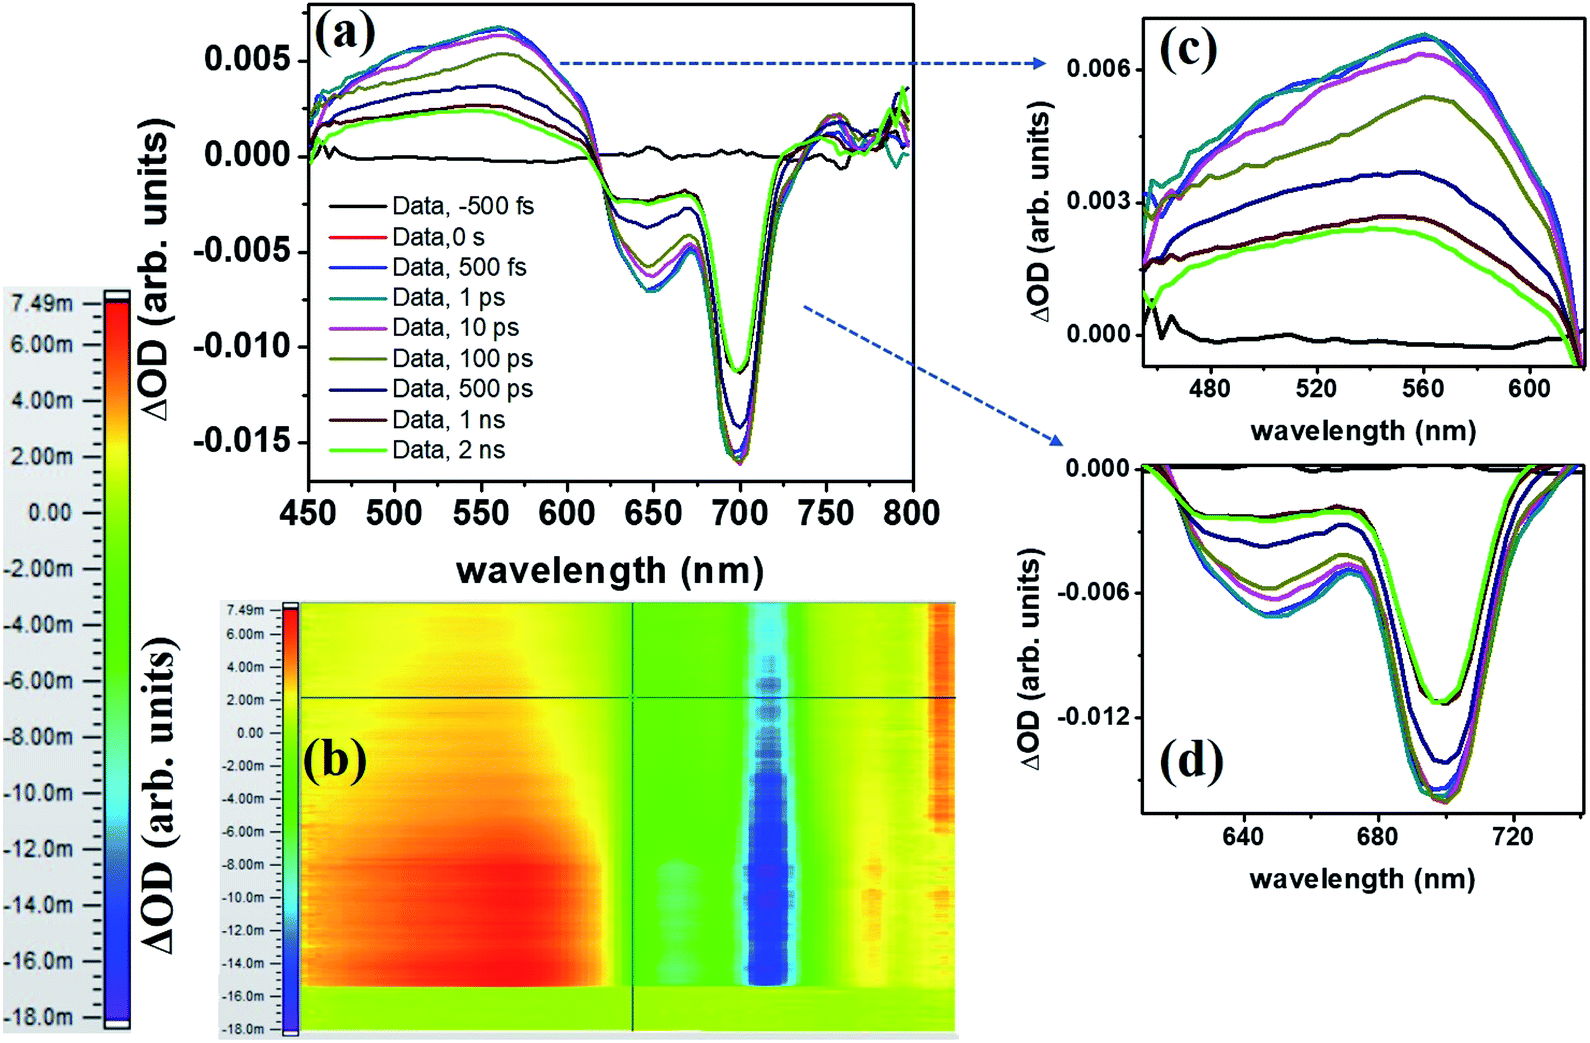
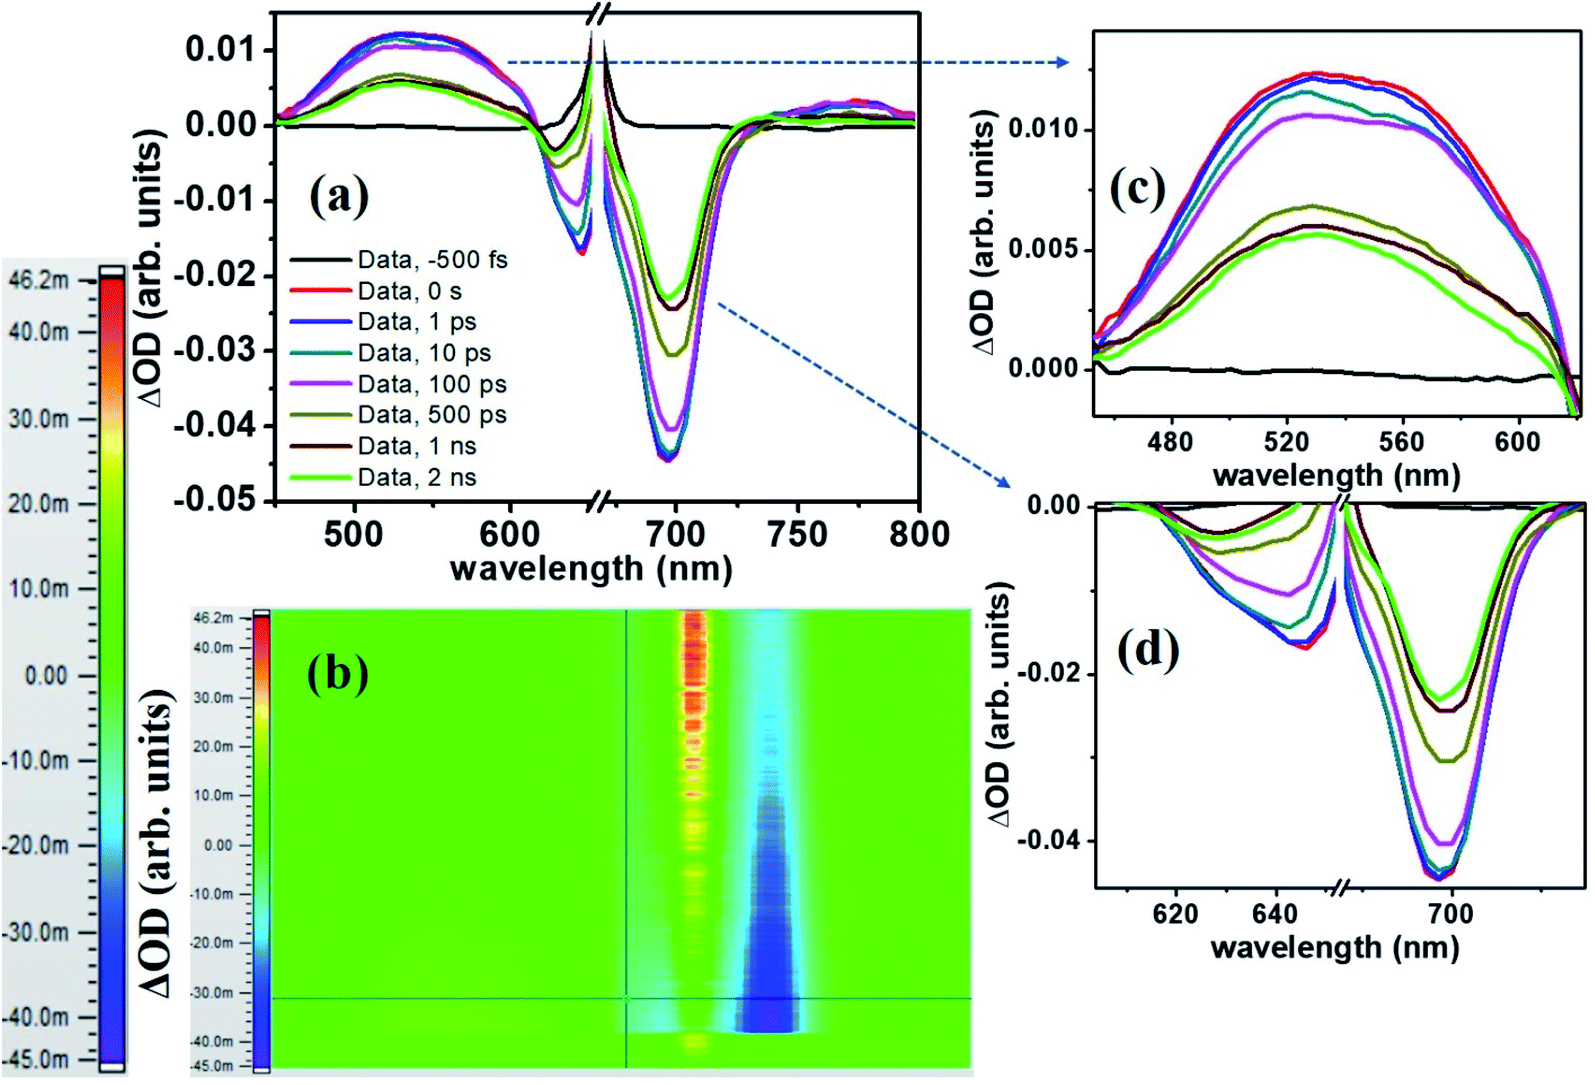
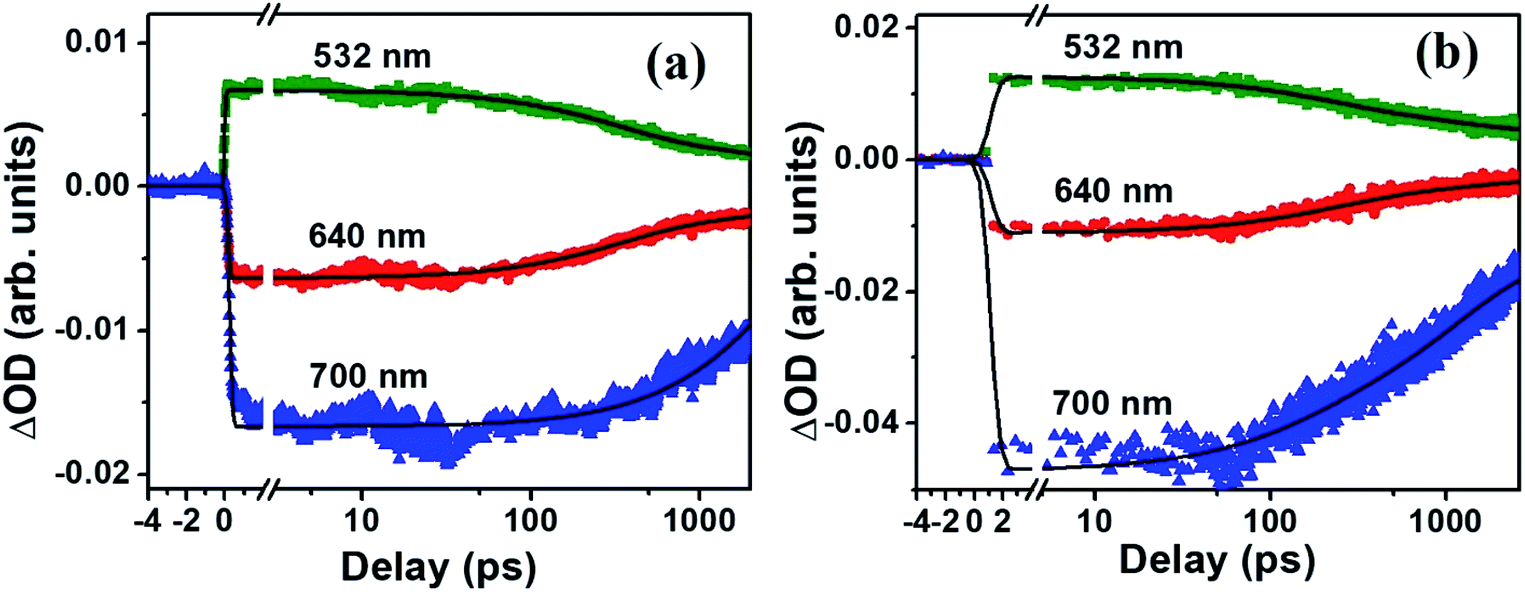
Femtosecond TAS studies
The molecule PBIPC in THF was excited at Soret band tail end, 400 nm and shoulder end of B-band at 650 nm. The spectra were probed for a wavelength range of 440 nm to 800 nm (see ESI Fig. S11† for the complete experimental setup details) up to a delay of ∼2 ns as shown in Fig. 12 and 13(a)–(c). Both the spectra depicted similar ground state recovery (GSB) as negative signal in the spectra but different transient absorption (TA) signatures as seen by the positive signal in the spectra. The TA spectra are seen to be broad, overlapping with the GSB spectra which indicate the possibility of triplet state transitions. This is a typical phenomenon in most phthalocyanines and similar molecules such as porphyrins making them ideal for applications in solar cells and PDT.27,28 The transient maximum for 400 nm excitation pump and 650 nm excitation was at 532 nm. The presence of imidazole substituent with ZnPc has been known to shorten both fluorescence lifetime (τf) and quantum yield (ϕf) due to photoinduced electron transfer from imidazole to excited Pc unit.73,74 From Fig. 12(c) and 13(c), it is observed that the bleach signal shows significant shift from ground state absorption spectra of PBIPC in THF solvent (Fig. 2) which is due to the spectral overlap of TA signal. It is evident that, as TA signal decreases, the red shift of the bleach signal (GSB) from ground state absorption signal decreases, indicating a concomitant behavior. A small contribution from stimulated emission (SE) is also expected around fluorescent peak at 704 nm [Fig. 12(c) and 13(c)]. No contribution from aggregation can be seen as PBIPC in 0.07 mM THF solution was used, suggesting its existence in monomeric form [as mentioned in the Emission studies section]. Further, THF has low polarity and the presence of imidazole group attached to our phthalocyanine molecule increases the solubility.75 From the TA spectra (kinetics), three timescales can be distinguishably observed: a small decay within first 50 ps (first lifetime < 50 ps), a significant decay from 100 ps to 500 ps (second lifetime < 500 ps) and then a slow decay from 500 ps till ∼2 ns (third lifetime > 1 ns). These data were corrected for the coherent artifact, pump scattering, white light dispersion, and polarization etc. accompanying typical TAS data76 by aligning the pump and probe beams at magic angle while the spectral corrections were achieved via Surface Xplorer software. Each peak maximum was fitted with multi-exponential decay fit applying to a three-level kinetic model.22 The instrument response function was measured to be 0.12 ps. From the kinetic fittings we obtained three lifetimes at transient absorption peak whereas only two distinct lifetimes for ground state recovery signals which are summarized in Table S3 (ESI†). Considering the kinetic model, the transient absorption signal decays from second excited state, S2 to vibrationally higher first excited state  via internal conversion within τ1. This is followed by vibrational relaxation of the excited S1 state in τ2 ps and subsequently the molecule eventually relaxes via radiative or intersystem crossing to lower energy state with τ3 ns lifetime. For ground state recovery, the molecule undergoes vibrational relaxation in S1 followed by intersystem crossing ∼1 ns. Q-band excitation of PBIPC has shown relatively longer lifetimes as compared to 400 nm, Soret band excitation. This is due to the fact that Q-band essentially corresponds to the ZnPc moiety of the molecule only. Thus, we can say that the peripheral substituents play an essential part in quenching of the transient lifetimes of PBIPC via charge transfer upon 400 nm excitation thus reducing the ISC lifetimes. These results are consistent with the results reported by Zhang's group73 who studied the triplet state of an imidazole and a methyl imidazole substituted zinc-phthalocyanine (ZnPc) and compared the effect of peripheral substituent on ISC, triplet lifetimes and triplet yield. Another group80 studied the effect of 3,4-(dimethoxyphenylthio) substituent on various metal phthalocyanines to show that the singlet oxygen quantum yield (ϕΔ) was affected by Soret band only (which explain lifetime quenching of PBIPC at 400 nm excitation) and the Pc-complex with Zn as central metal depicted superior photophysical characteristics over other metals. Thus, in case of fluorescence lifetime of PBIPC in THF being ∼3.86 ns with quantum yield of 0.22, the possibility of excited molecules to go to the triplet state is high which can only be qualitatively analyzed within current experimental conditions and the data obtained. The results obtained in the present work are also compared with that of Corroles – TTC and its metal derivatives (similar to phthalocyanines) – reported recently by Raavi et al. for both singlet and triplet state lifetimes.81 The intersystem crossing time in their case was found to be comparable with our molecule. The detailed quantitative study of triplet lifetimes will be performed in future. Our molecule has exhibited very long-lived excited state dynamics as compared to other zinc phthalocyanines and their derivatives proving its potential in PVs (photovoltaics) and PDT.76–80
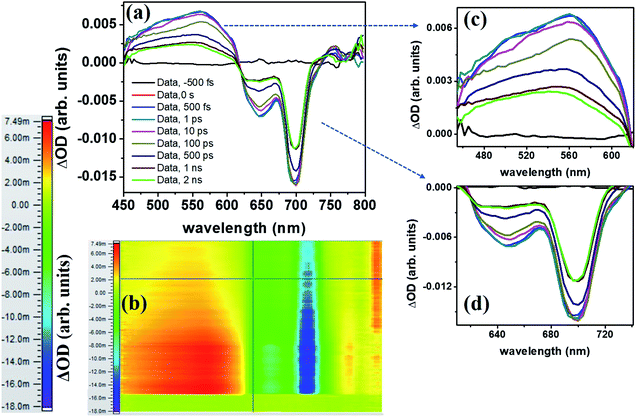 |
| | Fig. 12 (a) fs-TAS spectra of PBIPC at excitation wavelength 400 nm (b) 2D spectra showing the change in absorbance (color scale) of spectra with both time and wavelength. (c) TA spectra showing peak maximum at 532 nm at various probe delays. (d) Bleach signal at various delays showing slight shift in the peak maxima with increase in delay illustrating SE contribution. Peak maxima were taken at 640 nm and 700 nm. | |
 |
| | Fig. 13 (a) fs-TAS spectra of PBIPC at excitation wavelength 650 nm (b) 2D spectra showing the change in absorbance (color scale) of spectra with both time and wavelength. (c) TA spectra showing peak maximum at 532 nm at various probe delays. (d) Bleach signal at various delays showing slight shift in the peak maxima with increase in delay illustrating SE contribution. Peak maxima were taken at 640 nm and 700 nm. | |
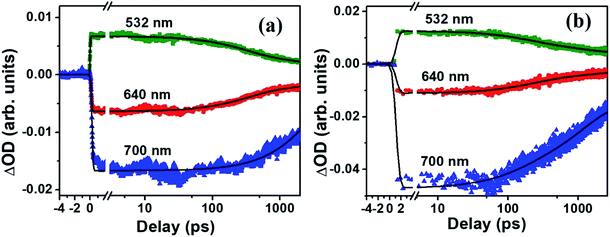 |
| | Fig. 14 (a) fs-TAS kinetics of PBIPC at an excitation wavelength of 400 nm for TA maximum 470 nm (green), GSB/SE maximum 650 nm (red) and 698 nm (blue) (b) fs-TAS kinetics of PBIPC at an excitation wavelength of 650 nm for TA maximum 532 nm (green), GSB/SE maximum 632 nm (red) and 698 nm (blue). The kinetics have been plotted in normal scale up to 4 ps and for the time scales 4 ps to 2 ns it is plotted in logarithmic scale. Symbols are the experimental data while the solid lines are theoretical fits. | |
Conclusions
In summary, we have designed and developed the novel triphenyl imidazole phthalocyanine, PBIPC, and employed the photophysical, electrochemical, NLO properties. By recording the absorption spectra in THF and DCM at various concentrations we have explored the aggregation phenomena. A broadened absorption in the Soret band is caused due to the incorporation of triphenyl imidazole moiety. The ring centered oxidation and reduction processes explained by conducting the cyclovoltametric and spectroelectrochemical studies. NLO properties of PBIPC using the Z-scan technique with ∼70 fs, 1 kHz repetition rate pulses revealed distinguished multi-photon processes with two photon process being dominant in the 600–800 nm, three-photon absorption process in the 1.0–1.2 μm region and four-photon absorption process in the 1.3–1.5 μm regime. PBIPC in THF exhibited positive nonlinearity (self-focusing) for all wavelength range investigated. The molecule displayed strong large two-photon absorption cross-sections making it ideal for optical limiting, bioimaging applications. The obtained three-photon and four-photon absorption cross-sections have been found to be on par or superior with some of the recently reported molecules (e.g. arylalkynylruthenium stars).80,81 The excited state dynamics were studied using femtosecond transient absorption spectroscopy, which revealed a broad transient absorption peak essentially overlapping the bleach signal for both excitation wavelengths 400 nm and 650 nm showing possible triplet state transitions. Likewise, a small contribution from stimulated emission around 700 nm was observed. The kinetics revealed three lifetimes, τ1, τ2 and τ3 where τ1 < 10 ps and τ2 < 500 ps accounting for the internal conversion (IC) from higher singlet state to first singlet state (S2 → S1) and vibrational relaxion within hot singlet states  . The τ3 corresponds to a long decay lifetime of >1 ns and can possibly be assigned to combination of radiative relaxation and intersystem crossing (ISC) to triplet states. We firmly believe these metal phthalocyanines may find application in PVs and PDT. In addition, the presence of imidazole group had been observed to have increased solubility of PBIPC in solvents and is said to have higher triplet yield. Also, PBIPC can be used for 2D structures like MOFs or metal organic frameworks which have large number of applications ranging from photocatalysis to white light emission and bioimaging.82,83
Conflicts of interest
There are no conflicts of interest to declare.
Acknowledgements
We thank (a) CSIR-NISE (b) Department of Science & Technology (DST) (c) Government of India under the major project DST-UK (‘APEX-II’) for the financial support to execute this work. JVSK and DK thank UGC for research fellowships. V. R. Soma acknowledges DRDO for continuous financial support through ACRHEM. R. S. S. K. acknowledges the financial support from DST projects [BRICS/PilotCall2/IEEE-OSC/2018 (G) and SPARC/2018-2019/P301/SL]. Authors JVSK & LG acknowledge the support offered by Department of K&IM (IICT/Pubs./2019/279).
References
- B. E. A. Saleh and M. C. Teich, Fundamentals of Photonics, Wiley, New York, 1991 Search PubMed.
- J. M. Dudley and J. R. Taylor, Nat. Photonics, 2009, 3, 85–90 CrossRef CAS.
- G. S. He, L.-S. Tan, Q. Zheng and P. N. Prasad, Chem. Rev., 2008, 108, 1245–1330 CrossRef CAS.
- W. Min, C. W. Freudiger, S. Lu and X. S. Xie, Annu. Rev. Phys. Chem., 2011, 62, 507–530 CrossRef CAS.
- R. W. Boyd, Nonlinear Optics, Academic Press, San Diego, CA, 1992 Search PubMed.
- G. de la Torre, P. Vázquez, F. Agulló-López and T. Torres, Chem. Rev., 2004, 104, 3723–3750 CrossRef CAS.
- S. M. O'Flaherty, S. V. Hold, M. J. Cook, T. Torres, Y. Chen, M. Hanack and W. Blau, Adv. Mater., 2003, 15, 19–32 CrossRef.
- G. de la Torre, C. G. Claessens and T. Torres, Chem. Commun., 2007, 20, 2000–2015 RSC.
- X.-L. Zhang, X. Zhao, Z.-B. Liu, S. Shi, W.-Y. Zhou, J.-G. Tian, Y.-F. Xu and Y.-S. Chen, J. Opt., 2013, 13, 7–11 Search PubMed.
- G. de la Torre, P. Vazquez, F. Agullo-Lopez and T. Torres, J. Mater. Chem., 1998, 8, 1671–1683 RSC.
- D. Dini, M. Barthel and M. Hanack, Eur. J. Org. Chem., 2001, 20, 3759–3769 CrossRef.
- R. S. S. Kumar, S. V. Rao, L. Giribabu and D. N. Rao, Chem. Phys. Lett., 2007, 447, 274–278 CrossRef CAS.
- M. C. Larciprete, R. Ostuni, A. Belardini, M. Alonzo, G. Leahu, E. Fazio, C. Sibilia and M. Bertolotti, Photonics Nanostruct., 2007, 5, 73–78 CrossRef.
- E. A. Kuzmina, T. V. Dubinina and L. G. Tomilova, New J. Chem., 2019, 43, 9314–9327 RSC.
- M. O. Senge, M. Fazekas, E. G. A. Notaras, W. J. Blau, M. Zawadzka, O. B. Locos and E. M. N. Mhuircheartaigh, Adv. Mater., 2007, 19, 2737–2774 CrossRef CAS.
- P. Zhao, Z. Wang, J. Chen, Y. Zhou and F. Zhang, Opt. Mater., 2017, 66, 98–105 CrossRef CAS.
- J. W. Perry, K. Mansour, I. Y. S. Lee, X. L. Wu, P. V. Bedworth, C. T. Chen, D. Ng, S. R. Marder, P. Miles, T. Wada, M. Tian and H. Sasabe, Science, 1996, 273, 1533–1536 CrossRef CAS.
- K. V. Anil Kumar, S. Venugopal Rao, S. Hamad and S. M. Dharmaprakash, RSC Adv., 2016, 6, 22083–22089 RSC.
- B. Sorokin, Chem. Rev., 2013, 113, 8152–8156 CrossRef.
- M. E. Ragoussi, M. Ince and T. Torres, Eur. J. Inorg. Chem., 2013, 29, 6475–6482 CrossRef.
- K. Ishii, N. Kobayashi, K. M. Kadish, K. M. Smith and R. Guilard, The Porphyrin Handbook, Academic Press Elsevier, New York, 2003, ch. 102, vol. 16, pp. 1–40 Search PubMed.
- L. Howe and J. Z. Zhang, J. Phys. Chem. A, 1997, 101, 3207–3213 CrossRef CAS.
- S. B. Brown, E. A. Brown and I. Walker, Lancet Oncol., 2004, 5, 497–512 CrossRef CAS.
- M. R. Detty, S. L. Gibson and S. J. Wagner, J. Med. Chem., 2004, 47, 3897–3903 CrossRef CAS.
- R. R. Allison, G. H. Downie, R. Cuenca, X.-H. Hu, C. J. Childs and C. H. Sibata, Photodiagn. Photodyn. Ther., 2004, 1, 27–42 CrossRef CAS.
- R. R. Allison and C. H. Sibata, Photodiagn. Photodyn. Ther., 2010, 7, 61–75 CrossRef CAS.
- B. C. Wilson and M. S. Patterson, Phys. Med. Biol., 2008, 53, R61–R109 CrossRef CAS.
- F. Bolze, S. Jenni, A. Sour and V. Heitz, Chem. Commun., 2017, 53, 12857–12877 RSC.
- E. M. Maya, A. W. Snow, J. S. Shirk, R. G. S. Pong and G. L. Roberts, J. Mater. Chem., 2003, 13, 1603–1613 RSC.
- F. Dumoulin, M. Durmus, V. Ahsen and T. Nyokong, Coord. Chem. Rev., 2010, 254, 2792–2847 CrossRef CAS.
- H. Bertagnolli, W. J. Blau, Y. Chen, D. Dini, M. P. Feth, S. M. O' Flaherty, M. Hanack and V. Krishnan, J. Mater. Chem., 2005, 15, 683–689 RSC.
- A. Santhi, V. V. Namboodiri, P. Radhakrishnan and V. P. N. Nampoori, J. Appl. Phys., 2006, 100, 053109 CrossRef.
- K. P. Unnikrishnan, J. Thomas, V. P. N. Nampoori and C. P. G. Vallabhan, Appl. Phys. B: Lasers Opt., 2002, 75, 871–874 CrossRef CAS.
- N. Venkatram, L. Giribabu, D. Narayana Rao and S. Venugopal Rao, Chem. Phys. Lett., 2008, 464, 211–215 CrossRef CAS.
- J. Garcia, A. Gonzalez, A. Gouloumis, E. M. Maya, M. D. Perez, B. D. Rey, P. Vazquez and T. Torres, Turk. J. Chem., 1998, 22, 23–31 CAS.
- S. J. Mathews, S. C. Kumar, L. Giribabu and S. Venugopal Rao, Mater. Lett., 2007, 61, 4426–4431 CrossRef CAS.
- S. Hamad, S. P. Tewari, L. Giribabu and S. Venugopal Rao, J. Porphyrins Phthalocyanines, 2012, 16, 140–148 CrossRef CAS.
- D. Swain, V. K. Singh, N. V. Krishna, L. Giribabu and S. Venugopal Rao, J. Porphyrins Phthalocyanines, 2014, 18, 305 CrossRef CAS.
- D. Swain, R. Singh, V. K. Singh, N. V. Krishna, L. Giribabu and S. Venugopal Rao, J. Mater. Chem. C, 2014, 2, 1711–1722 RSC.
- N. Vamsi Krishna, V. K. Singh, D. Swain, S. Venugopal Rao and L. Giribabu, RSC Adv., 2015, 5, 20810 RSC.
- N. Vamsi Krishna, P. T. Anusha, S. Venugopal Rao and L. Giribabu, J. Porphyrins Phthalocyanines, 2016, 20, 2–9 Search PubMed.
- S. J. Mathews, S. Chaitanya Kumar, L. Giribabu and S. Venugopal Rao, Opt. Commun., 2007, 280, 206–212 CrossRef CAS.
- P. T. Anusha, P. Silviya Reeta, L. Giribabu, S. P. Tewari and S. Venugopal Rao, Mater. Lett., 2010, 64, 1915–1917 CrossRef CAS.
- S. Venugopal Rao, P. T. Anusha, L. Giribabu and S. P. Tewari, Pramana, 2010, 75, 1017–1023 CrossRef CAS.
- S. Venugopal Rao, P. T. Anusha, T. S. Prashant, D. Swain and S. P. Tewari, Mater. Sci. Appl., 2011, 2, 299–306 Search PubMed.
- M. S. S. Bharati, S. Bhattacharya, J. V. S. Krishna, L. Giribabu and S. Venugopal Rao, Opt. Laser Technol., 2018, 108, 418–425 CrossRef CAS.
- S. Bhattacharya, C. Biswas, S. S. K. Raavi, J. V. S. Krishna, N. V. Krishna, L. Giribabu and V. R. Soma, J. Phys. Chem. C, 2019, 123, 11118–11133 CrossRef CAS.
- D. S. Lawrence and D. G. Whitten, Photochem. Photobiol., 1996, 64, 923–935 CrossRef CAS.
- M. J. Frisch, G. W. Trucks, H. B. Schlegel, G. E. Scuseria, M. Robb, A. J. Cheeseman, R. Zakrzewski, V. G. Montgomery and J. A. Stratmann, Gaussian 09, Gaussian, Inc., Pittsburgh, PA, 2009 Search PubMed.
- D. Becke, J. Chem. Phys., 1993, 98, 5648–5652 CrossRef.
- G. A. Petersson and M. A. A. Al-Laham, J. Chem. Phys., 1991, 94, 6081–6090 CrossRef CAS.
- S. Miertus and E. Scrocco, Chem. Phys., 1981, 55, 117–129 CrossRef CAS.
- M. Cossi, V. Barone, R. Cammi and J. Tomasi, Chem. Phys. Lett., 1996, 255, 327–335 CrossRef CAS.
- N. M. O'Boyle, A. L. Tenderholt and K. M. Langner, J. Comput. Chem., 2008, 29, 839–845 CrossRef PubMed.
- R. Dennington, T. Keith and J. Millam, GaussView, version 5, Semichem Inc., Shawnee Mission, KS, 2009 Search PubMed.
- H. Enkelamp and R. J. M. Notle, J. Porphyrins Phthalocyanines, 2000, 4, 454–459 CrossRef.
- B. Simicglavaski, S. Zecevic and E. J. Yeager, J. Electrochem. Soc., 1987, 134, C130 Search PubMed.
- B. Agboola, K. I. Ozoemena and T. Nyokong, Electrochim. Acta, 2006, 51, 4379–4387 CrossRef CAS.
- A. Gnoli, L. Razzari and M. Righini, Opt. Express, 2005, 13, 7976 CrossRef CAS.
- P. Zhao, M. Reichert, S. Benis, D. J. Hagan and E. W. Van Stryland, Optica, 2018, 5, 583–594 CrossRef CAS.
- K. Iliopoulos, D. Potamianos, E. Kakkava, P. Aloukos, I. Orfanos and S. Couris, Opt. Express, 2015, 23, 24171–24176 CrossRef CAS.
- R. de Nalda, R. del Coso, J. Requejo-Isidro, J. Olivares, A. Suarez-Garcia, J. Solis and C. N. Afonso, J. Opt. Soc. Am. B, 2002, 19, 289–296 CrossRef CAS.
- L. M. Mazur, T. Roland, S. Leroy-Lhez, V. Sol, M. Samoc, I. D. W. Samuel and K. Matczyszyn, J. Phys. Chem. B, 2019, 123, 4271–4277 CrossRef CAS.
- Y. P. Meshalkin and S. S. Chunosava, Quantum Electron, 2005, 36, 527–530 CrossRef.
- Y. Mir, J. E. van Lier, J. Fçois Allard, D. Morrisand and D. Houde, Photochem. Photobiol. Sci., 2009, 8, 391–395 RSC.
- A. I. Plekhanov, T. V. Basova, R. G. Parkhomenko and A. G. Gürek, Opt. Mater., 2017, 64, 13–17 CrossRef CAS.
- N. Sheng, B. Gu, B. Ren, Y. Wang, L. Han, J. Wang, H. Cao, M. Guan, X. Zhai and J. Sha, Dyes Pigm., 2017, 136, 553–558 CrossRef CAS.
- B. Ren, N. Sheng, B. Gu, Y. Wan, G. Rui, C. Lv and Y. Cui, Dyes Pigm., 2017, 139, 788–794 CrossRef CAS.
- G. S. He and P. N. Prasad, Proc. SPIE, 2003, 5211, 1–12, DOI:10.1117/12.508092.
- H. Lu and N. Kobayashi, Chem. Rev., 2016, 610, 6184–6261 CrossRef.
- K. Makhal, S. Arora, P. Kaur, D. Goswami and K. Singh, J. Mater. Chem. C, 2016, 4, 9445–9453 RSC.
- A. J.-T. Lou and T. J. Marks, Acc. Chem. Res., 2019, 52, 1428–1438 CAS.
- N. Jia, C. He, S. Wang, W. Song, Z. Chen, Y. Zu, Y. Gao and Y. Dong, Opt. Mater., 2018, 76, 81–89 CrossRef CAS.
- X.-F. Zhang, Y. Lin, W. Guo and J. Zhu, Spectrochim. Acta, Part A, 2014, 133, 752–758 CrossRef CAS.
- A. A. Ramos, F. B. Nascimento, T. F. M. de Souza, A. T. Omori, T. M. Manieri, G. Cerchiaro and A. O. Ribeiro, Molecules, 2015, 20, 13575–13590 CrossRef CAS.
- S. S. K. Raavi and C. Biswas, Femtosecond Pump–Probe Spectroscopy for Organic Photovoltaic Devices, Digital Encyclopedia of Applied Physics, Wiley-VCH Verlag GmbH & Co, 2019, pp. 1–49 Search PubMed.
- P. Fita, T. Osmalek, T. Goslinski, M. Wierzchowski and J. Mielcarek, J. Photochem. Photobiol., A, 2012, 232, 44–49 CrossRef CAS.
- J. Savolainen, D. van der Linden, N. Dijkhuizen and J. L. Herek, J. Photochem. Photobiol., A, 2008, 196, 99–105 CrossRef CAS.
- M. van Leeuwen, A. Beeby, I. Fernandes and S. H. Ashworth, Photochem. Photobiol. Sci., 2014, 13, 62–69 RSC.
- C. Ozturk, A. Erdoğmus, M. Durmus, A. L. Uğur, F. A. Kılıçarslan and I. Erden, Spectrochim. Acta, Part A, 2012, 86, 423–431 CrossRef CAS.
- S. S. K. Raavi, J. Yin, G. Grancini, C. Soci, Venugopal Rao Soma, G. Lanzani and L. Giribabu, J. Phys. Chem. C, 2015, 119, 28691–28700 CrossRef CAS PubMed.
- T. N. Nguyen, F. M. Ebrahim and K. C. Stylianou, Coord. Chem. Rev., 2018, 377, 259–306 CrossRef CAS.
- H. Jia, Y. Yao, J. Zhao, Y. Gao, Z. Luo and P. Du, J. Mater. Chem. A, 2018, 6, 1188–1195 RSC.
Footnote |
| † Electronic supplementary information (ESI) available. See DOI: 10.1039/c9ra07758h |
|
| This journal is © The Royal Society of Chemistry 2019 |
Click here to see how this site uses Cookies. View our privacy policy here. 
 Open Access Article
 This Open Access Article is licensed under a Creative Commons Attribution-Non Commercial 3.0 Unported Licence
 b,
Jonnadula Venkata Suman Krishnac,
Devulapally Koteshwarc,
Lingamallu Giribabu
b,
Jonnadula Venkata Suman Krishnac,
Devulapally Koteshwarc,
Lingamallu Giribabu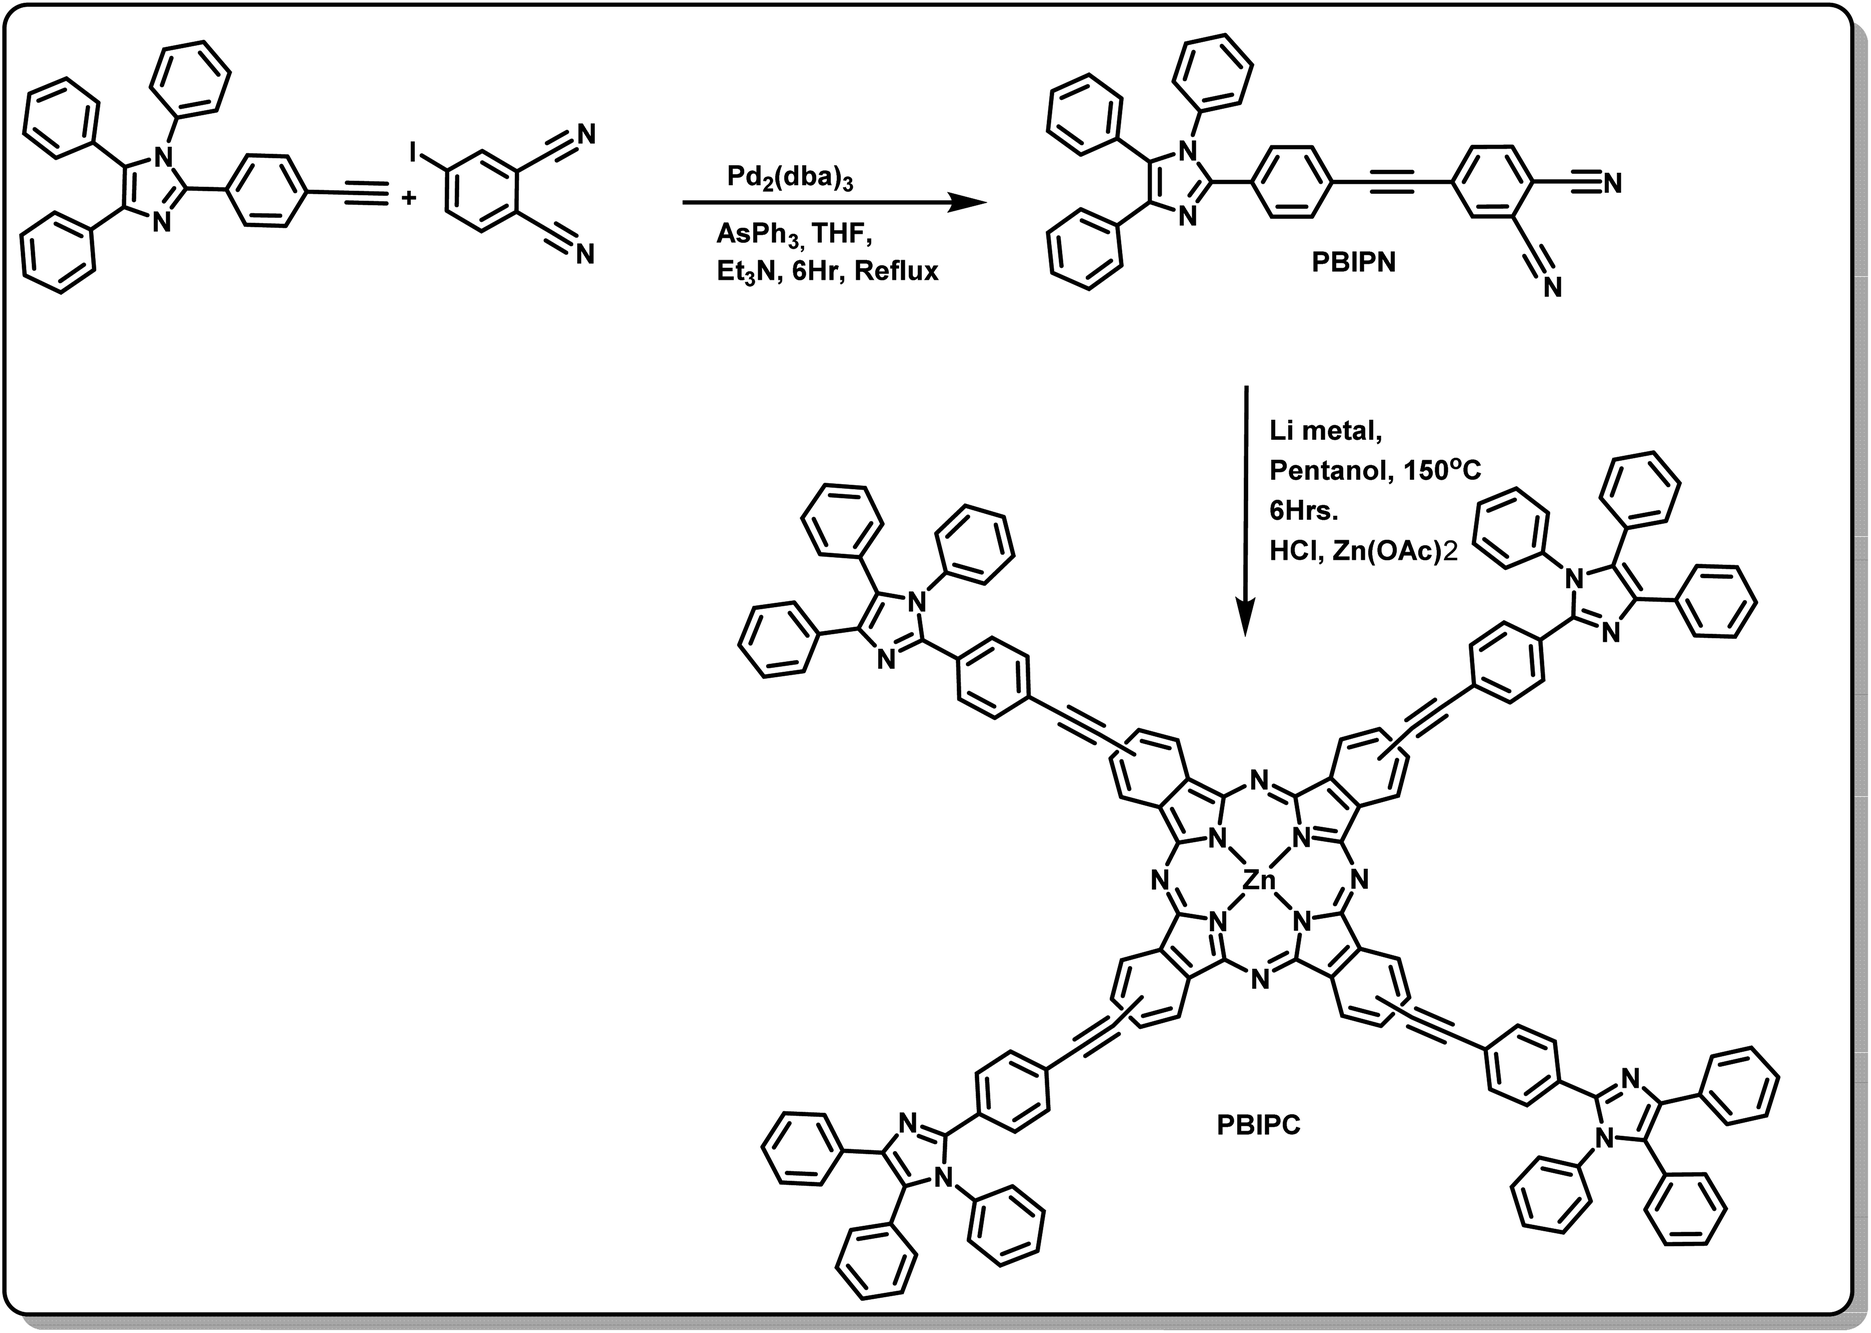


 via internal conversion within τ1. This is followed by vibrational relaxation of the excited S1 state in τ2 ps and subsequently the molecule eventually relaxes via radiative or intersystem crossing to lower energy state with τ3 ns lifetime. For ground state recovery, the molecule undergoes vibrational relaxation in S1 followed by intersystem crossing ∼1 ns. Q-band excitation of PBIPC has shown relatively longer lifetimes as compared to 400 nm, Soret band excitation. This is due to the fact that Q-band essentially corresponds to the ZnPc moiety of the molecule only. Thus, we can say that the peripheral substituents play an essential part in quenching of the transient lifetimes of PBIPC via charge transfer upon 400 nm excitation thus reducing the ISC lifetimes. These results are consistent with the results reported by Zhang's group73 who studied the triplet state of an imidazole and a methyl imidazole substituted zinc-phthalocyanine (ZnPc) and compared the effect of peripheral substituent on ISC, triplet lifetimes and triplet yield. Another group80 studied the effect of 3,4-(dimethoxyphenylthio) substituent on various metal phthalocyanines to show that the singlet oxygen quantum yield (ϕΔ) was affected by Soret band only (which explain lifetime quenching of PBIPC at 400 nm excitation) and the Pc-complex with Zn as central metal depicted superior photophysical characteristics over other metals. Thus, in case of fluorescence lifetime of PBIPC in THF being ∼3.86 ns with quantum yield of 0.22, the possibility of excited molecules to go to the triplet state is high which can only be qualitatively analyzed within current experimental conditions and the data obtained. The results obtained in the present work are also compared with that of Corroles – TTC and its metal derivatives (similar to phthalocyanines) – reported recently by Raavi et al. for both singlet and triplet state lifetimes.81 The intersystem crossing time in their case was found to be comparable with our molecule. The detailed quantitative study of triplet lifetimes will be performed in future. Our molecule has exhibited very long-lived excited state dynamics as compared to other zinc phthalocyanines and their derivatives proving its potential in PVs (photovoltaics) and PDT.76–80
 . The τ3 corresponds to a long decay lifetime of >1 ns and can possibly be assigned to combination of radiative relaxation and intersystem crossing (ISC) to triplet states. We firmly believe these metal phthalocyanines may find application in PVs and PDT. In addition, the presence of imidazole group had been observed to have increased solubility of PBIPC in solvents and is said to have higher triplet yield. Also, PBIPC can be used for 2D structures like MOFs or metal organic frameworks which have large number of applications ranging from photocatalysis to white light emission and bioimaging.82,83