
 Open Access Article
 This Open Access Article is licensed under a Creative Commons Attribution-Non Commercial 3.0 Unported Licence
Ir nanoparticles with ultrahigh dispersion as oxygen evolution reaction (OER) catalysts: synthesis and activity benchmarking†
Francesco
Bizzotto
a,
Jonathan
Quinson
 b,
Alessandro
Zana
a,
Jacob J. K.
Kirkensgaard
c,
Alexandra
Dworzak
d,
Mehtap
Oezaslan
de and
Matthias
Arenz
*a
b,
Alessandro
Zana
a,
Jacob J. K.
Kirkensgaard
c,
Alexandra
Dworzak
d,
Mehtap
Oezaslan
de and
Matthias
Arenz
*a
aDepartment of Chemistry and Biochemistry, University of Bern, Freiestrasse 3, CH-3012 Bern, Switzerland. E-mail: matthias.arenz@dcb.unibe.ch
bChemistry Department, University of Copenhagen, 5 Universitetsparken, 2100 Copenhagen Ø, Denmark
cDepartment of Food Science, University of Copenhagen, Rolighedsvej 26, 1958 Frederiksberg C, Denmark
dSchool of Mathematics and Science, Department of Chemistry, Carl von Ossietzky Universität, 26111 Oldenburg, Germany
eInstitute of Technical Chemistry, Technical University of Braunschweig, Hagenring 30, 38106 Braunschweig, Germany
First published on 8th October 2019
Abstract
In this work, we present a facile and straightforward approach to synthesize, activate and benchmark small, i.e. 1.6 nm in diameter, Ir nanoparticles (NP) as oxygen evolution reaction (OER) catalysts. It is shown that the Ir NP, although oxidized after synthesis and drying, can be electrochemically reduced allowing determination of the electrochemically active surface area by CO stripping. Subsequently, an activation protocol is applied forming catalytically active Ir-oxide NP. This oxide formation is shown to be largely irreversible. It is then demonstrated that the activated Ir NP synthesized via our recently introduced colloidal method exhibit extremely high OER activities when normalized to their Ir mass. These high OER activities are related to superior dispersion as compared to state-of-the-art OER catalysts reported in the literature.
1 Introduction
The worldwide increasing energy demand requires alternative and renewable energy sources, like photovoltaic (PV) and wind power sources to overcome our dependence on fossil fuels. As PV and wind power sources are intrinsically intermittent, they cannot provide a constant energy flow.1 In order to eliminate the inherent mismatch between energy consumption and production, it is necessary to find efficient ways to store excess energy which, in turn, could be re-converted when the demand is high or when the user is mobile. In this respect, storage of hydrogen produced via water splitting is the most promising approach due to the high energy density and the fact that H2 can be readily used to produce electricity by fuel cells.1–4Water electrolysis is characterized by a high total overpotential, mainly due to the sluggish kinetics of the anodic reaction, i.e. the O2 evolution. Therefore, most of the efforts in research and development are directed to improving the oxygen evolution reaction (OER). To date, the most efficient catalysts for the OER were based on Ni and its alloys for alkaline conditions,5–9 and Ir and Ru for acidic media.1,7,8,10,11 In acidic media, Ir displays the best compromise between activity and stability since Ru, despite its remarkable activity, readily degrades under the harsh conditions of operation. Unfortunately, Ir is one of the least abundant elements in the Earth's crust and is only produced as a by-product of Pt extraction.12 Moreover, commercial anodes are employed at around 2 mgIr cm−2 or more, due to the low surface area of these catalysts.13,14 Therefore, a major breakthrough is needed to enhance the OER performances, for instance by increasing the active surface area of Ir-based catalysts. A possible strategy for improving Ir utilization is its dispersion onto a suitable support. Given the extremely harsh conditions of operation, no support material has been proven to be highly conductive and completely stable. However, Sb-, F- and In-tin oxides present decent stability and conductivity and are considered promising candidates.15–19 Titania is stable during operation thanks to its semiconducting nature and has already been tested.14,19,20 However, high Ir loading is required to allow electron conduction via an IrO2 film.14
In this paper we fully exploit a concept recently introduced in our work from the study of Quinson et al.21 We discuss in detail the synthesis of small, monodisperse Ir nanoparticles (NP) with ultrahigh dispersion for the preparation of efficient catalysts for the OER. Our approach does not require surfactants, high boiling point alcohols or further precipitation steps (typically performed with HCl in alternative approaches) to remove the as-synthesized NP from the reaction medium.22 Instead, the as-prepared stable colloidal nanoparticle suspension can be directly applied, e.g. by spray coating, for the preparation of electrodes for the OER.
In addition, the literature lacks uniform approaches of how to benchmark the performance of OER catalysts. In particular, the determination of the electrochemically active surface area (ECSA) is a crucial challenge that is required to track the actual behavior of the active sites and to pinpoint the underlying reason for the observed performance. Activity measurements based on mass related considerations alone do not allow for a thorough catalyst characterization. Indeed, mass activity (MA) can be influenced either by changes in the specific activity (SA) of the active sites or by improvements in the active phase dispersion (surface to bulk ratio) on the support/substrate.
In this work, we present a facile and straightforward approach to benchmark Ir NP as OER catalysts based on ECSA, SA and MA. It is shown how the surface area of the as-synthesized Ir NP can reliably be determined by CO stripping measurements at the beginning of the electrochemical characterization, followed by a subsequent activation protocol forming the active Ir-oxide phase. It is highlighted that care has to be taken not to confuse oxidation currents correlated with the formation of the active phase with the actual OER activity of the catalyst as otherwise the latter is easily overestimated. With the presented approach, it is demonstrated that the Ir NP display a remarkable ECSA as well as when activated, SA and MA for the OER, which outperform reported state-of-the-art catalysts by a factor of up to ten.16,20,23,24 It is highlighted that the performance enhancement achieved by synthesizing the Ir NP via our recently introduced colloidal approach21 is due to their extremely high dispersion laying the foundation for supported OER catalysts.
2 Experimental
2.1 Synthesis of Ir nanoparticles
The synthesis of Ir NP was carried out in a 100 mL round bottom flask connected to a water-cooled condenser. Typically, 6 mL of a 20 mM IrCl3 solution (Sigma Aldrich, >99.8%) in methanol (HPLC grade, Sigma Aldrich) was mixed with 21 mL of a 57 mM NaOH solution (Suprapur®, Merck) in methanol. All chemicals have been used as received without further purification. The final concentration of the reaction solution was 4.4 mM IrCl3 and 44.0 mM NaOH. The solution was yellow at this stage. The flask was then placed in a microwave reactor (CEM, Discover SP). The reaction was performed for 30 min while the power was kept at 100 W throughout the synthesis. As soon as the solution approached the boiling point, it turned dark, indicating the colloidal NP formation. Once the reaction was completed, the solution looked dark brown. The as-prepared colloidal dispersion was extremely stable and could be stored for several months without particle sedimentation.2.2 High resolution transmission electron microscopy (HR-TEM)
HR-TEM images were acquired with a JEOL 3000F operated at 300 kV equipped with a field-emission gun. The software CrystalMatch was used to assess that the measured lattice planes and their intersection angles were consistent with the Ir fcc zone axis within an error of 10% for measured distances and 5% for measured angles. The samples were prepared for analysis by dropping the NP dispersion or the supported NP re-dispersed in methanol onto carbon coated copper TEM grids (Quantifoil). The size and morphology were also estimated by using a Jeol 2100 operated at 200 kV by recording images at three different magnifications (at least ×300![[thin space (1/6-em)]](https://www.rsc.org/images/entities/char_2009.gif) 000, ×400000, and ×500000) in at least three randomly selected areas. The particle size and size distribution analyses were performed by measuring the size of typically between 700 and 1000 NP (at least 200) using the software ImageJ. The mean diameter (in nm) and the associated standard deviation (σ, in nm) for each sample are reported.
000, ×400000, and ×500000) in at least three randomly selected areas. The particle size and size distribution analyses were performed by measuring the size of typically between 700 and 1000 NP (at least 200) using the software ImageJ. The mean diameter (in nm) and the associated standard deviation (σ, in nm) for each sample are reported.
2.3 Z-potential
The Z-potential of the colloidal Ir NP was measured using a Litesizer™ 500 (Anton-Paar). Measurements were performed in a quartz cuvette at 25 °C. 20 μL of the colloidal Ir NP suspension was transferred into the cuvette and 1 mL of methanol was added to obtain a transmittance of 80–90%. The applied voltage (up to 200 V) as well as the number of runs (up to 1000) was automatically adjusted using the instrument. A refractive index of 1.3238, a viscosity of 0.0005514 Pa s and a relative permittivity of 33.1 were used as parameters in the software (Anton Paar Kalliope Professional, version 2.0.1). Prior to the measurement, the waiting time was around 1 min to stabilize the diluted dispersion.2.4 Small-angle X-ray scattering (SAXS)
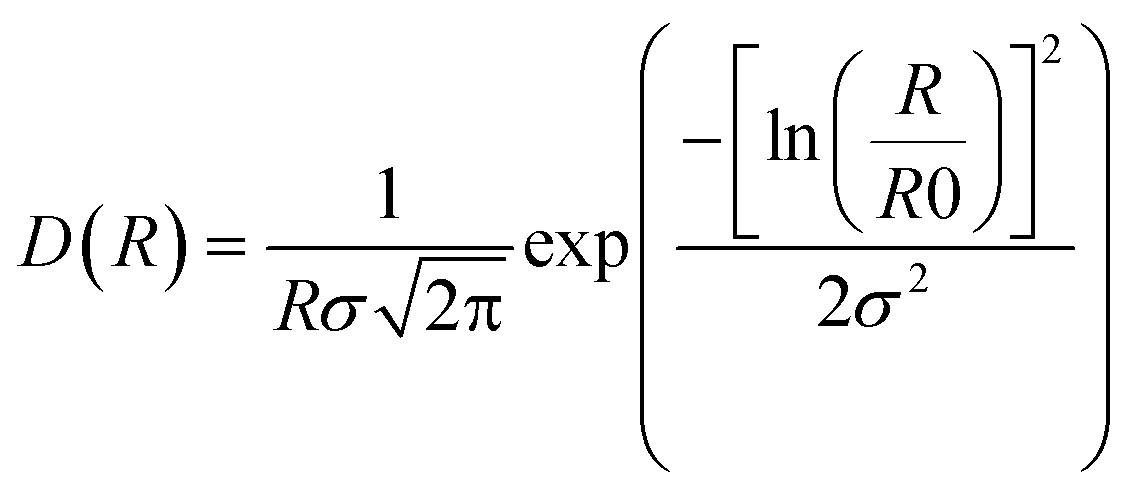
Small-angle X-ray scattering was performed at the Niels Bohr Institute at the University of Copenhagen with a SAXSLab instrument as previously detailed.22,25 This instrument, equipped with a 100XL + micro-focus sealed X-ray tube from Rigaku, produces a photon beam with a 1.54 Å wavelength. A 2D 300 K Pilatus detector from Dectris was used to record the scattering patterns. The two-dimensional scattering data were azimuthally averaged, normalized by the incident radiation intensity, the sample exposure time and the transmission and corrected for background and detector inhomogeneities using standard reduction software. Background measurement was carried out in pure methanol. The radially averaged intensity I(q) is given as a function of the scattering vector q = 4π·sin(θ)/λ, where λ is the wavelength and 2θ is the scattering angle.The background corrected scattering data was fitted with a model of polydisperse spheres described by a volume-weighted log-normal distribution. The model expression for the intensity is:
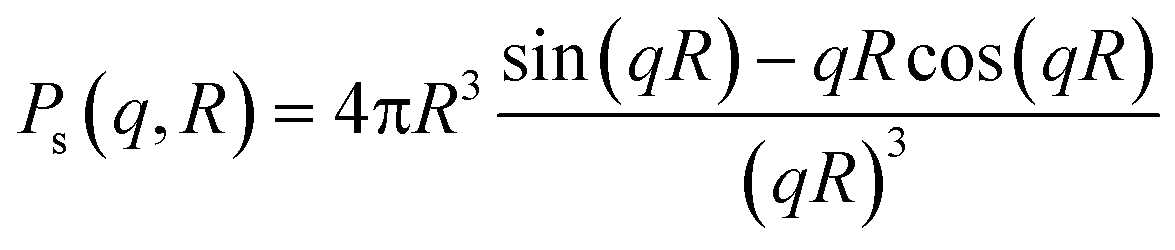
| I(q) = C ∫ Ps2(q,R)V(R)D(R)dR |
and the log-normal distribution by:
The fitting was conducted using a home written MATLAB code invoking least-squares χ2-minimisation to optimise the agreement between the data and model. Thus, the free parameters in the model are the radius and variance of the polydisperse size distribution as reported in this paper. The scattering data and corresponding fits can be seen in Fig. 1a and S5.†
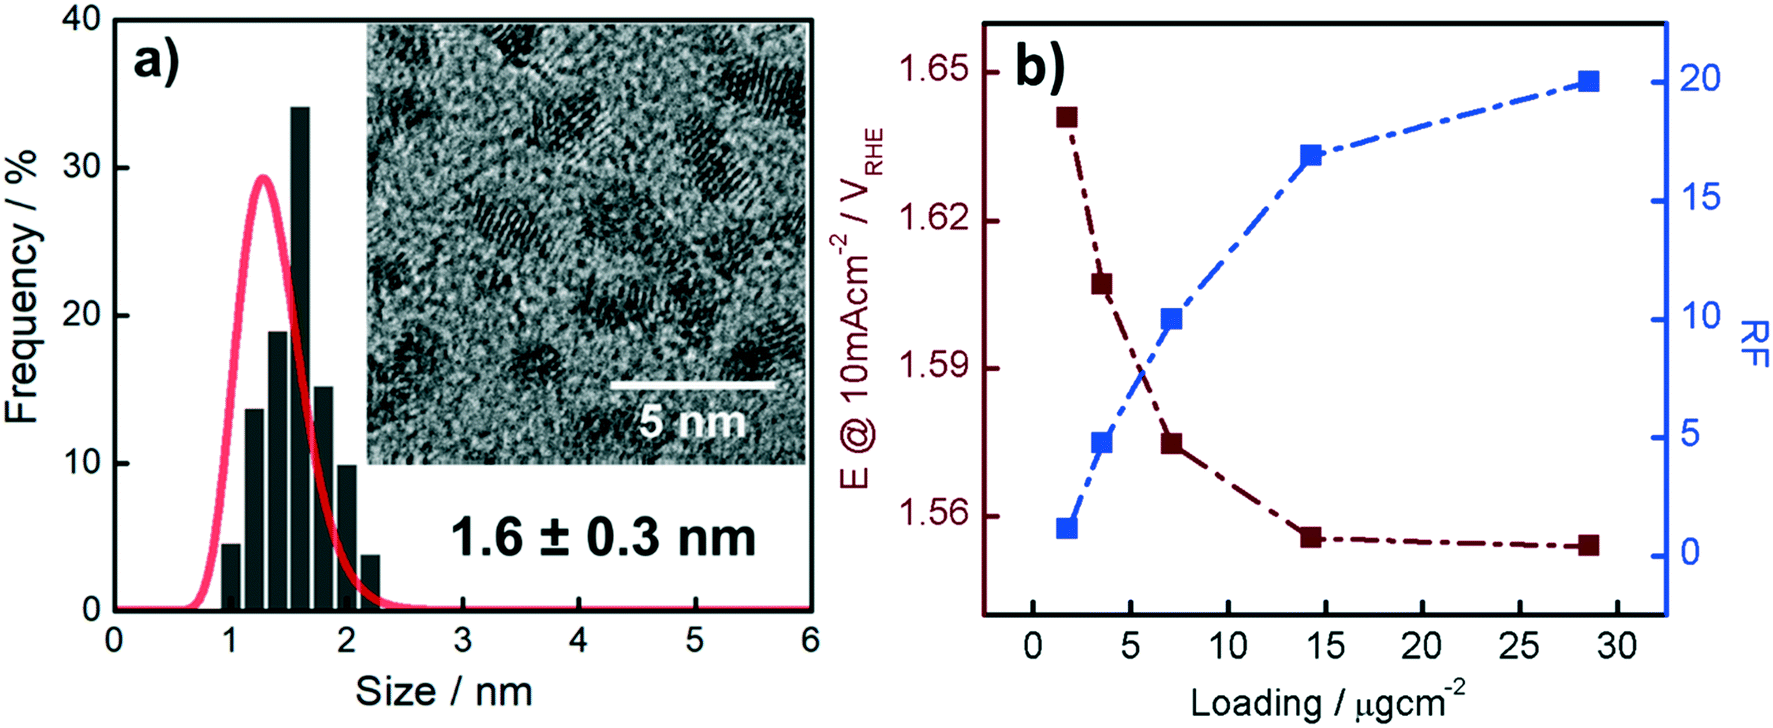 | ||
| Fig. 1 (a) Particle size distribution of the Ir NP determined from the HR-TEM micrographs and SAXS data. The inset shows a HR-TEM micrograph of the as-synthesized Ir NP. (b) Potential at a constant current density of 10 mA cm−2 as a function of the theoretical Ir loading (- -■- -) and the RF established from the CO stripping data (- -■- -). | ||
2.5 Catalyst film preparation
Homogeneous thin films consisting of Ir NP were prepared on a glassy carbon (GC) disk of a rotating disk electrode (RDE) using the as-synthesized alkaline NP suspension. The theoretical loading was calculated from the concentration of the Ir NP suspension. Different amounts of Ir NP were pipetted on the surface of the GC to investigate the loading effect. In order to pipette always the same volume of the Ir NP suspension on the GC disk, the stock dispersion of the as-synthesized NP was diluted to different concentrations with pure methanol as reported in Table 1.| Concentration of the Ir NP dispersion [μg mL−1] | |||||
|---|---|---|---|---|---|
| 26 | 51 | 101 | 198 | 397 | 795 |
| Total Ir loading on the GC electrodes [μg] | |||||
|---|---|---|---|---|---|
| 0.18 | 0.36 | 0.70 | 1.39 | 2.78 | 5.56 |
| Ir loading on the GC electrodes normalized by the geometric surface area [μg cm−2] | |||||
|---|---|---|---|---|---|
| 0.9 | 1.8 | 3.6 | 7.1 | 14.3 | 28.6 |
For each electrode preparation, 7 μL from the diluted solutions was taken and drop cast onto a GC disk. The suspension was then dried in air by rotating the electrode at 500 rpm. To check the quality of the Ir NP films, pictures were taken with an optical microscope (Keyence VHX-6000).
2.6 In situ electrochemical X-ray absorption spectroscopy (XAS)
Synchrotron-based in situ electrochemical XAS experiments were conducted at the ROCK beamline of the SOLEIL light source (France). The beam current was 450 mA. The incident beam was collimated using a bending magnet (Ec = 8.65 keV) and a toroidal Si mirror with a 50 nm Ir coating and monochromatized using a Si(111) monochromator. Two mirrors for the harmonic rejection (1st flat, 2nd bendable) were tilted at 3 mrad with the stripe of Pd. XAS measurements at the Ir L3 edge (transition: 2p3/2 to 5d) were performed in a transmission mode. The ionization chambers were filled with pure nitrogen for the Ir L3 edge. The length of the ionization chamber for the incident X-ray intensity (I0) was 188 mm, while for the transmitted X-ray intensity after the sample and reference foil (I1 and Iref), the ionization chambers were both 328 mm long, respectively. The reference Ir foil was probed simultaneously with the sample under investigation. This procedure allows a comparison between the spectra from different samples recorded under different electrochemical conditions.All the XAS data were processed and evaluated using the IFEFFIT software package.26 For the data processing, all the raw data were aligned, averaged, background corrected and normalized by the edge jump. The energy units (eV) were converted to photoelectron wave number k units (Å−1) by assigning the photoelectron energy origin, E0, corresponding to k = 0, to the first inflection point of the absorption edge.
2.7 Preparation of carbon supported Ir NP catalysts for in situ XAS
For in situ XAS investigations, the as-synthesized Ir NP were deposited on a commercially available Vulcan (XC72R). The carbon concentration was 1 mgC mLmethanol−1. The mixture was then sonicated with a probe sonicator (QSONICA sonicator, 500 W, 20 kHz) operated with an amplitude of 20%. Sonication was performed with 10 steps of 1 min. Each of these steps was carried out by alternating sonication (1 s) with resting (1 s).The mixture of Ir NP and carbon suspension was then transferred to a round bottom flask and the methanol was evaporated with a rotary evaporator (KNF, RC 600) keeping the flask in a sonication bath until the material was completely dry. At the end, the powder was transferred into a vial and stored in air.
The electrodes for the in situ XAS experiments were prepared by dispersing the catalyst powder in acetone at a concentration of 3.5 mgIr mL−1. 10 μl aliquots of the catalyst suspension were pipetted several times onto a gas diffusion layer (GDL) (Sigracet, 39 BC) to obtain a loading of around 700 μgIr cm−2 distributed on an area of ∼5 mm. As a counter electrode, graphite foil was employed. The electrodes were then mounted on a custom-made PEEK spectro-electrochemical flow cell. The counter and working electrodes were in contact with gold coated pins. The cell design is the one reported by Binninger et al.27 Only minor modifications of the cell design were performed to optimize the signal–noise ratio and the connection between working and reference electrodes. The Ar-saturated electrolyte (0.1 M HClO4, Suprapur®, Merck) was pumped through the cell at 1 mL min−1 using a syringe pump. Electrochemical measurements were performed using a potentiostat (ECi-200, Nordic Electrochemistry controlled with the software EC4DAQ, version 2.44) recording the solution resistance (iR drop) online by superimposing a 5 kHz and 5 mV AC signal and compensating it by an analogue positive feedback scheme. Solution resistance was as low as 10 Ω throughout the experiment. To avoid system instability due to overcompensation, the iR drop was not adjusted to lower values.
2.8 Electrochemical characterization
The electrochemical OER activity measurements of the unsupported Ir NP were carried out as we have reported in previous work.21 In short, an electrochemical glass cell equipped with a three-electrode configuration was employed for all the experiments. A 5 mm GC disk embedded in a Teflon tip was used as the working electrode (WE) and a platinum wire as the counter electrode (CE), respectively. All potentials were measured with respect to a reversible hydrogen electrode (RHE). Measurements were performed using a potentiostat (ECi-200, Nordic Electrochemistry controlled with the software EC4DAQ version 2.44). Electrochemical results have been exported and analyzed with the software EC4View (version 1.2.55). The effective solution resistance was adjusted to ca. 3 Ω. The electrolyte was 0.1 M HClO4 prepared by diluting the concentrated HClO4 (Suprapur®, Merck Germany) with Millipore Milli-Q water (18.2 MΩ cm at 25 °C, total organic content (TOC) of <2 ppb). Ar (99.999%, Carbagas AG, Switzerland) was continuously purged through the electrolyte during the electrochemical experiment. The ECSA was determined via the CO stripping method at the beginning of each experiment. The electrode was held at 0.15 VRHE in a CO-saturated electrolyte. Subsequently, the electrolyte was purged with Ar for 20 min to remove excess CO in the solution. The adsorbed CO as a monolayer was then oxidized to CO2 by scanning the potential from 0.15 VRHE to 1.4 VRHE at 20 mV s−1. The ECSA was calculated by integration of the oxidation peak and by dividing the as-calculated charge by the reference value for polycrystalline Ir (358 μC cm−2).28 The integrated charge density normalized by the reference value of polycrystalline Ir was used to determine the roughness factor (RF) which is defined as the total active Ir surface area (in cm−2) divided by the geometric surface area (in cm−2) of the working electrode. The RF is thus related to the ECSA.Catalyst activation was performed under potentiostatic (PS) and potentiodynamic (PD) conditions. During the PD experiment, the potential was cycled 90 times from 1.2 VRHE up to the (indicated) different upper potential limits ranging from 1.4 to 1.7 VRHE. PS experiments were carried out by holding the potential for 300 s at deposition potentials (ED) which were the same as the upper potential limits in the PD protocol.
The effect of the “activation” protocol on the OER performance was evaluated by measuring the current density during an anodic scan from 1.20 to 1.55 VRHE at 10 mV s−1 using linear sweep voltammetry (LSV). The current density at 1.5 VRHE was taken to establish the OER activity of the Ir NP as a function of the loading. During the activation and OER activity measurements, the electrode was rotated at 3600 rpm.
The ECSA of metallic Ir retained after the “activation” protocol was measured by performing an additional CO stripping measurement, as described above, and calculated from the ECSAFinal measured after the activation protocols and the initial ECSA0:
 | (1) |
To investigate the electrochemical behavior of the unsupported Ir NP as a function of the metal loading, all the electrodes were activated by holding the potential at 1.6 VRHE using the PS protocol. The OER activity was then measured at 1.5 VRHE during the positive going scan up to 1.55 VRHE as described above.
3 Results and discussion
3.1 Ir NP characterization
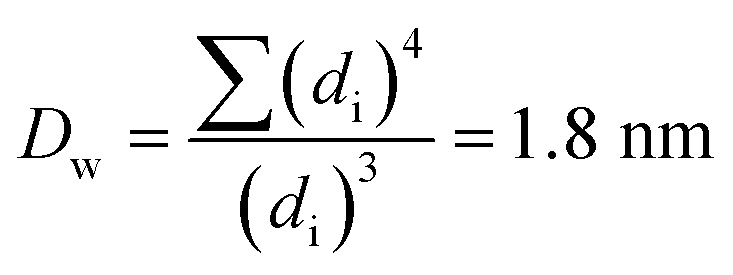
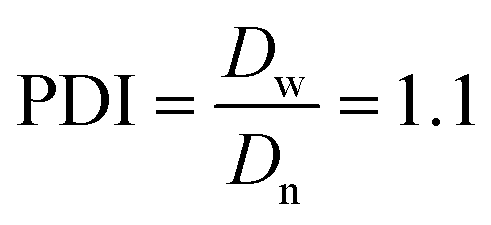
The Ir NP synthesized by the colloids for catalysts (Co4Cat) approach21 show a very high colloidal stability against agglomeration and sedimentation. Even after extended storage over several months and/or after centrifugation at 5000 rpm for 10 min, no aggregation, sedimentation, or color change was observed (see Fig. S1†). In addition, the colloidal stability was confirmed in the Z-potential measurements on the as-prepared NP suspensions. We determined a Z-potential as high as 43.0 ± 0.7 mV, typical for a suspension with good stability.29–31The as-prepared colloidal Ir NP were further characterized by SAXS and HR-TEM, see Fig. 1. The NP are crystalline and exhibit a narrow size distribution with a mean particle size of around 1.6 nm as determined by HR-TEM; 80% of the particles are in the range of 1.3–1.9 nm. The particle size distribution determined by SAXS is slightly shifted to even smaller sizes with a mean particle size of around 1.3 nm. Such very small, systematic shifts in the particle size distributions determined by TEM and SAXS have been observed previously and are most likely related to difficulties determining the exact particle size in TEM due to limitation in contrast.32–34 With the help of the HR-TEM data, the polydispersity index (PDI) was determined as:
 | (2) |
 | (3) |
 | (4) |
3.2 Electrochemical OER performance
In the presented work, we therefore pursued an approach for the electrochemical characterization of OER catalysts based on the determination of the ECSA, Ir-based surface area specific activity (SA) and Ir-based mass activity (MA) at a fixed electrode potential. The evaluation of the combination of the two is crucial to determine the efficiency of the use of the precious metal (MA) and the activity of the active sites (SA). The applied electrode potential should be sufficient to establish a “real” OER current, but not too high to avoid excessive oxygen bubble formation, which is detrimental for catalyst film stability and thus for the electrochemical measurements. Furthermore, a distinction between OER and catalyst activation (oxidation) currents should be made, for instance by applying catalyst activation procedures before the OER testing.
The determination of the SA requires reliable determination of the ECSA, which is not straightforward for Ir-based catalysts. For the ECSA determination of Ir-based catalysts for the OER, metal underpotential deposition (MUPD) methods, primarily based on metals like mercury, have successfully been employed.28,39 But metal underpotential deposition has drawbacks such as possible cell contamination. Another successful approach is based on the ion exchange of Zn2+ on IrO2. The change in Zn2+ concentration determined by UV-vis before and after the exchange treatment allows evaluation of the number of sites over the surface and can then be correlated to the pseudocapacitance.40 However, this method can only be applied to unsupported particles where the contribution from the substrate to the capacitive current is negligible and is thus not suitable for a more general approach to Ir-based catalysts.
Here we demonstrate how a protocol based on the electrochemical CO-stripping method can be applied to determine the ECSA of Ir NP, which is a standard approach for Pt-based catalysts but not established yet for Ir-based catalysts.41,42 This approach requires the catalyst material to chemisorb CO as a monolayer, which is only the case if Ir is in the fully reduced, metallic state; under applied electrochemical conditions, CO very poorly adsorbs on the surface of Ir-oxide and no CO stripping is feasible.28,43 It is therefore crucial to consider that Ir easily oxidizes as soon as it is exposed to potentials higher than 0.5–0.6 VRHE. Prior to the determination of the ECSA, the potential must be kept in the HUPD region to avoid underestimation of the surface area. In order to test if the as-synthesized Ir NP can be fully reduced and to establish the range of Ir loading on the GC disk where full utilization is ensured, we performed a series of CO stripping experiments. Fig. S2† shows three CO stripping linear scan voltammetry (LSV) curves recorded with three different Ir loadings on the GC disk. The LSV curves demonstrate that indeed CO chemisorbs on the as-prepared Ir NP surface under potential control (0.15 VRHE). Furthermore, the integrated charge from the CO oxidation peak scales with the Ir loading (also see ECSA values in Fig. 4a for the discussion at which loadings the integrated charges do not scale), proving that at these loadings, the established ECSA is independent of the amount of catalyst on the GC disk and thus the surface of the Ir NP is fully utilized. The possibility to perform CO adsorption suggests that either the Ir NP are in a reduced state after synthesis or the surface oxide can be reduced by cycling the potential in the hydrogen underpotential deposition (HUPD) region prior to CO adsorption (see section 3.3).10
It is important to stress that IrOx and not the metallic Ir is the active phase for the OER. As a consequence, the established ECSA does not represent the actual number of active sites during the OER; instead, it accounts for the number of sites that are available for the formation of Ir-oxide. Once oxidized, it is likely that the surface morphology of the NP changes. Due to the extremely small size of the NP, a significant percentage of the Ir atoms are surface and not bulk atoms.44 Therefore, potential surface roughening of the NP is not expected to dramatically enhance the number of surface atoms. In addition, surface roughening is usually the consequence of the reduction of an oxide.45,46 If surface roughening would occur, the fact that the Ir NP are all taken from the same batch, it would affect all catalysts in the same way. Consequently, the calculated RF can be used as the normalization factor which allows comparison between different electrodes.
We also performed CO stripping before and after the catalyst activation to determine the degree of irreversible oxidation of the Ir NP using eqn (1). These measurements allowed us to evaluate the potential which is necessary to apply in order to reliably evaluate the OER activity without superimposed Ir oxidation currents. Fig. 2a shows the retained ECSA after activation which follows a similar trend for the PD and PS activation protocols: the retained ECSA significantly drops from values as high as 25% at ED = 1.4 VRHE to 0% at ED = 1.7 VRHE, i.e. at the latter, the surface is irreversibly oxidized. No HUPD or CO stripping peak can be detected anymore using subsequent measurements. Oxidation at lower potentials, by comparison, seems to lead to a metastable oxide within the time frame involved.47
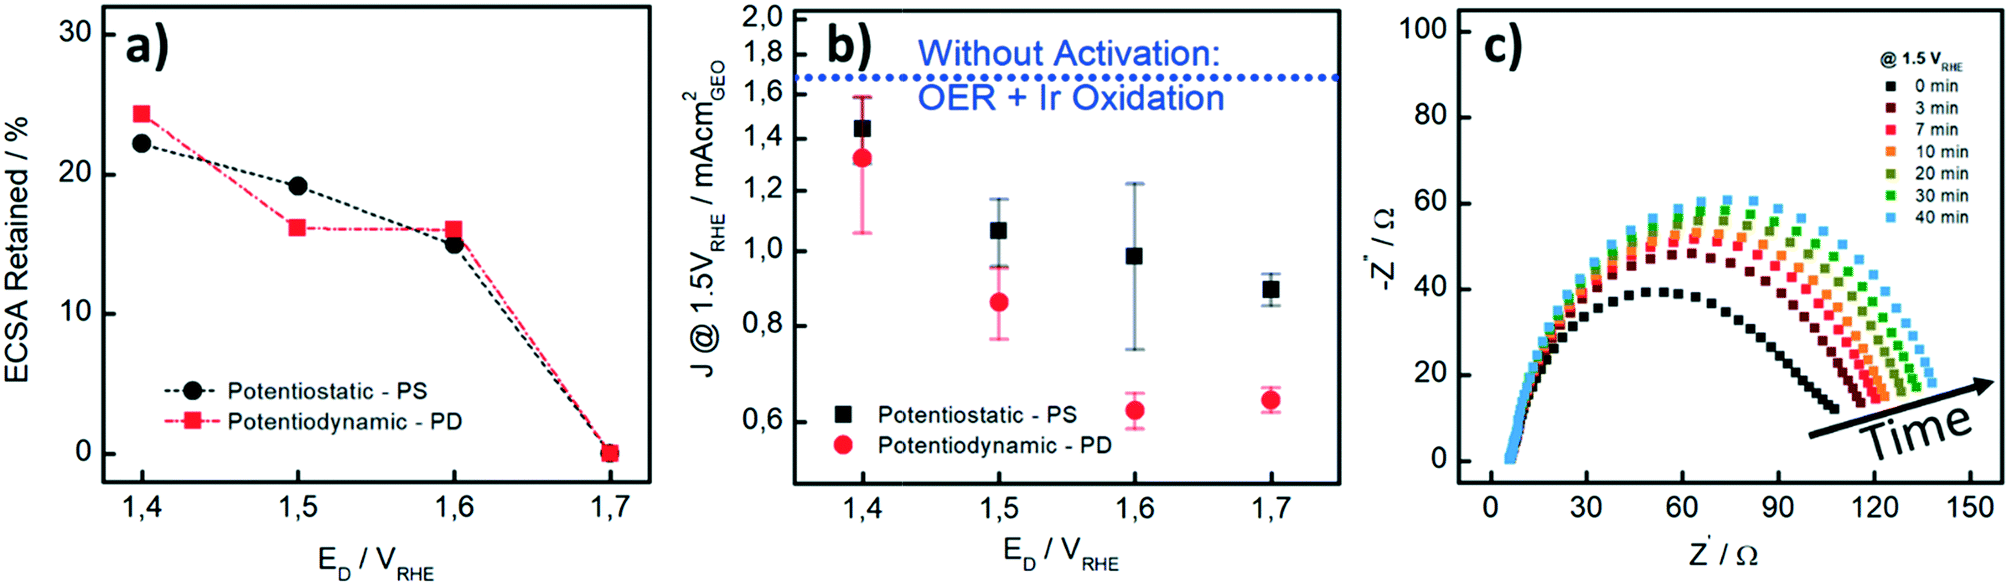 | ||
| Fig. 2 (a) Percentage of ECSA retained as a function of ED (potential hold and upper potential limit, respectively) for the different activation protocols (potentiostatic (■) and potentiodynamic (●)) as determined by CO stripping. (b) Geometric current density J measured at 1.5 VRHE, during cyclic voltammetry recorded at 10 mV s−1 in 0.1 M HClO4. Each data point is the average of three independent measurements. The current density J is reported as a function of ED. The dotted blue line (·····) represents the current density at 1.5 VRHE without pre-activation of the Ir NP. (c) Nyquist plots measured at different times recorded at 1.5 VRHE from 10 kHz to 0.5 Hz with a potential amplitude of 5 mV. All measurements were carried out at room temperature. | ||
In Fig. 2b, the influence of the different activation procedures on the apparent (measured) OER activity is summarized. For the apparent OER activity, we thereby defined the current density measured at 1.5 VRHE (J1.5V) while sweeping the potential at 10 mV s−1 from 1.2 to 1.55 VRHE. The Ir loading on the GC disk was kept constant at 7.1 μg cm−2 in all measurements. First, it is seen that higher OER activities are recorded when the catalyst is not pre-activated (blue dotted line in Fig. 2b as compared to current densities after different activation protocols). Secondly, although the extent to which the Ir-oxide can be reduced again after activation is similar to PS and PD activation (Fig. 2a), the OER activities strongly differ. For the PS activation protocols, higher OER activities are recorded than those for the respective PD activation protocols. We investigated the PS activation process of the Ir NP by electrochemical impedance spectroscopy (EIS). With EIS, the change in the (apparent) OER performance during the activation step can be well studied at a potential of 1.5 VRHE. In Fig. 2c, it is seen that the Nyquist plots and consequently the charge transfer resistance (RCT) increase with time during the potential hold. The increase is most striking during the first 7 minutes, when RCT increases around 50%, whereas the increase is rather limited for the subsequent 30 minutes. This behavior is in line with the higher (apparent) OER activity recorded when the catalyst is not pre-activated. As the OER activity should not be time-dependent in this time period, we assign the initial currents and the Nyquist plot recorded at time “0” mainly to Ir oxidation currents, whereas the subsequent curves show a contribution from either OER or surface oxidation. Unfortunately, it is not possible to unambiguously disentangle the contributions of the two processes in the observed total RCT since their respective RCT values are expected to be reciprocally dependent.
Our results show that careful pre-activation is necessary to avoid recording artificially high OER activities: if Ir oxidation is not complete, the OER activity can be significantly overestimated. Activation at potentials of ≥1.5 VRHE guarantees that the majority of the Ir NP is “irreversibly” oxidized and in subsequent OER tests, only minor contributions from the oxidation process to the overall current occur. But also the type of pre-activation matters. By considering the same ECSARetained for the two protocols as well as the obtained OER activity, PS activation protocols are superior to PD protocols. A PS protocol enables continuous growth of Ir-oxide, whereas during a PD procedure, Ir dissolution cannot be excluded.38
3.3 Oxidation state of Ir probed by in situ XANES
In the previous paragraphs, we showed that, within the potential window of interest, two phenomena occur on the surface of the as-prepared Ir NP, i.e. Ir oxidation and oxygen evolution. To have a more complete understanding, we probed the changes in the oxidation state of the Ir NP as a function of the electrode potential by in situ electrochemical X-ray absorption near edge structure (XANES) at the Ir L3 edge, see Fig. 3. We collected the XANES spectra under conditions similar to the ones used during the CO adsorption and Ir oxidation processes. To probe steady-state conditions, we always let the system stabilize for 5 minutes before starting with the data collection. We determined the energy of the L3 edge (E0) from the maximum of the first derivative of the XANES spectra (see Fig. S6†) to determine the position of the edge jump and the white line (WL) intensity, which corresponds closely to the density of unoccupied states. Generally, the adsorbed oxide species change the d-band of the metal: more vacancies are created as charge is withdrawn, with a consequential increase in the WL magnitude. It has already been shown that at high electrode potentials, the formation of oxides on Pt and Ir leads to an increase in the WL intensity.48–54 A fresh Ir NP sample, metallic Ir foil and IrO2 (Fig. S7†) were used as references. Every measurement was carried out by simultaneously recording XAS spectra of the reference Ir foil placed after the sample and the first ionization chamber. The E0 of the reference spectra was calibrated to an energy of 11215 eV. The XAS spectra recorded for the catalyst samples have been aligned according to the respective simultaneously recorded reference allowing a valid comparison between the different spectra. We also probed the reproducibility of the measurement by collecting additional spectra at the limits of the investigated potential range, i.e. 0.1 and 1.5 VRHE. The results are reported in Fig. S8† demonstrating that for both potentials, the spectra do not change over the duration of the experiment.
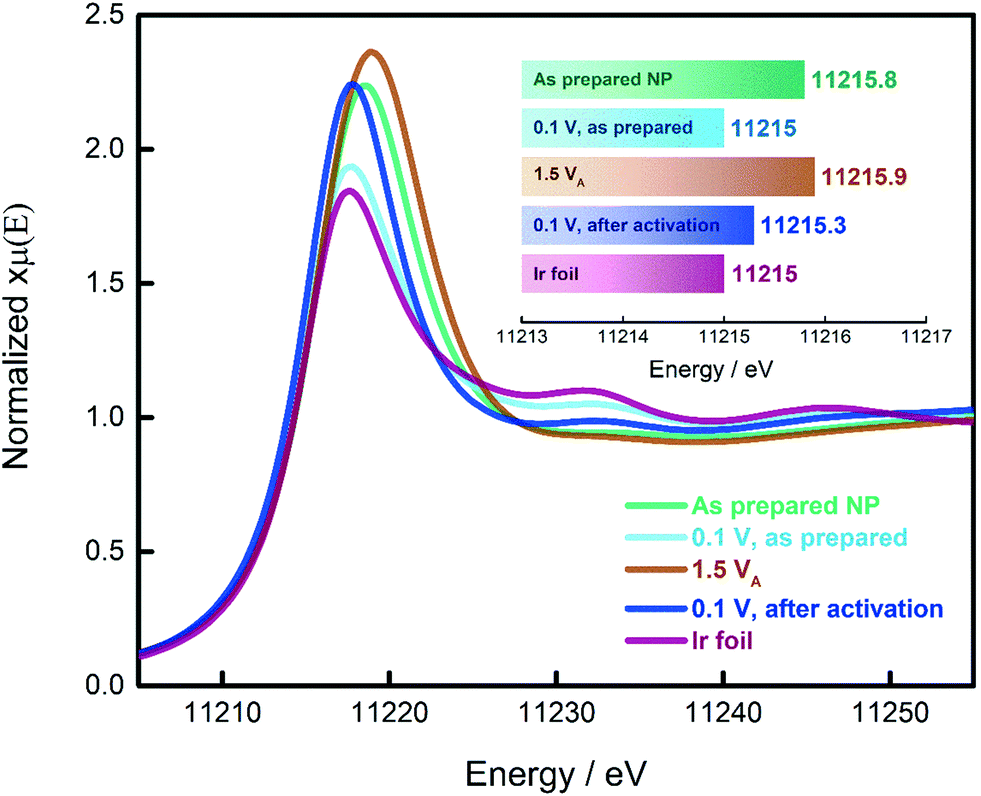 | ||
| Fig. 3 Normalized Ir L3-edge XANES spectra of the Ir NP recorded at different potentials under steady state conditions. VA stands for “anodic”. The inset shows the energy at the maximum of the first derivative of the XANES spectra for the different samples. The density of the data points in the plots is 5 points per eV. | ||
As demonstrated in the Ir L3 XANES spectra in Fig. 3, the as-prepared Ir NP exhibit a relative high WL intensity, comparable to Ir NP oxidized at potentials in the OER region, i.e. 1.5 VRHE. This high WL intensity indicates that the Ir NP are significantly oxidized after the synthesis and drying in air. However, subjecting the as-prepared Ir NP to reducing electrochemical conditions (electrode potential of 0.1 VRHE), the WL intensity significantly decreases matching that of the reference Ir foil. This finding confirms that the as-prepared Ir NP are completely reduced at this low electrode potential and justifies that the ECSA of the Ir NP can be determined using CO stripping measurements. By comparison, exposing the Ir NP to a high electrode potential (up to 1.5 VRHE) leads to an irreversible increase in the WL intensity, see Fig. 3. The WL intensity of the activated Ir NP recorded at 0.1 VRHE is significantly higher than the as-prepared Ir NP at 0.1 VRHE and reaches almost the WL intensity of Ir NP recorded at 1.5 VRHE. This is a significant finding and indicates that the activation leads to largely irreversible oxide formation. Even though the as-prepared (ex situ) and the activated (at 1.5 VRHE) Ir NP display very similar WL intensities and the same E0, the “nature” of the oxide clearly must be different. In the first case, the oxide is reversible, and complete reduction is possible. Contrarily, the electrochemically grown oxide during activation can only be partially reduced in agreement with the progressive decrease of the ECSAretained when the potential is increased.
3.4 Dependence of ECSA and the OER on Ir loading
Based on our results from the activation procedures, we decided to employ PS activation at 1.6 VRHE as standard in all subsequent measurements because the irreversible oxide formation is almost complete (only a very small amount of metallic Ir can be retained upon re-reduction at low potentials, i.e. 15%) and at the same time, harsh conditions that might lead to undesired catalyst degradation (especially in the RDE configuration) can be avoided. Moreover, PS activation seems more suitable for OER catalysts, bearing in mind that polymer electrolyte membrane water electrolyzers (PEMWE) are expected to work under continuous operations in a galvanostatic mode.55–57Having defined the activation procedure, we investigated the influence of the metal loading (Ir NP deposited on the GC tip) on the electrocatalytic OER behavior. Many applied OER catalysts are unsupported due to the lack of suitable supports that are highly conducting and at the same time able to withstand the harsh conditions of PEMWE without corroding.1,13 Consequently, Ir dispersion over membranes is quite poor and high loadings of Ir are necessary in order to meet the current density requirements (JGEO > 2 A cm−2).13,58 Therefore, we investigated how efficiently we can utilize the Ir colloid in a catalyst layer. For this, we prepared RDE tips with different Ir loadings and determined the ECSA to track possible particle agglomeration. Moreover, determining the ECSA is crucial to probe if the activity of individual active sites changes with the Ir loading (metallic vs. oxidized, interparticle and particle size effects59,60). Fig. 4a summarizes the ECSA calculated by CO stripping as a function of the Ir loading. It is seen that the ECSA follows an unexpected trend, i.e. at low and high loadings, the ECSA is rather low. This indicates particle aggregation with the “lack” as well as the “excess” of Ir NP. The observed behavior may be related to the GC structure that does not present suitable anchoring sites and a morphology that is able to keep the nanoparticles apart.61,62 Therefore, when low loadings are used, it seems that particles cannot distribute evenly over the entire GC disk and, instead, they tend to form islands due to reciprocal affinity (see Fig. S3† for images taken with an optical microscope). In contrast, at high loadings the limited area of the GC disk cannot host the high amount of Ir, which, therefore, starts to agglomerate into thick 3D branches (Fig. 4b). The behavior is different at intermediate loadings, i.e. 3.6 and 7.1 μgIr cm−2. It seems that the repulsion between particles due to the negative surface charge (as determined using zeta potential measurements) of the Ir NP overcomes the lack of anchoring sites of GC and the tendency of NP to interact between each other. Consequently, the NP rearrange into a 2D/3D network characterized by thin branches widespread over the entire surface (Fig. 4c). Under such conditions, the measured ECSAs are very high, i.e. 160 and 140 m2 g−1 for 7.1 and 14.3 μg cm−2, respectively. This is a significant improvement over state-of-the-art catalysts reported in the literature where values ranging between 15 and 60 m2 g−1 have been reported.20,23,24,63 The main reason has been found in the synthetic process which produces very small and surfactant-free NP as well as remarkably stable colloidal dispersions. Nevertheless, it is important here to stress that in all cases the NP seem to aggregate on the GC disk, and they cannot be considered as isolated particles. For comparison, we measured the ECSA of a commercial Ir black catalyst. The loading was chosen to be the same as the best performing homemade catalyst, i.e. 7.1 μgIr cm−2. We determined an ECSA of 32 m2 g−1, a significantly lower value. This apparent low Ir utilization can in part be attributed to a larger particle size of the commercial sample (TEM images in Fig. S4†). In addition, the surface area determination might be obscured due to irreversible surface oxidation, see discussion about the SA. After the surface area determination, we applied the PS activation protocol at 1.6 VRHE and investigated the influence of the Ir loading on the OER rate based on MA and SA, see Fig. 4a. It is found that the MA follows the same trend as determined for the ECSA with a maximum OER activity of 205 A g−1 at 1.5 VRHE for an Ir loading of 7.1 μg cm−2. The achieved MAs are around a factor of four times higher than that of the commercial Ir black catalyst (56 A g−1). The SA of the Ir NP stays constant within the experimental accuracy between 110 and 130 μA cm−2, whereas the commercial Ir black catalyst exhibits a higher SA of 183 μA cm−2. The high SA might indicate a particle size effect; however, in this case, the SA of the synthesized Ir NP should not be independent of the loading. In addition, a higher MA would be expected. Thus, the results strongly suggest underestimation of the surface area by CO stripping due to an irreversibly pre-oxidized surface.
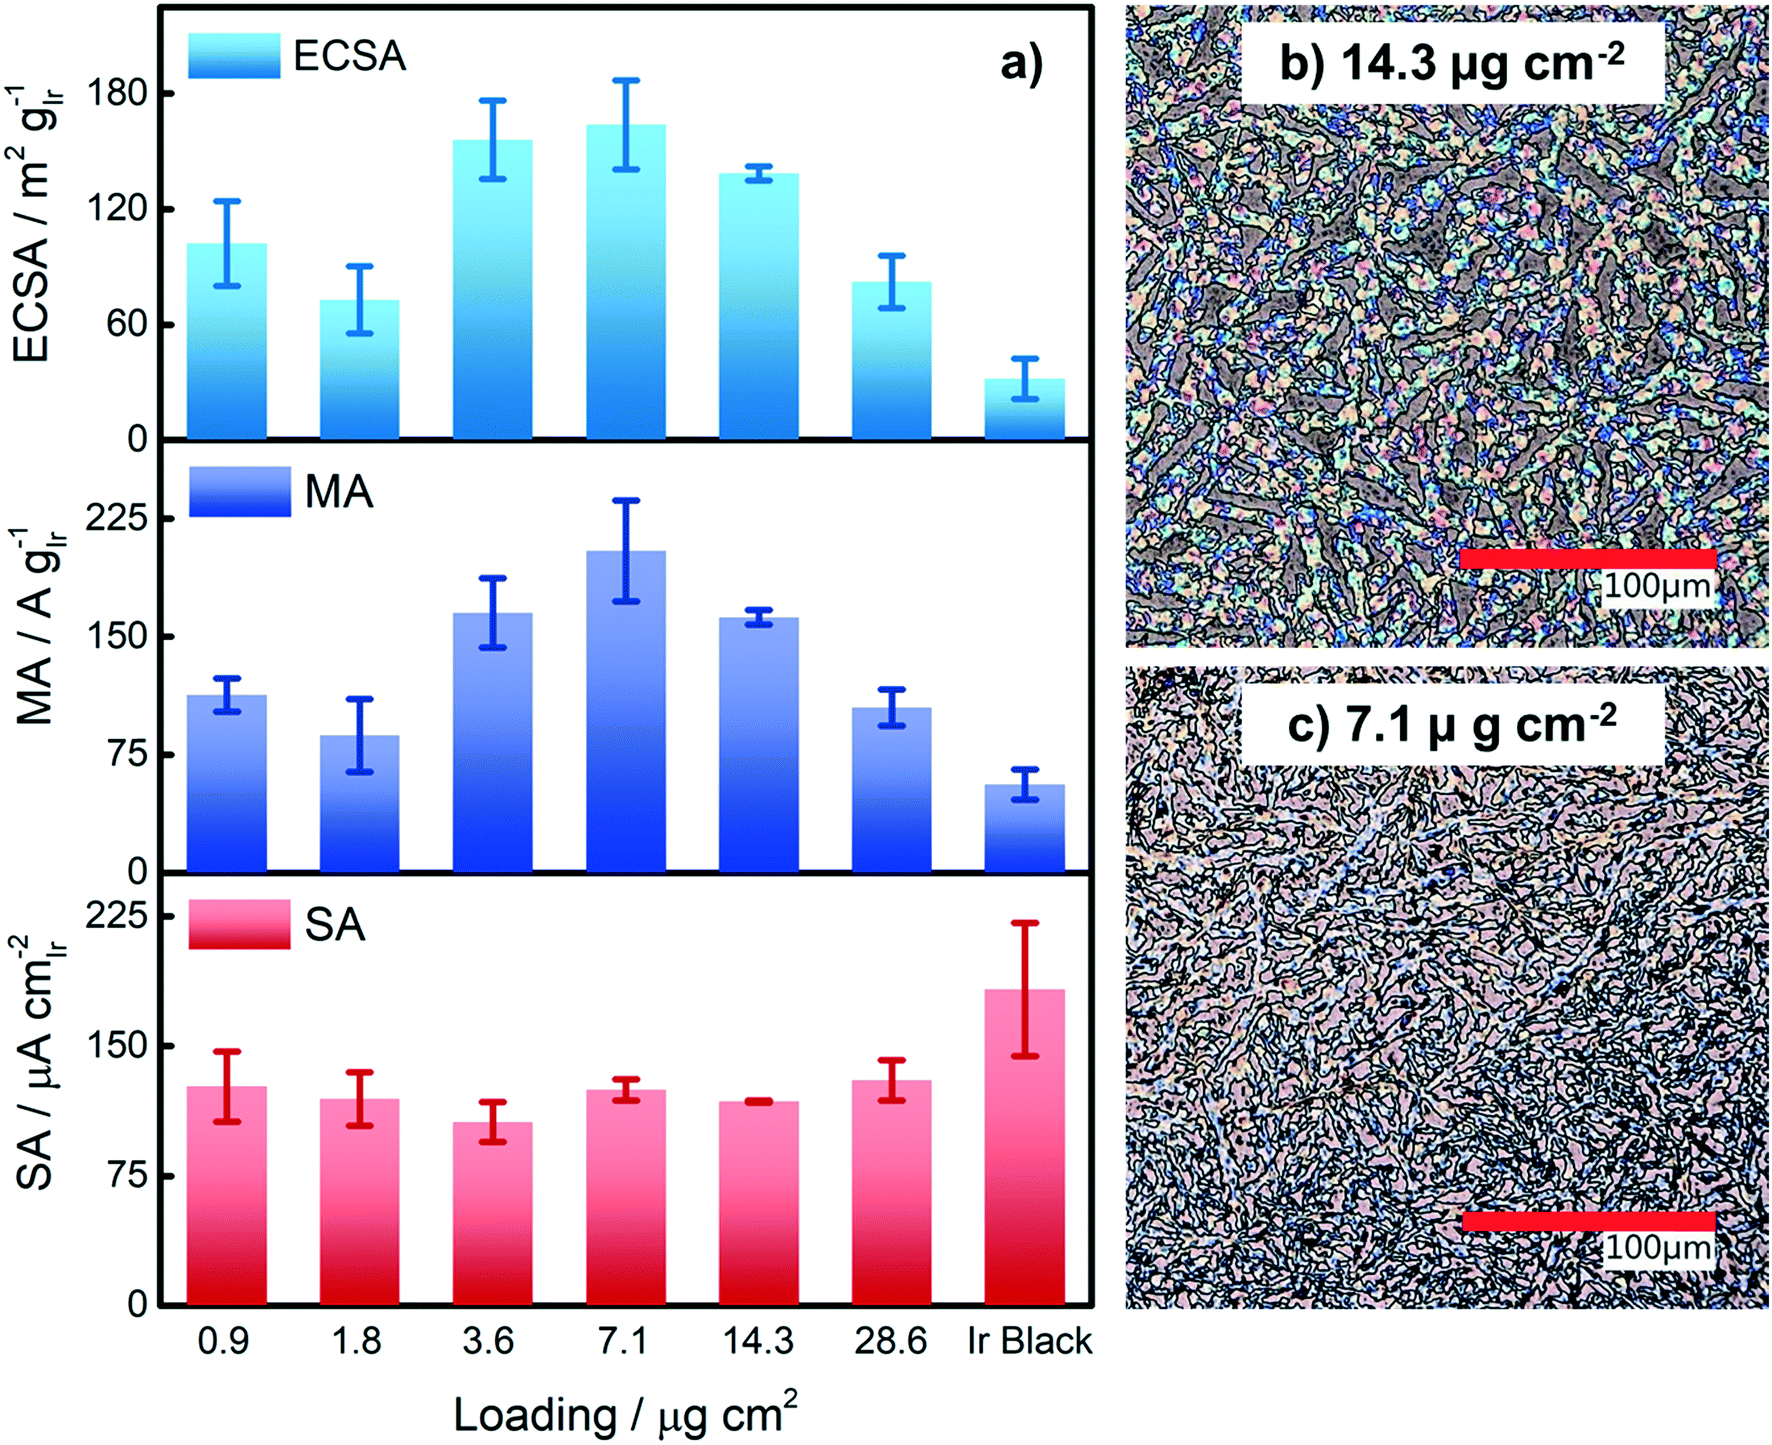 | ||
| Fig. 4 (a) ECSA, mass activity (MA) and specific activity (SA) as a function of Ir loading on the electrode. ECSA was determined by CO stripping. Loading for commercial Ir black is 7.1 μg cm−2. All the experiments were performed at room temperature. MA and SA were measured at 1.5 VRHE during the positive going scan. (b) and (c) Images taken with an optical microscope show NP deposited on the glassy carbon disks. The brown regions belong to the glassy carbon whereas the colorful network is produced by the NP. | ||
4 Conclusion
In our work, we introduced a new, reproducible and scalable method for the synthesis and benchmarking of very small and monodisperse Ir NP that exhibit excellent performance as OER catalysts. The small nanoparticle size leads to extremely efficient utilization of the rare and expensive Ir metal. The lack of a pronounced particle size effect such as that for Pt, i.e. reduction of the SA with decreasing particle size, guarantees that the ultrahigh dispersion of up to 160 m2 g−1 as compared to ca. 15–60 m2 g−1 in commercial catalysts can be fully utilized for the OER. As a consequence, the prepared electrodes exhibit a remarkable OER activity even without the help of a support. MAs higher than 200 A g−1 at 1.5 VRHE are measured excluding any artificial current contributions due to oxide formation. The Ir utilization and the resulting MA represent a significant improvement as compared to the state-of-the-art electrodes. The small Ir NP size along with the stability of the colloidal suspension makes this catalyst a promising candidate for the preparation of supported catalysts with extremely high ECSA.Conflicts of interest
The authors declare that the general synthesis method presented is subject to a patenting process (EP 3 329 990 A1, WO 2018/099958 A1).Acknowledgements
We would like to acknowledge the help of S. Simonen and L. Theil Kuhn, Technical University of Denmark, for access to electron microscopy facilities as well as SOLEIL for provision of synchrotron radiation beamtime at the ROCK beamline. M. A. acknowledges the financial support by the Swiss National Science Foundation (SNSF) via the project No. 200021_184742; J. Q. has received funding from the European Union‘s Horizon 2020 research and innovation program under the Marie Skłodowska-Curie grant agreement No. 703366 (SELECTRON).References
- I. Katsounaros, S. Cherevko, A. R. Zeradjanin and K. J. J. Mayrhofer, Oxygen Electrochemistry as a Cornerstone for Sustainable Energy Conversion, Angew. Chem., Int. Ed., 2014, 53(1), 102–121, DOI:10.1002/anie.201306588.
- A. R. Zeradjanin, Is a Major Breakthrough in the Oxygen Electrocatalysis Possible?, Curr. Opin. Electrochem., 2018, 9, 214–223, DOI:10.1016/j.coelec.2018.04.006.
- Z. W. Seh, J. Kibsgaard, C. F. Dickens, I. Chorkendorff, J. K. Nørskov and T. F. Jaramillo, Combining Theory and Experiment in Electrocatalysis: Insights into Materials Design, Science, 2017, 355(6321), eaad4998, DOI:10.1126/science.aad4998.
- N.-T. Suen, S.-F. Hung, Q. Quan, N. Zhang, Y.-J. Xu and H. M. Chen, Electrocatalysis for the Oxygen Evolution Reaction: Recent Development and Future Perspectives, Chem. Soc. Rev., 2017, 46(2), 337–365, 10.1039/C6CS00328A.
- X.-Y. Yu, Y. Feng, B. Guan, X. W. Lou and U. Paik, Carbon Coated Porous Nickel Phosphides Nanoplates for Highly Efficient Oxygen Evolution Reaction, Energy Environ. Sci., 2016, 9(4), 1246–1250, 10.1039/C6EE00100A.
- X. Lu and C. Zhao, Electrodeposition of Hierarchically Structured Three-Dimensional Nickel–Iron Electrodes for Efficient Oxygen Evolution at High Current Densities, Nat. Commun., 2015, 6(1), 6616, DOI:10.1038/ncomms7616.
- C. C. L. McCrory, S. Jung, I. M. Ferrer, S. M. Chatman, J. C. Peters and T. F. Jaramillo, Benchmarking Hydrogen Evolving Reaction and Oxygen Evolving Reaction Electrocatalysts for Solar Water Splitting Devices, J. Am. Chem. Soc., 2015, 137(13), 4347–4357, DOI:10.1021/ja510442p.
- C. C. L. McCrory, S. Jung, J. C. Peters and T. F. Jaramillo, Benchmarking Heterogeneous Electrocatalysts for the Oxygen Evolution Reaction, J. Am. Chem. Soc., 2013, 135(45), 16977–16987, DOI:10.1021/ja407115p.
- S. Jung, C. C. L. McCrory, I. M. Ferrer, J. C. Peters and T. F. Jaramillo, Benchmarking Nanoparticulate Metal Oxide Electrocatalysts for the Alkaline Water Oxidation Reaction, J. Mater. Chem. A, 2016, 4(8), 3068–3076, 10.1039/C5TA07586F.
- T. Reier, M. Oezaslan and P. Strasser, Electrocatalytic Oxygen Evolution Reaction (OER) on Ru, Ir, and Pt Catalysts: A Comparative Study of Nanoparticles and Bulk Materials, ACS Catal., 2012, 2(8), 1765–1772, DOI:10.1021/cs3003098.
- S. Siracusano, N. Hodnik, P. Jovanovic, F. Ruiz-Zepeda, M. Šala, V. Baglio and A. S. Aricò, New Insights into the Stability of a High Performance Nanostructured Catalyst for Sustainable Water Electrolysis, Nano Energy, 2017, 40, 618–632, DOI:10.1016/j.nanoen.2017.09.014.
- P. C. K. Vesborg and T. F. Jaramillo, Addressing the Terawatt Challenge: Scalability in the Supply of Chemical Elements for Renewable Energy, RSC Adv., 2012, 2(21), 7933, 10.1039/c2ra20839c.
- M. Carmo, D. L. Fritz, J. Mergel and D. Stolten, A Comprehensive Review on PEM Water Electrolysis, Int. J. Hydrogen Energy, 2013, 38(12), 4901–4934, DOI:10.1016/j.ijhydene.2013.01.151.
- M. Bernt and H. A. Gasteiger, Influence of Ionomer Content in IrO2/TiO2 Electrodes on PEM Water Electrolyzer Performance, J. Electrochem. Soc., 2016, 163(11), F3179–F3189, DOI:10.1149/2.0231611jes.
- S. Geiger, O. Kasian, A. M. Mingers, K. J. J. Mayrhofer and S. Cherevko, Stability Limits of Tin-Based Electrocatalyst Supports, Sci. Rep., 2017, 7(1), 4595, DOI:10.1038/s41598-017-04079-9.
- L. Wang, F. Song, G. Ozouf, D. Geiger, T. Morawietz, M. Handl, P. Gazdzicki, C. Beauger, U. Kaiser and R. Hiesgen, et al., Improving the Activity and Stability of Ir Catalysts for PEM Electrolyzer Anodes by SnO2 :Sb Aerogel Supports: Does V Addition Play an Active Role in Electrocatalysis?, J. Mater. Chem. A, 2017, 5(7), 3172–3178, 10.1039/C7TA00679A.
- D. Lebedev and C. Copéret, Small, Narrowly Distributed Iridium Nanoparticles Supported on Indium Tin Oxide for Efficient Anodic Water Oxidation, ACS Appl. Energy Mater., 2019, 2(1), 196–200, DOI:10.1021/acsaem.8b01724.
- H. Ohno, S. Nohara, K. Kakinuma, M. Uchida and H. Uchida, Effect of Electronic Conductivities of Iridium Oxide/Doped SnO2 Oxygen-Evolving Catalysts on the Polarization Properties in Proton Exchange Membrane Water Electrolysis, Catalysts, 2019, 9(1), 74, DOI:10.3390/catal9010074.
- C. Rozain, E. Mayousse, N. Guillet and P. Millet, Influence of Iridium Oxide Loadings on the Performance of PEM Water Electrolysis Cells: Part II – Advanced Oxygen Electrodes, Appl. Catal., B, 2016, 182, 123–131, DOI:10.1016/j.apcatb.2015.09.011.
- E. Oakton, D. Lebedev, M. Povia, D. F. Abbott, E. Fabbri, A. Fedorov, M. Nachtegaal, C. Copéret and T. J. Schmidt, IrO2 -TiO2 : A High-Surface-Area, Active, and Stable Electrocatalyst for the Oxygen Evolution Reaction, ACS Catal., 2017, 7(4), 2346–2352, DOI:10.1021/acscatal.6b03246.
- J. Quinson, S. Neumann, T. Wannmacher, L. Kacenauskaite, M. Inaba, J. Bucher, F. Bizzotto, S. B. Simonsen, L. Theil Kuhn and D. Bujak, et al. Colloids for Catalysts: A Concept for the Preparation of Superior Catalysts of Industrial Relevance, Angew. Chem., Int. Ed., 2018, 57(38), 12338–12341, DOI:10.1002/anie.201807450.
- J. Quinson, M. Inaba, S. Neumann, A. A. Swane, J. Bucher, S. B. Simonsen, L. Theil Kuhn, J. J. K. Kirkensgaard, K. M. Ø. Jensen and M. Oezaslan, et al., Investigating Particle Size Effects in Catalysis by Applying a Size-Controlled and Surfactant-Free Synthesis of Colloidal Nanoparticles in Alkaline Ethylene Glycol: Case Study of the Oxygen Reduction Reaction on Pt, ACS Catal., 2018, 8(7), 6627–6635, DOI:10.1021/acscatal.8b00694.
- H.-S. Oh, H. N. Nong, T. Reier, M. Gliech and P. Strasser, Oxide-Supported Ir Nanodendrites with High Activity and Durability for the Oxygen Evolution Reaction in Acid PEM Water Electrolyzers, Chem. Sci., 2015, 6(6), 3321–3328, 10.1039/C5SC00518C.
- S. M. Alia, B. Rasimick, C. Ngo, K. C. Neyerlin, S. S. Kocha, S. Pylypenko, H. Xu and B. S. Pivovar, Activity and Durability of Iridium Nanoparticles in the Oxygen Evolution Reaction, J. Electrochem. Soc., 2016, 163(11), F3105–F3112, DOI:10.1149/2.0151611jes.
- I. Schrader, J. Warneke, S. Neumann, S. Grotheer, A. A. Swane, J. J. K. Kirkensgaard, M. Arenz and S. Kunz, Surface Chemistry of “Unprotected” Nanoparticles: A Spectroscopic Investigation on Colloidal Particles, J. Phys. Chem. C, 2015, 119(31), 17655–17661, DOI:10.1021/acs.jpcc.5b03863.
- M. Newville, IFEFFIT: Interactive XAFS Analysis and FEFF Fitting, J. Synchrotron Radiat., 2001, 8(2), 322–324, DOI:10.1107/S0909049500016964.
- T. Binninger, E. Fabbri, A. Patru, M. Garganourakis, J. Han, D. F. Abbott, O. Sereda, R. Kötz, A. Menzel and M. Nachtegaal, et al., Electrochemical Flow-Cell Setup for In Situ X-Ray Investigations, J. Electrochem. Soc., 2016, 163(10), H906–H912, DOI:10.1149/2.0201610jes.
- S. M. Alia, K. E. Hurst, S. S. Kocha and B. S. Pivovar, Mercury Underpotential Deposition to Determine Iridium and Iridium Oxide Electrochemical Surface Areas, J. Electrochem. Soc., 2016, 163(11), F3051–F3056, DOI:10.1149/2.0071611jes.
- Y. Xia, T. D. Nguyen, M. Yang, B. Lee, A. Santos, P. Podsiadlo, Z. Tang, S. C. Glotzer and N. A. Kotov, Self-Assembly of Self-Limiting Monodisperse Supraparticles from Polydisperse Nanoparticles, Nat. Nanotechnol., 2011, 6(9), 580–587, DOI:10.1038/nnano.2011.121.
- G. Sonavane, K. Tomoda and K. Makino, Biodistribution of Colloidal Gold Nanoparticles after Intravenous Administration: Effect of Particle Size, Colloids Surf., B, 2008, 66(2), 274–280, DOI:10.1016/j.colsurfb.2008.07.004.
- J. Quinson, L. Kacenauskaite, J. Bucher, S. B. Simonsen, L. Theil Kuhn, M. Oezaslan, S. Kunz and M. Arenz, Controlled Synthesis of Surfactant-Free Water-Dispersible Colloidal Platinum Nanoparticles by the Co4Cat Process, ChemSusChem, 2019, 12(6), 1229–1239 CrossRef CAS PubMed.
- V. Goertz, N. Dingenouts and H. Nirschl, Comparison of Nanometric Particle Size Distributions as Determined by SAXS, TEM and Analytical Ultracentrifuge, Part. Part. Syst. Charact., 2009, 26(1–2), 17–24, DOI:10.1002/ppsc.200800002.
- H. Borchert, E. V. Shevchenko, A. Robert, I. Mekis, A. Kornowski, G. Grübel and H. Weller, Determination of Nanocrystal Sizes: A Comparison of TEM, SAXS, and XRD Studies of Highly Monodisperse CoPt3 Particles, Langmuir, 2005, 21(5), 1931–1936, DOI:10.1021/la0477183.
- I. Spanos, J. J. K. Kirkensgaard, K. Mortensen and M. Arenz, Investigating the Activity Enhancement on PtxCo1−x Alloys Induced by a Combined Strain and Ligand Effect, J. Power Sources, 2014, 245, 908–914, DOI:10.1016/j.jpowsour.2013.07.023.
- G. Pan, B. Zu, X. Guo, Y. Zhang, C. Li and H. Zhang, Preparation of Molecularly Imprinted Polymer Microspheres via Reversible Addition–Fragmentation Chain Transfer Precipitation Polymerization, Polymer, 2009, 50(13), 2819–2825, DOI:10.1016/j.polymer.2009.04.053.
- H.-S. Oh, H. N. Nong, T. Reier, A. Bergmann, M. Gliech, J. Ferreira de Araújo, E. Willinger, R. Schlögl, D. Teschner and P. Strasser, Electrochemical Catalyst–Support Effects and Their Stabilizing Role for IrOx Nanoparticle Catalysts during the Oxygen Evolution Reaction, J. Am. Chem. Soc., 2016, 138(38), 12552–12563, DOI:10.1021/jacs.6b07199.
- T. Reier, D. Teschner, T. Lunkenbein, A. Bergmann, S. Selve, R. Kraehnert, R. Schlögl and P. Strasser, Electrocatalytic Oxygen Evolution on Iridium Oxide: Uncovering Catalyst-Substrate Interactions and Active Iridium Oxide Species, J. Electrochem. Soc., 2014, 161(9), F876–F882, DOI:10.1149/2.0411409jes.
- O. Kasian, J.-P. Grote, S. Geiger, S. Cherevko and K. J. J. Mayrhofer, The Common Intermediates of Oxygen Evolution and Dissolution Reactions during Water Electrolysis on Iridium, Angew. Chem., Int. Ed., 2018, 57(9), 2488–2491, DOI:10.1002/anie.201709652.
- S. P. Kounaves and J. Buffle, Deposition and Stripping Properties of Mercury on Iridium Electrodes, J. Electrochem. Soc., 1986, 133(12), 2495–2498 CrossRef CAS.
- S. Zhao, H. Yu, R. Maric, N. Danilovic, C. B. Capuano, K. E. Ayers and W. E. Mustain, Calculating the Electrochemically Active Surface Area of Iridium Oxide in Operating Proton Exchange Membrane Electrolyzers, J. Electrochem. Soc., 2015, 162(12), F1292–F1298, DOI:10.1149/2.0211512jes.
- K. J. J. Mayrhofer, D. Strmcnik, B. B. Blizanac, V. Stamenkovic, M. Arenz and N. M. Markovic, Measurement of Oxygen Reduction Activities via the Rotating Disc Electrode Method: From Pt Model Surfaces to Carbon-Supported High Surface Area Catalysts, Electrochim. Acta, 2008, 53(7), 3181–3188, DOI:10.1016/j.electacta.2007.11.057.
- M. Arenz, K. J. J. Mayrhofer, V. Stamenkovic, B. B. Blizanac, T. Tomoyuki, P. N. Ross and N. M. Markovic, The Effect of the Particle Size on the Kinetics of CO Electrooxidation on High Surface Area Pt Catalysts, J. Am. Chem. Soc., 2005, 127(18), 6819–6829, DOI:10.1021/ja043602h.
- T. Pauporté, F. Andolfatto and R. Durand, Some Electrocatalytic Properties of Anodic Iridium Oxide Nanoparticles in Acidic Solution, Electrochim. Acta, 1999, 45(3), 431–439, DOI:10.1016/S0013-4686(99)00282-0.
- K. J. Klabunde and R. M. Richards, Nanoscale Materials in Chemistry, ed. K. J. Klabunde and R. M. Richards,John Wiley & Sons, Inc., Hoboken, NJ, USA, 2009, DOI:10.1002/9780470523674.
- F. Bizzotto, H. Ouhbi, Y. Fu, G. K. H. Wiberg, U. Aschauer and M. Arenz, Examining the Structure Sensitivity of the Oxygen Evolution Reaction on Pt Single-Crystal Electrodes: A Combined Experimental and Theoretical Study, ChemPhysChem, 2019 DOI:10.1002/cphc.201900193.
- S. Cherevko, A. R. Zeradjanin, A. A. Topalov, N. Kulyk, I. Katsounaros and K. J. J. Mayrhofer, Dissolution of Noble Metals during Oxygen Evolution in Acidic Media, ChemCatChem, 2014, 6(8), 2219–2223, DOI:10.1002/cctc.201402194.
- S. Geiger, O. Kasian, B. R. Shrestha, A. M. Mingers, K. J. J. Mayrhofer and S. Cherevko, Activity and Stability of Electrochemically and Thermally Treated Iridium for the Oxygen Evolution Reaction, J. Electrochem. Soc., 2016, 163(11), F3132–F3138, DOI:10.1149/2.0181611jes.
- D. F. Abbott, D. Lebedev, K. Waltar, M. Povia, M. Nachtegaal, E. Fabbri, C. Copéret and T. J. Schmidt, Iridium Oxide for the Oxygen Evolution Reaction: Correlation between Particle Size, Morphology, and the Surface Hydroxo Layer from Operando XAS, Chem. Mater., 2016, 28(18), 6591–6604, DOI:10.1021/acs.chemmater.6b02625.
- A. R. Hillman, M. A. Skopek and S. J. Gurman, X-Ray Spectroscopy of Electrochemically Deposited Iridium Oxide Films: Detection of Multiple Sites through Structural Disorder, Phys. Chem. Chem. Phys., 2011, 13(12), 5252–5263, 10.1039/C0CP01472A.
- Y. Mo, I. C. Stefan, W.-B. Cai, J. Dong, P. Carey and D. A. Scherson, In Situ Iridium LIII -Edge X-Ray Absorption and Surface Enhanced Raman Spectroscopy of Electrodeposited Iridium Oxide Films in Aqueous Electrolytes, J. Phys. Chem. B, 2002, 106(14), 3681–3686, DOI:10.1021/jp014452p.
- M. Teliska, V. S. Murthi, S. Mukerjee and D. E. Ramaker, Correlation of Water Activation, Surface Properties, and Oxygen Reduction Reactivity of Supported Pt–M/C Bimetallic Electrocatalysts Using XAS, J. Electrochem. Soc., 2005, 152(11), A2159, DOI:10.1149/1.2040949.
- S. Mukerjee, S. Srinivasan, M. P. Soriaga and J. McBreen, Effect of Preparation Conditions of Pt Alloys on Their Electronic, Structural, and Electrocatalytic Activities for Oxygen Reduction - XRD, XAS, and Electrochemical Studies, J. Phys. Chem., 1995, 99(13), 4577–4589, DOI:10.1021/j100013a032.
- S. Mukerjee, Role of Structural and Electronic Properties of Pt and Pt Alloys on Electrocatalysis of Oxygen Reduction, J. Electrochem. Soc., 1995, 142(5), 1409, DOI:10.1149/1.2048590.
- A. E. Russell, S. Maniguet, R. J. Mathew, J. Yao, M. A. Roberts and D. Thompsett, In Situ X-Ray Absorption Spectroscopy and X-Ray Diffraction of Fuel Cell Electrocatalysts, J. Power Sources, 2001, 96(1), 226–232, DOI:10.1016/S0378-7753(01)00573-0.
- C. Rakousky, U. Reimer, K. Wippermann, S. Kuhri, M. Carmo, W. Lueke and D. Stolten, Polymer Electrolyte Membrane Water Electrolysis: Restraining Degradation in the Presence of Fluctuating Power, J. Power Sources, 2017, 342, 38–47, DOI:10.1016/j.jpowsour.2016.11.118.
- S. Sun, Z. Shao, H. Yu, G. Li and B. Yi, Investigations on Degradation of the Long-Term Proton Exchange Membrane Water Electrolysis Stack, J. Power Sources, 2014, 267, 515–520, DOI:10.1016/j.jpowsour.2014.05.117.
- H. Su, V. Linkov and B. J. Bladergroen, Membrane Electrode Assemblies with Low Noble Metal Loadings for Hydrogen Production from Solid Polymer Electrolyte Water Electrolysis, Int. J. Hydrogen Energy, 2013, 38(23), 9601–9608, DOI:10.1016/j.ijhydene.2013.05.099.
- Ö. F. Selamet, F. Becerikli, M. D. Mat and Y. Kaplan, Development and Testing of a Highly Efficient Proton Exchange Membrane (PEM) Electrolyzer Stack, Int. J. Hydrogen Energy, 2011, 36(17), 11480–11487, DOI:10.1016/j.ijhydene.2011.01.129.
- M. Nesselberger, M. Roefzaad, R. Fayçal Hamou, P. Ulrich Biedermann, F. F. Schweinberger, S. Kunz, K. Schloegl, G. K. H. Wiberg, S. Ashton and U. Heiz, et al., The Effect of Particle Proximity on the Oxygen Reduction Rate of Size-Selected Platinum Clusters, Nat. Mater., 2013, 12(10), 919–924, DOI:10.1038/nmat3712.
- M. Nesselberger, S. Ashton, J. C. Meier, I. Katsounaros, K. J. J. Mayrhofer and M. Arenz, The Particle Size Effect on the Oxygen Reduction Reaction Activity of Pt Catalysts: Influence of Electrolyte and Relation to Single Crystal Models, J. Am. Chem. Soc., 2011, 133(43), 17428–17433, DOI:10.1021/ja207016u.
- N. Job, M. F. R. Pereira, S. Lambert, A. Cabiac, G. Delahay, J.-F. Colomer, J. Marien, J. L. Figueiredo and J.-P. Pirard, Highly Dispersed Platinum Catalysts Prepared by Impregnation of Texture-Tailored Carbon Xerogels, J. Catal., 2006, 240(2), 160–171, DOI:10.1016/j.jcat.2006.03.016.
- A. E. Aksoylu, M. Madalena, A. Freitas, M. F. R. Pereira and J. L. Figueiredo, The Effects of Different Activated Carbon Supports and Support Modifications on the Properties of Pt/AC Catalysts, Carbon, 2001, 39(2), 175–185, DOI:10.1016/S0008-6223(00)00102-0.
- Y. Lee, J. Suntivich, K. J. May, E. E. Perry and Y. Shao-Horn, Synthesis and Activities of Rutile IrO2 and RuO2 Nanoparticles for Oxygen Evolution in Acid and Alkaline Solutions, J. Phys. Chem. Lett., 2012, 3(3), 399–404, DOI:10.1021/jz2016507.
Footnote |
| † Electronic supplementary information (ESI) available. See DOI: 10.1039/c9cy01728c |
| This journal is © The Royal Society of Chemistry 2019 |