 Open Access Article
Creative Commons Attribution 3.0 Unported Licence
In situ scanning tunneling microscopy studies of the SEI formation on graphite electrodes for Li+-ion batteries
Lukas
Seidl
*abcd,
Slađana
Martens
bc,
Jiwei
Ma
bce,
Ulrich
Stimming
acdf and
Oliver
Schneider
*bcd
aPhysik-Department, Technische Universität München, James-Franck Straße 1, 85748 Garching, Germany. E-mail: lukas.seidl@tum.de
bInstitut für Informatik VI, Technische Universität München, Schleißheimerstraße 90a, 85748 Garching, Germany. E-mail: oliver_m.schneider@tum.de
cElectrochemical Research Group, Technische Universität München, Schleißheimerstraße 90a, 85748 Garching, Germany
dJoint Research Institute for Advanced Power Sources for Electric Vehicles, Technische Universität München, 85748 Garching, Germany
eHubei Collaborative Innovation Centre for Advanced Organic Chemical Materials, Faculty of Materials Science and Engineering, Hubei University, 430062 Wuhan, China
fSchool of Chemistry, Newcastle University, Newcastle Upon Tyne NE1 7RU, UK
First published on 19th April 2016
Abstract
The SEI-formation on graphitic electrodes operated as an Li+-ion battery anode in a standard 1 M LiPF6 EC/DMC (1![[thin space (1/6-em)]](https://www.rsc.org/images/entities/char_2009.gif) :
:![[thin space (1/6-em)]](https://www.rsc.org/images/entities/char_2009.gif) 1) electrolyte has been studied in situ by EC-STM. Two different modes of in situ study were applied, one, which allowed to follow topographic and crystallographic changes (solvent cointercalation, graphite exfoliation, SEI precipitation on the HOPG basal plane) of the graphite electrode during SEI-formation, and the second, which gave an insight into the SEI precipitation on the HOPG basal plane in real time. From the in situ EC-STM studies, not only conclusions about the SEI-topography could be drawn, but also about the formation mechanism and the chemical composition, which strongly depend on the electrode potential. It was shown that above 1.0 V vs. Li/Li+ the SEI-formation is still reversible, since the molecular structure of the solvent molecules remains intact during an initial reduction step. During further reduction, the molecular structures of the solvents are destructed, which causes the irreversible charge loss. The STM studies were completed by electrochemical methods, like cyclic voltammetry, the potentiostatic intermittent titration technique and charge/discharge tests of MCMB electrodes.
1) electrolyte has been studied in situ by EC-STM. Two different modes of in situ study were applied, one, which allowed to follow topographic and crystallographic changes (solvent cointercalation, graphite exfoliation, SEI precipitation on the HOPG basal plane) of the graphite electrode during SEI-formation, and the second, which gave an insight into the SEI precipitation on the HOPG basal plane in real time. From the in situ EC-STM studies, not only conclusions about the SEI-topography could be drawn, but also about the formation mechanism and the chemical composition, which strongly depend on the electrode potential. It was shown that above 1.0 V vs. Li/Li+ the SEI-formation is still reversible, since the molecular structure of the solvent molecules remains intact during an initial reduction step. During further reduction, the molecular structures of the solvents are destructed, which causes the irreversible charge loss. The STM studies were completed by electrochemical methods, like cyclic voltammetry, the potentiostatic intermittent titration technique and charge/discharge tests of MCMB electrodes.
Introduction
Since its discovery in 19791 the Solid Electrolyte Interphase (SEI) formation on anodes in non-aqueous batteries has aroused research interest due to its importance for batteries. The batteries can benefit from a proper SEI, as it can increase their cycle life, lifetime, power capability and safety.2 The SEI builds up a compact surface film on the anode acting as a membrane, being a Li+-ion conductor and an electronic insulator.2,3 The cycle life and lifetime of the battery are extended by the SEI, because of the compact SEI film stabilizing the electrodes against exfoliation and preventing the remaining electrolyte from further decomposition.4–6In recent literature, many different aspects regarding the SEI formation on graphitic electrodes were the focus of research. Publications address fundamental questions ranging from its chemical composition and structure, studied among others by TOF SIMS,7 SECM,8–10 SEM, TEM, NMR, XPS, FTIR,11,12 NSOM13 to AFM14–16 and theoretical molecular dynamics studies17,18 dedicated to the formation mechanism. Besides deepening the fundamental understanding of the SEI, efforts also aim at improving its operating properties by tailoring the chemical composition of the electrolyte taking advantage of additives,19–21 or by treating the graphite electrodes prior to cell assembly to avoid exfoliation.22,23
The SEI-formation is described as a result of the electrochemical reduction of electrolyte components at the anode, including organic carbonate solvents and Li-salts. Cyclic carbonates, such as ethylene carbonate (EC), propylene carbonate (PC) and vinylene carbonate (VC), are reduced via the acceptance of an electron and a Li+-ion (Scheme 1 (1)), resulting in a ring opening2,24–28 and the formation of a radical anion24 (Scheme 1 (2)). In the case of EC, several subsequent reduction pathways are possible: in an overall 1-electron-reduction pathway the electron transfer step is followed by the combination of two radical anions (Scheme 1 (3)), leading to the formation of dialkyl carbonate and ethylene gas (Scheme 1 (4)). This pathway however requires sufficiently low potentials, whereas a 2-electron-reduction occurs already at higher potentials,29 leading to the formation of a LiCO3− ion and ethylene gas (Scheme 1 (5)), followed by the reaction of the LiCO3− ion with a radical ion (Scheme 1 (6)), also leading to dialkyl carbonate (Scheme 1 (7)). The overall formation of Li2CO3 with Li+-ion uptake of the LiCO3− ion as the final step represents a competitive 2-electron-reduction (Scheme 1 (8)).
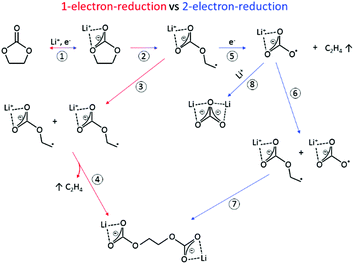 | ||
| Scheme 1 Reduction mechanism of EC via a 1-electron-reduction (steps 1–4) and a 2-electron-reduction pathway (steps 1, 2, 5–7 with 8 as a side reaction) proposed by the literature.24,29–31,36,37 | ||
Linear carbonates like dimethyl carbonate (DMC) are reduced via a one electron reaction being associated with the substitution of a methyl-group for a Li+-ion, resulting in the formation of lithium methyl carbonate and ethane gas30,31 (Scheme 2). Li-salts also play a crucial role: LiPF6 for instance is known to decompose to LiF and to PF5![[thin space (1/6-em)]](https://www.rsc.org/images/entities/char_2009.gif) 2,32–35 (Scheme 3). PF5 can undergo further reactions with Li2CO3 formed for example during the reduction of EC, and form POF3, LiF and CO2. Traces of water can also lead to the formation of HF. All the reduction products, where the fluoride species play a crucial role, can react further resulting in a complex mixture of different fluorides, oxides, phosphates, oligomers2,24–28,30 and lithium carbonates like Li2CO3.24,31
2,32–35 (Scheme 3). PF5 can undergo further reactions with Li2CO3 formed for example during the reduction of EC, and form POF3, LiF and CO2. Traces of water can also lead to the formation of HF. All the reduction products, where the fluoride species play a crucial role, can react further resulting in a complex mixture of different fluorides, oxides, phosphates, oligomers2,24–28,30 and lithium carbonates like Li2CO3.24,31
 | ||
| Scheme 2 Reduction of DMC proposed by the literature.30,31 | ||
 | ||
| Scheme 3 LiPF6 decomposition and the formation of HF induced by traces of water.2,32–35 | ||
The multitude of reduced species thus forms precipitates and builds a film on the electrode, growing in thickness with time, leading to an increased electron tunneling resistance, thus hampering the further electrolyte reduction process. This limits the thickness of the SEI to a few nanometers,2,11,15,16,18,33,38–43 being the typical electron tunneling range. In his original SEI-formation paper, Peled1 proposed a SEI-formation model based on electron tunneling, also being discussed by others.2,33,40,43–46 Besides the electron tunneling model, also a solvent diffusion model is discussed, in which the SEI growth rate is determined by the diffusion rate of solvent molecules through the SEI towards the electrode surface, where the solvent reduction leads to a further SEI growth.47–49
Within the SEI, the tunneling resistance gradually increases being associated with a potential drop and a decrease of reduction strength with an increasing distance from the electrode. Thus, the SEI components in close vicinity to the electrode consist of more strongly reduced species compared to the components in contact with the electrolyte. Because of this, a variety of studies observed a larger content of organic compounds, such as oligomers from the electrolyte decomposition products, close to the electrolyte side of the SEI, whereas a compact layer of fully reduced species, like fluorides, oxides and other elements have been found close to the electrode.2,15,39,43,50–53
The chemical composition and the formation mechanism are also found to be dependent on the electrode morphology. The SEI formed on the graphite basal plane is for instance reported to be thinner than on the cross-section,54–56 because the cross-sectional surfaces are more reactive towards reduction of the electrolyte anions than the basal plane.40,56,57 Due to the increased proportion of anion reduction (higher exchange current density, role of intermediate ternary graphite intercalation compounds formed at the edges of the basal planes) and resulting higher supersaturation of the formed inorganic reaction products, the SEI at cross-sectional surfaces is also more inorganic than the basal plane SEI.54,55
The scope of the current paper is to study the formation mechanism, especially with respect to the different potential dependent steps and to the topographical appearance, of the SEI. For that purpose, graphitic electrodes, namely highly oriented pyrolytic graphite (HOPG) immersed in a commercial electrolyte composed of 1 M LiPF6 in EC/DMC were mainly studied by EC-STM. Even though Inaba et al.58–64 and others14,15,65–67 already, twenty years ago, started studying the SEI by scanning probe techniques (SPM), namely EC-STM and EC-AFM, these techniques can still give new insights. Inaba's focus lay on studying the cointercalation of solvated Li+-ions together with their solvation shell, leading to mechanical strain in the graphite lattice, induced by immobile reduction products from SEI-formation and resulting in an undesired exfoliation and hence electrode destruction. The cointercalation model was first described by Besenhard et al.68 In contrast to most of the above publications, the measurements presented here are not only conducted in situ, but also in real time, giving new insights into the formation mechanisms of the SEI. The STM studies are complemented by a variety of electrochemical methods both on HOPG and on mesocarbon microbeads.
Experimental
Prior to STM experiments, the HOPG samples (MikroMasch, ZYB) were freshly cleaved with adhesive tape leading to a clean and flat basal plane. During the experiments, HOPG served as a working electrode in an electrochemical cell with a surface area of 0.125 cm2. The electrolyte used was a solution of 1 M LiPF6 dissolved in a 1![[thin space (1/6-em)]](https://www.rsc.org/images/entities/char_2009.gif) :
:![[thin space (1/6-em)]](https://www.rsc.org/images/entities/char_2009.gif) 1 (by volume) mixture of EC/DMC (Solvionics, H2O < 20 ppm). It was further dried by using 3 Å molecular sieves (Merck Millipore). Counter and reference electrodes were made from Li-metal (Alfa Aesar, 99.9%). A mechanically cut 0.25 mm Pt/Ir-wire (80
1 (by volume) mixture of EC/DMC (Solvionics, H2O < 20 ppm). It was further dried by using 3 Å molecular sieves (Merck Millipore). Counter and reference electrodes were made from Li-metal (Alfa Aesar, 99.9%). A mechanically cut 0.25 mm Pt/Ir-wire (80![[thin space (1/6-em)]](https://www.rsc.org/images/entities/char_2009.gif) :
:![[thin space (1/6-em)]](https://www.rsc.org/images/entities/char_2009.gif) 20) (MaTecK) insulated with an electrochemically inert Apiezone® wax (Plano GmbH) was used as a STM tip. The wax was heated up to 200 °C during the insulation procedure. The STM tip was held at a potential of 2.1 V against Li/Li+ in all STM measurements. The microscope is a homemade system composed of a PicoSPM STM base (Agilent Technologies®, formerly Molecular Imaging®) with a Pico STM S scanner and a Nanoscope IIIA controller (Veeco Instruments Inc.®). The device is combined with an EC-Tec bipotentiostat/galvanostat BP600 and an EC-Tec biscangenerator SG600. The STM was operated with Nanoscope v5.31.r1 software and the potentiostats were controlled and read out with a labview® program BP600. STM data were evaluated with the WSxM software.69
20) (MaTecK) insulated with an electrochemically inert Apiezone® wax (Plano GmbH) was used as a STM tip. The wax was heated up to 200 °C during the insulation procedure. The STM tip was held at a potential of 2.1 V against Li/Li+ in all STM measurements. The microscope is a homemade system composed of a PicoSPM STM base (Agilent Technologies®, formerly Molecular Imaging®) with a Pico STM S scanner and a Nanoscope IIIA controller (Veeco Instruments Inc.®). The device is combined with an EC-Tec bipotentiostat/galvanostat BP600 and an EC-Tec biscangenerator SG600. The STM was operated with Nanoscope v5.31.r1 software and the potentiostats were controlled and read out with a labview® program BP600. STM data were evaluated with the WSxM software.69
The STM base is placed inside a reinforced Ar-filled (Westfalen, 5.0) glovebox (MBRAUN, MB 200 B glovebox and MB 20G LMF gas purifier) containing a massive granite plate suspended on damping elements, making the glovebox suitable for SPM operation. In addition, the microscope was placed on further rubber damping elements and on another heavy steel block. Moreover, the atmosphere circulation and the vacuum pump of the glovebox were switched off during imaging in order to minimize mechanical disturbance.
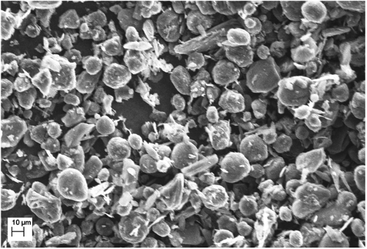
Battery tests were conducted in Swagelok® cells consisting of a circular working electrode (10 mm) composed of mesocarbon microbeads (MCMB, TB-17) coated on a Cu-foil (9 μm). The MCMB graphite powder was imaged by using a Zeiss EVO MA10 Scanning Electron Microscope (SEM) and consists of particles with an average diameter of 17 μm (Fig. 1). The ink for the electrode coating was prepared by mechanically grinding 90% of MCMB as the active material plus 10% of a PVDF (Kynar 900 HSV) binder diluted with NMP solvent in a mortar thoroughly. After coating a 250 μm film on the Cu-foil and subsequent drying overnight at 50 °C, the electrodes were cut using a 10 mm punch. Thereafter, the electrodes were mechanically pressed with 1 bar pressure in between 2 polished steel stamps (Mauthe Maschinenbau, KBr-press PE-011). Finally, the electrodes were vacuum dried at 120 °C for 2 h (Büchi Glass Oven B-585) and transferred to an Ar-filled glovebox for storage and cell assembly. Again, circularly-cut Li-metal sheets were used as counter (10 mm) and reference electrodes (6 mm). In order to prevent direct contact between the electrodes, glass fiber separators (VWR collection, particle retention: 1.6 μm) were sandwiched between them. Also, the separators were soaked with a 40 μL electrolyte (1 M LiPF6 in EC/DMC (1![[thin space (1/6-em)]](https://www.rsc.org/images/entities/char_2009.gif) :
:![[thin space (1/6-em)]](https://www.rsc.org/images/entities/char_2009.gif) 1)) each, serving as an electrolyte reservoir. The total electrolyte content in one cell amounts to 120 μL. The battery tests were performed with Gamry® potentiostats (Interface 100) with the Gamry Instruments Framework Data Acquisition Software (Version 6.10).
1)) each, serving as an electrolyte reservoir. The total electrolyte content in one cell amounts to 120 μL. The battery tests were performed with Gamry® potentiostats (Interface 100) with the Gamry Instruments Framework Data Acquisition Software (Version 6.10).
Results
Electrochemistry
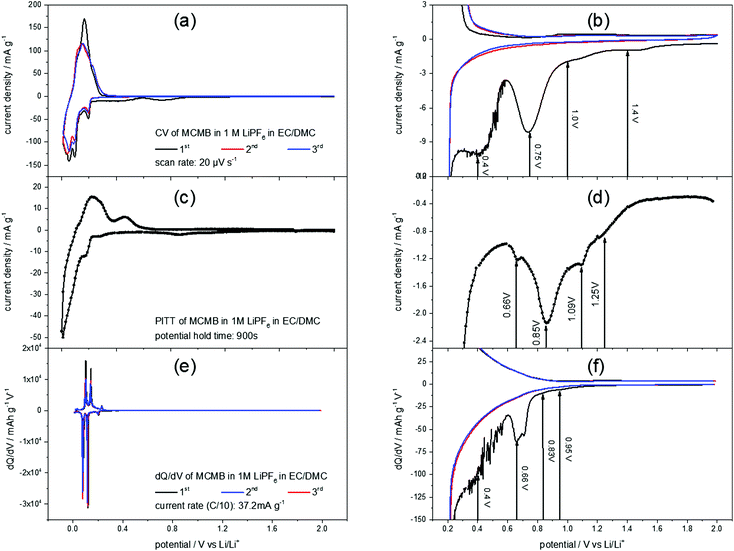
Fig. 2(a) shows a slow scan rate cyclic voltammogram (CV) of a MCMB anode in 1 M LiPF6 in EC/DMC. The reversible Li+-ion intercalation, ranging from 0 V to 0.3 V, clearly shows the aptitude of graphite as a low voltage anode material. For the discussion of the SEI-formation, however, the high potential region of the CV is of interest (Fig. 2(b)). The difference between the first and the consecutive scans is obvious: the first cycle shows unique features in the cathodic scan while the second and the third scans almost match each other. These features include higher currents throughout the entire potential range, as well as a shoulder at 1.4 V, followed by another shoulder at 1.0 V flanking a peak at 0.75 V. Around 0.4 V another peak appears, before the Li+-ion intercalation starts. No corresponding anodic features appear, supporting the irreversible character of the processes during the first cycle.In order to complete the understanding of the electrochemical processes during SEI-formation, the potentiostatic intermittent titration technique (PITT) was applied. Fig. 2(c) and (d) show a PITT-diagram of a MCMB-anode in 1 M LiPF6 in EC/DMC, where the electrode potential was stepwise changed from 2.0 V to 0.01 V and back to 2.0 V in 10 mV steps. After each potential step a current transient was recorded for 15 minutes, followed by a 15 minutes rest at OCP. The PITT-diagram shows the current density of every transient after 15 minutes plotted against the applied electrode potential.
Similar to the CV of MCMB (Fig. 2(a) and (b)), the PITT curve reflects the lithiation/delithiation peaks in the low potential region and the multiple steps of SEI-formation in the high potential region. As in the CV of MCMB, the SEI-formation leads to a shoulder at 1.25 V, followed by another shoulder at 1.09 V. Then, the main SEI-peak is found at 0.85 V, accompanied by a shoulder at 0.66 V.
Also from a dQ/dV-plot (Fig. 2(e) and (f)), which was derived from the first three charge/discharge-cycles of a MCMB electrode in 1 M LiPF6 in EC/DMC at a current density of 37.2 mA g−1, corresponding to a rate of C/10, similar findings can be obtained. As in the CV (Fig. 2(a) and (b)) and in the PITT-diagram (Fig. 2(c) and (d)), the dQ/dV-plot shows the Li+-ion intercalation/deintercalation in the low potential region. The SEI-formation shows the previously found features, which are a shoulder at 0.95 V, followed by another shoulder at 0.83 V. Then a peak at 0.66 V appears, while the last SEI-formation step occurs in a potential range below 0.6 V. This last step of SEI-formation is associated with a higher level of noise, as can be seen in Fig. 2(b) and (f).
As the STM experiments had to be conducted on a HOPG electrode, a CV of HOPG in 1 M LiPF6 in EC/DMC was measured in order to guarantee a similar electrochemical behavior (Fig. 3). In comparison to the voltammograms of MCMB (Fig. 2), HOPG shows almost the same SEI-formation behavior. The first shoulder appears at a potential of 1.25 V, followed by the second shoulder at the foot of the main SEI peak at 1.0 V. The peak potential of the pronounced main peak shifts to lower potentials compared to MCMB (Fig. 2(b)), which is found at 0.65 V for HOPG. Similar to the PITT voltammogram (Fig. 2(d)), the last peak in the CV of HOPG at 0.53 V is not as clearly pronounced as in the CV of MCMB (Fig. 2(b)).
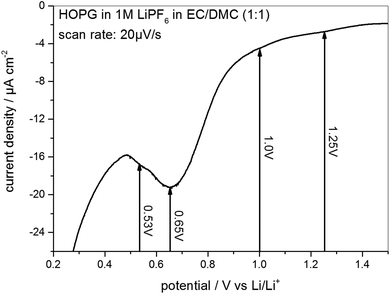 | ||
Fig. 3 SEI formation region of a cyclic voltammogram of HOPG in 1 M LiPF6 dissolved in EC/DMC (1![[thin space (1/6-em)]](https://www.rsc.org/images/entities/char_2009.gif) : :![[thin space (1/6-em)]](https://www.rsc.org/images/entities/char_2009.gif) 1). Potential sweep rate: 20 μV s−1. 1). Potential sweep rate: 20 μV s−1. | ||
In summary, the voltammograms of MCMB (Fig. 2) as well as the CV of HOPG (Fig. 3) show similar features indicating that the SEI forms in four major steps. In addition, their similarity also implies that one can very well compare the SEI-formation on HOPG and on MCMB and draw the same conclusions for both systems.
EC-STM
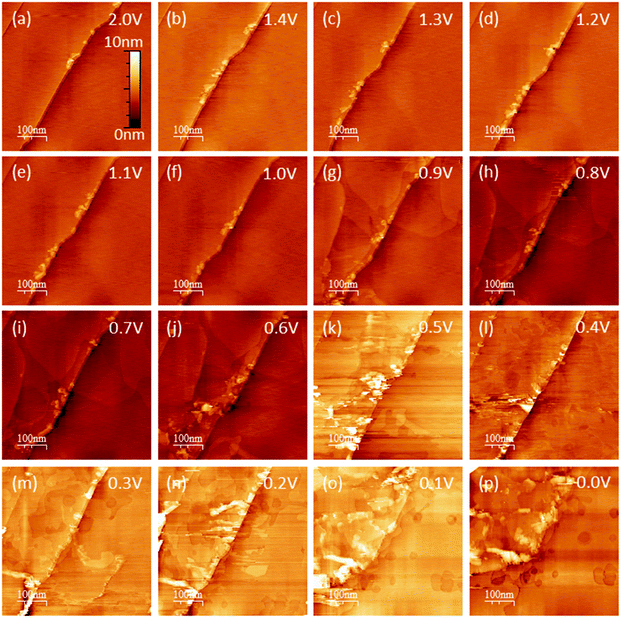
EC-STM as a powerful in situ technique was used in the following to complement the electrochemical understanding of the SEI-formation on graphite anodes in carbonate based electrolytes for Li+-ion batteries. In the first experiment, EC-STM imaging of the SEI-formation on a HOPG electrode in a 1 M LiPF6 in EC/DMC solution was conducted in situ but at a fixed potential of 2.0 V. Fig. 4 shows a series of STM images, always recorded at the same position. The experiment was conducted as follows: first, a STM image (Fig. 4(a)) was measured of the pristine HOPG surface, while the potential was held at 2.0 V, which was well above the onset potential of the SEI-formation. Then, a voltammetric cycle of the sample was carried out from 2.0 V to 1.4 V and back to 2.0 V with a potential sweep rate of 5 mV s−1 (Fig. 5). Thereafter, another STM image was measured at the same position as before. This procedure was repeated, while the lower vertex potential of the CV was stepwise lowered by 0.1 V.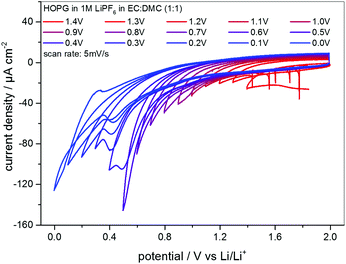 | ||
Fig. 5 Series of CVs of HOPG in 1 M LiPF6 dissolved in EC/DMC (1![[thin space (1/6-em)]](https://www.rsc.org/images/entities/char_2009.gif) : :![[thin space (1/6-em)]](https://www.rsc.org/images/entities/char_2009.gif) 1). The lower vertex potential was decreased stepwise from 1.4 V to 0.0 V. Potential sweep rate: 5 mV s−1. 1). The lower vertex potential was decreased stepwise from 1.4 V to 0.0 V. Potential sweep rate: 5 mV s−1. | ||
Hence, the STM images in Fig. 4 always show the HOPG surface after they had been polarized to the potential indicated in every image. As can be seen from the images of Fig. 4(a)–(f), no changes are visible on the HOPG surface above 1.0 V. One sees largely extended, atomically flat terraces, which are interrupted by a 2 nm step edge running diagonally through the image from the bottom left to the upper right. Since the interplanar spacing between two adjacent graphene layers in a graphite crystal amounts to 3.35 Å,70 this step edge consists of 6 graphene layers. Exfoliated graphene flakes decorate these step edges. In the upper left corner of the images, a monoatomic step is visible.
Once a potential of 0.9 V was applied to the sample (Fig. 4(g)), irreversible changes in the topography are visible. One can see that large areas on the terraces of the HOPG have swelled. These features are located inside different graphene layers, since they overlap each other. When the potential is further lowered, the swollen regions spread out and grow in size.
In Fig. 4(j), i.e. after a potential of 0.6 V has been applied, one can observe a roughening of the surface, caused by a partial exfoliation of graphene flakes along the step edge. This effect becomes more severe at even lower potentials, where big parts of the terrace are removed from the electrode surface and holes appear. At the same time, one can see that the STM images become noisy from 0.5 V and below, which, as will be shown later, is caused by a SEI-precipitation on the HOPG basal plane.
The CVs measured in between every STM image are shown in Fig. 5, where the lower vertex potential was decreased stepwise from 1.4 V (red line) to 0.0 V (blue line). One feature that immediately catches one's eyes is the fact that apart from the CV measured down to 0.0 V, no anodic peaks appear in the reverse scans. This again is a clear indication for an irreversible charge loss due to the SEI-formation. Moreover, the said CV ranging down to 0.0 V is the only CV showing a crossover of the cathodic and the anodic sweep.
Additionally, the currents steadily decrease scan by scan in the SEI-forming potential region, and include a barely visible cathodic shoulder at 1.0 V and a cathodic peak first appearing in the CV measured down to 0.4 V, located at 0.48 V. Also, the onset potential of the SEI formation as well as the peak position of the said peak shifts to lower values. Both findings can be explained by the SEI forming over time, always consuming less charge from cycle to cycle, since the growth rate slows down as the thickness and hence the tunneling resistance of the electrons through the SEI increase.
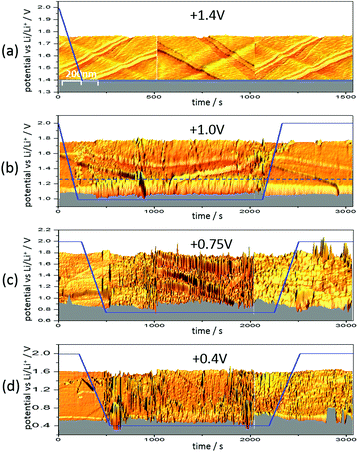
These EC-STM studies gave some interesting preliminary results, but suffered from two shortcomings: first it is impossible to draw any conclusions about the time scales of the processes happening at the surface and secondly, reversible processes only present at low potentials, i.e. potentials far below 2.0 V, where the STM images were recorded, cannot be visualized. These issues were solved by redesigning the STM experiment. Fig. 6 also shows an in situ STM study, where the imaging was carried out in parallel to the variation of the electrode potential, in contrast to the experiment before, where imaging and CV were performed sequentially. This way, it is possible to obtain insight into the time scales of surface processes and to see changes of the electrode surface only occurring while low potentials are applied.
Fig. 6 shows three 3D-STM images of a HOPG electrode. Since STM images are acquired by scanning the surface line by line, one can arrange the images in a way that they match with a time axis running from left to right. Simultaneous to STM-imaging, a potential was applied to the electrode. The time scale of the applied potential can be synchronized to the time axis of the STM experiment. This way, one can overlay the potential scan and the STM scan and obtain a real time insight into potential-dependent surface processes, provided these processes cause a change in surface morphology detectable by STM.
Fig. 6(a) shows the HOPG surface, while the electrode potential (blue line) was lowered with 5 mV s−1 from 2.0 V to 1.4 V, where the potential was then held. The HOPG surface is atomically flat on largely extended terraces, which are traversed by several step edges, partially only being one atom high. Otherwise, the surface remains smooth and clean throughout the measurement (ca. 25 min).
The situation changed, if one repeated such an experiment applying a holding potential of 1.0 V (Fig. 6(b)). One can see that the HOPG surface is atomically flat in the very beginning of the experiment. Just when the potential is in the range between 1.3 V and 1.2 V, a surface film precipitation on the HOPG basal plane becomes visible. The film thickness as determined by STM increases with time until it reaches some limit. Interestingly, this surface film disappears again, once the electrode potential is driven to higher values. The blue dashed line depicts the place, along which a height profile was measured (Fig. 7). From this profile, one can estimate the film thickness and better comprehend the time scales. The film growth lasts about 200 s, until a final detected thickness of about 2 nm is reached. The shown profile is a representative example for other positions in Fig. 6(b).
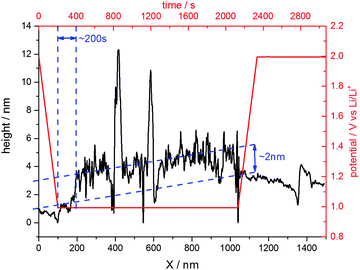 | ||
| Fig. 7 Height profile across the SEI-film along the blue line depicted in Fig. 6(b). | ||
Next, the potential was lowered to 0.75 V (Fig. 6(c)). In the beginning, the surface is smooth again, until the potential is low enough to lead to a surface film precipitation. In contrast to the previous experiment, the surface film does not disappear after increasing the potential again.
Since the voltammograms (Fig. 2 and 3) proposed four steps of SEI-formation with the last step occurring at potentials as low as 0.6 V, another STM experiment was conducted even at this potential (Fig. 6(d)). However, no new information compared to the measurement at 0.75 V can be obtained (Fig. 6(c)). Similar to the height profile indicated by the line in Fig. 6(b) and shown in Fig. 7, the SEI thickness can also be estimated for the data shown in Fig. 6(c) and (d). The analysis results in analogical values and hence is not shown here.
Discussion
The CV of MCMB (Fig. 2(a) and (b)), the corresponding PITT measurement (Fig. 2(c) and (d)), the dQ/dV-plot (Fig. 2(e) and (f)) and the CV of the HOPG sample (Fig. 3) all indicate that the SEI-formation is a multistep process. As was already proposed in the literature, the SEI-formation is initiated by the reduction of the carbonate molecules. Both, linear30,31 and circular24,29–31,37 carbonates can either undergo a 1-electron-reduction or a 2-electron-reduction, depending on the applied electrode potential, while the circular carbonates first need to undergo a ring-opening step. Preceding the actual SEI formation, the double layer establishment, which is a re-coordination of the solvation shell around the Li+-ions in the outer Helmholtz plane, is initiated at potentials above 1.4 V and described in detail in ref. 71, followed by the ring-opening during the EC molecule reduction.29,37 The cathodic shoulder in the potential sweeps on MCMB at 1.4 V, 1.25 V and 0.95 V (Fig. 2(a), (b) and (c), respectively) and on HOPG at 1.25 V (Fig. 3), can probably be ascribed to the double layer establishment. Below 1.0 V the reduction of the solvent molecules proceeds via the 2-electron-pathway,2,32,37,72–75 which changes over to the 1-electron-reduction at 0.8 V.29,37 Only at very low potentials close to 0.4 V, the reduction strength of the electrode is strong enough to also reduce the LixPFy.By electrochemical STM the multistage nature of the SEI formation can also be revealed. The experimental procedure that was used to obtain the images shown in Fig. 4, has been applied earlier in similar studies14,58–67 and allows one to image the cointercalation of Li+-ions together with their solvation shell, exfoliation processes and the SEI precipitation on the graphite basal plane. As is often reported in the literature, the SEI starts to precipitate on the graphite edge, due to the increased reactivity towards electrolyte reduction,40,56,57 which might explain the observed step edge roughness caused by the initialization of SEI precipitation along the more reactive step edges. However, the observed roughness is already present on the pristine sample, it does not change when going to lower potentials and it was not observed in all STM experiments carried out. Thus, as mentioned earlier, one probably sees exfoliated graphene sheets decorating the step edges. The STM data does not give any hint towards an increased SEI-formation reactivity along the step edges compared to the basal plane. In addition, STM is not feasible on graphite cross-sections, which does not allow for a direct comparison between basal- and cross-sectional SEI-formation.
The simultaneous intercalation of Li+-ions and their solvation shell is the origin of the swellings observed in the STM images (Fig. 4(g)) after polarizing the sample to 0.9 V. This finding is in accordance to Inaba's early STM work, where a cointercalation was observed in similar electrolytes at potentials close to 1.0 V.58–60
The exfoliation, which becomes visible below 0.6 V (Fig. 4(j)) can have two origins: one is the mechanical stress induced from the cointercalated species35,58–61,63–65,68 and the other one is a subsurface gas evolution resulting from the electrochemical reduction of the cointercalated solvent molecules.3,5,14,59–61,64,76–80 Most of the studies in the literature examine the propylene gas evolution being associated with the reduction of PC, which is much more severe compared to the ethylene gas evolution from the EC reduction.
From 0.5 V and below (Fig. 4(k)) the STM images become slightly fuzzy. At this stage of the SEI-formation, the SEI-film on the graphite basal plane changes its nature from organic (oligomers, polymers) to one containing more inorganic species (oxides, fluorides, phosphates).2,39,50–53 The organic species, which are comparably soft, can be in part penetrated by the STM tip, which just pushes through to the HOPG basal plane. Thus, the organic surface film present at high potentials does not affect the STM measurements much. Only when the organic species are further reduced to more rigid inorganic species, the electron tunneling between the sample and tip is strongly disturbed and the imaging of the basal plane is affected by noise, which causes the fuzziness. A similar fuzziness was also noticed by Wang et al.65 The complete reduction of the SEI species and the formation of the inorganic species represents the last stage of SEI formation and assumably causes the low voltage SEI-peak in the voltammograms in Fig. 2(b) and (d) for a MCMB electrode at 0.4 V and at 0.66 V and in Fig. 3 at 0.53 V for a HOPG electrode.
The CVs in Fig. 5 show the continuous irreversible charge consumption during the cathodic sweeps. The crossover of the anodic and the cathodic sweep below 0.1 V in the scan down to 0.0 V and the subsequent appearance of an anodic peak at 0.3 V indicate a reversible Li-plating/stripping onto the HOPG basal plane. In the same potential range a reversible Li+-ion intercalation/deintercalation should occur, at least in a MCMB electrode, however, due to the low quantity of step edges on HOPG, which offer the required diffusion channels, it is believed that the intercalation/deintercalation is suppressed and does not show up in the CVs.
Fig. 6 gives a very detailed insight into the characteristics of SEI-formation in dependence of potential and time. In Fig. 6(a), the sample potential was set to 1.4 V, which was motivated by the first shoulder corresponding to the double layer establishment appearing at this potential in the voltammograms (Fig. 2 and 3).29,37 This double layer establishment is, of course, not observable by STM and hence the HOPG surface stays unaltered.
In contrast to the double layer establishment, a surface film forming between 1.3 V and 1.0 V in Fig. 6(b) is detectable by STM and has a reversible nature, meaning that it disappears again at high potentials. The surface film probably originates from the adsorbed reaction products of the first reduction step of the EC molecule (Scheme 1 (1)), which causes the shoulder of the voltammograms in Fig. 2 and 3 at 1.0 V and 1.09 V. This reaction can be assumed to be fully reversible, which would be in accordance to the reversible character of the SEI above 1.0 V observed in Fig. 6(b). The same argumentation holds true for the first reduction step of DMC (Scheme 2 (1)).
As can be seen in Fig. 6(c), the graphite basal plane is irreversibly covered by the surface film after polarizing the graphite electrode to 0.75 V. This behavior can be explained, considering the next reaction steps in Schemes 1 and 2. In both reactions the structure of the original molecule is irreversibly destroyed by the ring opening and the dissociation of ethylene gas of the EC molecule or the fragmentation of the DMC molecule. Thus, the main SEI peaks at 0.75 V, 0.85 V, 0.66 V and 0.65 V in Fig. 2(b), (d), (e) and 3, respectively, unify the reduction of DMC to lithium methyl carbonate and the 2-electron- and 1-electron-reduction of EC.
Due to the insensitivity of STM towards discrimination of chemical species, not many conclusions can be drawn from Fig. 6(d). It is known from the literature that at such low potentials as 0.4 V also the Li-salt anion, i.e. PF6−, can be reduced leading to the formation of a variety of fluorides, oxides, phosphates and further inorganic species.2,15,24,25–28,30
The last point to be discussed is the height profile measured across the SEI in Fig. 6(b). Since STM does not solely detect the sample topography but is also affected by the electronic states of the sample and the tip, the obtained ‘height’ information is a convolution of both (see for instance ref. 81). Moreover, the SEI is partially composed of soft, nonconductive polymers, which cannot be detected easily by the STM tip. Hence, the surface film visible in Fig. 6 only shows parts of the SEI and also the height profile in Fig. 7 does not show the full thickness of the SEI. Instead, it rather represents the lower limit of the SEI thickness.
Conclusions
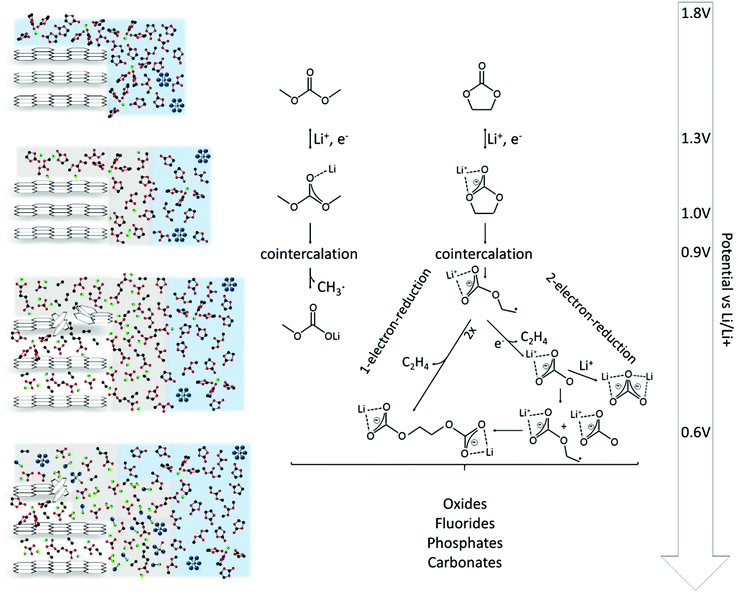
In this work, the SEI formation on graphitic electrodes in 1 M LiPF6 in EC/DMC was studied by electrochemical methods, including cyclic voltammetry and potential step techniques, as well as by scanning tunneling microscopy. Both studies, electrochemistry and microscopy, have been proven to complement each other, yielding new mechanistic and topographic insights into the SEI formation.Fig. 8 summarizes the findings discussed above and puts them in relation to the electrode potential. The SEI-formation is initialized by the double layer establishment.29,37 In the potential range between 1.3 V and 1.0 V the solvent molecules undergo their first reduction, leading to a reversible film deposition on the substrate.
Afterwards, a cointercalation of Li+-ions and solvent molecules is observed, already at 0.9 V (Fig. 4(g)). It is, however, unclear, how the cointercalation proceeds in terms of the solvent coordination around the Li+-ions. How large is the coordination number n, usually ranging from one to five in the bulk electrolyte,25,82–84 of the Li+(EC)n supermolecule upon cointercalation into the graphite lattice?
In the course of further reduction the molecular structure of the solvents is irreversibly destroyed by e.g. EC ring opening. In that case two potential dependent mechanisms are possible, a 2-electron-reduction at higher potentials2,24,29–32,36,37,72–75 and a 1-electron-reduction at lower potential,24,29–31,36,37 leading to the irreversible deposition of a surface film (Fig. 6(c)).
Below 0.6 V the reduction strength is strong enough to form a complex multicomponent mixture of inorganic compounds like oxides, fluorides, phosphates and carbonates,2,39,50–53 affecting the STM imaging and resulting in increased noise. Since the reduction strength decays with increasing distance from the electrode, these species can only be found in the very vicinity of the electrode.
Acknowledgements
This work was funded by the German Ministry of Education and Research (BMBF) within the Sino-German Network on Electromobility (reference no. 16N11930) and the IAPS project (reference no. 01DO12001), which is gratefully acknowledged. We thank Prof. Heiz (Chemistry Department, Technische Universität München), Prof. Gasteiger (Chemistry Department, Technische Universität München), and Prof. Knoll (Institute of Informatics VI, Technische Universität München) for their support and the use of their facilities.Notes and references
- E. Peled, J. Electrochem. Soc., 1979, 126, 2047–2051 CrossRef CAS.
- P. B. Balbuena and Y. Wang, Lithium-lon Batteries Solid-Electrolyte Interphase, Imperial College Press, 2004 Search PubMed.
- W. Märkle, C.-Y. Lu and P. Novák, J. Electrochem. Soc., 2011, 158, A1478–A1482 CrossRef.
- M. Winter, J. O. Besenhard, M. E. Spahr and P. Novák, Adv. Mater., 1998, 10, 725–763 CrossRef CAS.
- H. Buqa, A. Würsig, J. Vetter, M. E. Spahr, F. Krumeich and P. Novák, J. Power Sources, 2006, 153, 385–390 CrossRef CAS.
- H. Tavassol, J. W. Buthker, G. A. Ferguson, L. A. Curtiss and A. A. Gewirth, J. Electrochem. Soc., 2012, 159, A730–A738 CrossRef CAS.
- I. V. Veryovkin, C. E. Tripa, A. V. Zinovev, S. V. Baryshev, Y. Li and D. P. Abraham, Nucl. Instrum. Methods Phys. Res., Sect. B, 2014, 332, 368–372 CrossRef CAS.
- H. Bülter, F. Peters, J. Schwenzel and G. Wittstock, Angew. Chem., Int. Ed., 2014, 53, 10531–10535 CrossRef PubMed.
- H. Bülter, F. Peters, J. Schwenzel and G. Wittstock, J. Electrochem. Soc., 2015, 162, A7024–A7036 CrossRef.
- H. Bülter, F. Peters, J. Schwenzel and G. Wittstock, J. Electrochem. Soc., 2016, 163, A27–A34 CrossRef.
- M. Nie, D. Chalasani, D. P. Abraham, Y. Chen, A. Bose and B. L. Lucht, J. Phys. Chem. C, 2013, 117, 1257–1267 CAS.
- J. T. Lee, N. Nitta, J. Benson, A. Magasinski, T. F. Fuller and G. Yushin, Carbon, 2013, 52, 388–397 CrossRef CAS.
- M. Ayache, D. Jang, J. Syzdek and R. Kostecki, J. Electrochem. Soc., 2015, 162, A7078–A7082 CrossRef CAS.
- L. Wang, D. Deng, L. C. Lev and S. Ng, J. Power Sources, 2014, 265, 140–148 CrossRef CAS.
- A. V. Cresce, S. M. Russell, D. R. Baker, K. J. Gaskell and K. Xu, Nano Lett., 2014, 14, 1405–1412 CrossRef CAS PubMed.
- G. Zampardi, S. Klink, V. Kuznetsov, T. Erichsen, A. Maljusch, F. La Mantia, W. Schuhmann and E. Ventosa, ChemElectroChem, 2015, 2, 1607–1611 CrossRef CAS.
- P. Ganesh, P. R. C. Kent and D. Jiang, J. Phys. Chem. C, 2012, 116, 24476–24481 CAS.
- N. Takenaka, Y. Suzuki, H. Sakai and M. Nagaoka, J. Phys. Chem. C, 2014, 118, 10874–10882 CAS.
- S.-D. Xu, Q.-C. Zhuang, J. Wang, Y.-Q. Xu and Y.-B. Zhu, Int. J. Electrochem. Sci., 2013, 8, 8058–8076 CAS.
- S.-H. Lee, I.-S. Jo and J. Kim, Surf. Interface Anal., 2014, 46, 570–576 CrossRef CAS.
- Y. Zhu, M. D. Casselman, Y. Li, A. Wei and D. P. Abraham, J. Power Sources, 2014, 246, 184–191 CrossRef CAS.
- P. Verma and P. Novák, Carbon, 2012, 50, 2599–2614 CrossRef CAS.
- P. Verma, T. Sasaki and P. Novák, Electrochim. Acta, 2012, 82, 233–242 CrossRef CAS.
- A. M. Haregewoin, E. G. Leggesse, J.-C. Jiang, F.-M. Wang, B.-J. Hwang and S. D. Lin, Electrochim. Acta, 2014, 136, 274–285 CrossRef CAS.
- Y. Wang, S. Nakamura, M. Ue and P. B. Balbuena, J. Am. Chem. Soc., 2001, 123, 11708–11718 CrossRef CAS PubMed.
- S. Leroy, H. Martinez, R. Dedryvère, D. Lemordant and D. Gonbeau, Appl. Surf. Sci., 2007, 253, 4895–4905 CrossRef CAS.
- I. A. Shkrob, Y. Zhu, T. W. Marin and D. P. Abraham, J. Phys. Chem. C, 2013, 117, 19255–19269 CAS.
- Y. Wu, N. Hu, L. Wei and Y. Dai, ECS Electrochem. Lett., 2014, 3, A50–A53 CrossRef CAS.
- G. Gourdin, J. Collins, D. Zheng, M. Foster and D. Qu, J. Phys. Chem. C, 2014, 118, 17383–17394 CAS.
- K. Xu, Y. Lam, S. S. Zhang, T. R. Jow and T. B. Curtis, J. Phys. Chem. C, 2007, 111, 7411–7421 CAS.
- J.-S. Bridel, S. Grugeon, S. Laruelle, J. Hassoun, P. Reale, B. Scrosati and J.-M. Tarascon, J. Power Sources, 2010, 195, 2036–2043 CrossRef CAS.
- D. Aurbach, A. Zaban, Y. Ein-Eli, I. Weissman, O. Chusid, B. Markovsky, M. D. Levi, E. Levi, A. Schechter and E. Granot, J. Power Sources, 1997, 68, 91–98 CrossRef CAS.
- D. Aurbach, M. Moshkovich, Y. Cohen and A. Schechter, Langmuir, 1999, 15, 2947–2960 CrossRef CAS.
- G. G. Eshetu, S. Grugeon, G. Gachot, D. Mathiron, M. Armand and S. Laruelle, Electrochim. Acta, 2013, 102, 133–141 CrossRef CAS.
- V. A. Agubra and J. W. Fergus, J. Power Sources, 2014, 268, 153–162 CrossRef CAS.
- J. M. Vollmer, L. A. Curtiss, D. R. Vissers and K. Amine, J. Electrochem. Soc., 2004, 151, A178–A183 CrossRef CAS.
- G. Gourdin, D. Zheng, P. H. Smith and D. Qu, Electrochim. Acta, 2013, 112, 735–746 CrossRef CAS.
- X. Zhang, R. Kostecki, T. J. Richardson, J. K. Pugh and P. N. Ross, J. Electrochem. Soc., 2001, 148, A1341–A1345 CrossRef CAS.
- S. P. Kim, A. C. T. Van Duin and V. B. Shenoy, J. Power Sources, 2011, 196, 8590–8597 CrossRef CAS.
- M. Tang and J. Newman, J. Electrochem. Soc., 2012, 159, A1922–A1927 CrossRef CAS.
- P. Murmann, P. Niehoff, R. Schmitz, S. Nowak, H. Gores, N. Ignatiev, P. Sartori, M. Winter and R. Schmitz, Electrochim. Acta, 2013, 114, 658–666 CrossRef CAS.
- X. Deng, X. Liu, H. Yan, D. Wang and L. Wan, Sci. China: Chem., 2014, 57, 178–183 CrossRef CAS.
- D. Li, D. Danilov, Z. Zhang, H. Chen, Y. Yang and P. H. L. Notten, J. Electrochem. Soc., 2015, 162, A858–A869 CrossRef CAS.
- D. Aurbach, B. Markovsky, I. Weissman, E. Levi and Y. Ein-Eli, Electrochim. Acta, 1999, 45, 67–86 CrossRef CAS.
- L. M. Moshurchak, C. Buhrmester, R. L. Wang and J. R. Dahn, Electrochim. Acta, 2007, 52, 3779–3784 CrossRef CAS.
- K. Leung, Chem. Phys. Lett., 2013, 568–569, 1–8 CrossRef CAS.
- H. J. Ploehn, P. Ramadass and R. E. White, J. Electrochem. Soc., 2004, 151, A456–A462 CrossRef CAS.
- M. Safari, M. Morcrette, A. Teyssot and C. Delacourt, J. Electrochem. Soc., 2009, 156, A145–A153 CrossRef CAS.
- S. Sankarasubramanian and B. Krishnamurthy, Electrochim. Acta, 2012, 70, 248–254 CrossRef CAS.
- E. Peled, D. Golodnitsky and G. Ardel, J. Electrochem. Soc., 1997, 144, 208–210 CrossRef.
- D. Bar-Tow, E. Peled and L. Burstein, J. Electrochem. Soc., 1999, 146, 824–832 CrossRef CAS.
- V. Eshkenazi, E. Peled, L. Burstein and D. Golodnitsky, Solid State Ionics, 2004, 170, 83–91 CrossRef CAS.
- Z. Ogumi, A. Sano, M. Inaba and T. Abe, J. Power Sources, 2001, 97–98, 156–158 CrossRef CAS.
- E. Peled, D. Bar Tow, A. Merson, A. Gladkich, L. Burstein and D. Golodnitsky, J. Power Sources, 2001, 97–98, 52–57 CrossRef CAS.
- J. Yan, J. Zhang, Y. C. Su, X. G. Zhang and B. J. Xia, Electrochim. Acta, 2010, 55, 1785–1794 CrossRef CAS.
- M. Tang, K. Miyazaki, T. Abe and J. Newman, J. Electrochem. Soc., 2012, 159, A634–A641 CrossRef CAS.
- A. C. Chu, J. Y. Josefowicz and G. C. Farrington, J. Electrochem. Soc., 1997, 144, 4161 CrossRef CAS.
- M. Inaba, Z. Siroma, A. Funabiki, Z. Ogumi, T. Abe, Y. Mizutani and M. Asano, Langmuir, 1996, 12, 1535–1540 CrossRef CAS.
- M. Inaba, Z. Siroma, Y. Kawatate, A. Funabiki and Z. Ogumi, J. Power Sources, 1997, 68, 221–226 CrossRef CAS.
- M. Inaba, Y. Kawatate, A. Funabiki, S.-K. Jeong, T. Abe and Z. Ogumi, Electrochim. Acta, 1999, 45, 99–105 CrossRef CAS.
- Z. Ogumi, S.-K. Jeong, M. Inaba and T. Abe, Macromol. Symp., 2000, 156, 195–202 CrossRef CAS.
- S. Jeong, M. Inaba, R. Mogi, Y. Iriyama, T. Abe and Z. Ogumi, Langmuir, 2001, 17, 8281–8286 CrossRef CAS.
- S.-K. Jeong, M. Inaba, T. Abe and Z. Ogumi, J. Electrochem. Soc., 2001, 148, A989–A993 CrossRef CAS.
- S.-K. Jeong, M. Inaba, Y. Iriyama, T. Abe and Z. Ogumi, J. Power Sources, 2003, 119–121, 555–560 CrossRef CAS.
- L. Wang, X. Deng, P.-X. Dai, Y.-G. Guo, D. Wang and L.-J. Wan, Phys. Chem. Chem. Phys., 2012, 14, 7330–7336 RSC.
- D. Alliata, R. Kötz, P. Novák and H. Siegenthaler, Electrochem. Commun., 2000, 2, 436–440 CrossRef CAS.
- P. Novák, F. Joho, M. Lanz, B. Rykart, J.-C. Panitz, D. Alliata, R. Kötz and O. Haas, J. Power Sources, 2001, 97–98, 39–46 CrossRef.
- J. O. Besenhard, M. Winter, J. Yang and W. Biberacher, J. Power Sources, 1995, 54, 228–231 CrossRef CAS.
- I. Horcas, R. Fernández, J. M. Gómez-Rodríguez, J. Colchero, J. Gómez-Herrero and A. M. Baro, Rev. Sci. Instrum., 2007, 78, 013705 CrossRef CAS PubMed.
- S. R. Sharma, G. Parthasarathy and B. Kumar, J. Geol. Soc. India, 1998, 51, 517–522 CAS.
- J. Vatamanu, O. Borodin and G. D. Smith, J. Phys. Chem. C, 2012, 116, 1114–1121 CAS.
- D. Aurbach, A. Zaban, A. Schechter, Y. Ein-Eli, E. Zinigrad and B. Markovsky, J. Electrochem. Soc., 1995, 142, 2873–2882 CrossRef CAS.
- A. Naji, J. Ghanbaja, I. S. Humbert, P. Willmann and D. Billaud, J. Power Sources, 1996, 63, 33–39 CrossRef CAS.
- R. Imhof and P. Novák, J. Electrochem. Soc., 1998, 145, 1081–1087 CrossRef CAS.
- A. Schechter, D. Aurbach and H. Cohen, Langmuir, 1999, 15, 3334–3342 CrossRef CAS.
- D. Aurbach, J. Power Sources, 2003, 119–121, 497–503 CrossRef CAS.
- J. Wang, K. K. Manga, Q. Bao and K. P. Loh, J. Am. Chem. Soc., 2011, 133, 8888–8891 CrossRef CAS PubMed.
- J. Vetter, P. Novák, M. R. Wagner, C. Veit, K.-C. Möller, J. O. Besenhard, M. Winter, M. Wohlfahrt-Mehrens, C. Vogler and A. Hammouche, J. Power Sources, 2005, 147, 269–281 CrossRef CAS.
- J. S. Gnanaraj, R. W. Thompson, J. F. DiCarlo and K. M. Abraham, J. Electrochem. Soc., 2007, 154, A185–A191 CrossRef CAS.
- G. V. Zhuang, H. Yang, B. Blizanac and P. N. Ross, Electrochem. Solid-State Lett., 2005, 8, A441–A445 CrossRef CAS.
- J. Bardeen, Phys. Rev. Lett., 1961, 6, 57–59 CrossRef CAS.
- X. Bogle, R. Vazquez, S. Greenbaum, A. V. W. Cresce and K. Xu, J. Phys. Chem. Lett., 2013, 4, 1664–1668 CrossRef CAS PubMed.
- D. M. Seo, T. Afroz, J. L. Allen, P. D. Boyle, P. C. Trulove, H. C. De Long and W. A. Henderson, J. Phys. Chem. C, 2014, 118, 25884–25889 CAS.
- M. T. Ong, O. Verners, E. W. Draeger, A. C. T. van Duin, V. Lordi and J. E. Pask, J. Phys. Chem. B, 2015, 119, 1535–1545 CrossRef CAS PubMed.
| This journal is © The Royal Society of Chemistry 2016 |

