
 Open Access Article
 This Open Access Article is licensed under a
 Creative Commons Attribution 3.0 Unported Licence
Bottom-up excited state dynamics of two cinnamate-based sunscreen filter molecules†
Yoann
Peperstraete
ab,
Michael
Staniforth
a,
Lewis A.
Baker
a,
Natércia D. N.
Rodrigues
a,
Neil C.
Cole-Filipiak
a,
Wen-Dong
Quan
a and
Vasilios G.
Stavros
*a
aUniversity of Warwick, Gibbet Hill Road, Coventry, CV4 7AL, UK. E-mail: v.stavros@warwick.ac.uk
bENS de Cachan, 61 Avenue du Président Wilson, 94230, Cachan, France
First published on 22nd September 2016
Abstract
Methyl-E-4-methoxycinnamate (E-MMC) is a model chromophore of the commonly used commercial sunscreen agent, 2-ethylhexyl-E-4-methoxycinnamate (E-EHMC). In an effort to garner a molecular-level understanding of the photoprotection mechanisms in operation with E-EHMC, we have used time-resolved pump–probe spectroscopy to explore E-MMC's and E-EHMC's excited state dynamics upon UV-B photoexcitation to the S1 (11ππ*) state in both the gas- and solution-phase. In the gas-phase, our studies suggest that the excited state dynamics are driven by non-radiative decay from the 11ππ* to the S3 (11nπ*) state, followed by de-excitation from the 11nπ* to the ground electronic state (S0). Using both a non-polar-aprotic solvent, cyclohexane, and a polar-protic solvent, methanol, we investigated E-MMC and E-EHMC's photochemistry in a more realistic, ‘closer-to-shelf’ environment. A stark change to the excited state dynamics in the gas-phase is observed in the solution-phase suggesting that the dynamics are now driven by efficient E/Z isomerisation from the initially photoexcited 11ππ* state to S0.
1 Introduction
Ultraviolet (UV) light has been shown to cause photodamage to living organisms and is responsible for a range of adverse effects, including mutations to DNA.1–4 As such, natural selection has resulted in many different photoprotection mechanisms against this harmful radiation, such as negative phototaxis for bacteria5–7 or the presence of UV absorbing sunscreen molecules in plants8,9 to name but a few. The key absorbing sites of these molecules, or chromophores, have been shown to play a central role in photoprotection.10–14 Consequently, the photochemistry and photophysics of these, and related chromophores, have received considerable attention, both theoretically14,15 and experimentally, in both the gas-11,12,16–19 and solution-phase.10,13,20Many of these chromophores are cinnamate-based derivatives which, as well as serving in natural photoprotection, have also found extensive use in artificial photoprotection. For example, 2-ethylhexyl-E-4-methoxycinnamate (E-EHMC, see structure in Fig. 1b) is an organic sunscreen filter commonly found in commercial sunscreens. Surprisingly however, while numerous studies have been performed on the photoprotection mechanisms in operation in E-EHMC, very little is known about the dynamical processes that ensue shortly after photoexcitation (femtosecond, fs, to picosecond, ps, timescale). In the present study, we use a ‘bottom-up’ approach21 as a vehicle for understanding the ultrafast processes in operation in E-EHMC following UV irradiation, which may provide crucial insight into its widespread use as a sunscreen filter molecule. As a stepping stone towards our goal and in accord with our bottom-up thesis, we also study methyl-E-4-methoxycinnamate (E-MMC, Fig. 1a). This is a building block of E-EHMC which, as with E-EHMC, displays a broadband absorption centred in the UV-B region (280–315 nm) as depicted in Fig. 1.
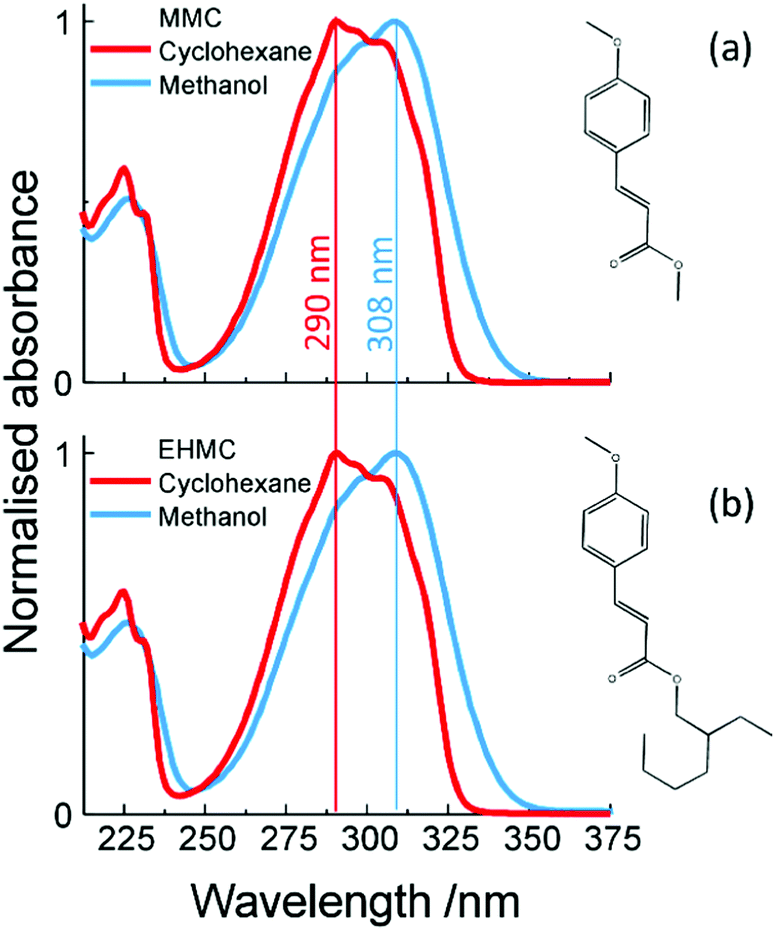 | ||
| Fig. 1 UV-visible steady static absorption spectra in cyclohexane (red lines) and methanol (blue lines) of (a) E-MMC, and (b) E-EHMC, see insets for molecular structures. The absorption maxima are indicated by the coloured vertical lines. | ||
Numerous spectroscopic studies have been carried out on E-EHMC and E-MMC. Through frequency resolved studies, Tan et al.22 observed the presence of two rotamers of E-MMC and E-EHMC in the gas-phase (see structures in the ESI†). From their spectral line width measurements, they inferred sub-ps and ps (∼2 ps) lifetimes for the initially excited S1 (11ππ*) state of E-EHMC and E-MMC, respectively. These time-constants were assigned to non-radiative decay to an adiabatically lower S3 (11nπ*) state. As observed by the same authors through pump–probe spectroscopy, in the nanosecond (ns) regime, this 11nπ* state is a long-lived state in both E-MMC (24 ns) and E-EHMC (17.7 ns). Interestingly, upon microsolvation by addition of one water molecule to E-MMC, the ns lifetime vanished. This was attributed to the 11nπ* state increasing in energy upon microsolvation,23 leading to an alternative and rapid non-radiative decay mechanism from the 11ππ* state to the ground electronic state, S0, likely mediated by C![[double bond, length as m-dash]](https://www.rsc.org/images/entities/char_e001.gif) C (E/Z) bond isomerisation. Since then, E/Z isomerisation of MMC has been observed in rare gas matrices.24 Moreover, the isomerisation mechanism has been verified by more recent ab initio calculations performed on MMC and MMC–H2O clusters.25 These calculations also suggest that two mechanisms are in competition: E/Z isomerisation through a 11ππ*/S0 conical intersection (CI) and internal conversion (IC) through an analogous 11ππ*/11nπ* CI. In E-MMC, contrary to E-MMC–H2O, the 11ππ* → S0 transition barrier is energetically higher than that for 11ππ* → 11nπ*. This change in barrier height is caused by the relative change in energies of the 11ππ* and 11nπ* states, effectively switching the order of their local minima. Indeed, the change in shape between the absorption spectra shown in Fig. 1 suggests such a shift in ordering of the lowest lying excited states when going from a non-polar to a polar, hydrogen bonding solvent. These findings accord with the experiments by Tan et al.; IC via 11ππ* → 11nπ* dominates in E-MMC whilst for E-MMC–H2O, IC via 11ππ* → S0 dominates.
C (E/Z) bond isomerisation. Since then, E/Z isomerisation of MMC has been observed in rare gas matrices.24 Moreover, the isomerisation mechanism has been verified by more recent ab initio calculations performed on MMC and MMC–H2O clusters.25 These calculations also suggest that two mechanisms are in competition: E/Z isomerisation through a 11ππ*/S0 conical intersection (CI) and internal conversion (IC) through an analogous 11ππ*/11nπ* CI. In E-MMC, contrary to E-MMC–H2O, the 11ππ* → S0 transition barrier is energetically higher than that for 11ππ* → 11nπ*. This change in barrier height is caused by the relative change in energies of the 11ππ* and 11nπ* states, effectively switching the order of their local minima. Indeed, the change in shape between the absorption spectra shown in Fig. 1 suggests such a shift in ordering of the lowest lying excited states when going from a non-polar to a polar, hydrogen bonding solvent. These findings accord with the experiments by Tan et al.; IC via 11ππ* → 11nπ* dominates in E-MMC whilst for E-MMC–H2O, IC via 11ππ* → S0 dominates.
Due to the ns temporal resolution of the experiments by Tan et al., these studies were unable to provide a complete description of the ultrafast dynamics of photoexcited E-MMC. Miyazaki et al.26 carried out a time-resolved pump–probe study with a 12 ps time-resolution. They observed an energy-dependence in the lifetime of the photoexcited E-MMC: timescales decreased from 280 to 13 ps with increasing excitation energy into the 11ππ* state, which ranged from 32![[thin space (1/6-em)]](https://www.rsc.org/images/entities/char_2009.gif) 328 to 33155 cm−1. However, the 12 ps time-resolution of their experiment meant that they were unable to resolve the 2 ps component of E-MMC, as inferred by Tan et al.22
328 to 33155 cm−1. However, the 12 ps time-resolution of their experiment meant that they were unable to resolve the 2 ps component of E-MMC, as inferred by Tan et al.22
Pump–probe spectroscopy experiments of sunscreen filter molecules, in both gas-17,22,27 and solution-phase,13,20,28,29 have proven crucial towards our understanding of how these vitally important molecules may protect us against deleterious UV radiation exposure. Our goal in the present work was to directly probe the 11ππ* → 11nπ* IC in E-EHMC to offer further insight into the 2 ps and sub-ps components inferred from prior measurements. To do so, we probed the relaxation mechanism of UV-B photoexcited E-MMC and E-EHMC using fs time-resolved ion yield (TR-IY) spectroscopy in the gas-phase. Moreover, as it has been shown, gas-phase results can prove highly informative to the interpretation of the solution-phase counterparts.30,31 Thus, with reference to previously reported theoretical calculations25 on MMC and MMC–H2O, we extended the microsolvation studies by Tan et al.,22 to the solution-phase, in both a non-polar-aprotic and polar-protic solvent, utilising transient electronic (UV-visible) absorption spectroscopy (TEAS).
2 Experimental methods
2.1 Gas-phase setup
The experimental setup has been described in detail elsewhere.32 Briefly, and with detail pertaining to the present measurements, E-MMC (Fluorochem, >95%) or E-EHMC (Sigma-Aldrich, 98%, stabilised with 500 to 1000 ppm of butylated hydroxytoluene), heated to 130–150 °C, is seeded in 3 bar of He. It is then expanded into vacuum (∼10−7 mbar) to create a molecular beam via an Even-Lavie pulsed solenoid valve,33 operating at 125 Hz. Two UV laser pulses (∼100 fs duration and ∼500 cm−1 bandwidth), a pump and a probe, intersect the molecular beam. To obtain these two laser pulses, the fundamental 800 nm laser beam (40 fs, 3 mJ per pulse), outputted from a commercial Ti:Sapphire regenerative amplifier (Spectra-Physics, Spitfire XP), is split into three equal components (1 mJ per pulse), two of which are used in the present gas-phase experiments. The first pulse is used to pump an optical parametric amplifier (TOPAS) which provides the tunable UV pump pulse used to promote the molecule of interest to the 11ππ* excited state: λpump = 290 nm or λpump = 308 nm (∼0.5 μJ per pulse for both). These wavelengths have been chosen to be consistent with the peak UV-B absorption in the steady state absorption spectra for E-MMC and E-EHMC in cyclohexane and methanol, shown in Fig. 1. The second pulse is used to generate the probe laser beam of 200 nm by sending the 800 nm beam through three successive (Type I, Type II and Type I) β-barium borate crystals. The polarisation of the probe is held at magic angle (54.7°) relative to the pump polarisation, using a half wave plate. The time delay between the pump and the probe (Δt) is controlled using a gold retroreflector mounted on a delay stage situated along the probe beam-path. The wavelength of the probe is chosen to ensure one-photon ionisation of the photoexcited molecules. The ions created in the molecular beam are then accelerated and detected in a time-of-flight mass spectrometer, which allows us to obtain pump–probe transients of a given mass-to-charge species; here we focus solely on the parent cations, E-MMC+ and E-EHMC+. The current pump–probe setup provides a temporal resolution of ∼150 fs (see ESI† for details).2.2 Solution-phase setup
The solution-phase experimental setup has also been described previously34,35 and is briefly summarised here. For all TEAS measurements, ∼0.1 mM solutions of E-MMC (Fluorochem, >95%) or E-EHMC (Sigma-Aldrich, 98%), in either cyclohexane (VWR, >99%) or methanol (Sigma-Aldrich, ∼99.6%), were recirculated through a flow cell (Harrick Scientific), made of two CaF2 windows and 100 μm thick PTFE spacers. Background subtraction is performed by recording the absorbance spectra of irradiated and non-irradiated sample by means of a motorised shutter in the optical path of the pump pulse. These spectra are obtained by photoexciting the sample using the same TOPAS output as in the gas-phase: λpump = 290 nm or λpump = 308 nm pump pulses with fluences of ∼1 mJ cm−2. The probe pulses are derived from a broadband white light continuum (325–675 nm), generated by focusing part of the third 800 nm fundamental beam (<5% of the 1 mJ per pulse) onto a 1 mm CaF2 window. The probe pulse polarisation is once again held at the magic angle (54.7°) relative to the pump polarisation, through the use of a half wave plate. The time delay between the pump and probe (Δt) is controlled using a second gold retroreflector, mounted on a delay stage situated along the probe beam-path. The present setup provides a temporal resolution of ∼80 fs (see ESI†).All transient absorption spectra (TAS) are chirp corrected using the KOALA package36 and reported lifetimes are determined using global fitting as previously reported13,37 with uncertainties reported to a 95% confidence interval (2σ) through support plane analysis13,38 (see ESI† for further details).
2.3 Steady state spectroscopic techniques
Steady state UV-visible spectroscopic measurements were performed on ∼μM solutions of E-MMC and E-EHMC both in cyclohexane and methanol, in a 1 cm path length quartz cuvette. The absorption spectra were recorded using a Cary 60 spectrophotometer, see Fig. 1. Difference spectra were recorded using a Cary 300 UV-visible spectrophotometer using the following procedure. For each ‘difference spectrum’ a steady state UV-visible spectrum of the non-irradiated molecule of interest is subtracted from the UV-visible spectrum obtained following 10 minutes of irradiation (∼3 W). The irradiation is performed with an arc lamp (OBB, tunable KiloArc) providing continuous irradiation at the chosen wavelength. The wavelengths chosen are the same as in the fs pump–probe studies (i.e. 290 nm in cyclohexane and 308 nm in methanol).1H NMR spectra were recorded on a Bruker DPX-300, DPX-400, or AV-250 spectrometer (400 MHz for E-MMC and 300 MHz for E-EHMC) at room temperature in CDCl3. Chemical shifts are given in ppm downfield from the internal standard tetramethylsilane. For the NMR measurements of the irradiated samples, the solution of interest (∼5 mM) was placed in a quartz cuvette and irradiated at the maximum of absorption (290 nm in cyclohexane and 308 nm in methanol) for 1 hour (to ensure sufficient quantities of Z isomer had been produced for detection via NMR) with the same apparatus as the difference spectra. The solvents were subsequently removed in vacuo and the collected samples were re-dissolved in CDCl3 before recording the NMR spectra.
3 Results and discussion
3.1 Gas-phase
Fig. 2 presents TR-IY transients of E-MMC+ and E-EHMC+ (squares), along with a multiexponential kinetic fit (red trace). Fig. 2a and b correspond to TR-IY transients following excitation of E-MMC to the 11ππ* state with a 308 nm and 290 nm pump respectively, followed by photoionisation with a 200 nm probe. Both transients are fit with three exponential decay functions, at positive time delays. Cursory inspection shows both transients having a reproducibly small absorption offset that persists out to the maximum time delay of our experiments (900 ps). This baseline offset is modelled in the kinetic fit as an exponential decay with a time-constant, τ3 ≫ 1 ns. We propose that this time-constant corresponds to the relaxation of the long-lived 11nπ* state, in accordance with studies by Tan et al. who measured a time-constant of 24 ns for the 11nπ* state decay.22 Thus we lock the value to 24 ns in our three-component kinetic fit, which returns time-constants of τ1 = 1.1 ± 0.3 ps (at both 308 and 290 nm pump), τ2 (λpump = 308 nm) = 8 ± 2 ps and τ2 (λpump = 290 nm) = 5 ± 3 ps. Attempts to fit these data with fewer time-constants produced poorer fits, examples of which may be found in the ESI.†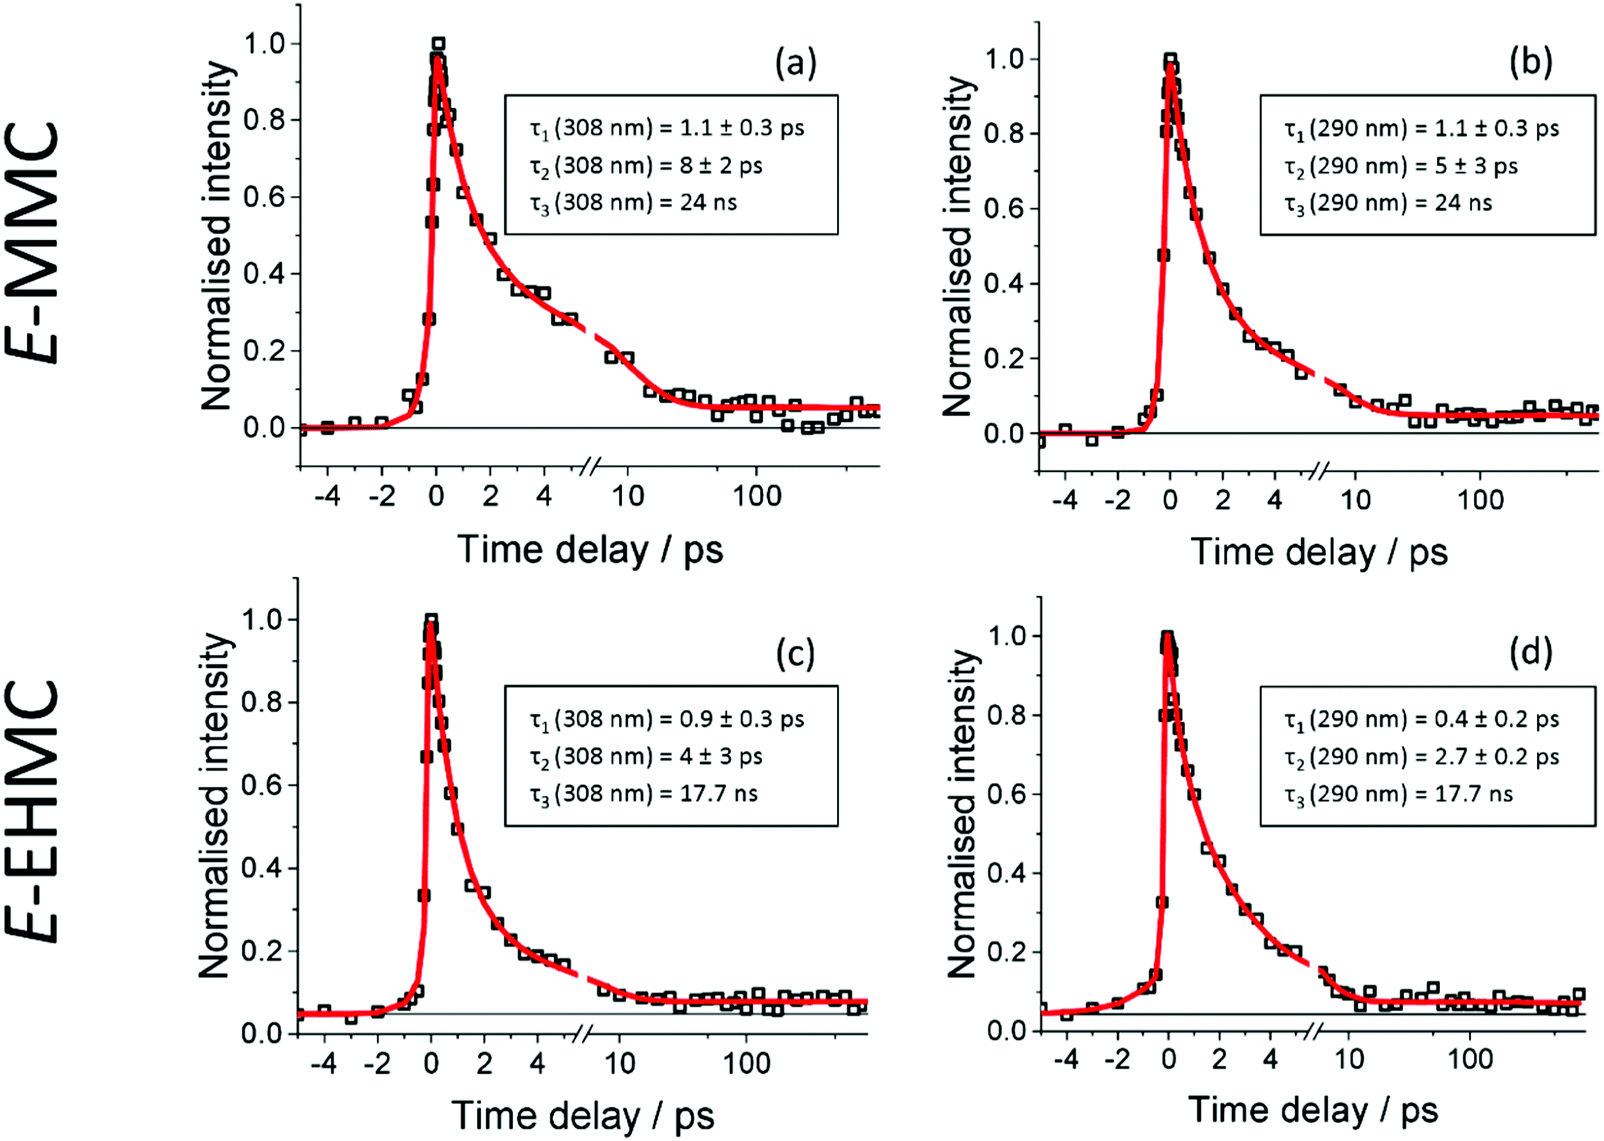 | ||
| Fig. 2 (a) and (b) TR-IY signal (black squares) of E-MMC with λpump = 290 nm and λpump = 308 nm respectively. (c) and (d) The same but with E-EHMC. In all cases, the red trace corresponds to a multiexponential fit. The horizontal black line serves as a visual aid for the long lived nπ* state. | ||
We attempt to reconcile the excited state dynamics of E-MMC with reference to the schematic potential energy cuts (PECs) of E-MMC shown in Fig. 3 (adapted from ref. 25), alongside the experimental data by Tan et al. as already discussed.22 According to the theoretical studies, E-MMC undergoes IC from the initially excited 11ππ* state to the 11nπ* state, facilitated through a 11ππ*/11nπ* CI. Given that two time-constants are extracted from our fit, we assign τ1 to intramolecular vibrational relaxation (IVR) within the 11ππ* state, followed by IC via 11ππ* → 11nπ* (see Fig. 3), represented by τ2. The energy dependence of τ2 would then likely be a reflection of the increased vibrational energy which facilitates the IC through the CI. Taken together, τ1 and τ2 correspond to the evolution of E-MMC towards the 11nπ* state which subsequently decays to S0 with a time-constant of τ3 = 24 ns.22 We note that due to the complexity of the molecules under study it is not possible to unambiguously assign individual processes to single time constants. However, similar time constants have been assigned to an IVR/IC process in the much simpler molecule, N-methylpyrrole,39 which guide our assignments here.
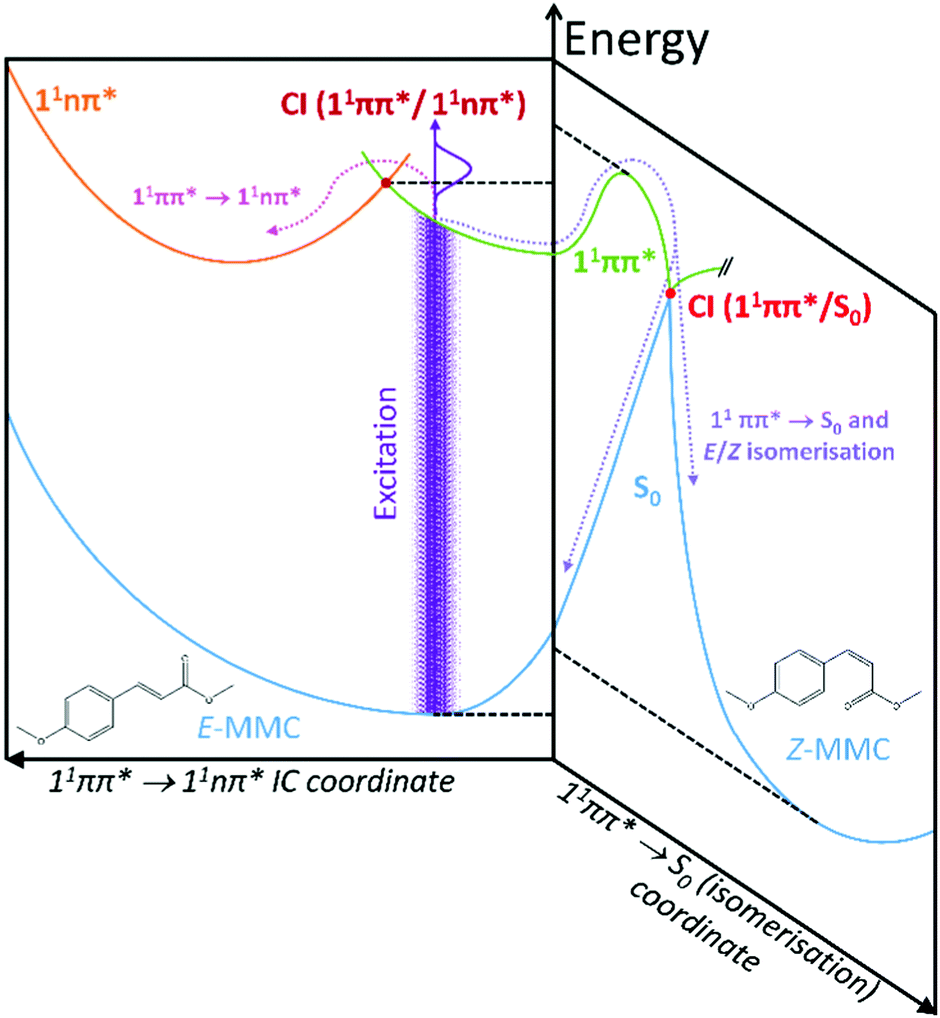 | ||
| Fig. 3 Schematic cuts of the potential energy surfaces (PESs) showing the two reaction coordinates considered in this study; adapted from ref. 25. | ||
Two caveats are in order here. Firstly, we recognise that within our spectral bandwidth, we are very likely exciting multiple rotamers in our molecular beam.22,26 Indeed, measurements performed by Tan et al. suggest that the dynamics are faster for s-trans-E-MMC (rotamer with the highest excitation energy) than for s-cis-E-MMC (rotamer with the lowest excitation energy), separated by ∼340 cm−1 at their vibronic origins (see ESI† for structures). It is possible therefore that the different values for τ2 returned here are due to the different extent of rotamer excitation in our molecular beam although we recognise that the values of τ2 for each wavelength agree within error. Secondly, the probability of E/Z isomerisation is low, given the energy barrier that is required to be surmounted along the 11ππ* state (∼1700 cm−1,25 dashed horizontal, see Fig. 3). That said, even if E/Z isomerisation was operative, we would be unable to probe this pathway given that, once population of the Z isomer (or E isomer) in S0 has ensued (via a 11ππ*/S0 CI; see Fig. 3), one photon of the 200 nm probe would have insufficient energy to photoionise out of this state.
Fig. 2c and d correspond to TR-IY transients following excitation of E-EHMC to the 11ππ* state with a 308 nm and 290 nm pump, respectively, followed by photoionisation with a 200 nm probe. The same fit function as for E-MMC is used to model the data: the value of τ3 is fixed at 17.7 ns, using the value obtained by Tan et al., with the remaining two time-constants determined by the fit being τ1 (λpump = 308 nm) = 0.9 ± 0.3 ps, τ1 (λpump = 290 nm) = 0.4 ± 0.2 ps, τ2 (λpump = 308 nm) = 4 ± 3 ps and τ2 (λpump = 290 nm) = 2.7 ± 0.2 ps. These values agree with the time-constants for E-MMC, but are slightly shorter, suggesting that E-EHMC undergoes the same dynamic processes as E-MMC. The long alkyl chain, which inevitably increases the density of vibrational states, may facilitate faster IVR and/or IC. This could, therefore, reconcile the slight increase in relaxation rates in going from E-MMC to E-EMHC.
We draw discussion of our gas-phase data to a close, by considering the most recent ps studies by Miyazaki et al. on E-MMC.26 Our results strongly suggest that the excited state dynamics of E-MMC can be modelled with three time-constants. Two of these time-constants are <10 ps and one ≫ns. In contrast, Miyazaki et al. report an energy-dependence in the excited state dynamics of E-MMC, with extracted time-constants ranging from 13 to 280 ps depending on which rotamer (and vibronic state therein) was photoexcited. For completeness, we note that the 12 ps temporal resolution used by Miyazaki et al. would not allow observation of the few ps time-constants presented above. The present measurements utilise pump pulses with a spectral bandwidth of ∼500 cm−1, meaning that we are exciting all rotamers (together with any vibronic manifolds) simultaneously. We should then anticipate, perhaps, a convolution of the time-constants observed by Miyazaki et al. However, the time constants observed are either much shorter (1.1–8 ps) or much longer (≫ns) than would be expected for such a convolution. We note that Miyazaki et al.40 used a 315 nm probe, with picosecond time-resolution, whereas to ensure ionisation out of both 11ππ* and 11nπ* states, a 200 nm probe was used in the present work. This will inevitably lead to differences in Franck–Condon factors out of these states, as compared to using a 315 nm probe. While the results of Miyazaki et al. could not be replicated with a 200 nm probe, we tentatively suggest that we do observe the expected convolution of time-constants when probing at 315 nm, where we see a component with a lifetime in the hundreds of picoseconds (see ESI†). The fact that we do see this component when probing at 315 nm and do not at 200 nm, emphasises that the discrepancies between our results and those of Miyazaki et al. are likely the result of the difference in probe wavelength rather than the difference in temporal resolution.
Importantly, in the present studies, new insight has been garnered into the initial photophysics and photochemistry of the sunscreen agent E-EHMC in the gas-phase.
3.2 Solution-phase
We first consider the TAS obtained in E-MMC following photoexcitation at 290 nm in cyclohexane and 308 nm photoexcitation in methanol, depicted in Fig. 4a and b respectively. We specifically chose these two solvents to reflect the effects, upon the excited state dynamics of E-MMC, of both a weakly perturbing and strongly perturbing (hydrogen bonding) solvent, respectively. Given the differences in excited state potential energies25 and static absorption spectra (as discussed in Section 1), we would expect a qualitative difference in the TAS features, induced by solvent environment. Following population of the 11ππ* state, both TAS show a large excited state absorption (ESA) centred at 400 nm for E-MMC in cyclohexane and 380 nm for E-MMC in methanol. The TAS for methanol solution also show a second feature centred at ∼360 nm (probe wavelength), which is present after the decay of the 380 nm feature. Similarly, close examination of the cyclohexane TAS shows a small absorption increase at <330 nm (more obvious in the E-EHMC TAS in Fig. 4e) appearing after the initial decay of the 400 nm peak, and decaying in a few picoseconds. Both TAS almost recover to zero within 5 ps, indicative of very fast repopulation of S0. Fig. 5a and b show the TAS acquired at 2 ns (red trace), showing a positive feature at <340 nm in cyclohexane and 350 nm in methanol. For E-MMC in methanol, there is also a large negative signal at wavelengths shorter than 350 nm (where E-MMC absorbs, see Fig. 1). As we will discuss shortly, these spectra show that S0 recovery is incomplete within our temporal window, a signifier of either a long-lived intermediary species or photoproduct.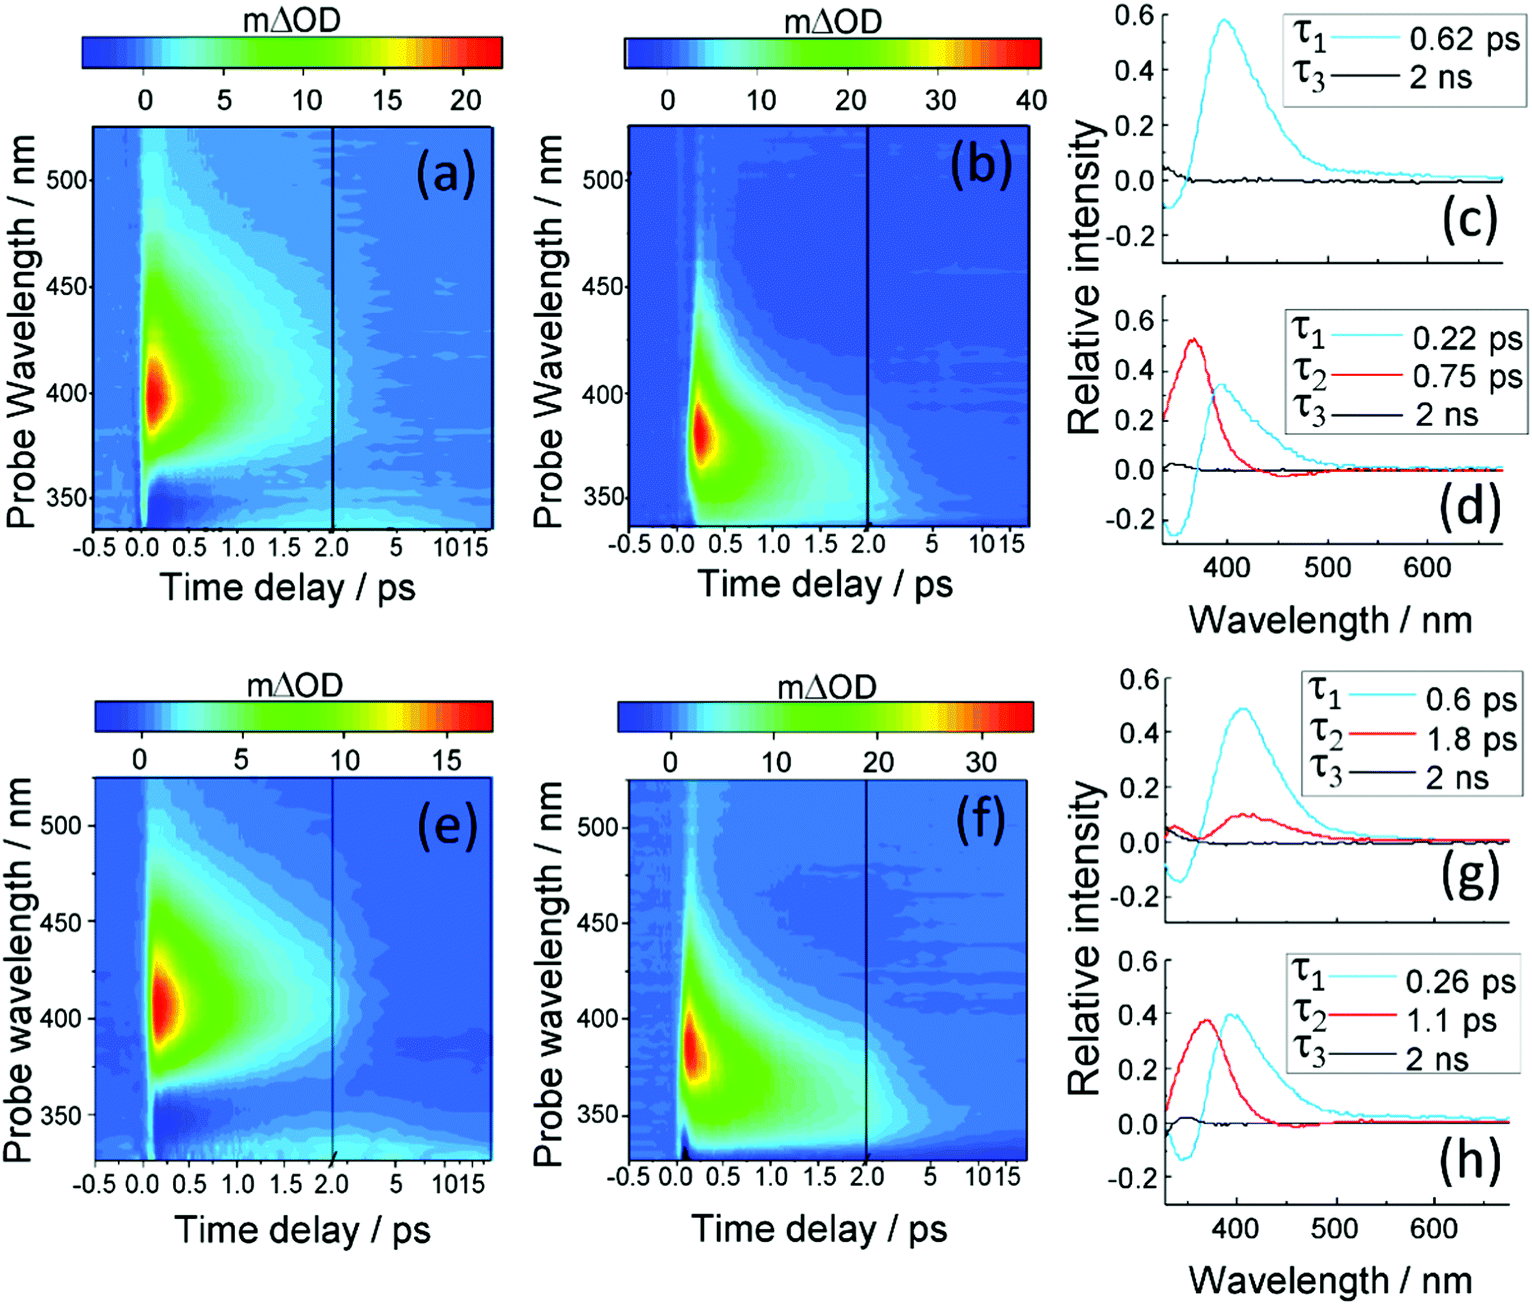 | ||
| Fig. 4 (a) and (b) TAS of E-MMC in cyclohexane (λpump = 290 nm) and methanol (λpump = 308 nm). (c) and (d) DAS corresponding to (a) and (b) respectively. (e) and (f) TAS of E-EHMC in cyclohexane (λpump = 290 nm) and methanol (λpump = 308 nm). (g) and (h) DAS corresponding to (e) and (f) respectively. | ||
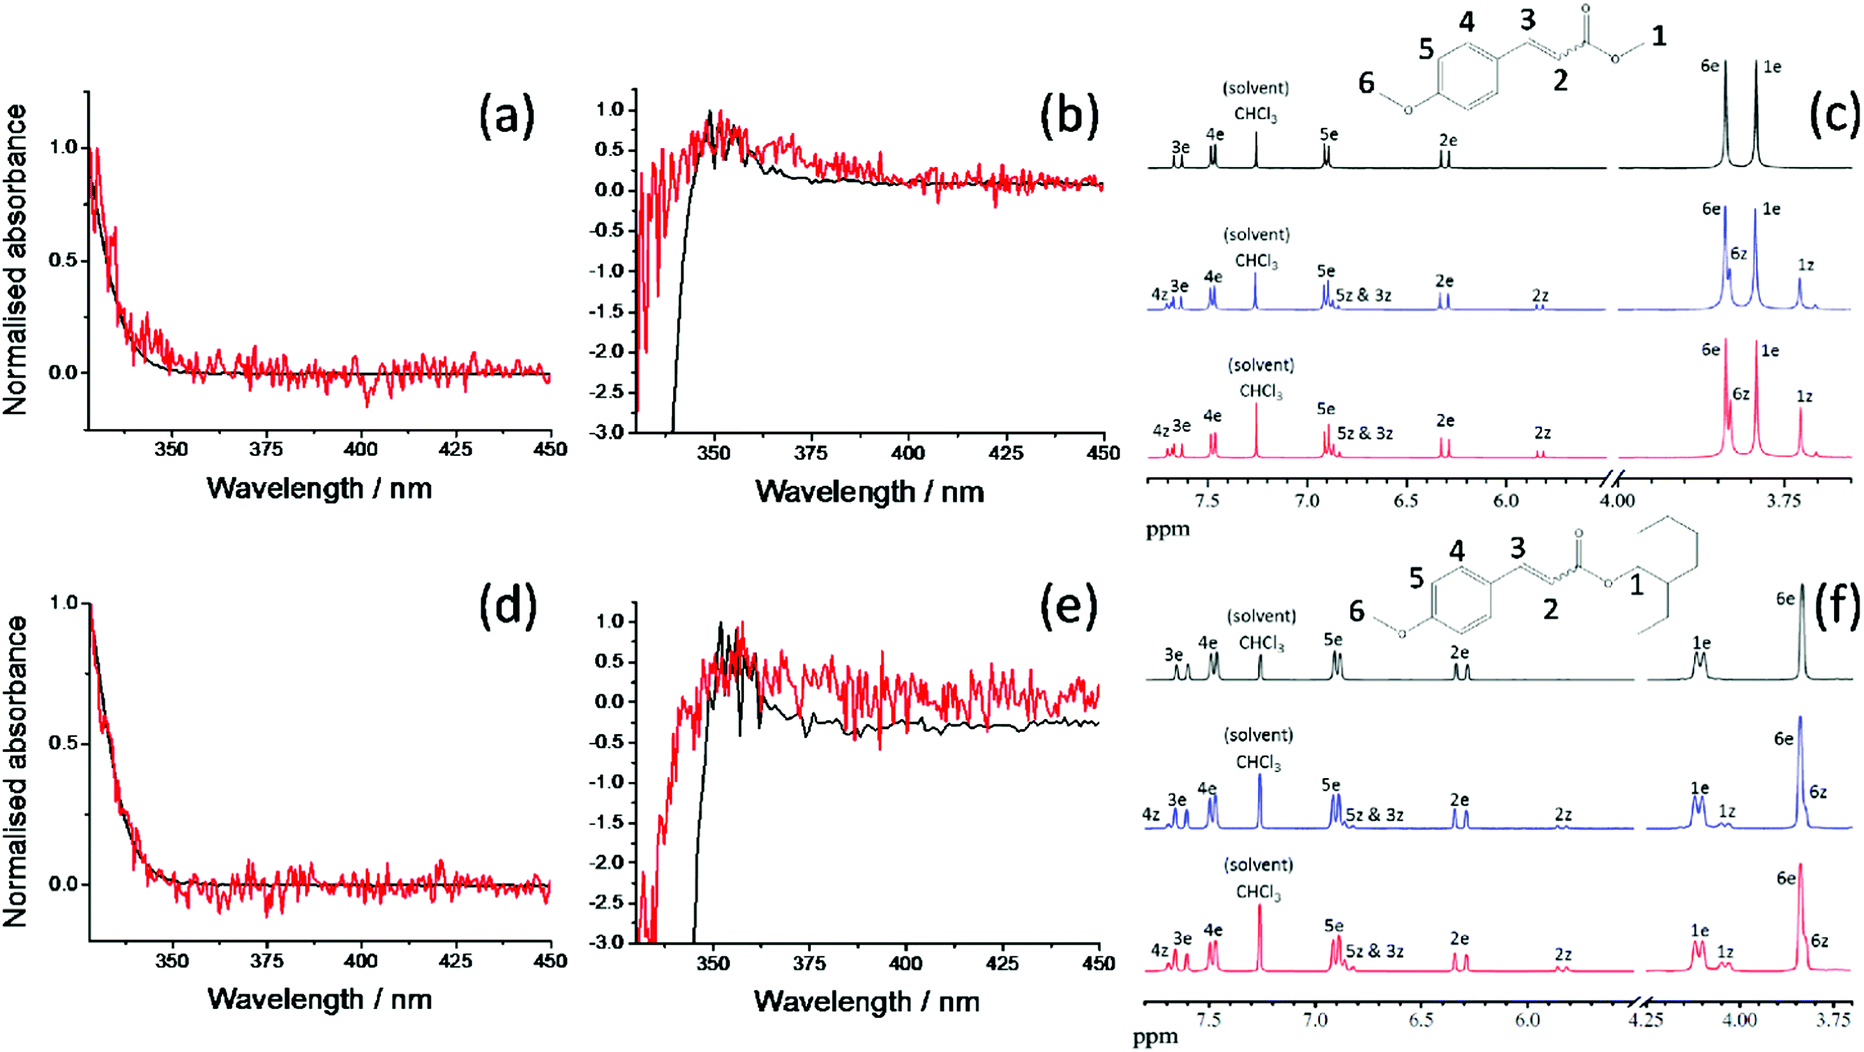 | ||
| Fig. 5 Normalised difference spectra (black traces) for E-MMC in (a) cyclohexane (λpump = 290 nm) and (b) methanol (λpump = 308 nm) compared with the corresponding TAS (red traces) at 2 ns; (c) 1H NMR spectra (CDCl3, 400 MHz) of E-MMC and peak attribution using the proton numbering presented inset and labelling the protons from the E and Z isomers as ‘e’ and ‘z’ respectively: before irradiation (black trace), after irradiation at 290 nm for 1 hour in cyclohexane (blue trace) and after irradiation at 308 nm for 1 hour in methanol (red trace). (d)–(f) Similar but for E-EHMC and 1H NMR spectra (CDCl3, 300 MHz). Everything below 3.7 ppm has been removed for clarity (see ESI† for detailed spectra). | ||
The TAS were globally fit in order to extract the time-constants related to the different dynamical behaviours of E-MMC in the two solvents. The decay associated spectra (DAS) corresponding to the TAS shown in Fig. 4a and b, are presented in Fig. 4c and d, respectively. With such DAS, a positive amplitude corresponds to a decay in the TAS signal, a negative amplitude to a growth. As reported in Table 1, three time-constants are required to account for the excited state dynamics of E-MMC in cyclohexane and methanol. The first two time-constants are hundreds of fs in duration each, the fastest of which (τ1) shows a positive amplitude in the DAS at ∼400 nm and negative signal further to blue, usually indicative of population flow between two states. The middle time-constant (τ2), where relevant, shows principally a positive DAS amplitude. The final time-constant is assigned as τ3 > 2 ns, used to fit a long-lived component in the TAS (i.e. a new species which lives beyond our temporal window), and manifests in the DAS as a small positive feature at ∼340 nm. Cursory inspection of the DAS in Fig. 4 and time-constants reported in Table 1 show notable differences upon changing solvent, suggesting that the hydrogen bonding in methanol may have some effect on the relaxation dynamics of E-MMC. An additional time-constant, not included in the data presented in Table 1, was necessary to produce a good fit in both solvents. This component, which is below the temporal resolution of our experiment, is assigned to the response from solvent- and CaF2 window-dynamics from the Harrick Cell (see ESI†) and, therefore, will not be discussed further.
| Compound; solvent | Wavelength | τ 1/ps | τ 2/ps | τ 3/ns |
|---|---|---|---|---|
| a A weak feature with a ∼3 ps decay is observed in the TAS around 330 nm. However, it was not possible to produce an accurate fit for it because of its low intensity and its position on the edge of our probe window. b Contrary to E-MMC in cyclohexane, τ2 is needed to have a good fit, but the uncertainty is large, see ESI. | ||||
| E-MMC; cyclohexane | λ pump = 290 nm | 0.62 ± 0.02 | ∼3a | >2.0 |
| E-MMC; methanol | λ pump = 308 nm | 0.22 ± 0.04 | 0.75 ± 0.09 | >2.0 |
| E-EHMC; cyclohexane | λ pump = 290 nm | 0.6 ± 0.1 | 1.8 ± 1.2b | >2.0 |
| E-EHMC; methanol | λ pump = 308 nm | 0.26 ± 0.09 | 1.1 ± 0.3 | >2.0 |
We begin our analysis by addressing the long lived species (τ3) present in both cyclohexane and methanol. Based on previous experimental and theoretical studies on E-MMC24,25 and related molecules,15,19,41 there is sufficient precedent that E-MMC is likely to form Z-MMC, or other photoproducts, upon photoexcitation. To verify this, we recorded difference spectra (see Section 2.3) of E-MMC in both cyclohexane and methanol, following irradiation at the maximum spectral absorbance (see Fig. 1); 290 nm in cyclohexane and 308 nm in methanol. These are shown by the black traces given in Fig. 5a and b for cyclohexane and methanol, respectively. As with the 2 ns TAS, we can see that there is a clear positive feature at <340 nm in cyclohexane and at ∼350 nm in methanol. These results suggest that after 10 minutes of irradiation, there is a drop in absorption from the initial molecule, along with the emergence of a new species absorbing at <340 nm in cyclohexane and at ∼350 nm in methanol. Moreover, the shape of the difference spectra in cyclohexane (more noticeably) and methanol, accord nicely with the TAS at 2 ns (red traces in Fig. 5a and b) indicating that the new absorbing species are formed in less than 2 ns and have extended lifetimes (i.e. are chemically stable). Theoretical calculations25 (see Fig. 3) and a previous study of E-MMC embedded in neon matrices,24 suggest that the observed photoproduct is the Z-MMC isomer. The reduced correlation between the 2 ns TAS and the difference spectrum in methanol is likely due to the appearance of another, less stable, photoproduct, which is most likely attributed to a phenolic radical species. This radical is formed via ionisation to generate solvated “free”-electrons,10,20,43,44 as has been previously observed in similar cinnamate-based systems.10,20 Indeed the TAS in methanol at 2 ns seems to present a small absorption feature around 600 nm which is not observed in the difference spectrum (see ESI†). We tentatively suggest that this feature corresponds to solvated electrons42 formed by multiphoton ionisation of E-MMC to produce the unstable radical cation E-MMC+ (which subsequently generates the phenolic radical species),10,20,43,44 although the poor signal-to-noise in the data makes definitive assignment impossible. In any case, in a sunscreen context, the formation of this photoproduct is of little importance as multiphoton absorption is unlikely to occur under sun light irradiance. In both the 2 ns TAS and the difference spectrum, there appears to be a positive offset, the origins of which are not clear. It is worth noting, however, that signal levels were particularly low in this region (∼10 μΔOD), well within the error of the instruments involved, and so any quantitative analysis in this region is unfeasible.
In order to further validate the E/Z photoisomerisation pathway in both the dynamic and steady-state measurements presented in Fig. 4 and 5 respectively, we recorded 1H NMR spectra of samples containing E-MMC in both cyclohexane and methanol, pre- and post-irradiation with the wavelength corresponding to the maximum of absorption in the two different solvents (see Fig. 1). The NMR spectra obtained are shown in Fig. 5c. Detailed spectra and further explanations are provided in the ESI.† The non-irradiated NMR spectrum (top) shows that the starting material is the E isomer exclusively. Upon irradiation, Z isomer is clearly present in the sample, as shown by the appearance of the new peaks in the NMR spectra post-irradiation (middle and bottom). By integrating the different peaks, we are able to estimate the relative proportions of E and Z isomers after one hour of irradiation, which gives ∼22% of Z isomer in cyclohexane and ∼28% in methanol. Even though we may not have reached the E/Z equilibrium ratio after only one-hour irradiation, the E/Z isomerisation seems to be slightly more efficient in methanol than in cyclohexane and the values are in good agreement with previous quantitative observations on photoisomerisation of EHMC.45
Given the evidence presented above, it is clear that photoexcited E-MMC rapidly returns to the ground electronic state as either the E or Z isomer. With this assignment, we now attempt to interpret E-MMC's short time behaviour in the solution-phase following UV-B photoexcitation to the 11ππ* state, particularly in light of the PECs schematised in Fig. 3. We first note, however, that E-MMC undergoes numerous processes that are likely convoluted together, thus making distinct assignment of any one time-constant with a molecular process difficult. We propose the following process for E-MMC both in cyclohexane and methanol: following photoexcitation to the 11ππ* state, E-MMC undergoes IVR (τ1), as evidenced by the rapid drop in intensity of the ∼400 nm feature in the TAS and the corresponding rise at <375 nm. This is characterised by the blue traces in the DAS in Fig. 4. Qualitatively, we observe this as a shift in intensity from ∼380 nm to ∼360 nm in the methanol TAS. Unfortunately, while we believe a similar process is occurring in cyclohexane, this intensity shift is less obvious: at wavelengths shorter than 400 nm the only positive feature appears at <330 nm. The apparently flat cyclohexane TAS in this region (ca. 350 nm and 500 fs) may be attributed to overlapping positive excited state absorption and negative ground state bleach (and/or stimulated emission) features. The spectral shift of these features between solvents is likely due to the relative stability of the 1ππ* states in methanol as compared to cyclohexane (as indicated in the static spectra in Fig. 1).
Subsequent to this initial relaxation, the excited state population evolves along the E/Z isomerisation coordinate, likely along with any solvent rearrangement that may occur, leading to 11ππ* → S0 IC facilitated through the corresponding 11ππ*/S0 CI (convoluted in τ2). This latter step accords with the mixture of E/Z isomers, given bifurcation of excited state population into two product channels (Fig. 3). In E-MMC in methanol, the positive DAS feature centred at 360 nm supports this assignment. Unfortunately, due to a low signal-to-noise ratio (likely due to competition between excited state absorption and ground state bleach/stimulated emission, vide supra), we were unable to fit the TAS feature at <330 nm in E-MMC in cyclohexane. We have, however, estimated the time-constant as a few picoseconds by visual inspection (see Table 1).
Moreover, it is worth noting that the dynamics are, in general (see also for E-EHMC), shorter in methanol than in cyclohexane. As discussed, this may be due to the lowering of the 11ππ* → S0 transition barrier, predicted by ab initio calculations of E-MMC with a single, hydrogen bonded solvent molecule,25 and the well-known destabilisation of the 11nπ* state in a polar-protic solvent,23 which ultimately suppresses the 11ππ* → 11nπ* transition. Interestingly, the still-anticipated low 11ππ* → 11nπ* barrier in cyclohexane (assuming very little perturbation to these states relative to the gas-phase) cannot prevent this transition from happening. However, gas-phase data show that the 11nπ* state is a long-lived state and it is likely that, in the solution phase (given the thermal energy at room temperature in solution), population exists in, and can flow between, both the 11ππ* and the 11nπ* until the 11ππ*/S0 CI is accessed.25 The global reaction seems likely, thus, to be led by the 11ππ* → S0 transition, leading to efficient population from all the excited molecules to S0 in either E or Z isomeric forms.
In addition to E-MMC, identical studies have been performed on E-EHMC: the results are presented in Fig. 4e and f for the TAS; Fig. 4g and h for the corresponding DAS; Fig. 5d and e for the difference spectra, Fig. 5f for the NMR study; and in Table 1 for the time-constants extracted from the global fits. Taken together, the results are almost commensurate to E-MMC's, with two main differences. Firstly, even though the values of τ2 overlap within error, we note that τ1 and τ2 are globally greater for E-EHMC than for E-MMC. That may be linked to the lengthening of the alkyl chain, which may provide some inertia towards rotation about the CC bond.46 We also note here that the limitation of the global fitting procedure means that all the lifetimes correspond to processes that start from time zero. As such, one expects to have ‘blurring’ of one dynamical process with the other (particularly when commensurate), and hence the effect on both τ1 and τ2. Secondly, the NMR spectra suggest an E/Z isomerisation leading to ∼15% and ∼23% of Z isomer in cyclohexane and methanol, respectively. This suggests that E-EHMC undergoes similar E/Z photoisomerisation dynamics as E-MMC, albeit with subtle differences. Moreover, this mechanism, along with the time-constants obtained, is in agreement with the fluorescence study of E-EHMC, both in hexane and methanol, which infers fluorescence lifetimes of less than 10 ps.45,47
We close by noting one final caveat. An alternative explanation for the attribution of the time-constants in both E-MMC and E-EHMC should be considered: τ1 could correspond to the convolution of IVR, the evolution along the E/Z isomerisation coordinate on the PES, and the 11ππ* → S0 de-excitation through the corresponding CI. τ2 would then model the cooling of vibrationally hot MMC or EHMC in the E/Z ground state, as has been observed in other systems.35,48 At this point we are unable to conclusively propose one mechanism over the other. However, this is considered unlikely in methanol solution as the slight negative component in the TAS in Fig. 4b and f at ∼450 nm and ∼2 ps time delay (see ESI†), is indicative of stimulated emission (also evidenced in the associated DAS in Fig. 4d and h at the same wavelength) which will not occur from a vibrationally hot ground state. While the same stimulated emission is not observed in cyclohexane, the similarity in time-constants observed between the two solvents make it likely that the same processes are occurring in each. As such, while the above caveat cannot be entirely ruled out, we suggest it to be less likely than the arguments presented in this work (vide supra). Importantly, however, this work reports the first combined investigation on E-MMC and E-EHMC's ultrafast behaviour in solution, and gives possible explanations for the ultrafast dynamics in both polar-protic and non-polar-aprotic solvents.
4 Conclusions
The present study reports on the excited state dynamics of one of the leading sunscreen filter molecules used in off-the-shelf sunscreens, E-EHMC, in both the gas- and solution-phase, along with its model chromophore, E-MMC. Both of these molecules display seemingly similar dynamics.In the gas-phase, photoexcitation to the 11ππ* state leads to a deactivation process characterised by three time-constants: τ1, τ2 and τ3. τ1, which ranges from ∼0.4 ps to ∼1.1 ps, is dependent on both the excitation energy in the 11ππ* state and the molecule studied (E-MMC or E-EHMC). τ2 ranges between ∼2.7 and ∼8 ps and is dependent on similar parameters as τ1. Finally, τ3 extends beyond the time-window of our measurements (≫0.9 ns). Our findings, guided closely by previous studies, lead us to suggest that τ1 and τ2 correspond to intramolecular vibrational relaxation within the 11ππ* state and non-radiative decay, via internal conversion, from the 11ππ* to the 11nπ* state, respectively. τ3 then models the de-excitation from the 11nπ* state to S0. The dependence on energy of τ1 and τ2 can be rationalised assuming a barrier along the reaction coordinate and/or different rotamers excited within our molecular beam. However, additional theoretical calculations would be helpful to confirm our results, such as the determination of the barriers along the 11ππ* → 11nπ* and the 11ππ* → S0 coordinates for the s-trans rotamer, which would confirm the energy dependence of τ2.
Using both a non-polar-aprotic solvent, cyclohexane, and a polar-protic solvent, methanol, the photochemistry of E-MMC and E-EHMC in a closer-to-realistic environment shows noticeable differences to the gas-phase. Whilst the deactivation processes are equally fast, requiring three time-constants to model, comparative steady state UV and 1H NMR data suggest that the long-lived component characterised by τ3 is attributable to the Z-MMC and Z-EHMC photoproducts and not population trapped in the 11nπ* state (cf. gas-phase). This leads us to propose that excited state deactivation involves flow of population from the vertical Franck–Condon region induced by intramolecular vibrational relaxation. This is characterised by τ1. τ2 then likely corresponds to excited state population evolving along the isomerisation coordinate along with internal conversion from 11ππ* to S0, mediated by an appropriate 11ππ*/S0 conical intersection, along with any associated solvent rearrangement. τ3 then reflects the long-lived Z-EHMC photoproduct. However, further investigation is needed, especially pump–probe measurements utilising a UV pump and IR probe, which would allow the direct observation of IVR, as well as the E/Z isomerisation, and validate the attribution of τ2 by seeking to observe vibrational cooling in S0.
As a final comment, E-MMC is a good basis for the development of future sunscreens like E-EHMC. The present study shows that E-MMC and E-EHMC do not produce any photofragments within 2 ns, following excitation at 308 nm and 290 nm, apart from radical species formed via multiphoton absorption, which is unlikely to occur with the photon flux from sun light irradiance. In fact, all the excited molecules return to S0 as one of the two possible stereoisomers, E or Z. Moreover, de-excitation to the ground state is ultrafast, efficiently removing potentially harmful excited E-EHMC from the skin. The reported results highlight the power and sensitivity of pump–probe spectroscopic techniques as well as the use of a ‘double’ bottom-up approach (complementary gas-phase and solution-phase studies alongside an increase in molecular complexity) to understand the photoprotection pathways of sunscreen agents in general, and E-EHMC's behaviour in particular.
Acknowledgements
Y. P. thanks the Ecole Normale Supérieure (ENS) de Cachan and French state for financing his studies. M. S. and N. D. N. R. thank the Engineering and Physical Sciences Research Council (EPSRC) for postdoctoral and doctoral funding respectively. L. A. B. and W. D. Q. thank the EPSRC for providing studentships under grant EP/F500378/1, through the Molecular Organisation and Assembly in Cells Doctoral Training Centre. N. C. C. F. thanks the Leverhulme Trust for postdoctoral funding. V. G. S. thanks the EPSRC for an equipment grant (EP/J007153) and the Royal Society for a University Research Fellowship. The authors thank Drs Jamie Young and Michael Horbury (University of Warwick) for their technical assistance and for helpful comments when preparing the manuscript.References
- C. E. Crespo-Hernández, B. Cohen, P. M. Hare and B. Kohler, Chem. Rev., 2004, 104, 1977 CrossRef PubMed.
- C. T. Middleton, K. de La Harpe, C. Su, Y. K. Law, C. E. Crespo-Hernández and B. Kohler, Annu. Rev. Phys. Chem., 2009, 60, 217 CrossRef CAS PubMed.
- W. J. Schreier, T. E. Schrader, F. O. Koller, P. Gilch, C. E. Crespo-Hernández, V. N. Swaminathan, T. Carell, W. Zinth and B. Kohler, Science, 2007, 315, 625 CrossRef CAS PubMed.
- G. P. Pfeifer, Y. H. You and A. Besaratinia, Mutat. Res., Fundam. Mol. Mech. Mutagen., 2005, 571, 19 CrossRef CAS PubMed.
- W. W. Sprenger, W. D. Hoff, J. P. Armitage and K. J. Hellingwerf, J. Bacteriol., 1993, 175, 3096 CAS.
- K. J. Hellingwerf, J. Hendriks and T. Gensch, J. Phys. Chem. A, 2003, 107, 1082 CrossRef CAS.
- U. K. Genick, S. M. Soltis, P. Kuhn, I. L. Canestrelli and E. D. Getzoff, Nature, 1998, 392, 206 CrossRef CAS PubMed.
- M. M. Caldwell, J. F. Bornman, C. L. Ballaré, S. D. Flint and G. Kulandaivelu, Photochem. Photobiol. Sci., 2007, 6, 252 CAS.
- G. I. Jenkins, Annu. Rev. Plant Biol., 2009, 60, 407 CrossRef CAS PubMed.
- M. Vengris, D. S. Larsen, M. A. van der Horst, O. F. A. Larsen, K. J. Hellingwerf and R. van Grondelle, J. Phys. Chem. B, 2005, 109, 4197 CrossRef CAS PubMed.
- E. M. M. Tan, S. Amirjalayer, B. H. Bakker and W. J. Buma, Faraday Discuss., 2013, 163, 321 RSC.
- J. C. Dean, R. Kusaka, P. S. Walsh, F. Allais and T. S. Zwier, J. Am. Chem. Soc., 2014, 136, 14780 CrossRef CAS PubMed.
- L. A. Baker, M. D. Horbury, S. E. Greenough, F. Allais, P. S. Walsh, S. Habershon and V. G. Stavros, J. Phys. Chem. Lett., 2016, 7, 56 CrossRef CAS PubMed.
- E. V. Gromov, I. Burghardt, H. Köppel and L. S. Cederbaum, J. Phys. Chem. A, 2005, 109, 4623 CrossRef CAS PubMed.
- T. N. V. Karsili, B. Marchetti, M. N. R. Ashfold and W. Domcke, J. Phys. Chem. A, 2014, 118, 11999 CrossRef CAS PubMed.
- S. Smolarek, A. Vdovin, D. L. Perrier, J. P. Smit, M. Drabbels and W. J. Buma, J. Am. Chem. Soc., 2010, 132, 6315 CrossRef CAS PubMed.
- N. D. N. Rodrigues, M. Staniforth, J. D. Young, Y. Peperstraete, N. C. Cole-Filipiak, J. R. Gord, P. S. Walsh, D. M. Hewett, T. S. Zwier and V. G. Stavros, Faraday Discuss., 2016 10.1039/C6FD00079G.
- M. de Groot, E. V. Gromov, H. Köppel and W. J. Buma, J. Phys. Chem. B, 2008, 112, 4427 CrossRef CAS PubMed.
- D. Shimada, R. Kusaka, Y. Inokuchi, M. Ehara and T. Ebata, Phys. Chem. Chem. Phys., 2012, 14, 8999 RSC.
- M. D. Horbury, L. A. Baker, W. D. Quan, S. E. Greenough and V. G. Stavros, Phys. Chem. Chem. Phys., 2016, 18, 17691 RSC.
- M. Staniforth and V. G. Stavros, Proc. Math. Phys. Eng. Sci., 2013, 469, 20130458 CrossRef PubMed.
- E. M. M. Tan, M. Hilbers and W. J. Buma, J. Phys. Chem. Lett., 2014, 5, 2464 CrossRef CAS PubMed.
- R. M. Hochstrasser, Acc. Chem. Res., 1968, 1, 266 CrossRef CAS.
- Y. Miyazaki, Y. Inokuchi, N. Akai and T. Ebata, J. Phys. Chem. Lett., 2015, 6, 1134 CrossRef CAS PubMed.
- X. P. Chang, C. X. Li, B. B. Xie and G. Cui, J. Phys. Chem. A, 2015, 119, 11488 CrossRef CAS PubMed.
- Y. Miyazaki, K. Yamamoto, J. Aoki, T. Ikeda, Y. Inokuchi, M. Ehara and T. Ebata, J. Chem. Phys., 2014, 141, 244313 CrossRef PubMed.
- V. G. Stavros, Nat. Chem., 2014, 6, 955 CrossRef CAS PubMed.
- L. A. Baker, M. D. Horbury, S. E. Greenough, M. N. R. Ashfold and V. G. Stavros, Photochem. Photobiol. Sci., 2015, 14, 1814 CAS.
- L. A. Baker and V. G. Stavros, Sci. Prog., 2016, 99, 282–311 CrossRef.
- M. D. Horbury, L. A. Baker, W. D. Quan, J. D. Young, M. Staniforth, S. E. Greenough and V. G. Stavros, J. Phys. Chem. A, 2015, 119, 11989 CrossRef CAS PubMed.
- S. E. Greenough, M. D. Horbury, J. O. F. Thompson, G. M. Roberts, T. N. V. Karsili, B. Marchetti, D. Townsend and V. G. Stavros, Phys. Chem. Chem. Phys., 2014, 16, 16187 RSC.
- A. Iqbal, L. J. Pegg and V. G. Stavros, J. Phys. Chem. A, 2008, 112, 9531 CrossRef CAS PubMed.
- U. Even, J. Jortner, D. Noy, N. Lavie and C. Cossart-Magos, J. Chem. Phys., 2000, 112, 8068 CrossRef CAS.
- S. E. Greenough, G. M. Roberts, N. A. Smith, M. D. Horbury, R. G. McKinlay, J. M. Zurek, M. J. Paterson, P. J. Sadler and V. G. Stavros, Phys. Chem. Chem. Phys., 2014, 16, 19141 RSC.
- L. A. Baker, M. D. Horbury, S. E. Greenough, P. M. Coulter, T. N. V. Karsili, G. M. Roberts, A. J. Orr-Ewing, M. N. R. Ashfold and V. G. Stavros, J. Phys. Chem. Lett., 2015, 6, 1363 CrossRef CAS PubMed.
- M. P. Grubb, A. J. Orr-Ewing and M. N. R. Ashfold, Rev. Sci. Instrum., 2014, 85, 064104 CrossRef PubMed.
- A. S. Chatterley, C. W. West, V. G. Stavros and J. R. R. Verlet, Chem. Sci., 2014, 5, 3963 RSC.
- J. R. Lakowicz, Principles of Fluorescence Spectroscopy, 3rd edn, Springer, Singapore, 2011 Search PubMed.
- L. Blancafirt, V. Ovejas, R. Montero, M. Fernandez-Fernandez and A. Longarte, J. Phys. Chem. Lett., 2016, 7, 1231 CrossRef PubMed.
- T. Ebata, 2016, Private communication.
- K. Pande, C. D. M. Hutchison, G. Groenhof, A. Aquila, J. S. Robinson, J. Tenboer, S. Basu, S. Boutet, D. P. DePonte, M. Liang, T. A. White, N. A. Zatsepin, O. Yefanov, D. Morozov, D. Oberthuer, C. Gati, G. Subramanian, D. James, Y. Zhao, J. Koralek, J. Brayshaw, C. Kupitz, C. Conrad, S. Roy-Chowdhury, J. D. Coe, M. Metz, P. Lourdu Xavier, T. D. Grant, J. E. Koglin, G. Ketawala, R. Fromme, V. Šrajer, R. Henning, J. C. H. Spence, A. Ourmazd, P. Schwander, U. Weierstall, M. Frank, P. Fromme, A. Barty, H. N. Chapman, K. Moffat, J. J. van Thor and M. Schmidt, Science, 2016, 352, 725 CrossRef CAS PubMed.
- S. Arai and M. C. Sauer Jr, J. Chem. Phys., 1966, 44, 2297 CrossRef CAS.
- D. S. Larsen, I. H. M. van Stokkum, M. Vengris, M. A. van der Horst, F. L. de Weerd, K. J. Hellingwerf and R. van Grondelle, Biophys. J., 2004, 87, 1858 CrossRef CAS PubMed.
- M. Vengris, I. H. M. van Stokkum, X. He, A. F. Bell, P. J. Tonge, R. van Grondelle and D. S. Larsen, J. Phys. Chem. A, 2004, 108, 4587 CrossRef CAS.
- K. M. Hanson, S. Narayanan, V. M. Nichols and C. J. Bardeen, Photochem. Photobiol. Sci., 2015, 14, 1607 CAS.
- A. Espagne, D. H. Paik, P. Changenet-Barret, M. M. Martin and A. H. Zewail, ChemPhysChem, 2006, 7, 1717 CrossRef CAS PubMed.
- T. M. Karpkird, S. Wanichweacharungruang and B. Albinsson, Photochem. Photobiol. Sci., 2009, 8, 1455 CAS.
- Y. Nosenko, G. Wiosna-Salyga, M. Kunitski, I. Petkova, A. Singh, W. J. Buma, R. P. Thummel, B. Brutschy and J. Waluk, Angew. Chem., Int. Ed., 2008, 47, 6037 CrossRef CAS PubMed.
Footnote |
| † Electronic supplementary information (ESI) available: Molecular structures of MMC, instrument response determination, kinetic analysis of gas- and solution-phase spectra, attempted biexponential TR-IY transient fits, TR-IY transient with 315 nm probe, detailed difference spectrum in methanol, further details of global fitting, NMR measurements, and TAS line-outs at 450 nm. See DOI: 10.1039/c6cp05205c |
| This journal is © the Owner Societies 2016 |