 Open Access Article
Creative Commons Attribution 3.0 Unported Licence
Mechanochemical synthesis and high temperature thermoelectric properties of calcium-doped lanthanum telluride La3−xCaxTe4
James M.
Ma†
ab,
Samantha M.
Clarke†
ab,
Wolfgang G.
Zeier
c,
Trinh
Vo
a,
Paul
Von Allmen
a,
G.
Jeffrey Snyder
c,
Richard B.
Kaner
bd,
Jean-Pierre
Fleurial
a and
Sabah K.
Bux
*a
aThermal Energy Conversion Technologies, Jet Propulsion Laboratory, California Institute of Technology, 4800 Oak Grove Drive, Pasadena, California 91109-8099, USA. E-mail: sabah.k.bux@jpl.nasa.gov
bDepartment of Materials Science and Engineering, University of California, Los Angeles, 90092, USA
cDepartment of Material Science and Engineering, Northwestern University, Evanston, IL 60208, USA
dDepartment of Chemistry and Biochemistry, University of California, Los Angeles, 90092, USA
First published on 31st July 2015
Abstract
The thermoelectric properties from 300–1275 K of calcium-doped La3−xTe4 are reported. La3−xTe4 is a high temperature n-type thermoelectric material with a previously reported zTmax ∼ 1.1 at 1273 K and x = 0.23. Computational modeling suggests the La atoms define the density of states of the conduction band for La3−xTe4. Doping with Ca2+ on the La3+ site is explored as a means of modifying the density of states to improve the power factor and to achieve a finer control over the carrier concentration. High purity, oxide-free samples are produced by ball milling of the elements and consolidation by spark plasma sintering. Calcium substitution upon the lanthanum site was confirmed by a combination of Rietveld refinements of powder X-ray diffraction data and wave dispersive spectroscopy. A zTmax ∼ 1.2 is reached at 1273 K for the composition La2.2Ca0.78Te4 and the relative increase compared to La3−xTe4 is attributed to the finer carrier concentration.
Introduction
Thermoelectric (TE) materials are solid state energy conversion devices which are able to generate electricity through the Seebeck effect or serve as a heat pump through the Peltier effect. Thermoelectric generators (TEGs) have demonstrated their extraordinary reliability and longevity in support of the National Aeronautics Space Administration's (NASA) deep space science and exploration missions. The TEGs powering the Voyager missions launched in 1977 are still operational.1 Most recently, a TEG powers the Curiosity rover on Mars with TEGs continuing to be a key technology for future missions.2State-of-practice TEGs have system level thermal-to-electric energy conversion efficiencies of 6 to 6.5% utilizing materials with a dimensionless thermoelectric figure of merit zT close to 1.3,4 The zT is defined as zT = S2T/(ρκ) and good TE materials exhibit low thermal conductivity (κ), low electrical resistivity (ρ), and a large Seebeck coefficient (S). The thermal conductivity is the sum of the electronic contribution, κe, and the lattice contribution, κL. Further, the ultimate efficiency of the TE device is dependent upon the zT across the temperature range of operation, Tmax, and ΔT thereby making high temperature materials desirable to maximize efficiency. New materials with improved zT are sought to reduce the weight of the spacecraft, enable additional instrumentation, and reduce Pu-238 fuel requirements.5
Recent development of new thermoelectric materials has doubled the TE couple-level efficiency to 15% roughly doubling heritage technologies.6 The high temperature (875–1273 K) n-type segment of this high efficiency prototype is lanthanum telluride, La3−xTe4, a self-doped refractory rare earth chalcogenide with a reported zT of 1.1 at 1273 K when x = 0.23.7,8
The compound, La3−xTe4, has a defect structure with the carrier concentration varied through controlling the lanthanum vacancy concentration. It can be understood as each lanthanum atom contributing 3 electrons and 2 electrons are required for each tellurium atom. Thereby, the electronic properties can vary between metallic at x = 0 with one free e− per formula unit (La3Te4) to an insulator at x = 0.33 with no free carriers (La2.67Te4). In addition, the material has good electronic transport properties due to the favorable band structure of the material.9 The existence of heavy conduction bands allows for high Seebeck coefficients even at high carrier concentrations. Lastly, La3−xTe4 exhibits low lattice thermal conductivity due to the complex crystal structure, phonon scattering from the vacancies, and electron–phonon scattering at high carrier concentrations.9,10 This results in the high zT = 1.1 at 1273 K at the optimum carrier concentration n ∼ 0.9 × 1020 cm−3.
From computational modelling, it has been found that the density of the states (DOS) in the conduction band is dominated by the 5d orbitals from the lanthanum atoms.9,11 Non-isoelectronic cation substitutions M2+ on the La3+ site could increase the Seebeck coefficient for this material through a modification of the density of states. In addition, the use of a divalent cation would allow for a finer control over the carrier concentration. The electronic local environment becomes La3+3−x−y□La,xM2+yTe2−4e1−1−3x, where □La,x represents the number of vacancies in the system and M2+y represents the amount of non-isoelectronic metal substituents in the system. The theoretical carrier density can be calculated by n = nmax (1 − 3x − y) where nmax = 4.5 × 1021 cm−3 and is the carrier concentration of the metallic system, x is the number of lanthanum vacancies, and y is the number of divalent cations.12 There is a threefold finer control of carrier concentration in the M2+ doped system compared to the vacancy-doped system. Hence, a divalent cation substitution allows for more precise synthesis of samples with carrier concentrations in the optimized region of 0.8 × 1021 cm−3 to 1.2 × 1021 cm−3, which had previously been difficult to obtain.13 This doping also provides a way to create vacancy-free structures with identical carrier concentrations to the vacancy-doped samples, allowing for a separation of the impact on the lattice thermal conductivity of various defects on the La sublattice (vacancies, divalent atoms) versus electron–phonon interactions.
For this study, calcium was chosen as the dopant because of the definitive 2+ charge, similarity in size to La3+ which enhances the probability of successful substitution upon that site, and the difference in electronic properties from lanthanum atoms as it lacks electrons in the d orbital. Non-isoelectronic cation substitution has been previously explored with ytterbium, but the cation can be mixed valence Yb2+/Yb3+ and is also a rare earth similar to lanthanum.12 Substitution with a non-rare earth dopant is pursued here as it can result in larger changes to the DOS by introducing a different chemical bonding environment. In this study, the calcium-doped compounds are vacancy-free to prevent conflation of the effects of calcium versus vacancies.
Results and discussion
Sample characterization
The samples were analyzed for phase purity through powder X-ray diffraction. An exemplary diffraction pattern of La3−xCaxTe4 is shown in Fig. 1. The diffraction pattern indicates there is good agreement to the phase for La3−xTe4 as established by Cox et al.14 The residual intensity is low and the samples are phase pure with no secondary or oxide phases present. The refinement parameters are presented in Table 1. The low values for the goodness-of-fit indicate good agreement with the proposed model. Changes in the Te position account for the observed lattice expansion only.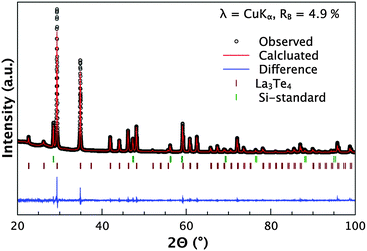 | ||
| Fig. 1 X-ray diffraction pattern of La2.2Ca0.8Te4 including profile fit, profile difference, and profile residuals of the corresponding Rietveld refinement, showing a good match to the La3Te4 phase.14 The diffraction pattern is representative of other compositions. A silicon internal standard was used and the reflections are indicated. There are no oxide or secondary phases present. | ||
La3−xCaxTe4I![[4 with combining macron]](https://www.rsc.org/images/entities/char_0034_0304.gif) 3d 3d |
x = 0 | x = 0.609 | x = 0.775 | x = 0.8 |
|---|---|---|---|---|
| R B (%) | 5.1 | 4.8 | 7.9 | 4.9 |
| GoF | 5.3 | 3.6 | 2.2 | 4.2 |
| a (Å) | 9.626(1) | 9.628(1) | 9.632(1) | 9.630(1) |
| La/Ca (x,y,z) | (0.375,0,0.5) | (0.375,0,0.5) | (0.375,0,0.5) | (0.375,0,0.5) |
| Te (x = y = z) | 0.07538(8) | 0.07386(6) | 0.07291(7) | 0.07320(7) |
| U iso (La/Ca) (Å2) | 0.0282(4) | 0.0318(3) | 0.0335(5) | 0.0259(4) |
| U iso (Te) (Å2) | 0.0278(4) | 0.0335(3) | 0.0356(4) | 0.0259(4) |
| Occ(La) | 0.993(4) | 0.791(4) | 0.709(7) | 0.729(5) |
| Occ(Ca) | 0 | 0.209(4) | 0.291(7) | 0.271(5) |
It has been previously suggested through computational modeling that cation vacancy ordering can stabilize the structure by increasing the distance in between charge centers.15 Experimental results from the powder XRD suggest a random distribution of the Ca2+ atoms on the La3+ site for the polycrystalline sample, since no superstructure reflections were found.
Rietveld analysis is used to determine the composition of the samples through refinement of the calcium occupancy on the lanthanum position. There is good agreement between the nominal compositions and refined composition as seen in Fig. 2. The solubility limit of calcium in the La3−xTe4 was not fully explored due to the limited thermoelectric usefulness of very low carrier concentration samples and the difficulty of handling samples in air. It was observed that oxygen and moisture sensitivity of the samples appeared to increase with increasing calcium content although both lanthanum and calcium are oxygen and moisture reactive metals.
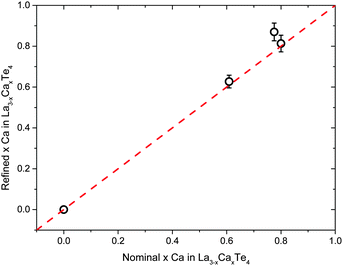 | ||
| Fig. 2 The Rietveld refined composition of La3−xCaxTe4 matches well to nominal compositions. Error bars represent a 5% uncertainty. | ||
The lattice parameters of the calcium-doped samples were determined through XRD and the lattice parameter as a function of the refined composition is presented in Fig. 3. There is a small and steady increase in the lattice parameter as a function of calcium doping. Even with a ∼30% substitution of calcium on the lanthanum position, the lattice parameter increases only by 0.003 Å. This is expected since the ionic radii of Ca2+ (114.0 pm) is similar in size to the ionic radii of La3+ (117.2 pm).16 Therefore, the Ca2+ atom should be able to occupy a La3+ without much distortion to the lattice.
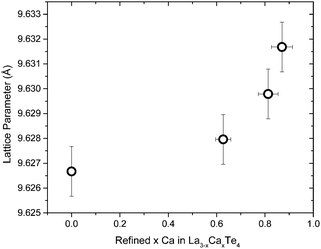 | ||
| Fig. 3 The lattice parameter of the La3−xCaxTe4 as a function of the refined calcium content. Y-error bars represent the instrumental limit of ±0.001 Å and X-error bars represent a 5% uncertainty. | ||
This result suggests that a variety of other cation dopants can occupy the La3+ position indicating a phase space rich with possibilities for cationic doping of La3+. The vacancy limit for La3−xTe4 is x = 0.33 and it is possible to dope beyond this threshold with calcium atoms. Therefore the calcium atoms are more than just occupying vacancy positions within the La3−xTe4 network. The calcium atoms fully substitute the lanthanum position and help form the structure. This result is promising for modification of the electronic structure of La3−xTe4. It is interesting to note that calcium and tellurium have not been shown to create the Th3P4 structure type. Therefore this suggests that the La3+ in La3−xTe4 is amendable to doping by a wide variety of dopants which are chemically different in so far that charge balance is preserved or there is an excess of electrons. This is promising as it provides guidelines for future substitutions by a wide variety of dopants which can modify the behavior of this already high zT material.
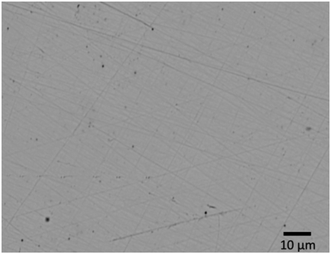
The calcium-substituted samples were found to be homogeneous as seen through the uniform contrast in the backscattered electron (BSE) micrograph of a typical sample (Fig. 4). The dark spots in the image are due to small amounts of porosity.
Electronic transport properties
In this study, compositions were studied near the previously optimized carrier concentration of 0.9 × 1021 cm−3 for La3−xTe4.3 The room temperature carrier concentrations of the samples measured through the Hall effect are compared to the carrier concentration calculated from the compositions determined by XRD and WDS (Fig. 5). There is good agreement between carrier concentrations as determined by the various methods confirming that the calcium is reliably doped into the system.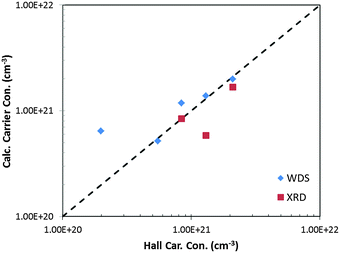 | ||
| Fig. 5 The carrier concentration of La3−xCaxTe4 as determined by the Hall effect compared to WDS and XRD. Ideal matching to the Hall carrier concentration is shown as the dashed line. | ||
The low carrier mobility of La3−xCaxTe4 < 4 cm2 V−1 s−1 presents a challenge in the accurate measurement of the Hall coefficient for high carrier concentration compositions. The low mobility results in a low Hall coefficient and lower signal-to-noise ratio limiting the accuracy of the results as observed as deviation from other analytical techniques.
At low carrier concentrations, it was observed that the samples tarnished more quickly, possibly due to the higher calcium content, which resulted in higher contact resistances to the samples. In addition, the higher resistivity of the low carrier concentration samples resulted in a greater challenge in obtaining Ohmic contact to the sample without metallization. These factors combine to result in the greater observed deviation between the Hall and WDS carrier concentrations for the low carrier concentration composition nH = 0.2 × 1021 cm−3.
The deviation of the carrier concentration as determined by XRD from Hall carrier concentration at nH = 1.3 × 1021 cm−3 can be attributed to the poorer refinement of the x = 0.775 composition as indicated by the larger Bragg residual. The good agreement with Hall carrier concentration with the carrier concentration as calculated from the WDS composition suggests that the error originates from the Rietveld refinement of this composition.
The temperature dependence of the electrical resistivity is shown in Fig. 6. The measurements are labeled by their Hall carrier concentration (×1021 cm−3). The compositions of La3−xCaxTe4 with carrier concentrations greater than 0.5 × 1021 cm−3 exhibit typical heavily-doped semiconductor behavior. The resistivities of samples are low (less than 4 mΩ cm) near the optimum carrier concentration and rise with temperature due to greater electron–phonon scattering. The curve of the heavily Ca-doped low carrier concentration sample (0.2 × 1021 cm−3) indicates thermally activated carriers with a decreasing resistivity up to ∼500 K. A similar behavior is seen for lower carrier concentration samples of La3−xTe4 (0.1 × 1021 cm−3). However, there is no thermal activation of carriers for samples with ≥0.5 × 1021 cm−3.
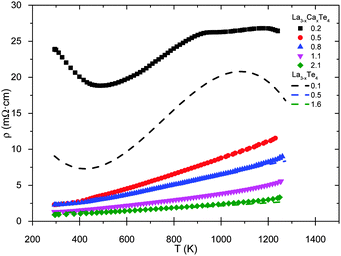 | ||
| Fig. 6 High temperature resistivity of La3−xCaxTe4 as compared to values reported for La3−xTe4.7 The samples are labeled by their carrier concentration (×1021 cm−3). | ||
The calcium-doped samples follow similar trends to La3−xTe4 (dashed lines) for samples of comparable carrier concentrations previously reported by May et al.7 The resistivities of samples with carrier concentrations of 0.8 × 1021 cm−3 and 2.1 × 1021 cm−3 for La3−xCaxTe4 overlay well with the 0.5 × 1021 cm−3 and 1.6 × 1021 cm−3 as reported by May et al.7 The differences in carrier concentration are likely due to the uncertainty in the measurement of carrier concentration as previously discussed.
The Seebeck coefficient as a function of temperature is presented in Fig. 7. The Seebeck coefficient decreases monotonically with increasing carrier concentration as expected. As previously explored by May et al., the presence of heavily doped bands near the conduction band edge enables the maintenance of a high Seebeck coefficient even at high dopant concentrations.9 This key property of La3−xTe4, which enables the material to be a high zT thermoelectric material, is still present for La3−xCaxTe4.
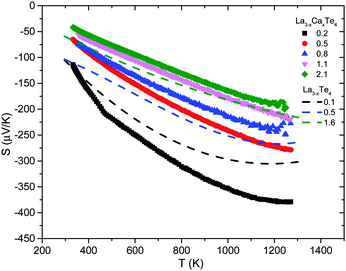 | ||
| Fig. 7 High temperature Seebeck coefficient of La3−xCaxTe4 as compared to values reported for La3−xTe4.7 The samples are labeled by their carrier concentration (×1021 cm−3). | ||
The thermal bandgap for the material can be estimated from the maximum Seebeck coefficient and the temperature at which that occurs using the equation Eg ≈ 2eSmaxTmax.18 The bandgap ranges from ∼0.45–0.95 eV depending on the dopant concentration. These values agree with the bandgap of ∼0.8 eV previously reported for La3−xTe4.7
The Seebeck coefficient of La3−xCaxTe4 as a function of temperature has the same temperature dependence as La3−xTe4. The desired effect was to modify the band structure of La3−xTe4 through calcium doping. To fully compare the effects of calcium doping, a plot of Seebeck coefficient versus electrical resistivity at 1275 K of La3−xCaxTe4 compared to La3−xTe4 is provided in Fig. 8. The Seebeck coefficient with respect to the electrical resistivity exhibits essentially no difference between La3−xCaxTe4 and La3−xTe4. A similar behavior was observed for the previously studied La3−xYbxTe4.17 These results suggest that the cation dopants are behaving as substitutional dopants which provide carriers to the structure, but are possibly at a level too low to affect the band structure of La3−xTe4 despite the ∼30 at% substitution of the cation site by calcium. This result suggests that near the conduction band edge, the 5d lanthanum atom orbitals are still controlling the transport phenomena.
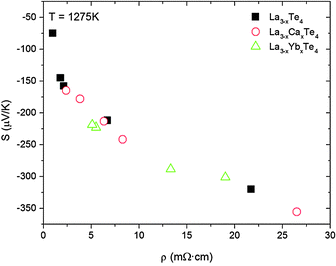 | ||
| Fig. 8 The Seebeck coefficient of La3−xCaxTe4 as a function of electrical resistivity follows a similar trend compared to La3−xTe4 and La3−xYbxTe4 suggesting that calcium doping does not modify the band structure at 1275 K.7,17 | ||
Given that La3−xCaxTe4 appears to exhibit a similar transport behavior the band structure near the conduction band is likely similar. May et al. previously found that La3−xTe4 fits a multiparabolic band model and derived the effective masses of m1*/me = 0.39, m2*/me = 1.05, and m3*/me = 1.56 with corresponding band degenerancies of g1 = 2, g2 = 1, and g3 = 2.9
The resulting electronic transport properties are in agreement with the results from X-ray diffraction and electron microprobe WDS in that the calcium atoms are substituting into the structure as an unambiguous +2 cation. Through calcium substitution, a finer control over carrier concentration is realized. The La3+![[thin space (1/6-em)]](https://www.rsc.org/images/entities/char_2009.gif) :
:![[thin space (1/6-em)]](https://www.rsc.org/images/entities/char_2009.gif) Ca2+ composition can be adjusted to only add one electron at a time to the system, whereas the vacancy doped system adds three. This result supports the initial hypothesis for enhanced control over carrier concentration as variations in carrier concentration progress more gradually as a function of stoichiometry. Fine carrier concentration control is important for the La3−xTe4 system as small deviations near the optimized carrier concentration result in significant changes in the thermoelectric performance.
Ca2+ composition can be adjusted to only add one electron at a time to the system, whereas the vacancy doped system adds three. This result supports the initial hypothesis for enhanced control over carrier concentration as variations in carrier concentration progress more gradually as a function of stoichiometry. Fine carrier concentration control is important for the La3−xTe4 system as small deviations near the optimized carrier concentration result in significant changes in the thermoelectric performance.
Thermal transport properties
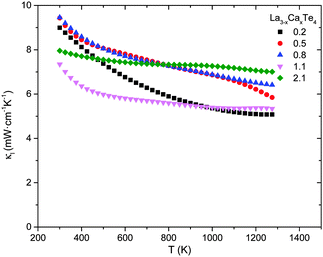
The thermal conductivity as a function of temperature of La3−xCaxTe4 compared to La3−xTe4 is shown in Fig. 9. Paralleling the electronic properties, the total thermal conductivity is similar between La3−xCaxTe4 and the vacancy controlled La3−xTe4 at equivalent carrier concentrations. The total thermal conductivities for the various compositions are 6–14 mW cm−1 K−1 at 1275 K with the thermal conductivities increasing with increasing carrier concentration. This proportional relation suggests a significant contribution of the electron thermal conductivity κe for the high carrier concentration samples. The relative proportions are analyzed by parsing the contributions to total thermal conductivity.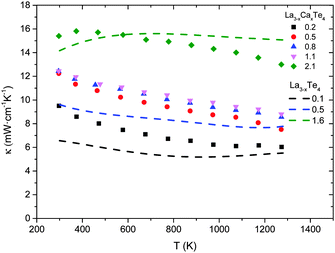 | ||
| Fig. 9 Thermal conductivity as a function of temperature for La3−xCaxTe4 as compared to La3−xTe4.7 | ||
The total thermal conductivity is the sum of the lattice and electronic thermal conductivity: κt = κe + κl. To determine the lattice thermal conductivity, the electronic contribution to the total thermal conductivity was first calculated using the Wiedemann–Franz law κe = σLT where σ is the electrical conductivity, L is the Lorenz number, and T is the absolute temperature, followed by subtracting from κt. The Lorenz number is calculated as a function of Seebeck coefficient using the approximation L = 1.5 + exp(−|S|/116).19 The Seebeck coefficient varies as a function of temperature and carrier concentration resulting in Lorenz numbers in the range of 2.2–1.5 × 10²¹ W Ω K−2.
The lattice thermal conductivity as a function of temperature is shown in Fig. 10. The minimum lattice thermal conductivity is achieved at a carrier concentration of 1.1 × 1021 cm−3 and 0.2 × 1021 cm−3 for the calcium-doped system. The lattice thermal conductivity is comparable to the lattice thermal conductivity for La3−xTe4 which ranges from 4–8 mW cm−1 K−1 at 1000 K.7 The intrinsically low lattice thermal conductivities for all compositions can be attributed to the complex crystal structure resulting in significant Umklapp scattering of acoustic phonons.20 Further reduction of lattice thermal conductivity at higher carrier concentrations can be attributed to electron–phonon scattering which can be appreciable for material with carrier concentrations of ∼1021 cm−3.21 Reduced lattice thermal conductivities at low carrier concentrations can be attributed to the higher defect concentrations leading to enhanced point-defect scattering. The effects of point-defect scattering and electron–phonon scattering are small considering the lattice thermal conductivity varies between 6–7.5 mW cm−1 K−1 despite the order of magnitude change in carrier concentration and 30 at% substitution of the lanthanum positions with calcium suggesting that Umklapp scattering is still the dominant scattering mechanism. The effect of point-defect scattering can potentially be more significant if the substituting atom results in a greater lattice distortion. In the case of calcium doping, the lattice parameter change is less than 0.1%.
The lattice thermal conductivity takes into account the bipolar contribution to thermal conductivity from thermally activated minority carriers which effect can be observed as a rise in the lattice thermal conductivity at high temperature. However, in the case of La3−xCaxTe4 and La3−xTe4 near the optimized carrier concentration, the Fermi level is in the conduction band away from the conduction band edge and the material has a sufficient band gap, thereby limiting the effect of minority carriers. Therefore the lattice thermal conductivity is relatively flat as a function of temperature which contributes, in conjunction with greater electron–phonon scattering, to a flat total thermal conductivity at increased temperatures.
Thermoelectric figure of merit
The end result of calcium substitution in La3−xTe4 is that there is a marginal improvement in the thermoelectric figure of merit zT as shown in Fig. 11. The peak zT of 1.2 at 1275 K was obtained at the optimum doping level of 1.1 × 1021 cm−3 which is ∼10% improvement compared to vacancy controlled La3−xTe4 zT ∼ 1.1. This minimal improvement is expected as it appears that calcium is doping into the La3−xTe4 structure without much effect upon the band structure. The improvement to zT is thereby attributed to better optimization of carrier concentration enabled by substitution with a divalent cation. This result is reflected as well in the optimization of zT as a function of carrier concentration as shown in Fig. 12. The behavior of La3−xCaxTe4 follows the multiparabolic band model developed for La3−xTe4. For comparison, results from the study on La3−xYbxTe4 are overlayed and also fit the model well.17 Deviation from the curve is likely due to the difficulty in measuring the carrier concentration.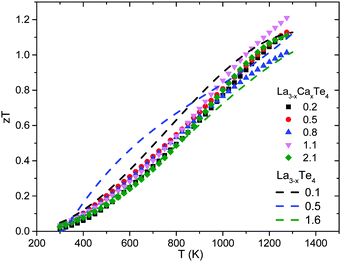 | ||
| Fig. 11 The thermoelectric figure of merit zT as a function of temperature for La3−xCaxTe4 as compared to La3−xTe4.7 | ||
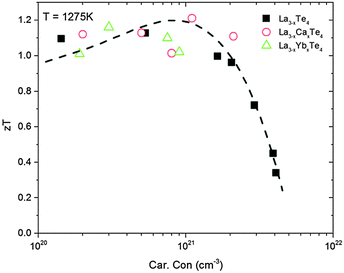 | ||
| Fig. 12 The thermoelectric figure of merit zT at 1275 K as a function of carrier concentration for La3−xCaxTe4 as compared to La3−xTe4 and La3−xYbxTe4.7,17 The results fit well to the multi-parabolic band model of La3−xTe4 (dashed line). | ||
Experimental
Materials and synthesis
Samples were prepared using mechanochemical synthesis from the elements first described elsewhere.7 Metallic lanthanum (Hefa Rare Earth 99.95%), calcium shot (Alfa Aesar 99.5%), and tellurium lump (Alfa Aesar 99.999+%) were sealed in a stainless steel ball mill vial with stainless steel balls (SPEX SamplePrep) in an argon glovebox. The materials were milled until they became a black fine homogeneous powder of the desired product. The powders were then compacted in graphite dies through spark plasma sintering (SPS) under vacuum at temperatures above 1200 °C and a pressure of 80 MPa yielding samples with >97% of theoretical density.X-ray diffraction
X-ray diffraction data were collected on a Phillips PANalytical X'Pert Pro diffractometer with Cu Kα radiation (λ1 = 1.540590 Å, λ2 = 1.544310 Å), equipped with an X'Celerator detector. Data were collected over a 2θ range of 20–100°, with a 0.008° step size and a time of 415 s per step. Sintered samples were ground and were mixed with a powdered silicon (Alfa Aesar, 325 mesh, 99.999%) to provide an internal standard for an accurate lattice parameter determination. Due to the pyrophoric nature of powdered La3Te4, all measurements were performed using a 7.5 μm thick Kapton film to seal the sample on a silicon zero background holder. Rietveld refinements were performed with the FullProf program.22 The cubic space group I![[4 with combining overline]](https://www.rsc.org/images/entities/char_0034_0305.gif) 3d and the structural data of Cox et al.14 were used as the initial structural model, and the input for the various solid solutions were altered accordingly. An experimental uncertainty for the obtained lattice parameter of 0.001 Å has been determined though the refinement of a LaB6 standard. A slightly larger uncertainty in the refined lattice parameter and occupancies can be expected in the sample with composition La2.225Ca0.775Te4, due to a smaller amount of sample in the beam. For a stable refinement of atomic occupancies, the Te occupancy was fixed to 100% as no Te vacancies are to be expected.
3d and the structural data of Cox et al.14 were used as the initial structural model, and the input for the various solid solutions were altered accordingly. An experimental uncertainty for the obtained lattice parameter of 0.001 Å has been determined though the refinement of a LaB6 standard. A slightly larger uncertainty in the refined lattice parameter and occupancies can be expected in the sample with composition La2.225Ca0.775Te4, due to a smaller amount of sample in the beam. For a stable refinement of atomic occupancies, the Te occupancy was fixed to 100% as no Te vacancies are to be expected.
Wavelength dispersive spectroscopy
A JEOL Super Probe electron microprobe analyzer and wave dispersive spectroscopy (WDS) was used to examine elemental compositions. The standards used were Te metal, LaPO4, and CaAl2Si2O8 (Anorthite), for the respective elements. For each sample, N ≥ 10 spots were analyzed and the results were averaged to determine the composition of the sample.Measurement of transport properties
The thermoelectric transport properties of the samples were measured using both custom setups and commercial instrumentation described elsewhere.23,24 A Netzsch LFA 457 was used to conduct laser flash thermal diffusivity measurements for determination of the thermal conductivity. The thermal conductivity is calculated through the relation κ = DTCpd where DT is the thermal diffusivity, Cp is the specific heat, and d is the density. DT is measured through laser flash thermal diffusivity and heat capacity is taken from previously published differential scanning calorimetry results which has been modified to add calcium content following the Dulong–Petit law.10 The density of the sample is corrected for the thermal expansion of the material as a function of temperature.Conclusions
The successful doping of La3−xTe4 with Ca2+ was achieved through mechanochemical synthesis and indicates that substitutions of Ca2+ for La3+ is possible for a wide range of carrier concentrations. The level of Ca2+ doping was controlled by stoichiometry and confirmed by a combination of powder X-ray diffraction, wave dispersive spectroscopy, and electronic measurements. General behavior of the material is similar to that of vacancy doped La3−xTe4 first described by May et al.13 A more comprehensive set of calcium-substituted samples, with and without lanthanum vacancies, offers a future opportunity to ascertain the role of vacancies versus dopants as a phonon scattering site.Improvement to zT was achieved through finer control of carrier concentration made possible by divalent cation substitution. The calcium atoms have little effect upon the band structure and drastic improvements to zT were not observed.
However, the high doping levels with calcium and its chemical difference to lanthanum suggest that La3−xTe4 is conducive to substitution with a wide range of cationic dopants. Furthermore, substitution of lanthanum with calcium or other cation dopants could be a promising avenue to reduce the cost of this material for commercial applications in light of increasing rare earth prices. The chemical flexibility of the structure suggests many possibilities for the improvement upon the already high zT of this high temperature thermoelectric material.
Acknowledgements
The authors would also like to thank Frank T. Kyte (Earth and Space Science Institute, UCLA) for his assistance in electron microprobe analysis. This work was performed at the Jet Propulsion Laboratory, California Institute of Technology under contract with the National Aeronautics and Space Administration. This work was supported by the NASA Science Missions Directorate's Radioisotope Power Systems Technology Advancement Program. Support was also provided in part by NSF IGERT: Materials Creation Training Program (MCTP) – DGE-0654431, the California NanoSystems Institute, EFRC Solid-State Solar-Thermal Energy Conversion Center (S3TEC) award number DE-SC0001299, the Summer Undergraduate Research Fellowship (SURF) through CalTech and JPL, and the UCLA MSD Scholars Program.Notes and references
- G. L. Bennett, in CRC Handbook of Thermoelectrics, ed. D. M. Rowe, 1995, pp. 515–537 Search PubMed.
- G. Schmidt, L. Dudzinski and T. Sutliff, in Radioisotopes - Applications in Physical Sciences, ed. N. Singh, InTech, Reston, Virigina, 2011, pp. 419–456 Search PubMed.
- J.-P. Fleurial, JOM, 2009, 61, 79–85 CrossRef CAS.
- J. Yang and T. Caillat, MRS Bull., 2006, 31, 224–229 CrossRef CAS.
- G. J. Snyder and E. S. Toberer, Nat. Mater., 2008, 7, 105–114 CrossRef CAS PubMed.
- S. Bux, J.-P. Fleurial, T. Caillat, B. Y. Li, K. Star, S. Firdosy, V. Ravi, C.-K. Huang, B. Cheng, P. Gogna, J. M. Ma, P. von Allmen and T. Vo, 11th Int. Energy Convers. Eng. Conf., 2013.
- A. May, J. Fleurial and G. Snyder, Phys. Rev. B: Condens. Matter Mater. Phys., 2008, 78, 1–12 CrossRef.
- A. May, J. Snyder and J. Fleurial, Sp. Technol. Appl. Int. Forum, 2008, 672–678 CAS.
- A. May, D. Singh and G. Snyder, Phys. Rev. B: Condens. Matter Mater. Phys., 2009, 79, 1–4 Search PubMed.
- O. Delaire, A. F. May, M. A. Mcguire, W. D. Porter, M. S. Lucas, M. B. Stone, D. L. Abernathy, V. A. Ravi, S. A. Firdosy and G. J. Snyder, Phys. Rev. B: Condens. Matter Mater. Phys., 2009, 80, 1–9 CrossRef.
- T. Vo, P. von Allmen, C.-K. Huang, J. Ma, S. Bux, J.-P. Fleurial, P. Von Allmen, C.-K. Huang, J. Ma, S. Bux, J.-P. Fleurial, T. Vo, P. Von Allmen, C.-K. Huang, J. Ma and S. Bux, J. Appl. Phys., 2014, 116, 133701–133706 CrossRef PubMed.
- A. F. May, J.-P. Fleurial and G. J. Snyder, Chem. Mater., 2010, 22, 2995–2999 CrossRef CAS.
- A. May, J.-P. Fleurial and G. Snyder, Phys. Rev. B: Condens. Matter Mater. Phys., 2008, 78, 1–12 CrossRef.
- W. L. L. Cox, H. Steinfink and W. F. F. Bradley, Inorg. Chem., 1966, 5, 318–319 CrossRef CAS.
- F. L. Carter, J. Solid State Chem., 1972, 5, 300–313 CrossRef CAS.
- R. D. Shannon, Acta Crystallogr., Sect. A: Cryst. Phys., Diffr., Theor. Gen. Crystallogr., 1976, 32, 751–767 CrossRef.
- A. F. May, J.-P. Fleurial and G. J. Snyder, Chem. Mater., 2010, 22, 2995–2999 CrossRef CAS.
- H. J. Goldsmid and J. W. Sharp, J. Electron. Mater., 1999, 28, 869–872 CrossRef CAS.
- H.-S. Kim, Z. M. Gibbs, Y. Tang, H. Wang and G. J. Snyder, APL Mater., 2015, 3, 041506 CrossRef PubMed.
- R. Viennois, K. Niedziolka and P. Jund, Phys. Rev. B: Condens. Matter Mater. Phys., 2013, 88, 174302 CrossRef.
- X. Shi, Y. Pei, G. J. Snyder and L. Chen, Energy Environ. Sci., 2011, 4, 4086 CAS.
- J. Rodrigues-Carvajal, Phys. B, 1993, 192, 55–69 CrossRef.
- K. A. Borup, E. S. Toberer, L. D. Zoltan, G. Nakatsukasa, M. Errico, J. P. Fleurial, B. B. Iversen and G. J. Snyder, Rev. Sci. Instrum., 2012, 83, 123902 CrossRef PubMed.
- C. Wood, D. Zoltan and G. Stapfer, Rev. Sci. Instrum., 1985, 56, 719–722 CrossRef CAS PubMed.
Footnote |
| † These authors contributed equally to this work. |
| This journal is © The Royal Society of Chemistry 2015 |

