Biologically synthesized silver nanoparticle-based colorimetric sensor for the selective detection of Zn2+

Muhammad Ihsan a, Abdul Niaz a, Abdur Rahim *b, Muhammad Iqbal Zaman a, Muhammad Balal Arain c, Sirajuddin d, Tehmina Sharif a and Memoona Najeeb a
aDepartment of Chemistry, University of Science & Technology, Bannu, 28100, KPK, Pakistan
bInterdisciplinary Research Centre in Biomedical Materials (IRCBM), COMSATS Institute of Information Technology, Lahore, Pakistan. E-mail: rahimkhan533@gmail.com
cAbdul Wali Khan University Mardan, 23200, KPK, Pakistan
dNational Center of Excellence in Analytical Chemistry, University of Sindh, 76080, Jamshoro, Pakistan

Received 23rd August 2015 , Accepted 20th October 2015

First published on 20th October 2015


Abstract

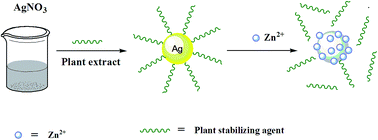
A simple, selective and cost effective colorimetric sensor has been investigated for the detection of Zn2+ using biologically synthesized silver nanoparticles (AgNPs). The AgNPs were prepared from the leaf extract of Amomum subulatum via two different procedures i.e., at room temperature and by a heat treatment procedure. The AgNPs prepared through the heat treatment procedure exhibited efficient results. The as synthesized AgNPs were studied by simple UV-vis spectroscopy which showed an intense absorption band at 425 nm which was further confirmed by FT-IR and SEM analysis. The synthesized AgNPs exhibited a good colorimetric sensing property towards Zn2+ by changing the color of the solution from yellowish-brown to colorless accompanying a decrease in absorption intensity. The proposed detection mechanism of the sensor has been discussed. The sensor showed an excellent linear response towards Zn2+ in the concentration range from 1 × 10⁻⁵ to 8 × 10⁻⁵ M with a correlation coefficient (R2) of 0.996. The detection limit of the method was found to be 3.5 × 10⁻⁶ M. There was no interference effect observed for Zn2+ detection in the presence of other heavy metal ions. The proposed sensor was successfully applied for the detection of Zn2+ in drinking water samples.


Introduction

Noble metal nanoparticles have received great interest among the scientific community due to their characteristic catalytic, electronic and optical properties. Various physical, chemical and biological methods have been proposed for the synthesis of metal nanoparticles.

The most accepted methods for the synthesis of metal nanoparticles are the chemical methods which use various inorganic and organic reducing agents.1–4

Among the other noble metal nanoparticles, silver nanoparticles have gained much importance and are a focus area of research nowadays, because synthesis of silver nanoparticles is eco-friendly and cost effective. Several researchers have reported the synthesis of silver nanoparticles from environmentally benign materials using various plant extracts.5–12

Plant extracts synthesis of silver nanoparticles is gaining significance due to its simplicity and eco-friendliness, as these methods do not use toxic chemicals for the synthesis protocol. The presence of various natural products in plants such as proteins, carbohydrates, steroids, alkaloids containing different functionalities i.e., –COOH, –NH2, –CONH2, and –OH could have the ability to reduce and stabilize AgNPs giving considerable simplicity to the systems.

Green methods for the synthesis of silver nanoparticles using extracts of different plants such as, Trianthema decandra root extract,5 curry leaf extract,6 tea leaf extract,7Baliospermum montanum leaf extract,8 neem leaf extract,9Musa sapientum leaf extract10 and mulberry leaf extract11 have been reported by various researchers. However, most of these plants based nanoparticles required long synthesis time and have poor Surface Plasmon Resonance (SPR) band. Therefore, it is necessary to adopt a fast method for the synthesis of plant based nanoparticles with efficient SPR band so that to compete chemical based methods of nanoparticles.

Zinc is thought to be an important constituent in biological systems and industrial processes. In trace level zinc maintains the normal physiological functions12–16 and plays a vital role in many enzymatic activities as it is an essential constituent of many enzymes and proteins in plant and animals.17–19 Zinc and its associated compounds is the important constituent of many industrial processes. Thus due to its tremendous uses, Zn and its associated compounds finds their ways to enter and accumulate in natural ecosystem and may cause serious water pollution problems. Owing to its high level than required it can pose serious health problems.20 Toxic effects may include fever, gastroenteritis, zinc chills, pulmonary manifestations, an increase in oxidative stress and weight loss.21,22

Due to its health concern, it becomes utmost important to determine zinc at a trace level in a aqueous system. Various analytical methods such as potentiometry,23 fluorescence methods,24,25 inductively coupled plasma atomic emission spectrometry (ICP-AES)26 and flame atomic absorption spectrometry27,28 have been implied in the literature for the determination of Zn2+ in various environmental samples. However, these techniques require some complicated sample pretreatment procedures, generally expensive instrumentation and long measuring time. Due to the unique optical properties of Au and Ag nanoparticles, sensitive, low cost and rapid colorimetric sensors have been developed for the detection of various organic molecules and heavy metal ions in biological and environmental samples.29–37 These sensors provide an important method of detection and allowing direct analysis simply by the naked eye show. The show is performed with UV-visible spectrophotometer instead of using complicated and expensive instrumentation.

All of the above mentioned approaches for the colorimetric detection of heavy metal ions rely on the use of costly and toxic organic substances for the synthesis of silver nanoparticles.

Recently some green synthesized silver nanoparticles using plant extracts have been employed as colorimetric sensors for the detection of heavy metal ions.38–41 The various plants extracts which contain the secret bio-organic molecules having different functionalities on the surface of AgNPs may have the abilities to interact specifically with particular metal ions and thus cause aggregation of nanoparticles.

However, among the above mentioned reports, the green synthesized AgNPs based sensors for the colorimetric detection of Zn2+ lack sufficient sensitivity and selectivity because other kinds of heavy metal ions such as Cu2+, Hg2+, Co3+, Ni2+ can readily interact with AgNPs to cause aggregation.40,41

Thus, a sensitive and selective method for the detection of Zn2+ using green approach has become attractive and highly needed without using costly chemicals and instrumentation which becomes particularly important for under developed areas.

There has been no report available so far related to employ leaf extract of Amomum subulatum for the synthesis of silver nanoparticles and their applications as colorimetric sensor for Zn2+. Amomum subulatum (black or greater cardamoms or Elaichi Kalan) is used locally as food spice and has also numerous medicinal applications.42,43 Literature study revealed that this plant contains very high contents of polyphenolic compounds,44,45 which could have the ability to reduce and stabilize nanoparticles. Moreover, the presence of polyphenolic moieties on the surface of AgNPs may have the potential to interact with Zn2+ ions.46,47 Based on this assumption, the extract of Amomum subulatum was used for the synthesis of silver nanoparticles and the synthesized AgNPs were applied for the detection of Zn2+. Therefore, the basic theme of the current research work was;

(i) To investigate rapid method for the synthesis of AgNPs using leaf extract of Amomum subulatum and (ii) to investigate the applications of the synthesized AgNPs as colorimetric sensors for the detection of Zn2+.

Experimental

Materials and chemicals

Dry leaves of Amomum subulatum were purchased from the market and were used to make aqueous extract. All chemicals used in this work were of high pure analytical grade. Silver nitrate (AgNO3, 99.8%) and ZnSO4·7H2O were purchased from Sigma Aldrich (Germany). All different metal salts, in the form of chloride or nitrate were obtained from Sigma Aldrich or Merck chemical companies and used as received without further purification. The stock solutions of each metal ion were prepared by dissolving a known amount in deionized water. All the glassware was thoroughly washed with aqua regia and then with deionized water.

Instrumentation

Optical absorbance of the synthesized AgNPs were recorded using double beam UV-vis spectrophotometer 1800 (Shimadzu, Japan) with 1 cm quartz cell. Scanning electron micrographs (SEM) was recorded by JSM-5910, JEOL, Japan operating at 20 kV.

Preparation of the extract

5 g dry leaves of Amomum subulatum were washed thoroughly with deionized water, cut into small pieces and then transferred into 250 ml conical flask containing 100 ml deionized water. Then the extract was prepared by boiling the leaves for 10 min on hot plate. The yellow color extract thus obtained was filtered through Whatman filter paper. The extract was stored and was used for the synthesis of AgNPs.

Procedure for the synthesis of silver nanoparticles

Synthesis at room temperature. In this procedure 4 ml extract was added into 25 ml of 1 mM silver nitrate solution at pH 8 and was allowed to react for 24 h at room temperature. The color of the solution became changed from watery to yellowish-brown after 24 h. The prepared nanoparticles solution was stored at room temperature for further study.
Synthesis of AgNPs by heating. Similarly, 25 ml aqueous silver nitrate solution (1 mM) was equilibrated at pH 8 and was placed on the hot plate. When the solution started boiling, 4 ml extract was added by drop wise manner under stirring (600 rpm) and left to stand for about 10 minutes for the complete reduction of Ag+ which was indicated by dark yellowish-brown color. The obtained AgNPs were stable even after six months.

Procedure for the colorimetric detection of Zn2+

Due to high absorption intensity of the as prepared AgNPs solution, 250 μl of the freshly prepared AgNPs was diluted up to 4 ml with deionized water and was used as blank solution. For the colorimetric detection of Zn2+, appropriate amount of Zn2+ solution was added into diluted solution of green synthesized AgNPs (final volume 4 ml). For interference study, 150 μl of the as prepared AgNPs solution was diluted up to 4 ml with deionized water containing 1 × 10⁻⁴ M of each metal ion and the concentrations of Zn2+ was 5 × 10⁻⁵ M. The solution was checked for the color change and after completion of the reaction; the absorption spectra of the solution were recorded using cells with 1 cm path length. In addition, the detection of Zn2+ was performed by three separately prepared AgNPs using the same experimental conditions, which demonstrated the RSD of 5.2%.

Applications of the sensor

Drinking water sample was used as such without filtration process. 250 μl of the freshly prepared AgNPs solution was diluted up to 4 ml with drinking water containing different concentrations of standard Zn2+ solutions. The solutions were then analyzed by UV-vis spectroscopy using standard addition method.

Results and discussion

Synthesis and characterization of AgNPs

In the present work AgNPs were synthesized using leaf extract by two different procedures as described in experimental section. The as synthesized nanoparticles were studied using simple UV-vis spectroscopy. Fig. 1 shows the absorption spectra of the synthesized AgNPs along with the absorption spectrum of pure plant extract. The absorption spectrum of the pure extract was recorded in order to study the interaction and reduction of Ag+ ions by the extract. As shown in Fig. 1, the narrow peak at about 280 nm obtained from the plant extract is mainly attributed to the UV absorption of polyphenols.43 This showed that the extract of plant leaf contained polyphenolic compounds that may be responsible for the synthesis of AgNPs as reducing and stabilizing agent. When the AgNPs were prepared at room temperature and their absorption spectrum was recorded after 24 h, as illustrated in Fig. 1 by dotted line, a relatively broad UV absorption band at about 451 nm was obtained, which is the characteristic band of silver nanoparticles (now a well-established phenomenon) due to Surface Plasmon Resonance (SPR). This demonstrated that the plant material has the potential to reduce and stabilize Ag+ which led to the formation of AgNPs. Similarly, on the appearance of SPR band, its 280 nm peak related to the extract became decreased. This indicated that the optical transition responsible for this peak is affected upon the interaction of plant material with Ag+ ions present in the solution. However, still the presence of this peak, although not as strong as in the absence of AgNPs, revealed that practically all the added plant material is not capable of completely reducing and stabilizing the Ag+ ions at room temperature even after 24 h. In order to minimize the synthesis time and to speed up the reduction process, heating procedure was performed for the preparation of AgNPs. This procedure is mainly employed in the chemical reduction method for the synthesis of nanoparticle. When UV spectrum was recorded for the AgNPs prepared by heating the reaction mixture i.e., by the drop wise addition of the extract to the hot boiling silver nitrate solution under vigorous magnetic stirring, a relatively higher and intense SPR band at 425 nm was achieved, as shown by solid line in Fig. 1. On the other hand its 280 nm peak almost disappeared which confirmed that there has been no more free plant material remained in the nanoparticles solution suggesting that all of the added extract have been completely utilized for the reduction of Ag+ ions. The blue shift and narrow curve at 425 nm is a criterion that the nanoparticles could be of small size with mono dispersed in nature. This intense absorption peak and the minimum time required for AgNPs prepared by heating procedure could be meaningful for sensitive metal ions detection applications as compared to the conventional room temperature preparation procedure. Therefore, this procedure was further employed for the synthesis of AgNPs. For the efficient preparation of nanoparticles, other parameters such as heating time, pH effect and amount of extract were thoroughly evaluated.
image file: c5ra17055a-f1.tif
Fig. 1 UV-vis absorption spectra of green synthesized AgNPs; prepared by heating the reaction mixture (solid line), at room temperature (dotted line) and UV spectrum of plant extract only (dash dotted line).

Effect of heating time

Synthesis of AgNPs was carried out at different heating times. From the UV-visible spectral analysis it was observed that the absorption intensity of the nanoparticles increased gradually at 425 nm with the increase of heating time and eventually reached to a maximum position at 10 minutes of heating time which could be due the increased concentration of nanoparticles in the solution. Thereafter, the intensity slowly decreased by further increasing the heating time which showed that 10 min was the optimal time for particle preparation, as shown in Fig. S1.

pH effect

Synthesis of AgNPs was carried out at different pH values and from the UV study it is evident that at pH 8, maximum absorption intensity with a peak shift to smaller wavelength was observed as compared to others pH values, as can be seen from Fig. S2. Therefore, pH 8 was selected for subsequent synthesis of AgNPs.

Effect of the amount of plant extract

Various amount of plant extract was evaluated for the synthesis of AgNPs in order to obtain efficient SPR band. UV-visible study revealed that SPR band gradually increased with the increase of amount of plant extract ranging from 1.5 to 4 ml which may be due to increase concentrations of AgNPs due to more reduction of Ag+ ions in the solution and then the SPR band decreased by further increasing the amount from 4 to 5 ml, as depicted in Fig. S3. Similarly a blue shift from 435 to 425 nm was observed when the amount was increased from 1.5 to 4 ml and then a red shift from 425 to 450 nm was observed by further increasing the amount. This showed that the amount lower or equal to 4 ml completely reduced and covered the Ag+ surfaces which resulted into an increase in SPR intensity with a shift to shorter wavelength, while amount higher than 4 ml may lead to secondary layer formation which dampens the electronic density of the thin layer of the silver nanoparticles, as a result into a decrease in SPR intensity and a shift to longer wavelength was observed. Thus, 4 ml extract was used as stabilizing agent for further study.

SEM analysis

Under the optimal experimental conditions, scanning electron microscopy (SEM) was performed to characterize the morphology of the synthesized silver nanoparticles. SEM image of the prepared nanoparticles showed that biologically synthesized silver nanoparticles were almost mono dispersed and approximately of the sizes from 20–50 nm ranges, as shown in Fig. 2.
image file: c5ra17055a-f2.tif
Fig. 2 SEM image of the green synthesized silver nanoparticles prepared by heating procedure.

FT-IR analysis

FT-IR analysis was carried out to confirm the presence of phenolic compounds in the extract, possible interaction between biomolecules and silver ions for the synthesis of nanoparticles and to investigate the colorimetric detection mechanism for Zn2+. The IR spectra of the pure extract, AgNPs and AgNPs in the presence of Zn2+ are shown in Fig. 3. The broad band centered at 3304 cm−1 of the pure leaf extract is the characteristic of O–H stretching mode for the OH group and the medium band observed at 1587 cm−1 correspond to the ring stretching mode of C[double bond, length as m-dash]C. The peak at 1382 cm−1 may be ascribed to the C–O–H bending vibration of phenolic group. The relatively strong peak at 1041 cm−1 could be assigned to the C–O stretching vibration of OH group, which reveals the presence of phenolic compounds in the extract. In the case of nanoparticles, a large decreased in the absorption intensity with a prominent shift of absorption peaks was observed from 3304 to 3299 cm−1, 1587 to 1560 cm−1, 1382 to 1370 cm−1 and 1041 to 1026 cm−1, suggesting that free OH groups of the compounds in the extract have interacted with silver ions. The IR spectrum of the AgNPs in the presence of Zn2+ showed again a large increase in the absorption intensity of the OH group at 3302 cm−1, which supports the idea that OH group in the compounds have been free from the surface of AgNPs. The corresponding peaks visible at 1631, 1311 and 1013 cm−1 may be due to some structural changes in the compounds during synthesis of silver nanoparticles.
image file: c5ra17055a-f3.tif
Fig. 3 FT-IR spectra of the pure plant extract, green synthesized silver nanoparticles (AgNPs) and AgNPs in presence of Zn2+.

Effect of pH and time on the stability of the synthesized AgNPs

The effect of pH on the stability of biosynthesized AgNPs was evaluated on the basis of changes in the surface plasmon absorption peak. The effect of pH was studied in the range from 2–12 as shown in Fig. S4. The original pH of the freshly prepared AgNPs (1 ml diluted up to 10 ml water) was 5 which was increased by sodium hydroxide (0.1 M) and decreased by hydrochloric acid (0.1 M). As can be seen from the Fig. S4 that there were no appreciable changes in the absorption intensities and peak shifts observed when the pH of the AgNPs solution was increased from 5–10. Similarly when the pH was decreased from 5–2, the effect was observed to be the same. A large increase in the SPR intensity with a significant blue shift from 425 to 415 nm and with a perfect yellow color change was observed when pH of the AgNPs was increased to 11. Similarly by further increasing the solution pH to 12, the SPR intensity again decreased. This may be ascribed to the silver hydroxide formation. The maximum absorption intensity with a pronounce blue shift at pH 11 indicates that the AgNPs are highly stable at this pH value as compared to the others pH. This may be mainly attributed to the presence of hydroxyl (–OH) group in the phenolic molecules on the surfaces of AgNPs. This group completely dissociates at this pH with the formation of (–O) ions leaving the negative surface charge on the AgNPs which induces more repulsive interaction among nanoparticles.34 As a result of this repulsive interaction, the dispersion of nanoparticles in the solution increased and thus led to a significant increase in the SPR band and blue shift. This dispersion at pH 11 imparts great stability to the AgNPs. Similar results were observed by others researchers.34

Further the effect of time on the stability of AgNPs was evaluated based on the UV absorption intensity changes and shift of peak positions. As can be seen from the UV absorption curves in Fig. S5, there were no significant decrease in absorption intensities and peak shifts even for 6 and 9 months, thus showing the long term stability of the synthesized AgNPs.

Colorimetric detection of Zn2+

It is well known fact that AgNPs prepared from plant materials exhibits a yellowish-brown color with UV absorption band at around 400 nm called SPR which is due to combined oscillations of the electronic cloud at surface of metal nanoparticles. Upon the addition of Zn2+ (1 × 10⁻⁴ M) to the diluted solution of green synthesized AgNPs caused the visual color of the solution to change from yellowish-brown to colorless and similarly the SPR band completely decreased, as shown by curve (B) in Fig. 4 (inset, the photographic image of the corresponding color change). Similar results were obtained by others researchers for the interaction of Zn2+ with green synthesized AgNPs.40,41
image file: c5ra17055a-f4.tif
Fig. 4 UV-vis spectra of (A) green synthesized AgNPs and (B) AgNPs in the presence of 1 × 10⁻⁴ M Zn2+ with a corresponding color change (photo image in inset, taken after 6 h).

This preliminary study revealed that the green synthesized AgNPs could be applied for the colorimetric detection of Zn2+. Based on the previous reports and current study, the possible colorimetric detection mechanism of the sensor was proposed which could be due to the strong binding (adsorption) of Zn2+ on the surface of silver nanoparticles and moving the plant stabilizing agent away from the surface of nanoparticles,39,40 as illustrated in Fig. 5. This led to a decrease in intensity at 425 nm accompanied with a slight red shift of SPR peak of the AgNPs. In addition, again the appearance of peak (curve, B) at about 300 nm, corresponding to the pure plant extract, further support the idea that the strongly bonded Zn2+ ions moved away the stabilizing agent (plant material) from the surface of AgNPs. However, a small shift of peak position from 280 to 300 nm may be ascribed to some structural changes in the compounds of plant extract that may occur during synthesis of AgNPs.


image file: c5ra17055a-f5.tif
Fig. 5 Proposed mechanisms for the colorimetric detection of Zn2+.

Furthermore, the reaction time between biologically synthesized nanoparticles and Zn2+ was evaluated by UV absorption study. The addition of 1 × 10⁻⁴ M Zn2+ to the AgNPs solution caused the SPR intensity to decrease gradually with time and eventually became completely vanished off at 6 h, which remained almost stable by further increasing the reaction time, as shown in Fig. S6. The relatively long reaction time indicated that Zn2+ ions were unable to quickly move the strongly held plant stabilizing agent away from the AgNPs surface which ultimately completed at 6 h. Therefore, the detection study was performed after 6 h.

Sensitivity and selectivity of the sensor

The sensitivity of AgNPs for the colorimetric detection of Zn2+ was evaluated by calibration curves using different concentration of Zn2+. As it can be seen from Fig. 6(b), that the absorption intensity linearly decreased with the increase of Zn2+ concentration in the range from 1 × 10⁻⁵ to 8 × 10⁻⁵ M. When the calibration curves were plotted between different concentrations and ΔA (AAgNPsAAgNPs+Zn2+), a linear correlation coefficient (R2) of 0.996 with a linear regression equation of y = 0.0667x − 0.057 was obtained, as shown in Fig. 6(c). This demonstrated a good linear relationship between concentration and change in absorbance (ΔA). The detection limit of the method was found to be 3.5 × 10⁻⁶ M based on (3σ/S).
image file: c5ra17055a-f6.tif
Fig. 6 (A) Photograph showing the color variations of the AgNPs solution with different concentrations of Zn2+ (B) corresponding UV-vis absorption response of silver nanoparticles solution (12 times dilution) with various concentrations of Zn2+ (1–10 × 10−5 M) and (C) calibration plot of change of absorbance at 425 nm with various concentrations of Zn2+ in the range from 1 × 10⁻⁵ to 8 × 10⁻⁵ M.

The selectivity of the biologically synthesized sensor for Zn2+ was examined by using commonly interfering metal ions such as Ni2+, Fe2+, Fe3+, Mn2+, Hg2+, Cr3+, Cu2+, Co2+ and Pb2+ each with concentration of 1 × 10⁻⁴ M and the concentration of Zn2+ was 5 × 10⁻⁵ M. From the UV-vis absorption study, as it can be seen from Fig. 7 that neither of the heavy metal ion was found to induce any significance decrease in the SPR intensity as well as change in color of AgNPs solution except Zn2+. This clarified that there was no noticeable interference effect produced by all heavy metal ion studied for the detection of Zn2+. Thus, the as prepared AgNPs using leaf extract of Amomum subulatum exhibited excellent selectivity over the previously reported green synthesized AgNPs for the detection of Zn2+.40,41 This selectively could be advantageous for Zn2+ detection in the presence of others metal ions in real samples.


image file: c5ra17055a-f7.tif
Fig. 7 (A) Photo images showing the colorimetric response of AgNPs solution in the presence of various metal ions. (B) Corresponding UV-vis absorption spectra of green synthesized AgNPs (22 times diluted) in the presence of 1 × 10⁻⁴ M different metal ions compared with that in the presence of 5 × 10⁻⁵ M Zn2+.

Determination of Zn2+ in drinking water

In order to investigate the practical applicability of the proposed colorimetric method, the detection of Zn2+ was evaluated in drinking water samples. However, we could not detect Zn2+ which may be due to its very low concentration in the drinking water which may be less than the detection limit given by our proposed method.

Therefore, a recovery test method was performed for the determination of Zn2+ in drinking water samples using the proposed method. When three different concentrations level of Zn2+ were spiked and then analyzed using standard addition method, a recovery of Zn2+ ranged from 95% to 104% with the relative standard deviation (R.S.D) for each measurement below 5% was obtained. These results were listed in Table 1. Moreover, the addition of Zn2+ in drinking water also decolorized the yellowish-brown color of the biologically prepared AgNPs. This result demonstrated that the proposed colorimetric method using green synthesized AgNPs was precise and accurate and thus could be applicable to detect Zn2+ in water samples.

Table 1 Determination of Zn2+ in drinking water samples using green synthesized AgNPsa
Sample Detected amount (10−5 M) Added amount (10−5 M) Found amount (10−5 M) R.S.D (%, n = 3) Recovery (%, n = 3)
a [thin space (1/6-em)]Not detectable.
1 2.5 2.40 1.60 96
2 5 4.75 4.20 95
3 7 7.32 3.85 104


Conclusions

In this work, a simple, selective, sensitive, low cost and portable colorimetric method was developed for the detection of Zn2+ based on the biologically synthesized AgNPs. Leaf extract of Amomum subulatum was used to synthesize AgNPs by two different experimental procedures such as at room temperature and by heat treatment. The AgNPs prepared by heating procedure was found to be meaningful for sensitive detection because of giving efficient UV absorption band and minimum time required for the complete reduction of Ag+ ions. The prepared AgNPs showed great stability at pH 11 as compared to the other pH values and similarly showed long term stability against aggregation which could be useful for biological applications. The AgNPs have showed good colorimetric sensing property towards Zn2+ and could be monitored by naked eye assay or with a simple UV-vis spectrophotometer. There has been no interference effect found for Zn2+ detection in the presence of others environmentally important heavy metal ions. The proposed sensor could be successfully applied for the detection of Zn2+ in real water samples. This plant based colorimetric sensor was found to be selective than the previously reported plant based sensors for Zn2+ detection. Thus, the green synthesized AgNPs can be easily implemented for the detection of Zn2+ with no use of costly chemicals and instrumentation which becomes particularly important for under developed areas. Moreover the synthesized AgNPs could be effective for the removal of Zn2+ from the contaminated water.

References

  1. D.-G. Yu, Colloids Surf., B, 2007, 59, 171–178 CrossRef CAS PubMed.
  2. Y. Tan, Y. Wang, L. Jiang and D. Zhu, J. Colloid Interface Sci., 2002, 249, 336–345 CrossRef CAS PubMed.
  3. C. Petit, P. Lixon and M. P. Pileni, J. Phys. Chem., 1993, 97, 12974–12983 CrossRef CAS.
  4. S. A. Vorobyova, A. I. Lesnikovich and N. S. Sobal, Colloids Surf., A, 1999, 152, 375–379 CrossRef CAS.
  5. R. Geethalakshmi and D. Sarada, Int. J. Eng. Sci. Res. Technol., 2010, 2, 970–975 Search PubMed.
  6. L. Christensen, S. Vivekanandhan, M. Misra and A. K. Mohanty, Adv. Mater. Lett., 2011, 2, 429–434 CrossRef CAS PubMed.
  7. Y. Y. Loo, B. W. Chieng, M. Nishibuchi and S. Radu, Int. J. Nanomed., 2012, 7, 4263 CAS.
  8. K. Renugadevi, V. Aswini and P. Raji, Asian J. Pharm. Clin. Res., 2012, 5, 283–287 CAS.
  9. A. J. Gavhane, P. Padmanabhan, S. P. Kamble and S. N. Jangle, Int. J. Pharma Bio Sci., 2012, 33(3), 88–100 Search PubMed.
  10. K. K. B. Dineshkumar, D. Paul, J. Cherian, A. R. Bhatt, U. N. Tamilselvan, K. Balakumar and R. Hariprasad, Nanosci. Nanotechnol., 2012, 2, 22–24 Search PubMed.
  11. A. M. Awwad and N. M. Salem, Nanosci. Nanotechnol., 2012, 2, 125–128 CrossRef CAS PubMed.
  12. F. Shakerian, S. Dadfarnia and A. M. H. Shabani, Food Chem., 2012, 134, 488–493 CrossRef CAS PubMed.
  13. T. Hou and X. Zhu, J. Mol. Liq., 2012, 166, 17–21 CrossRef CAS PubMed.
  14. E. M. Nolan and S. J. Lippard, Acc. Chem. Res., 2008, 42, 193–203 CrossRef PubMed.
  15. S. Frassinetti, G. L. Bronzetti, L. Caltavuturo, M. Cini and C. Della Croce, J. Environ. Pathol., Toxicol. Oncol., 2006, 25, 597–610 CrossRef CAS.
  16. E. S. Nielsen and S. Wium-Andersen, Mar. Biol., 1970, 6, 93–97 CrossRef.
  17. J. M. Berg and Y. Shi, Science, 1996, 271, 1081–1085 CAS.
  18. M. M. Parker, F. L. Humoller and D. J. Mahler, Clin. Chem., 1967, 13, 40–48 CAS.
  19. B. L. Vallee and K. H. Falchuk, Physiol. Rev., 1993, 73, 79–118 CAS.
  20. G. J. Fosmire, Am. J. Clin. Nutr., 1990, 51, 225–227 CAS.
  21. J. Wang, X. Ma, G. Fang, M. Pan, X. Ye and S. Wang, J. Hazard. Mater., 2011, 186, 1985–1992 CrossRef CAS PubMed.
  22. N. Kolachi, T. Kazi, S. Khan, S. Wadhwa, J. Baig, H. Afridi, A. Shah and F. Shah, Food Chem. Toxicol., 2011, 49, 2548–2556 CrossRef CAS PubMed.
  23. M. A. Abbasi, Z. H. Ibupoto, M. Hussain, Y. Khan, A. Khan, O. Nur and M. Willander, Sensors, 2012, 12, 15424–15437 CrossRef CAS PubMed.
  24. M. Hosseini, Z. Vaezi, M. R. Ganjali, F. Faridbod, S. D. Abkenar, K. Alizadeh and M. Salavati-Niasari, Spectrochim. Acta, Part A, 2010, 75, 978–982 CrossRef PubMed.
  25. Q.-J. Ma, X.-B. Zhang, Y. Zhao, C.-Y. Li, Z.-X. Han, G.-L. Shen and R.-Q. Yu, Spectrochim. Acta, Part A, 2009, 71, 1683–1687 CrossRef PubMed.
  26. P. Wilhartitz, S. Dreer, R. Krismer and O. Bobleter, Microchim. Acta, 1997, 125, 45–52 CrossRef CAS.
  27. Q. Li, X. Zhao, Q. Lv and G. Liu, Sep. Purif. Technol., 2007, 55, 76–81 CrossRef CAS PubMed.
  28. M. Sayed Zia, Am. J. Anal. Chem., 2012, 2012, 371–377 Search PubMed.
  29. Y. Zhou, H. Zhao, Y. He, N. Ding and Q. Cao, Colloids Surf., A, 2011, 391, 179–183 CrossRef CAS PubMed.
  30. A. Ravindran, M. Elavarasi, T. Prathna, A. M. Raichur, N. Chandrasekaran and A. Mukherjee, Sens. Actuators, B, 2012, 166, 365–371 CrossRef PubMed.
  31. Y. Zhou, H. Zhao, C. Li, P. He, W. Peng, L. Yuan, L. Zeng and Y. He, Talanta, 2012, 97, 331–335 CrossRef CAS PubMed.
  32. G.-L. Wang, X.-Y. Zhu, H.-J. Jiao, Y.-M. Dong and Z.-J. Li, Biosens. Bioelectron., 2012, 31, 337–342 CrossRef CAS PubMed.
  33. T. Sharif, A. Niaz, M. Najeeb, M. I. Zaman and M. Ihsan, Sens. Actuators, B, 2015, 216, 402–408 CrossRef CAS PubMed.
  34. M. Annadhasan, T. Muthukumarasamyvel, V. Sankar Babu and N. Rajendiran, ACS Sustainable Chem. Eng., 2014, 2, 887–896 CrossRef CAS.
  35. Y. Leng, K. Xie, L. Ye, G. Li, Z. Lu and J. He, Talanta, 2015, 139, 89–95 CrossRef CAS PubMed.
  36. Y. Leng, Y. Li, A. Gong, Z. Shen, L. Chen and A. Wu, Langmuir, 2013, 29, 7591–7599 CrossRef CAS PubMed.
  37. Y. Leng, F. Zhang, Y. Zhang, X. Fu, Y. Weng, L. Chen and A. Wu, Talanta, 2012, 94, 271–277 CrossRef CAS PubMed.
  38. C. K. Balavigneswaran, T. Sujin Jeba Kumar, R. Moses Packiaraj and S. Prakash, Appl. Nanosci., 2014, 4, 367–378 CrossRef CAS.
  39. K. Farhadi, M. Forough, R. Molaei, S. Hajizadeh and A. Rafipour, Sens. Actuators, B, 2012, 161, 880–885 CrossRef CAS PubMed.
  40. M. Bindhu and M. Umadevi, Spectrochim. Acta, Part A, 2014, 121, 596–604 CrossRef CAS PubMed.
  41. S. PhilipáAnthony, RSC Adv., 2013, 3, 16765–16774 RSC.
  42. V. Bisht, J. Negi, A. Bhandari and R. Sundriyal, Afr. J. Agric. Res., 2011, 6, 5386–5390 CrossRef.
  43. G. Kumar, B. Chauhan and M. Ali, Int. Res. J. Pharm., 2012, 3, 96–99 CAS.
  44. K. D. Prakash, K. Brajesh, H. Arshad, V. Shikhar and M. Mala, Int. J. Drug Dev. Res., 2012, 4, 175–179 Search PubMed.
  45. B. Shan, Y. Z. Cai, M. Sun and H. Corke, J. Agric. Food Chem., 2005, 53, 7749–7759 CrossRef CAS PubMed.
  46. G. Le Nest, O. Caille, M. Woudstra, S. Roche, F. Guerlesquin and D. Lexa, Inorg. Chim. Acta, 2004, 357, 775–784 CrossRef CAS PubMed.
  47. G. Le Nest, O. Caille, M. Woudstra, S. Roche, B. Burlat, V. Belle, B. Guigliarelli and D. Lexa, Inorg. Chim. Acta, 2004, 357, 2027–2037 CrossRef CAS PubMed.

Footnote

Electronic supplementary information (ESI) available. See DOI: 10.1039/c5ra17055a

This journal is © The Royal Society of Chemistry 2015