A luminescent europium MOF containing Lewis basic pyridyl site for highly selective sensing of o-, m- and p-nitrophenol†
Yan-Qin Wanga,
Qing-Hua Tana,
Hou-Ting Liuab,
Wei -Suna and
Zhi-Liang Liu*a
aCollege of Chemistry and Chemical Engineering, Key Laboratory of Nanomagnetic and Functional Materials, Inner Mongolia University, Huhhot, 010021, China. E-mail: yqwang_chem@imu.edu.cn; cezlliu@imu.edu.cn; Fax: +86-471-4992147; Tel: +86-471-4995414
bShandong Provincial Key Laboratory of Chemical Energy Storage and Cell Technology, School of Chemistry and Chemical Engineering, Liaocheng University, Liaocheng 252059, China. E-mail: liuhouting@lcu.edu.cn
First published on 8th October 2015
Abstract
A new luminescent two-dimensional europium metal–organic framework [Eu6(L)3(HL)2(H2O)10]·10H2O·x(solvent) (1) has been successfully prepared by the solvothermal reaction of Eu(NO3)3·6H2O and the multidentate π-conjugated ligand H4L (H4L = (5,5′-(pyridine-2,5-diyl)-isophthalic acid)) which has a Lewis basic pyridyl site. The solid sample of 1 emits high bright red light which can be readily observed by the naked eyes when excited at 358 nm at ambient temperature. Interestingly, the luminescence of fine grinding 1 particles dispersed in ethanol can be sensitively and selectively quenched by adding trace amounts of o-, m- and p-nitrophenol (NP), which reveals that 1 can be used as a luminescence sensor for the detection of o-, m- and p-NP.
1 Introduction
Metal–organic frameworks (MOFs) have attracted great attention due to their structural diversity and potential applications in catalysis,1–5 gas storage and separation,6–8 drug delivery9,10 and chemical sensing.11–16 Among the diverse MOFs, microporous lanthanide metal–organic frameworks (LnMOFs) have evoked increasing interest due to their potential applications in fluorescence probes and luminescence bioassays.17–21 It is well known for their exceptional luminescent features of lanthanide ions, such as pure, sharp emission lines arising from characteristic 4f electronic transitions and large Stokes shift values.22–28 Additionally, the organic ligands often contain aromatic or conjugated π moieties that are subject to excitation, give rise to optical emission or photoluminescence upon irradiation. However, it is still challenging to get the desired microporous LnMOFs due to the high coordination number and flexible coordinating geometry of lanthanide ions.Considering the fact that nitroaromatic compounds are both environment pollutants and explosive threating to public security,29–31 their rapid and trace detection is crucial in homeland security, civilian safety, and environmental protection.32–34 Among the nitroaromatic compounds, nitrophenols which are widely used in the chemical industry for manufacturing, synthetic dyes, wood preservatives and pesticides, are common pollutants of wastewater and the environment and most of them have been included in the US Environmental Protection Agency (USEPA) list of priority pollutants.35,36 O-, m- and p-nitrophenol (NP) is one kind of the most bio-refractory, persistent, and highly toxic nitrophenols, their rapid and trace detection is crucial to environment protection and homeland security. However, comparatively less efforts have been paid to detect o-, m- and p-NP than other hazardous substances until now.37,38 Compared with other detection methods for environment pollutants, it has been proven to be very effective in detecting these nitroaromatics by fluorescence quenching methods employing applicable chemical sensors.39,40 Due to the electron deficient nature, nitroaromatic compounds often act as good fluorescence quenchers by the interaction with some electron donor polymers containing conjugated π moieties. Until now, microporous luminescence LnMOFs for sensing nitroaromatic compounds are relatively rarely reported,30,39,41–43 As far as know, reports about luminescent europium-based MOFs as sensor for rapid, sensitive and selective detecting trace amounts nitrophenols is still rare,30,41,43 while for the detection of isomers of mono-NP (o-, m- and p-NP) is unprecedented.
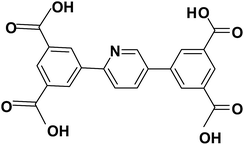
In this work, we select H4L (5,5′-(pyridine-2,5-diyl)-isophthalic acid) as the π conjugated ligands (Scheme 1) which is very rarely reported44,45 for the following considerations: (1) its extreme rigidity which is advantageous for the construction of porous structures, (2) its capacity to sensitize lanthanide-centered emission through the antenna effect; and (3) its conjugated π moieties and available Lewis-base sites may facilitate the sensing properties through different host–guest interactions. By reacting this ligand with Eu3+, we successfully got a new Eu3+–MOF-based sensor (1) that exhibits a combination of uncoordinated Lewis-base sites and terminally coordinated aqua ligands. The solid sample of 1 emits high bright red light which can be easily observed by the naked eye when excited at 358 nm at room temperature. Compound 1 exhibits high sensitivity and selectivity towards o-, m- and p-NP.
2 Experimental
2.1 General procedure
The reagents and the organic ligand H4L (5,5′-(pyridine-2,5-diyl)-isophthalic acid) were obtained from commercial sources and used without further purification.2.2 Synthesis of [Eu6(L)3(HL)2(H2O)10]·10H2O·x(solvent) (1)
Eu(NO3)3·6H2O (0.097 mmol, 0.043 g), (5,5′-(pyridine-2,5-diyl)-isophthalic acid) (0.041 g, 0.1 mmol) were dissolved in the mixture solvent of DEF/H2O (1 mL/7 mL) and transferred to a 23 mL Teflon-lined autoclave. After being stirred in air for 20 min, the mixture was heated to 150 °C at the speed of 37.5 °C h−1 and kept for 3 days. After cooling to room temperature at the speed of 5 °C h−1, colourless block crystals of 1 were collected in a 65% yield based on H4L. IR bands (cm−1): 1661 m, 1614 s, 1562 s, 1463 m, 1390 s, 1358 s, 1291 m, 853 m, 759 s, 713 s, 681 s, 504 m.2.3 Physical measurements
Fourier transform infrared (FTIR) spectra (KBr disk) were measured with a TENSOR 27 FT-IR spectrophotometer. Powder X-ray diffraction pattern (PXRD) was carried out on a EMPYREAN PANALYTICAL apparatus. The TG curve was recorded on a SDT Q600 Thermal analyzer which was performed under the N2 atmosphere and at a heating rate of 5 °C min−1 over the temperature range of 25–800 °C. The luminescence spectra for the powdered solid samples were measured at room temperature on a Hitachi F-7000 fluorescence spectrophotometer. PMT voltage = 700 V, the excitation slit and the emission slit were 2.5 nm. The UV-Vis absorption spectra were measured with an U-3900 spectrophotometer.2.4 Fluorescence measurements
The fluorescence properties of compound 1 was measured in solid state and in various analytes suspensions at room temperature. The suspensions of 1 were prepared by dispersing 3 mg of fully grinding sample 1 in 3 mL ethanol solution containing different analytes (nitrobenzene, phenol, resorcinol, p-nitrotoluene, m-dinitrobenzene, 3-aminophenol, 4-aminophenol, o-nitrophenol, m-nitrophenol and p-nitrophenol (0.1 mol L−1)) at room temperature under ultrasonication for 30 min and stirring for 3 h. For the fluorescence quenching titrations in dispersed medium, the fluorescence of compound 1 was measured by dispersing 3 mg of fully grinding sample 1 in 3 mL ethanol (for ethanol system) or water (for water system) at room temperature under ultrasonication for 30 min and stirring for 3 h and subsequently placed in a quartz cell of 1 cm width. All titrations was carried out by gradually adding ethanol or water solution of nitrophenol (o-, m-, p-) in an incremental fashion. Each titration was repeated several times to get concordant value. For all measurement, disperse solutions of 1 were excited at λex = 358 nm and their corresponding emission wavelength was monitored from 550 to 700 nm. There was no change in shape of the emission spectra by gradual addition of nitrophenol (o-, m-, p-) to disperse solution of 1 in ethanol or water, only quenching of the initial fluorescence emission intensity was observed.2.5 Crystal data collection and refinement
Diffraction intensity data were collected at 293 K on a Bruker APEX II diffractometer equipped with a CCD area detector and graphite-monochromated Cu Kα radiation (λ = 1.54184 Å). Empirical absorption corrections were applied using the SADABS program.46 The structures were solved by the direct method and refined by the full-matrix least-squares method on F2, with all non-hydrogen atoms refined with anisotropic thermal parameters.47 All the hydrogen atoms attached to carbon atoms were placed in calculated positions and refined using the riding model. The hydrogens attached to water molecules were located from the difference Fourier maps and refined isotropically. From the difference Fourier map of 1, a number of diffuse scattered peaks with electron density were observed, which can be attributed to the disordered solvent molecules. Attempts to model these peaks were unsuccessful because the residual electron density peaks obtained were diffused. So PLATON/SQUEEZE was used to refine the structure further. Crystallographic data for 1 have been deposited at the Cambridge Crystallographic Data Center with the deposition number of CCDC 1400052. Experimental details for the structure analysis of 1 are given in Table 1. The selected bond lengths and angles are given in Table S1.†| Compound | 1 |
|---|---|
| Formula | C105H87Eu6N5O60 |
| Mr | 3290.56 |
| Crystal system | Triclinic |
| Space group | P![[1 with combining macron]](https://www.rsc.org/images/entities/char_0031_0304.gif) |
| a, Å | 11.0089(9) |
| b, Å | 15.8110(11) |
| c, Å | 21.2396(17) |
| α, deg | 109.579(7) |
| β, deg | 92.652(7) |
| γ, deg | 105.907(7) |
| V, Å3 | 3310.7(4) |
| Z | 1 |
| Dc, g cm−3 | 1.650 |
| μ, mm−1 | 20.799 |
| Unique reflns/Rint | 11![[thin space (1/6-em)]](https://www.rsc.org/images/entities/char_2009.gif) 843/0.0872 843/0.0872 |
| R1 [I > 2σ(I)] | 0.0869 |
| wR2 (all data) | 0.2518 |
| GOF | 0.943 |
3 Results and discussion
3.1 Crystal structure
The solvothermal reaction of the organic ligands H4L with Eu(NO3)3·6H2O in a mixed solvent of N,N-diethylformamide (DEF) and H2O (1![[thin space (1/6-em)]](https://www.rsc.org/images/entities/char_2009.gif) :
:![[thin space (1/6-em)]](https://www.rsc.org/images/entities/char_2009.gif) 7, v/v) afforded colourless block crystals of [Eu6(L)3(HL)2(H2O)10]·10H2O·x(solvent) (1). Single-crystal X-ray diffraction revealed that compound 1 crystallizes in the space group P
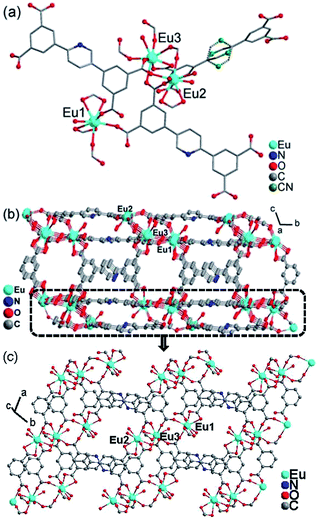
7, v/v) afforded colourless block crystals of [Eu6(L)3(HL)2(H2O)10]·10H2O·x(solvent) (1). Single-crystal X-ray diffraction revealed that compound 1 crystallizes in the space group P![[1 with combining macron]](https://www.rsc.org/images/entities/char_0031_0304.gif) . The asymmetric unit contains three crystallographically independent Eu3+ ions, one and a half completely deprotonated L4− anions, one incompletely deprotonated HL3− anion, five coordinated aqua molecules and five lattice aqua molecules (Fig. 1a). The Eu1, Eu2 and Eu3 ions are all eight-coordinated by eight oxygen atoms. For Eu1, seven from five different L4− ligands and one from aqua molecule; for Eu2, five from four different L4− ligands and three from aqua molecules; for Eu3, seven from six different L4− ligands and one from aqua molecule. The local coordination geometries of all three Eu3+ ions are trigonal dodecahedron (Fig. S1, ESI†). The Eu–O bond lengths range from 2.251(1) to 2.571(1) Å, which are comparable to those reported for other Eu–O complexes.11,42,48–51 The two L4− ligands and one HL3− ligand act as μ7, μ4 and μ6 bridge respectively, in which one carboxylate group adopts μ1-η1-bridging mode while the other adopt μ2-η1:η1-briding mode for the first L4− ligand (according to the numbering order), all four carboxylate groups adopt μ1-η2-bridging mode for the second L4− ligand, one carboxylate group adopts μ1-η1, two adopt μ2-η1:η1, and one adopts μ1-η2-bridging modes for the HL3− ligand (Fig. S2, ESI†).
. The asymmetric unit contains three crystallographically independent Eu3+ ions, one and a half completely deprotonated L4− anions, one incompletely deprotonated HL3− anion, five coordinated aqua molecules and five lattice aqua molecules (Fig. 1a). The Eu1, Eu2 and Eu3 ions are all eight-coordinated by eight oxygen atoms. For Eu1, seven from five different L4− ligands and one from aqua molecule; for Eu2, five from four different L4− ligands and three from aqua molecules; for Eu3, seven from six different L4− ligands and one from aqua molecule. The local coordination geometries of all three Eu3+ ions are trigonal dodecahedron (Fig. S1, ESI†). The Eu–O bond lengths range from 2.251(1) to 2.571(1) Å, which are comparable to those reported for other Eu–O complexes.11,42,48–51 The two L4− ligands and one HL3− ligand act as μ7, μ4 and μ6 bridge respectively, in which one carboxylate group adopts μ1-η1-bridging mode while the other adopt μ2-η1:η1-briding mode for the first L4− ligand (according to the numbering order), all four carboxylate groups adopt μ1-η2-bridging mode for the second L4− ligand, one carboxylate group adopts μ1-η1, two adopt μ2-η1:η1, and one adopts μ1-η2-bridging modes for the HL3− ligand (Fig. S2, ESI†).
Adjacent Eu3+ ions are bridged by carboxylate groups into trinuclear Eu3 units with Eu⋯Eu distances ranging from 4.692(2) to 5.435(1) Å. Each Eu3 unit are interlinked by L4− and HL3− ligands acted as μ7, μ4 and μ6 bridges into 2D layers along the a direction (Fig. 1b). Some disordered solvent molecules locate between the layers and the solvent-accessible volume of 1 is estimated by the PLATON program52 to be about 21.4% of the total crystal volume. As observed from the TGA curve of 1 shown in Fig. S3, ESI,† compound 1 shows good thermal stability.
3.2 The solid-state luminescence spectra of 1
The solid-state luminescence spectra of 1 was investigated upon excitation at 358 nm which exhibits luminescence emission peaks at 580, 592, 616, 650 and 699 nm, which could be attributed to the characteristic transitions of the Eu3+ ion: 5D0 → 7FJ (J = 0, 1, 2, 3, 4) respectively with the hypersensitive 5D0 → 7F2 transition dominating the spectra (Fig. S4, ESI†). The most prominent line in 1 presented at 616 nm which can be readily observed as bright-red luminescence of 1 by the naked eyes. The strong visible emission provides the possibility of 1 acting as a luminescence sensor.3.3 Detection of nitroaromatic compounds
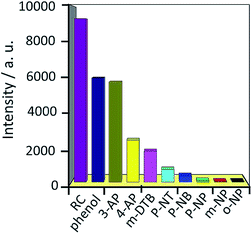
The luminescence detection experiments were carried out with the ethanol suspension of compound 1. As shown in Fig. 2, o-, m- and p-NP could almost completely quench the emission of 1. Such observations demonstrated that 1 could be applied as a fluorescence sensor for o-, m- and p-NP with high sensitivity and high selectivity. The PXRD patterns of 1 and o-, m- and p-NP-immersed 1 suggests that the basic framework remains in the process of sensing o-, m- and p-NP (Fig. S5, ESI†). Further fluorescence quenching titrations were performed with the o-, m- and p-NP. The fluorescence intensity decreased continuously upon incremental addition of an ethanol o-, m- and p-NP solution into a standard 1 emulsion in ethanol (Fig. 3–5). The fluorescence quenching by o-, m- and p-NP could be detected at very low concentration (0.33, 0.67 and 0.17 μM respectively), indicating the extremely high sensitivity towards o-, m- and p-NP. The relative luminescent intensity (I0/I) versus the o-, m- and p-NP concentrations are shown in insets of Fig. 3–5 to further quantify the quenching efficiency. Notably, the I0/I versus the o-, m- and p-NP concentrations plots bend upwards rather than being the typically linear plots which maybe due to the presence of simultaneous static and dynamic quenching.53–55 In order to further elucidate the quenching mechanism of the sensor, the luminescence lifetimes of 1 suspensions in the absence and presence of o- or m- or p-NP were measured and remained almost unchanged (Fig. 6), suggesting that there are no interactions between o- or m- or p-NP and the Eu3+ ions and changes in emission intensity are related to the interactions between o- or m- or p-NP and the ligands L4−. Therefore, the dynamic quenching was due to the collisional encounters between the π conjugated moieties of the organic ligands and the analytes (o-, m- and p-NP), and the static quenching may be due to the hydrogen-bond interactions between the carboxylate groups and the pyridyl nitrogen atoms of L4− and hydroxyl groups of o-, m- and p-NP.53–55 The decay dynamics of the emission band at 616 nm for 1 dispersed in ethanol in the absence and presence of o- or m- or p-NP can be well fitted by the monoexponential curve, and their lifetimes are 0.56, 0.56, 0.57 and 0.56 ms, respectively.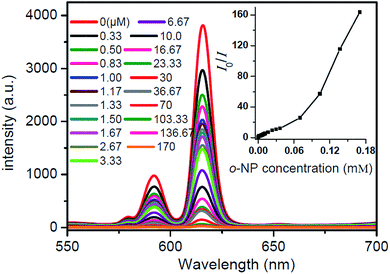 | ||
| Fig. 3 Effect on the emission spectra of 1 dispersed in ethanol upon incremental addition of a o-NP ethanol solution (λex = 358 nm). Inset: Stern–Volmer plot of I0/I versus the o-NP concentration. | ||
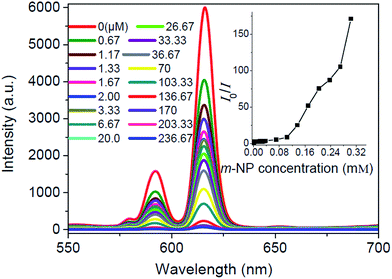 | ||
| Fig. 4 Effect on the emission spectra of 1 dispersed in ethanol upon incremental addition of a m-NP ethanol solution (λex = 358 nm). Inset: Stern–Volmer plot of I0/I versus the m-NP concentration. | ||
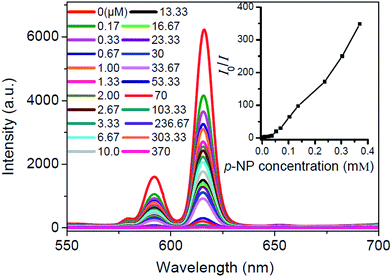 | ||
| Fig. 5 Effect on the emission spectra of 1 dispersed in ethanol upon incremental addition of a p-NP ethanol solution (λex = 358 nm). Inset: Stern–Volmer plot of I0/I versus the p-NP concentration. | ||
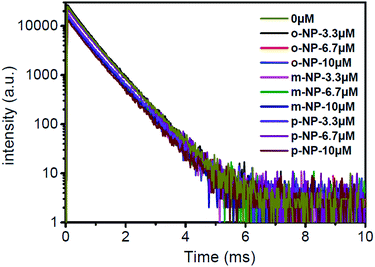 | ||
| Fig. 6 Semilog plots of fluorescence decay versus time in different concentrations of o-, m- and p-NP, excited and monitored at 358 and 616 nm, respectively. | ||
To our best knowledge, the phenomena that LnMOFs can sense isomers of nitrophenol (o-, m- and p-NP) simultaneously with relatively low detection limits is unprecedented. Considering that the organic pollutant molecules are usually in water in the real world, the luminescence detection experiments were also carried out with the water suspension of compound 1. The similar luminescence quenching phenomena as that in ethanol suspension was also observed. As shown in Fig. S6–S8, ESI,† the fluorescence quenching titrations were performed with the o-, m- and p-NP (0.01 M). The fluorescence intensity decreased continuously upon incremental addition of an aqueous o-, m- and p-NP solution into a standard 1 emulsion in water. The detection limits of 1 towards o-, m- and p-NP in water systems are 1.7 μM which are higher than that in ethanol systems indicating less sensitivity in water than in ethanol.
3.4 The quenching mechanism
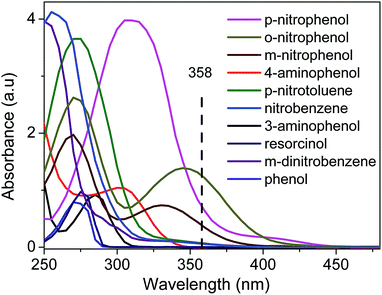
The quenching mechanism of 1 towards o-, m- and p-NP may be accounted for following three reasons: (1) upon excitation, electrons are typically transferred from the conduction band (CB) of MOFs to the lowest unoccupied molecular orbitals (LUMOs) of analytes.11,56–58 The greater of the bandgaps between the CB of the MOF and the LUMOs of the analytes, the higher of the efficiency of the luminescence quenching. Among the analytes, the aromatics with withdrawing nitro-group can decrease the luminescence intensity of 1 in different extent, while o-, m- and p-NP almost completely quench the luminescence intensity of 1. (2) As shown in the UV-Vis absorption spectrum in Fig. 7, o-, m- and p-NP all three of them have an observable absorption intensity at 358 nm, while other analysts do not absorb at this wavelength. There is competition between the absorption of o-, m- and p-NP and the excitation of 1 (Fig. S4b, ESI†), resulting in a decrease (even quenching) in luminescence. (3) The electrostatic interactions between the hydroxyl groups of the analysts and the free Lewis-base sites of pyridine rings in 1 result in a higher quenching effect.11,59,60 Generally, these above three aspects containing electron transfer, energy absorption by the analysts and electrostatic interactions are synergetic in the process of luminescence quenching for o-, m- and p-NP towards compound 1.4 Conclusions
In summary, a new luminescent 2D Eu–MOF [Eu6(L)3(HL)2(H2O)10]·10H2O·x(solvent) (1) has been designed and synthesized with a π conjugated ligands containing Lewis basic pyridyl site. The dispersed solution of 1 in ethanol shows high sensitivity and selectivity towards o-, m- and p-NP. This work demonstrated that luminescent MOFs can be rationally designed and explored as potential luminescent sensing and quantitative detection materials towards environment pollutants.Acknowledgements
We are thankful for the financial support from NSFC (21301087, 21361016), the Inner Mongolia autonomous region natural science fund project (2013MS0206), and Programs of Higher-level talents of Inner Mongolia University (SPH-IMU-30105-125135).Notes and references
- M. Yoon, R. Srirambalaji and K. Kim, Chem. Rev., 2012, 112, 1196 CrossRef CAS PubMed.
- D. B. Dang, P. Y. Wu, C. He, Z. Xie and C. Y. Duan, J. Am. Chem. Soc., 2010, 132, 1432 CrossRef PubMed.
- L. Q. Ma, C. Abney and W. B. Lin, Chem. Soc. Rev., 2009, 38, 1248 RSC.
- A. Dhakshinamoorthy and H. Garcia, Chem. Soc. Rev., 2012, 41, 5262 RSC.
- J. M. Falkowski, T. Sawano, T. Zhang, G. Tsun, Y. Chen, J. V. Lockard and W. B. Lin, J. Am. Chem. Soc., 2014, 136, 5213 CrossRef CAS PubMed.
- M. P. Suh, H. J. Park, T. K. Prasad and D. W. Lim, Chem. Rev., 2012, 112, 782 CrossRef CAS PubMed.
- J. R. Li, R. J. Kuppler and H. C. Zhou, Chem. Soc. Rev., 2009, 38, 1477 RSC.
- J. R. Li, Y. Ma, M. C. Carthy, J. Sculley, J. Yu, H. K. Jeong, P. B. Balbuena and H. C. Zhou, Coord. Chem. Rev., 2011, 255, 1791 CrossRef CAS PubMed.
- J. S. Qin, D. Y. Du, W. L. Li, J. P. Zhang, S. L. Li and Z. M. Su, Chem. Sci., 2012, 3, 2114 RSC.
- J. D. Rocca, D. M. Liu and W. B. Lin, Acc. Chem. Res., 2011, 44, 957 CrossRef PubMed.
- X. Z. Song, S. Y. Song, S. N. Zhao, Z. M. Hao, M. Zhu, X. Meng, L. L. Wu and H. J. Zhang, Adv. Funct. Mater., 2014, 24, 4034 CrossRef CAS PubMed.
- S. S. Nagarkar, B. Joarder, A. K. Chaudhari, S. Mukherjee and S. K. Ghosh, Angew. Chem., Int. Ed., 2013, 125, 2953 CrossRef PubMed.
- Y. J. Cui, Y. F. Yue, G. D. Qian and B. L. Chen, Chem. Rev., 2012, 112, 1126 CrossRef CAS PubMed.
- N. N. Sang, C. X. Zhan and D. P. Cao, J. Mater. Chem. A, 2015, 3, 92 CAS.
- Z. C. Hu, B. J. Deibert and J. Li, Chem. Soc. Rev., 2014, 43, 5815 RSC.
- G. Y. Wang, L. L. Yang, Y. Li, H. Song, W. J. Ruan, Z. Chang and X. H. Bu, Dalton Trans., 2013, 42, 12865 RSC.
- C. Zhan, S. Ou, C. Zou, M. Zhao and C. D. Wu, Anal. Chem., 2014, 86, 6648 CrossRef CAS PubMed.
- N. Sabbatini, M. Guardigli and J. M. Lehn, Coord. Chem. Rev., 1993, 123, 201 CrossRef CAS.
- V. Väisänen, H. Härmä, H. Lilja and A. Bjartell, Luminescece, 2000, 15, 389 CrossRef.
- P. Huhtinen, M. Kivelä, O. Kuronen, V. Hagren, H. Takalo, H. Tenhu, T. Lövgren and H. Härmä, Anal. Chem., 2005, 77, 2643 CrossRef CAS PubMed.
- S. V. Eliseeva and J.-C. G. Bünzli, Chem. Soc. Rev., 2010, 39, 189 RSC.
- J.-C. G. Bünzli, Acc. Chem. Res., 2006, 39, 53 CrossRef PubMed.
- S. J. A. Pope, B. P. Burton-Pye, R. Berridge, T. Khan, P. J. Skabara, S. Faulkner and S. Faulkner, Dalton Trans., 2006, 2907 RSC.
- A. Beeby, S. Faulkner, D. Parker and J. A. G. Williams, J. Chem. Soc., Perkin Trans. 1, 2001, 2, 1268 RSC.
- S. Petoud, S. M. Cohen, J.-C. G. Bünzli and K. N. Raymond, J. Am. Chem. Soc., 2003, 125, 13324 CrossRef CAS PubMed.
- K. L. Bray, Transition Metal and Rare Earth Compounds, ed. H. Yersin, Springer, Berlin, 2001, p. 1 Search PubMed.
- X. Rao, T. Song, J. Gao, Y. Cui, Y. Yang, C. Wu, B. Chen and G. Qian, J. Am. Chem. Soc., 2013, 135, 15559 CrossRef CAS PubMed.
- Y. Li, S. Zhang and D. Song, Angew. Chem., Int. Ed., 2013, 52, 710 CrossRef CAS PubMed.
- P. S. Majumder and S. K. Gupta, Water Res., 2003, 37, 4331 CrossRef CAS.
- X. H. Zhou, H. H. Li, H. P. Xiao, L. Li, Q. Zhao, T. Yang, J. L. Zuo and W. Huang, Dalton Trans., 2013, 42, 5718 RSC.
- S. A. Boyd, G. Sheng, B. J. Teppen and C. T. Johnston, Environ. Sci. Technol., 2001, 35, 4227 CrossRef CAS.
- M. E. Germain and M. J. Knapp, Chem. Soc. Rev., 2009, 38, 2543 RSC.
- S. J. Toal and W. C. Trogler, J. Mater. Chem., 2006, 16, 2871 RSC.
- D. T. McQuade, A. E. Pullen and T. M. Swager, Chem. Rev., 2000, 100, 2537 CrossRef CAS PubMed.
- Ö. Aktaş and F. Çeçen, J. Hazard. Mater., 2010, 177, 956 CrossRef PubMed.
- M. B. Cassidy, H. Lee, J. T. Trevors and R. B. Zablotowicz, J. Ind. Microbiol. Biotechnol., 1999, 23, 232 CrossRef CAS PubMed.
- D. Patra and A. K. Mishra, Sens. Actuators, B, 2001, 80, 278 CrossRef CAS.
- K. K. Wang, L. Wang, W. Jiang and J. T. Hu, Talanta, 2011, 84, 400 CrossRef CAS PubMed.
- J. H. Qin, B. Ma, X. F. Liu, H. L. Lu, X. Y. Dong, S. Q. Zang and H. W. Hou, J. Mater. Chem. A, 2015, 3, 12690 CAS.
- H. P. Ma, B. Li, L. M. Zhang, D. Han and G. S. Zhu, J. Mater. Chem. A, 2015, 3, 19346 Search PubMed.
- H. Xu, F. Liu, Y. Cui, B. Chen and G. Qian, Chem. Commun., 2011, 47, 3153 RSC.
- S. N. Zhao, X. Z. Song, M. Zhu, X. Meng, L. L. Wu, S. Y. Song, C. Wang and H. J. Zhang, RSC Adv., 2015, 5, 93 RSC.
- W. Sun, J. Z. Wang, H. T. Liu, S. Y. Chang, X. T. Qin and Z. L. Liu, Mater. Lett., 2014, 126, 189 CrossRef CAS PubMed.
- J. C. Yu, Y. J. Cui, C. D. Wu, Y. Yang, B. L. Chen and G. D. Qian, J. Am. Chem. Soc., 2015, 137, 4026 CrossRef CAS PubMed.
- X. T. Rao, J. F. Cai, J. C. Yu, Y. B. He, C. D. Wu, W. Zhou, T. Yildirim, B. L. Chen and G. D. Qian, Chem. Commun., 2013, 49, 6719 RSC.
- G. M. Sheldrick, Program for Empirical Absorption Correction of Area Detector Data, University of Göttingen, Germany, 1996 Search PubMed.
- G. M. Sheldrick, SHELXTL Version 5.1, Bruker Analytical X-ray Instruments Inc., Madison, Wisconsin, USA, 1998 Search PubMed.
- W. H. Zhu, Z. M. Wang and S. Gao, Inorg. Chem., 2007, 46, 1337 CrossRef CAS PubMed.
- R. Feng, L. Chen, Q. H. Chen, X. C. Shan, Y. L. Gai, F. L. Jiang and M. C. Hong, Cryst. Growth Des., 2011, 11, 1705 CAS.
- B. B. Shi, Y. H. Zhong and G. Li, Dalton Trans., 2015, 44, 4362 RSC.
- H. Chen, G. M. Zheng, M. Li, Y. F. Wang, Y. Song, C. H. Han, J. C. Dai and Z. Y. Fu, Chem. Commun., 2014, 50, 13544 RSC.
- A. L. Spek, J. Appl. Crystallogr., 2003, 36, 7 CrossRef CAS.
- X. H. Zhou, L. Li, H. H. Li, A. Li, T. Yang and W. Huang, Dalton Trans., 2013, 42, 12403 RSC.
- J. Liu, Y. Zhong, P. Lu, Y. Hong, J. W. Y. Lam, M. Faisal, Y. Yu, K. S. Wong and B. Z. Tang, Polym. Chem., 2010, 1, 426 RSC.
- B. Valeur, Molecular Fluorescence: Principle and Applications, Wiley-VCH, Weinheim, 2002 Search PubMed.
- S. Pramanik, C. Zheng, X. Zhang, T. J. Emge and J. Li, J. Am. Chem. Soc., 2011, 133, 4153 CrossRef CAS PubMed.
- S. J. Toal, J. C. Sanchez, R. E. Dugan and W. C. Trogler, J. Forensic Sci., 2007, 52, 79 CrossRef CAS PubMed.
- K. S. Asha, K. Bhattacharyya and S. Mandal, J. Mater. Chem. C, 2014, 2, 10073 RSC.
- S. S. Nagarkar, B. Joarder, A. K. Chaudhari, S. Mukherjee and S. K. Ghosh, Angew. Chem., Int. Ed., 2013, 52, 2881 CrossRef CAS PubMed.
- Y. Peng, A. J. Zhang, M. Dong and Y. W. Wang, Chem. Commun., 2011, 47, 4505 RSC.
Footnote |
| † Electronic supplementary information (ESI) available: PXRD graphics. CCDC 1400052 (1). For ESI and crystallographic data in CIF or other electronic format see DOI: 10.1039/c5ra17001j |
| This journal is © The Royal Society of Chemistry 2015 |

