
Electrochemical and electronic properties of flower-like MoS2 nanostructures in aqueous and ionic liquid media†
Kavita Pandey,
Pankaj Yadav and
Indrajit Mukhopadhyay*
School of Solar Energy, Pandit Deendayal Petroleum University, Gandhinagar – 382007, Gujarat, India. E-mail: indrajit.m@sse.pdpu.ac.in; Fax: +91-79-23275030; Tel: +91-95-86864936
First published on 15th June 2015
Abstract
In the present work, we report a facile strategy to synthesize uniform 3D flower-like MoS2 nanostructures prepared by a one-pot hydrothermal method and investigate their supercapacitive behavior. A field emission scanning electron microscopy, atomic force microscopy and X-ray diffraction study reveals the formation of randomly stacked layers of MoS2. The electrochemical properties of MoS2 nanostructures were investigated using cyclic voltammetry (CV), galvanostatic charge/discharge (GCD) and electrochemical impedance spectra (EIS) techniques in aqueous and ionic liquid media. The CV measurement shows that the as-synthesized MoS2 electrode delivered a maximum capacitance of 218 F g−1 at a scan rate of 5 mV s−1 in aqueous medium. The GCD measurement shows a maximum specific capacitance of about 217.6 F g−1 at a discharge current density of 0.1 A g−1 in aqueous electrolyte. EIS with an appropriate electrical equivalent circuit was employed to understand the charge storage mechanism in the MoS2 electrode. Cyclic stability tests in aqueous medium reveal a capacitance retention of about 76% after 1000 cycles. This study reveals that a nearly pure capacitive behavior is observed for aqueous electrolyte and a diffusive behavior is observed for the MoS2 electrode in ionic liquid medium.
Introduction
In the past few years supercapacitors have emerged as some of the most promising energy storage devices, where high power density is required.1,2 Supercapacitors are widely employed as power sources in various applications such as hybrid electric vehicles, stand-by power systems, portable electronic equipment and digital telecommunication systems.3–5 The field of supercapacitors has long been a topic of discussion among researchers for developing an advanced electrode material having high power and energy density at low cost.6,7A wide range of carbonaceous material, metal oxides, conducting polymers and metal chalcogenides are used in lithium ion batteries and supercapacitor applications.8–12 Molybdenum sulfide (MoS2), a metal chalcogenide, has attracted major attention in a variety of applications like hydrogen storage, solid lubricant lithium ion batteries and supercapacitors.13–15 The reason for its success is due to its unique crystal structure and optical, electrical and physical properties. MoS2 is composed of a layered structure like graphite and the layers are stacked together by weak van der Waals interactions. Due to the weak van der Waals interactions and high surface area, MoS2 can be exfoliated to a sheet-like morphology which can exhibit better electrical and capacitive properties for supercapacitor applications.16–19 Various synthetic routes have been developed for the synthesis of MoS2 nanostructures and composites, such as gas phase reaction, magnetron sputtering, microwave irradiation, laser ablation and hydrothermal methods. Gao et al.20 reported a facile one-pot synthesis of MoS2 quantum dots/graphene/TiO2 composites with highly enhanced photo-catalytic property. Sun et al.21 synthesized nanocomposites of C/MoS2 which showed a capacitance of 210 F g−1 at a current density of 1 A g−1. Ma et al.19 reported polypyrrole/MoS2 nanocomposites with a specific capacitance of 553.7 F g−1 at 1 A g−1. Recently, Huang and coworkers22 demonstrated polyaniline/2-dimensional graphene analog MoS2 composites for supercapacitor application. Most of the studies discussed above have been reported for MoS2-based composites. Reports on the applicability of MoS2 nanostructures for supercapacitor application and supercapacitive behavior are still limited.
Electrochemical applications of MoS2 electrode are still hindered by the limited understanding of the interface between the electrode material and aqueous and ionic liquid (IL) media. In the present work, we report a facile strategy to synthesize uniform 3D flower-like MoS2 nanostructures prepared by a one-pot hydrothermal method and investigate their supercapacitive behavior. It is observed that the specific capacitance of MoS2 electrode in IL for the entire range of scan rates is higher than that of the MoS2 electrode in aqueous electrolyte due to the higher working voltage window. Moreover, the significant energy loss in aqueous medium not only reduces the capacitive performance but also degrades the electrode active material by generating much heat during the charge and discharge process.
Experimental section
Synthesis and characterization of MoS2 nanostructures
Ammonium molybdate and thiourea used in this experiment were of research grade and used without further purification. The solutions were prepared using deionized water. The flower-like MoS2 nanostructures were synthesized as follows: 0.23 g of ammonium molybdate and 0.3 g thiourea were dissolved in 20 ml deionized water under vigorous stirring for 2 hours. The solution was then transferred into a Teflon-lined stainless steel autoclave and kept for 22 hours at 220 °C. The autoclave was cooled down to room temperature naturally and the resulting black precipitates of MoS2 were collected by filtration. The collected MoS2 powder was washed and centrifuged with distilled water and ethanol several times to remove the residual reactants. The obtained MoS2 powder was then dried at 60 °C for 12 hours. The morphological characterization of the as-synthesized MoS2 powder was done using a Carl Zeiss field emission scanning electron microscope (FESEM). The elemental and structural characterization was conducted using energy dispersive X-ray analysis (EDAX) and X-ray diffraction (XRD).Electrochemical studies of electrodes
The working electrode for the electrochemical measurement was fabricated by mixing the as-synthesized MoS2, acetylene black, and polyvinylidene fluoride in a ratio of 80![[thin space (1/6-em)]](https://www.rsc.org/images/entities/char_2009.gif) :10:10. A homogeneous paste was obtained by adding a small amount of N-methyl-2-pyrrolidone to the mixture and the paste was coated on a fluorine-doped glass substrate. The loading level of MoS2 active material on the substrate is 5 mg cm−2. The electrodes were then dried in air at 90 °C for 6 h to remove the solvent. Electrochemical measurements were performed with a CH Instruments 660D electrochemical workstation in 1 M KCl aqueous electrolyte and BMIMPF6 ionic liquid solution with a three-electrode configuration at room temperature. Cyclic voltammetry (CV) measurement was carried out at different scan rates from 5 to 200 mV s−1. A galvanostatic charge/discharge (GCD) test was also conducted at different current densities for the fabricated electrodes. Electrochemical impedance spectroscopy (EIS) measurements were conducted by applying an AC perturbation voltage of 10 mV amplitude in a frequency range from 10 mHz to 1 MHz.
:10:10. A homogeneous paste was obtained by adding a small amount of N-methyl-2-pyrrolidone to the mixture and the paste was coated on a fluorine-doped glass substrate. The loading level of MoS2 active material on the substrate is 5 mg cm−2. The electrodes were then dried in air at 90 °C for 6 h to remove the solvent. Electrochemical measurements were performed with a CH Instruments 660D electrochemical workstation in 1 M KCl aqueous electrolyte and BMIMPF6 ionic liquid solution with a three-electrode configuration at room temperature. Cyclic voltammetry (CV) measurement was carried out at different scan rates from 5 to 200 mV s−1. A galvanostatic charge/discharge (GCD) test was also conducted at different current densities for the fabricated electrodes. Electrochemical impedance spectroscopy (EIS) measurements were conducted by applying an AC perturbation voltage of 10 mV amplitude in a frequency range from 10 mHz to 1 MHz.
Results and discussion
Morphological, elemental and structural analysis
Fig. 1A shows a low-magnification surface morphology of the as-synthesized MoS2 nanostructures. The as-synthesized MoS2 powder consists of several individual spherical shaped particles. The spherical growth of MoS2 mainly depends upon the material used as a precursor. During the hydrothermal synthesis, ammonium molybdate releases MoO4− ions and ammonium ions whereas thiourea is used as a sulfur source. From the synthesized products, MoO4− ions react with sulfur ions to form MoS2 and the interaction of residual ammonia prevents the stacking of MoS2 nanostructures.23 The high-magnification FESEM image shown in Fig. 1B clearly shows the self-assembled nanosheets where many interconnected nanosheets with lots of folds are seen. The average grain size of MoS2 nanostructures was estimated from ImageJ software. The analysis reveals that the average radius of MoS2 spheres is ∼300 to 350 nm.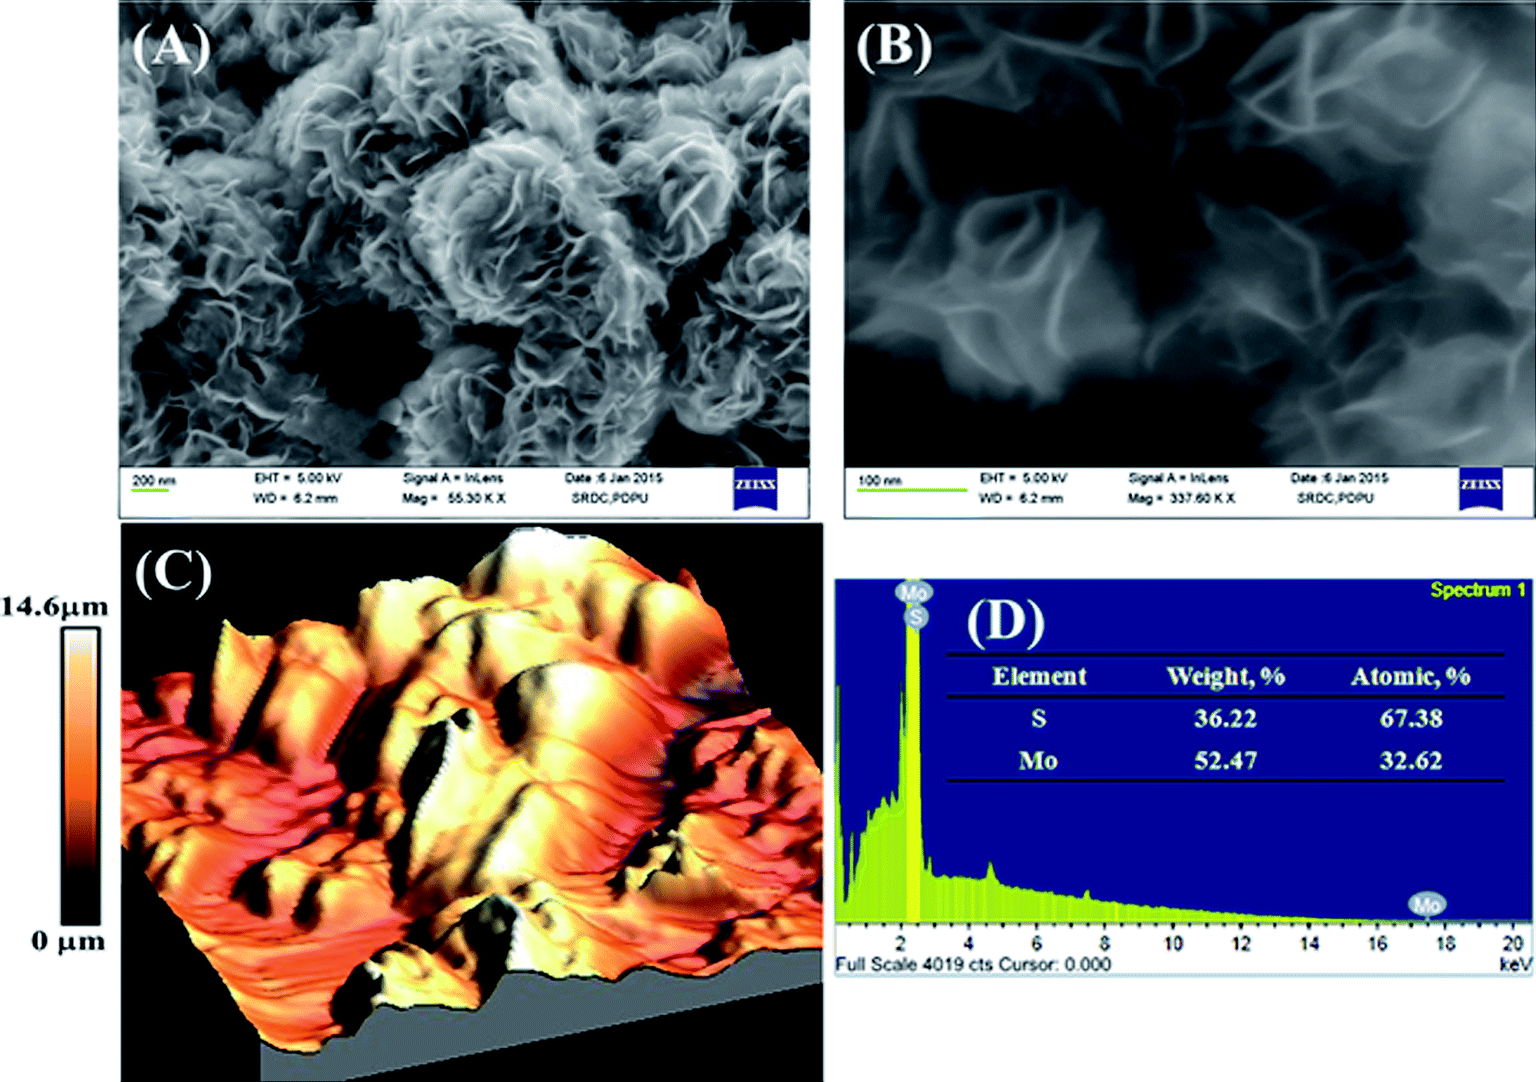 | ||
| Fig. 1 (A) Low- and (B) high-magnification FESEM images of MoS2 nanoflowers, (C) AFM topological micrograph in 3D view and (D) EDAX analysis of synthesized MoS2 nanostructures. | ||
The roughness and surface morphology of MoS2 thin film on FTO substrate were investigated using AFM in tapping mode. Fig. 1C shows the AFM image of MoS2 thin film in 3D mode. The surface topographical image shows a good quality of the film with root mean square roughness approximately equal to 200 nm. High roughness and porous morphology of a supercapacitor electrode are ideally required for enhancing the electrochemical performance by providing fast ion/electron transfer, and sufficient contact between electrolyte and active material. Therefore an enhanced electrode performance and charge storage behavior could be expected for the as-synthesized MoS2. The composition of MoS2 thin film was analyzed by EDAX. Fig. 1D depicts the compositional EDAX image of mesoporous MoS2 nanostructures. The EDAX analysis reveals the compositional contribution from Mo and S elements where, further, no extra elemental peak confirms the purity of as-synthesized samples.
The crystal structure and phase purity of the as-prepared MoS2 nanostructures were characterized by XRD measurements. Fig. 2 shows the XRD pattern of MoS2 nanostructure powder. The XRD profile of MoS2 nanostructures shows diffraction peaks at 2θ values of 14.1°, 33.6°, 39.2°, 45.2°, 50.1°, 59.4° and 70.6° which are identified as the reflections from (002), (100), (103), (104), (105), (110) and (201) planes of hexagonal MoS2.24,25 The obtained diffraction peak are well matched with MoS2 (JCPDS 37-1492) indicating that a pure MoS2 is synthesized. The crystallite size of MoS2 is obtained from the relation  where β is the full width at half maximum, ε is the lattice strain and L is the crystallite size.26 The reciprocal of the intercept on the
  axis gives information about the average crystallite size which happens to be ∼76 nm in the present study. This implies that the fundamental particles are of nano-dimensions. Moreover, their ordered organization under the reaction conditions leads to the two-dimensional (sheet-like structure) and finally three-dimensional hierarchical flower-like structure.
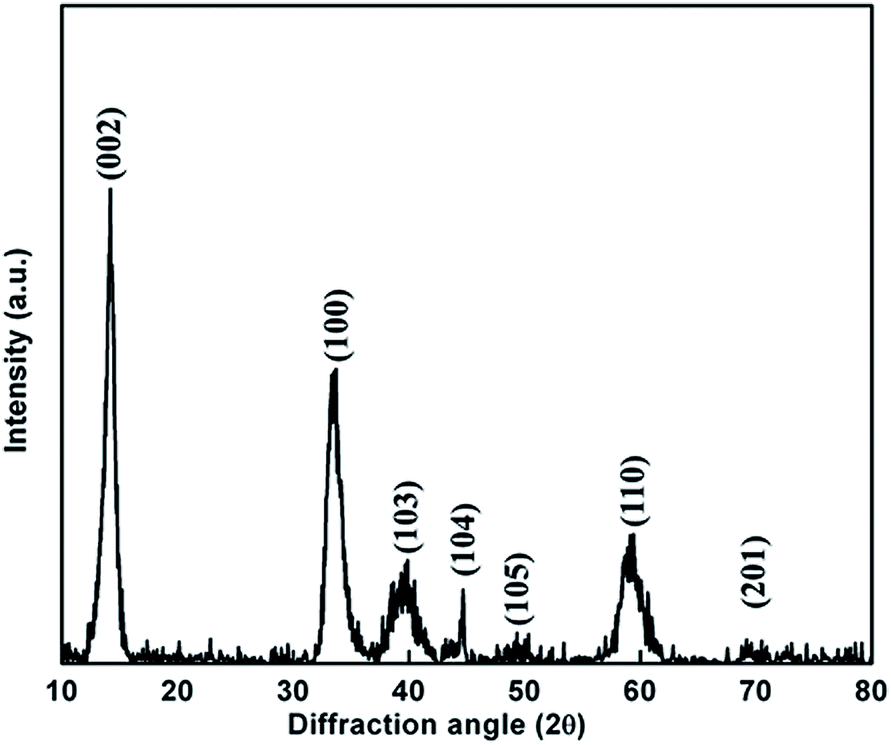 | ||
| Fig. 2 XRD spectrum of MoS2 nanostructure. | ||
Electrochemical characterization
| (MoS2)surface + C+ + e− ↔ (MoS2–C+)surface |
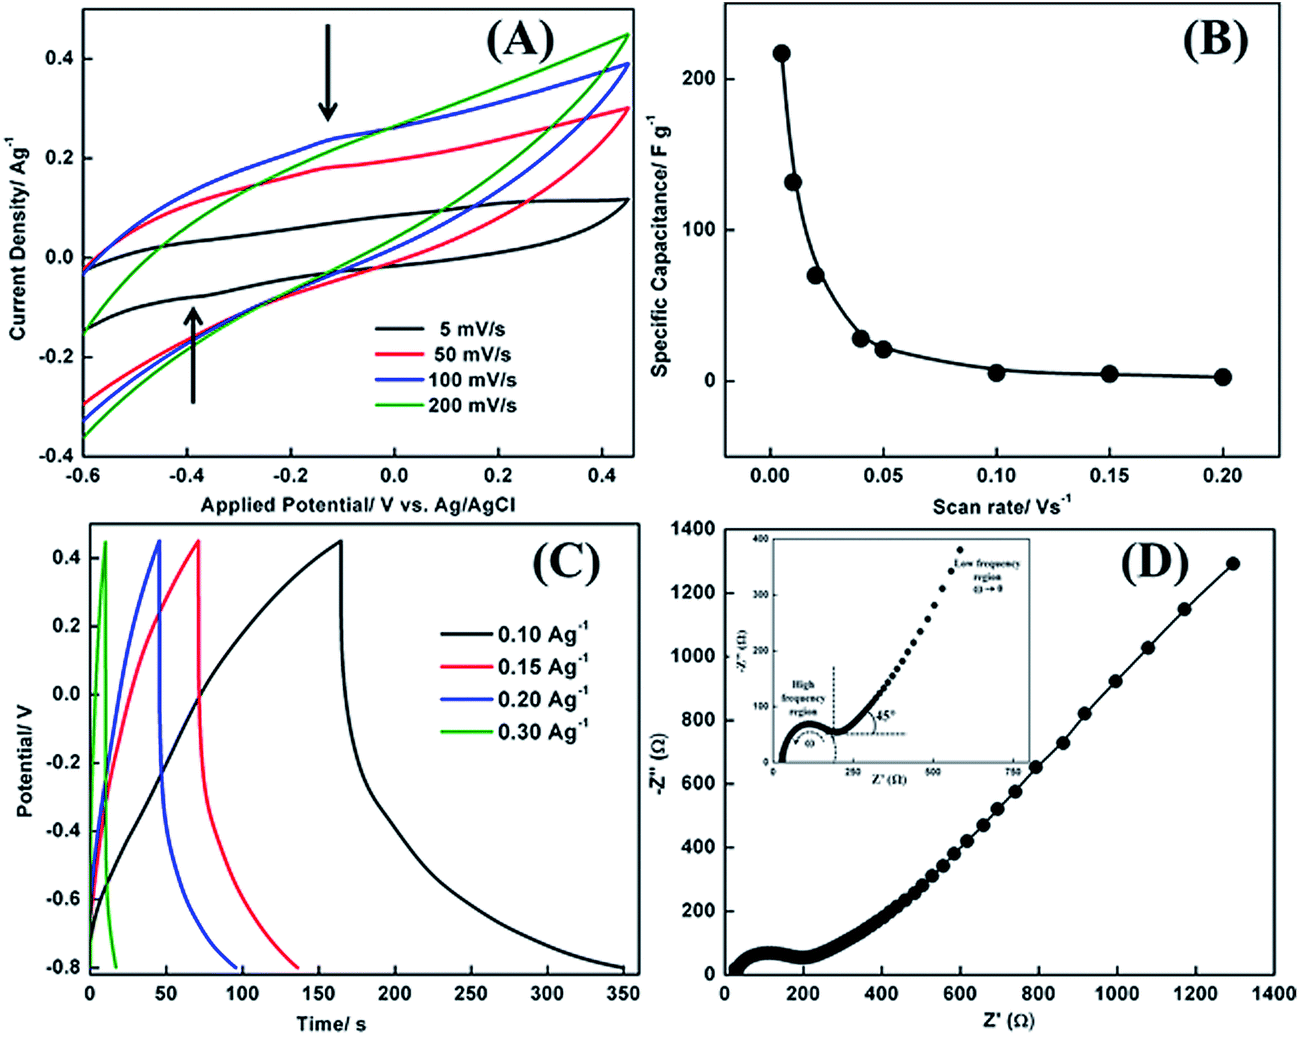 | ||
| Fig. 3 Electrochemical characterization in a three-electrode cell. (A) Cyclic voltammograms of MoS2 electrodes in aqueous medium at different scan rates, (B) variation of specific capacitance as a function of scan rate, (C) galvanostatic charge/discharge plots at different current densities and (D) Nyquist plot of MoS2 electrode in aqueous medium at open circuit potential (the inset shows the high-frequency details). | ||
On the other hand, the second process is based on the pseudo-capacitive behavior due to the Faradaic charge transfer process during which the electrolyte ions such as alkali metal cations or H+ ions may diffuse into the layer structure of MoS2 (i.e. intercalation). The above reduction process can be expressed through the equation MoS2 + C+(Na+, Li+ or H+) + e− ↔ MoS–SC+. In the reverse scan the corresponding de-intercalation process gives rise to the feeble oxidation wave. The values of the specific capacitance were calculated from the CV curves using the general expression Csp = ∫idV/SAΔV F g−1, where i is the net CV current, S is the scan rate, ΔV is the applied potential window through which the device is scanned and the integral of the equation provides the area of the CV curve.28,29 Fig. 3B illustrates the variation of specific capacitance of the MoS2 electrode in 1 M KCl with respect to the scan rate. It is observed that specific capacitance increases with a decrease in scan rate, which is due to the fact that at lower scan rate ions have sufficient time to diffuse into the interlayers of MoS2 active layer, thereby providing more active sites for the charge transfer process to occur.2 The highest value of Cs obtained from CV is about 218 F g−1 at a scan rate of 5 mV s−1. The obtained values of Cs for flower-like MoS2 are comparable to the values obtained by Ramadoss et al.15 and Soon et al.27 The authors have shown that Cs of the MoS2 electrode in KCl electrolyte was higher than in Na2SO4 electrolyte which may be due to the small hydrated ionic radius and high ionic conductivity of K+ ions. Along with Ramadoss et al.,15 Soon et al.27 also showed that MoS2 nanostructures show pseudo-capacitance in a number of redox active systems. In this work also we have observed the characteristics of Faradaic charge transfer with electrolyte at higher scan rates.
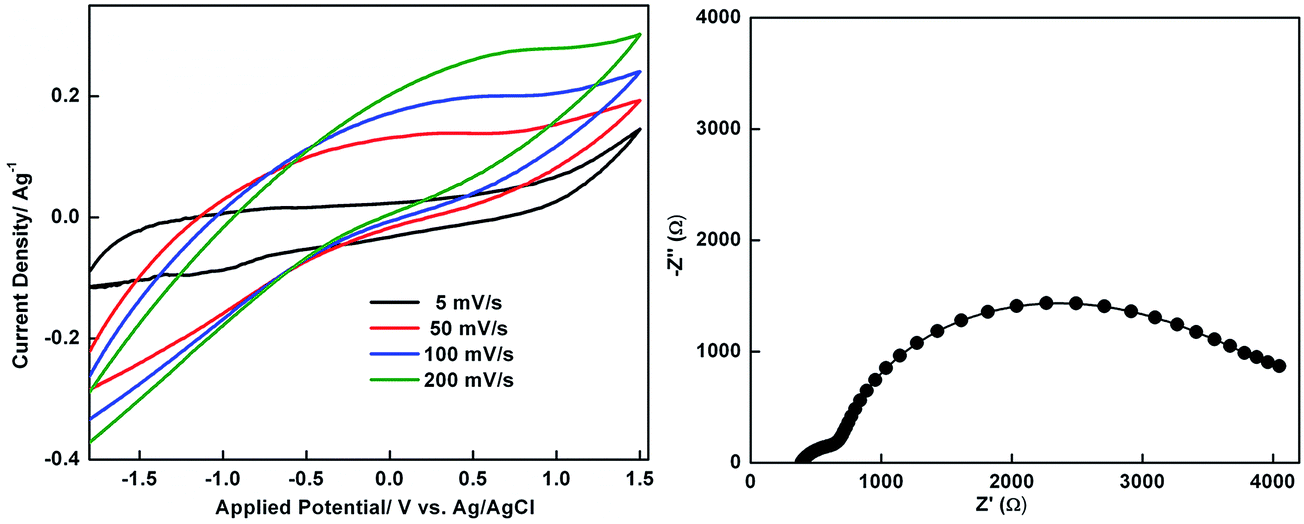 | ||
| Fig. 4 Electrochemical characterization in a three-electrode cell. (A) Cyclic voltammograms of MoS2 electrodes in ionic liquid medium at different scan rates and (B) Nyquist plot of MoS2 electrode in ionic liquid at open circuit potential. | ||
 respectively, where E and P represent the power density (W kg−1) and specific energy density (W h kg−1), respectively, and m represents the active mass of the electrode. The Ragone plots for the MoS2 electrode calculated at 5, 10 and 20 mV s−1 in both media are shown in Fig. 5. As observed, the energy density of MoS2 in IL medium decreases from 603 to 194 W h kg−1 with an increase in power density from 30 to 40 W kg−1. However, MoS2 in aqueous medium exhibits much lower energy density which may be attributed to the lower working cell voltage than that of IL.
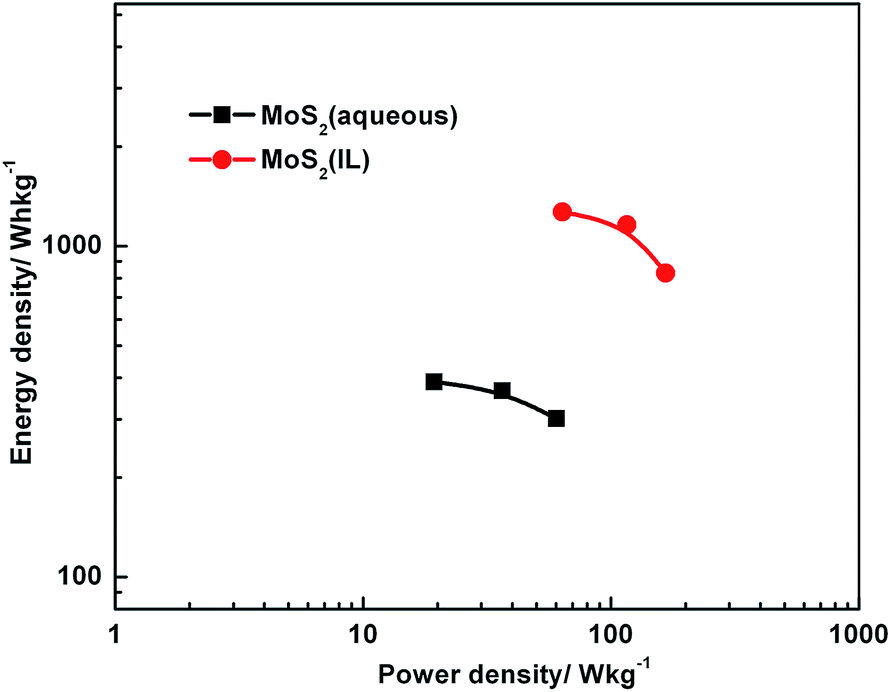 | ||
| Fig. 5 Ragone plots of MoS2 electrodes in aqueous and ionic liquid media. | ||
The energy density of MoS2 in IL reaches a high value at a relatively low power and thus this configuration can be proposed to be an energy oriented device. Note that depending upon the potential window of the MoS2 electrode in aqueous and IL media a significant energy loss is obtained for MoS2 in aqueous medium. The energy loss at the electrode–electrolyte interface is defined as the difference between the electrical energy charged into the electrode and the electrical energy delivered by the active electrode. The electrical energy charged into the MoS2 electrode in aqueous medium is 172 W h kg−1 and the energy discharged is 60 W h kg−1 while the energy charged and discharged is 271 W h kg−1 and 166 W h kg−1 for the MoS2 electrode in IL medium. The electrical energy charged and discharged into the active electrode is calculated as 5 mV s−1 from the CV curves obtained for the MoS2 electrode in both media. The significant energy loss in aqueous medium not only reduces the capacitive performance but also degrades the electrode active material by generating much heat during the charge and discharge process. Accordingly, Joule heating will sharply increase the cell temperature to an unacceptable level.
Conclusions
A facile strategy to synthesize and investigate the supercapacitive behavior of uniform 3D flowerlike MoS2 nanostructures prepared by a one-pot hydrothermal method is reported in the present article. The specific capacitance of the MoS2 electrode in IL at the entire range of scan rates is higher than that of the MoS2 electrode in aqueous electrolyte. It is observed that the energy density of the MoS2 electrode in IL medium decreases from 603 to 194 W h kg−1 with an increase in power density from 30 to 40 W kg−1. However, MoS2 in aqueous medium exhibits much lower energy density which may be attributed to the lower working cell voltage than that of IL. Also, the significant energy loss in aqueous medium not only reduces the capacitive performance but also degrades the electrode active material by generating much heat during the charge and discharge process.Acknowledgements
The authors would like to acknowledge Ms Margi Jani for AFM and EDAX measurements. The authors gratefully acknowledge DST (project no. SR/S1/PC-44/2011 dated 04/07/2012) for financial assistance. One of the authors (K. P.) thanks the DST INSPIRE fellowship program for a junior research fellowship.References
- L. F. Chen, X. D. Zhang, H. W. Liang, M. Kong, Q. F. Guan, P. Chen, Z. Y. Wu and S. H. Yu, ACS Nano, 2012, 6, 7092 CrossRef CAS PubMed.
- K. Pandey, P. Yadav and I. Mukhopadhyay, Phys. Chem. Chem. Phys., 2015, 17, 878 RSC.
- Y. Zhai, Y. Dou, D. Zhao, P. F. Fulvio, R. T. Mayes and S. Dai, Adv. Mater., 2011, 23, 4828 CrossRef CAS PubMed.
- F. Su, C. K. Poh, J. S. Chen, G. Xu, D. Wang, Q. Li, J. Lin and X. W. Lou, Energy Environ. Sci., 2011, 4, 717 CAS.
- K. Pandey, P. Yadav and I. Mukhopadhyay, RSC Adv., 2014, 4, 53740 RSC.
- F. Wang, S. Xiao, Y. Hou, C. Hu, L. Liu and Y. Wu, RSC Adv., 2013, 3, 13059 RSC.
- S. Maiti and B. B. Khatua, RSC Adv., 2013, 3, 12874 RSC.
- S. B. Kulkarni, U. M. Patil, I. Shackery, J. S. Sohn, S. Lee, B. Park and S. Jun, J. Mater. Chem. A, 2014, 2, 4989 CAS.
- C. Peng, D. Hu and G. Z. Chen, Chem. Commun., 2011, 47, 4105 RSC.
- H. Fan, H. Wang, N. Zhao, X. Zhang and J. Xu, J. Mater. Chem., 2012, 22, 2774 RSC.
- J. P. Zheng and T. R. Jow, J. Electrochem. Soc., 1995, 142, L6 CrossRef CAS PubMed.
- H. Y. Lee and J. B. Goodenough, J. Solid State Chem., 1999, 148, 81 CrossRef CAS.
- T. F. Jaramillo, K. P. Jørgensen, J. Bonde, J. H. Nielsen, S. Horch and I. Chorkendorff, Science, 2007, 317, 100 CrossRef CAS PubMed.
- K. Shiva, H. S. S. R. Matte, H. B. Rajendra, A. J. Bhattacharyya and C. N. R. Rao, Nano Energy, 2013, 2, 787 CrossRef CAS PubMed.
- A. Ramadoss, T. Kim, G. S. Kim and S. J. Kim, New J. Chem., 2014, 38, 2379 RSC.
- H. S. S. Ramakrishna Matte, A. Gomathi, A. K. Manna, D. J. Late, R. Datta, S. K. Pati and C. N. R. Rao, Angew. Chem., 2010, 122, 4153 CrossRef PubMed.
- A. V. Powell, L. Kosidowski and A. McDowall, J. Mater. Chem., 2001, 11, 1086 RSC.
- J. Xiao, D. W. Choi, L. Cosimbescu, P. Koech, J. Liu and J. P. Lemmon, Chem. Mater., 2010, 22, 4522 CrossRef CAS.
- G. Ma, H. Peng, J. Mu, H. Huang, X. Zhou and Z. Lei, J. Power Sources, 2013, 229, 72–78 CrossRef CAS PubMed.
- W. Gao, M. Wang, C. Rana and L. Li, Chem. Commun., 2015, 51, 1709 RSC.
- B. Hu, X. Qin, A. M. Asiri, K. A. Alamry, A. O. Al-Youbi and X. Sun, Electrochim. Acta, 2013, 100, 24 CrossRef CAS PubMed.
- K.-J. Huang, L. Wang, Y.-J. Liu, H.-B. Wang, Y.-M. Liu and L.-L. Wang, Electrochim. Acta, 2013, 109, 587 CrossRef CAS PubMed.
- K. Krishnamoorthy, G. K. Veerasubramani, S. Radhakrishnan and S. J. Kim, Mater. Res. Bull., 2014, 50, 499 CrossRef CAS PubMed.
- X. Wang, J. Ding, S. Yao, X. Wu, Q. Feng, Z. Wang and B. Geng, J. Mater. Chem. A, 2014, 2, 15958 CAS.
- B. Tripathi, P. Bhatt, C. Kanth, P. Yadav, B. Desai, M. K. Pandey and M. Kumar, Sol. Energy Mater. Sol. Cells, 2015, 132, 615 CrossRef CAS PubMed.
- M. A. Ibrahem, T. Lan, J. K. Huang, Y. Y. Chen, K. H. Wei, L. J. Li and C. W. Chu, RSC Adv., 2013, 3, 13193 RSC.
- J. M. Soon and K. P. Loh, Electrochem. Solid-State Lett., 2007, 10(11), A250 CrossRef CAS PubMed.
- H. Xu, J. Zhang, Y. Chen, H. Lu and J. Zhuang, RSC Adv., 2014, 4, 5547 RSC.
- K. Pandey, P. Yadav and I. Mukhopadhyay, J. Electroanal. Chem., 2015, 745, 88 CrossRef CAS PubMed.
- K. Pandey, P. Yadav and I. Mukhopadhyay, J. Phys. Chem. B, 2014, 118, 3235 CrossRef CAS PubMed.
- A. Winchester, S. Ghosh, S. Feng, A. L. Elias, T. Mallouk, M. Terrones and S. Talapatra, ACS Appl. Mater. Interfaces, 2014, 6, 2125 CAS.
- C. C. Hu, E. Chen and J. Y. Lin, Electrochim. Acta, 2002, 47, 2741 CrossRef CAS.
- C. C. Hu and J. Y. Lin, Electrochim. Acta, 2002, 47, 4055 CrossRef CAS.
Footnote |
| † Electronic supplementary information (ESI) available. See DOI: 10.1039/c5ra09282e |
| This journal is © The Royal Society of Chemistry 2015 |