Size-dependent properties of magnetic iron oxide nanocrystals
A.
Demortière
,
P.
Panissod
,
B. P.
Pichon
,
G.
Pourroy
,
D.
Guillon
,
B.
Donnio
* and
S.
Bégin-Colin
*
Institut de Physique et Chimie des Matériaux (IPCMS), UMR 7504 Université de Strasbourg-CNRS, 23, rue du Loess, BP 43, 67034, Strasbourg Cedex 2. France. E-mail: begin@ipcms.u-strasbg.fr
First published on 8th November 2010
Abstract
The fine control of iron oxide nanocrystal sizes within the nanometre scale (diameters range from 2.5 to 14 nm) allows us to investigate accurately the size-dependence of their structural and magnetic properties. A study of the growth conditions of these nanocrystals obtained by thermal decomposition of an iron oleate precursor in high-boiling point solvents has been carried out. Both the type of solvent used and the ligand/precursor ratio have been systematically varied, and were found to be the key parameters to control the growth process. The lattice parameters of all the nanocrystals deduced from X-ray diffraction measurements are consistent with a structure of the type Fe3−xO4, i.e. intermediate between magnetite and maghemite, which evolves toward the maghemite structure for the smallest sizes (x = 1/3). The evolution of the magnetic behavior with nanoparticle sizes emphasizes clearly the influence of the surface, especially on the saturation magnetization Ms and the magneto-crystalline anisotropy K. Dipolar interactions and thermal dependence have been also taken into account in the study on the nanoscale size-effect of magnetic properties.
Introduction
Nanosized materials are a subject of intense research due to their high potential for the development of future magnetic or optical devices. Among them, magnetic nanocrystals (NCs) are currently a key material for advancement in several application fields such as permanent magnets,1,2 recording media,3,4 biomedical (diagnosis and therapy).5,6 A crucial and inevitable step for the development of all these applications is the control of the size, the composition and the morphology that impact on the final properties of the nano-objects and their performances. For instance, for the promising magnetic hyperthermia cancer therapy, superparamagnetic NCs with perfectly controlled size and shape are essential to lead to efficient hyperthermia agents.7,8 Similarly, in magnetic recording devices, the efficiency of magnetoresistive sensors based on strong spin-selective tunneling effect has been demonstrated to be enhanced by the use of small magnetite nanoparticles with narrow size distribution; indeed Fe3O4 NCs organized in films have shown extremely promising MR values.9,10 Currently, the real challenge is to control the crystal size at the atomic scale as thin-films obtained by atomic layer deposition.5,11 Below a critical size, Dc, i.e. diameter D ≈ 25 nm for magnetite Fe3O4,12 NCs act as magnetic single domain particles and show specific behaviors such as surface spin canting,13 superspin glass behavior14 and large surface anisotropies.15 Indeed, significant changes are due to the fraction of atoms on the particle surface and the environment of these surface atoms that can induce a modification of the number and symmetry of coordination. For instance, Billas et al. observed a magnetic moment of 2.7 µB per atoms for a Fe cluster of 300 atoms whereas the bulk value is of 2.2 µB per atoms.16 Morales et al.17 showed a strong increase of the magneto-crystalline anisotropy for D-value of 5 nm in Fe3O4 NCs: 4.7 × 10⁵ erg cm−3 compared to the bulk value of 1.1–1.3 × 10⁵ erg cm−3. Furthermore, in an assembly of uniform NCs, it is required to take into account dipolar interactions that affect substantially the magnetic behavior. For systems having strong inter-particle interactions, the parameters deduced from magnetic measurements such as the blocking temperature and saturation magnetization can be thus drastically modified.18,19 Indeed, for a given nanoparticle size, different magnetic values have been often reported making difficult a clear understanding of the size–magnetic property relationships. Therefore, the absolute control of the size and size distribution of nanoparticles appears as the key parameters prior to a proper investigation of the size-dependence of magnetic crystals.During the last two decades, several colloidal synthetic routes have been developed to produce NCs with accurate control of the size and narrow size distribution in a large variety of materials.20,21 One of them is the thermal decomposition of coordination metal complexes in a high-boiling solvent in the presence of co-surface ligands. Monodisperse magnetic crystals such as Co,22CoPt,23Fe,24 and Fe3O425 have been prepared according to this procedure by heating-up26 or hot injection.27 In particular, iron oxide magnetic nanoparticles with narrow size distribution have been obtained by thermal decomposition of different metal–organic complex precursors, such as for example Fe(CO)5,28,29iron oleate30–32 and iron acetylacetonate.33 In general, the ligands are mainly a mixture of oleic acid and oleylamine. This chemical synthetic approach permits further finer adjustments of the initial reaction conditions in order to obtain a large modulation in size,26 shape32 and composition.34 Moreover, varying the surfactant and the heating conditions allows to obtain different morphologies.35,36 Recently Roca et al. have demonstrated that NCs synthesized by thermal decomposition exhibit higher crystal order in comparison with NCs synthesized by co-precipitation and practically no canting of magnetic moments.37
We report thereafter, the synthesis of oleate-coated magnetic iron oxide NCs with a large range of sizes by tuning the conditions of the thermal decomposition of an iron oleate complex in the presence of oleic acid used as a single ligand.31 A systematic study on the different synthetic parameters allows us to control the size from 2.5 to 14 nm with great accuracy. The investigations of the structural and magnetic properties according to the average diameter of NCs have been carried out. The impact of the surface crystal variation on the different magnetic parameters such as the surface anisotropy, the spin-wave stiffness and the Curie temperature has been evaluated.
Experimental section
Chemical and apparatus
Di-n-hexyl ether (97%, Fluka), hexadecene (99%, Fluka), di-benzyl ether (99%, Aldrich), octadecene (90%, Aldrich), eicosene (90%, Fluka), di-n-octyl ether (99%, Aldrich), FeCl3·6H2O (97%, Aldrich), sodium oleate (97%, TCI), oleic acid (99%, Alfa-Aesar), ethanol, and hexane were used as received.Transmission electron microscope (TEM), X-ray diffraction (XRD) and SQUID magnetometer were applied to characterize the size, structure and magnetic properties of synthesized nanocrystals. TEM images were obtained using a TopCon LaB6 microscope operating at 200 kV. TEM samples were prepared by depositing a drop of nanoparticle solution (hexane) on carbon-coated copper grids placed on a filter paper. Powder XRD measurements were performed on a Siemens D500 X-ray diffraction system in reflection mode with a quartz monochromator (Co Kα1 = 1.7890 Å). Magnetic properties were measured using a superconducting quantum interference device (SQUID, Quantum Design MPMS-XL model) in the temperature range from 5 to 300 K. A magnetic field of 75 G was applied during the zero field cooled and field cooled measurements. Hysteresis loops were recorded at 5 K for powders of nanocrystals.
Synthesis of iron–oleate complex
The metallic complex was prepared from sodium oleate and iron chloride. FeCl3·6H2O (7.37 g, 27.3 mmol) was dissolved in a mixture of H2O (Milli-Q, 60 mL) and ethanol (80 mL). Sodium oleate (25 g, 81.9 mmol) dissolved in hexane (140 mL) was mixed with the Fe(III) solution. The resulting biphasic solution was refluxed at 70 °C for 4 h under vigorous stirring. Then, the organic phase containing the iron complex was separated, washed three times with distilled water (3 × 30 mL) in a separatory funnel to extract salts, dried using MgSO4, and finally hexane was evaporated. The resulting waxy solid was then stored at 4 °C.Synthesis of iron oxide nanocrystals
Fe(oleate)3 (1 g, 1.1 × 10⁻³ mol) and oleic acid (0.35 mL, 1.1 × 10⁻³ mol) were added to octyl ether (bp 287 °C, 20 mL) in a two-neck round-bottom flask. A heating mantle, covering the flask to its equator to heat the flask uniformly, was used. The solution was heated to 290 °C with a heating rate of 5 °C min−1 without stirring, and then was refluxed for 1 h at this temperature under air. After cooling the reaction mixture to room temperature, the NCs were washed 3 times by addition of excess of ethanol and centrifugation (8000 rpm, 10 min). The crystal solutions were dispersed in 5 mL of hexane and finally a last centrifugation was performed to eliminate unstable nanoparticles or aggregates in solution. In order to evaluate the temperature effect on the formation of magnetic iron oxide NCs, the procedure was tested in various solvents, with different boiling points (bp): di-n-hexyl ether (bp 228 °C), hexadecene (bp 274 °C), dibenzyl ether (bp 298 °C), octadecene (bp 317 °C), and eicosene (bp 330 °C) (Fig. 1).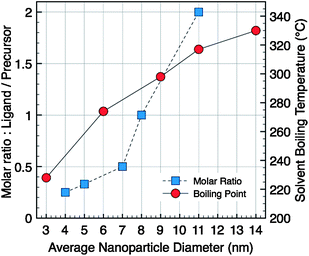 | ||
| Fig. 1 Evolution of the average particles diameter versus molar ratio (ligand/precursor) in di-n-octyl ether as solvent (square) or versussolvent boiling temperature (circle). | ||
Results and discussion
Synthesis and characterization
The iron oxide NCs (Fe3−xO4) were prepared via the thermal decomposition of Fe(oleate)3 in a high-boiling point solvent in the presence of oleic acid as stabilizing agent. In the presence of oleic acid, the solution of Fe(oleate)3 is stable over a wide temperature interval and starts to decompose at around 220 °C. The standard conditions of synthesis, using the di-n-octyl ether (bp 287 °C) as solvent, and a molar ratio between the oleic acid and the metallic precursor equal to one (r = 1), allow to obtain spherical NCs with an average diameter 〈D〉 = 8 nm and a size distribution σ = 15%. The type of solvent and the ligand/precursor ratio have been tuned to solely synthesize spherical size-controlled NCs; all the syntheses were performed with the following reaction conditions (r = 1, rate 5 °C min−1, 1 h). The systematic evolution of the average NC diameter with the boiling point of the solvent used, starting with 3 nm particle-size in di-n-hexyl ether to 14 nm ones in eicosene, is plotted in the graph, Fig. 1. The choice of organic solvent following the bp allows us to produce NCs in a large range of sizes.31The synthesis of colloidal nanoparticles involves classically two main steps: (i) the nucleation step, i.e. the formation of nuclei, and (ii) the growth step, i.e. the growth of these nuclei.38 According to the standard LaMer theory, the activation energy of the nucleation process is much higher than that of the growth process.39 Both the nucleation and growth steps take place at different temperatures: the nucleation has been reported to occur in the temperature range 200–275 °C triggered by the dissociation of one oleate ligand from the oleate precursor and the major growth occurs at around 300–330 °C.31,32 The nucleation rate is more sensitive to temperature variations compared to the growth rate which essentially depends on reaction time. For solvents with boiling points close to the beginning of the nucleation, as in the case of di-n-hexyl ether, the nucleation is favored whereas the growth activation is low. Consequently, NCs with an average size of 3 nm and a polydispersity of 6% are obtained. However, under these heating conditions, the thermal decomposition rate is low and the reaction yield is low: only a part of the precursors is decomposed and then converted into NCs. On the contrary, in solvent with boiling points higher than the onset of the nucleation step, the growth is strongly activated. Thus, the size of NCs increases with the solvent boiling points.31,32,36 We further demonstrate here that the increase of the average diameter is continuous and quasi-linear with the bp of the solvents. However, it is important to notice that the cleaning procedure is more difficult in alkene solvents than in ether ones, a real drawback to further uses of these specific sizes of NCs.
On the other hand, from the standard synthetic conditions, the molar ratio ligand/precursor was varied to further tune the particle size. As shown in Fig. 1, the evolution of the average diameter (4–11 nm) is also strongly dependent on the ratio value (varied from 0.25 to 2). An increase in the ligand concentration results in the increase of the average diameter. As a representative example, TEM images show NCs with 11 and 5 nm diameters (Fig. 2B and D) with a narrow size distribution. In fact the increase in the ligand concentration slows down the nucleation step and the size is controlled by the growth step only.32 The higher is the amount of ligand, the smaller is the number of nuclei and therefore their growth is favored leading to higher sizes. The oleic acid molecules should react with the precursor and induce the formation of more stable complexes than the initial molecule precursor (Fe(oleate)3) which slows down the nucleation step. Such a behavior has already been observed for CoPt NCs upon the addition of ACA molecules, which enhance the thermal stability of cobalt carbonyl,40 or as reported for the synthesis of γ-Fe2O3 from iron carbonyl with TOPO.41 Moreover, in Fig. 1 a strong increase in the nanocrystal size above the ratio r = 0.5 is observed. This behavior can be explained by a change in the type of formed stable complex (dimer or trimer) with individual metal atoms, which modifies the monomer oversaturation. Thus the variation of this ratio allows also to finely address the nanoparticles size.
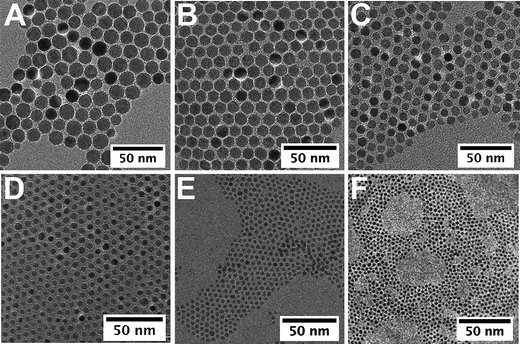 | ||
| Fig. 2 TEM images of iron oxide nanocrystals of 14 nm (eicosene, r = 1) (A), 11 nm (di-n-octyl ether, r = 2) (B), 9 nm (dibenzyl ether, r = 1) (C), 5 nm (di-n-octyl ether, r = 0.3) (D), 3.5 nm (hexadecene, r = 0.5) (E), and 2.5 nm (di-n-hexyl ether, r = 0.5) (F). | ||
The smallest nanocrystals were obtained by combining both “low-boiling” solvents and low ratio, i.e.r = 0.5. When hexadecene with a ligand/precursor ratio of 0.5 was used, magnetic iron oxide NCs of 3.5 nm were obtained with a narrow polydispersity (8%) (Fig. 2E) whereas NCs of 2.5 nm of diameter are obtained when synthesized from di-n-hexyl ether and r = 0.5 (Fig. 2F). Both parameters seem to add up to allow reaching a size close to 2 nm. These investigations show that this synthetic route presents a great flexibility and allows tuning finely the particle size within a large range and reaching in particular very small sizes interesting for magnetic properties.
The crystalline structures of the as-synthesized iron oxide NCs were characterized by X-ray diffraction: the XRD patterns of NCs of size in the range 2.5 and 14 nm are shown in Fig. 3. The diffraction peaks were easily indexed in the fcc inverse spinel structure of the iron oxide.
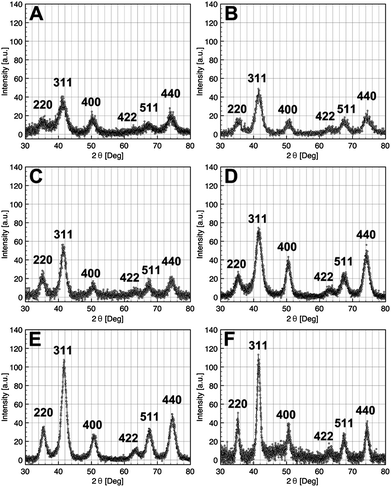 | ||
| Fig. 3 X-Ray diffraction pattern of iron oxide NCs with diameters 2.5 nm (A), 3.5 nm (B), 5 nm (C), 9 nm (D), 11 nm (E), and 14 nm (F). | ||
As the average size of NCs is getting smaller, the XRD peaks become larger as shown in Fig. 3A. From the FWHM of the peak (311), the Scherrer equation has been used to estimate the mean crystallite diameter of the nearly spherical magnetic iron oxide NCs. These crystallite size values are in good agreement with those measured by TEM (see Table 1).
The lattice parameters were calculated from XRD pattern, and depending on the size, intermediate values between those of the maghemite γ-Fe2O3 and magnetite Fe3O4 were obtained. For NCs of 14 nm, the lattice parameter is very close to that of magnetite (a = 8.396 Å, JCPDS 19-0629) (Table 1). Accordingly, the lattice parameters tend toward that of maghemite (a = 8.3461 Å, JPCDS 39-1346) with the particle size decrease, as for example the value of a = 8.360 Å for NCs of 2.5 nm. Consequently, it is observed that the oxidation is strongly dependent on the crystal size.30,42–44 Here, for the smallest NCs, the maghemite appears to be the major phase whereas the opposite is true on increasing the particle size, i.e. the a parameter tends to that of the magnetite phase, as shown in Table 1. An oxidized structure Fe3−xO4 is thus consistent with the intermediate obtained values of lattice parameters and the structure may be described as a core–shell structure with Fe3O4 as the core and γ-Fe2O3 as the shell, in agreement with other data reported in the literature.44 Below 5 nm, the value of the lattice parameter is quasi constant indicating that the nanocrystals are quite fully oxidized in γ-Fe2O3.
Magnetic properties
The study of the magnetic properties of NCs has been carried out by SQUID magnetometry. Fig. 4 shows ZFC/FC curves measured at 75 Oe from 5 to 300 K. The ZFC/FC curves are characteristic of superparamagnetic nanoparticles. The broadening of the ZFC curves and the splitting of ZFC and FC curves for the largest nanoparticles are related to the largest polydispersity in size for these nanoparticles (Table 1) which induces a distribution of blocking temperature. The fact that FC curves do not reach a plateau as soon as Tb is reached suggests that the dipolar interactions are not prevailing in our samples. The corresponding magnetization loops at 5 K are shown in the inset of Fig. 4 whilst the dependence of the saturation magnetization with the average diameter of NCs is displayed in Fig. 5. The sample with the smallest diameter, 2.5 nm, exhibits a saturation magnetization of 29 emu g−1 that is a typical value for γ-Fe2O3 nanoparticles with a size of about 3 nm.45 With increasing diameter, Ms increases due to a direct size effect, the surface to volume ratio, and probably also due to the modification of the crystalline phase, also related to the size. For the largest nanocrystals (14 nm), Ms = 77 emu g−1 is close to bulk value (74 emu g−1 for γ-Fe2O3, 90 emu g−1 for Fe3O4).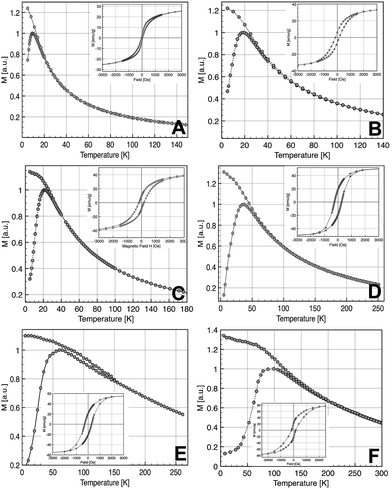 | ||
| Fig. 4 ZFC/FC curves (inset hysteresis loop recorded at 5 K) of the NCs with diameters 2.5 nm (A), 3.5 nm (B), 5 nm (C), 9 nm (D), 11 nm (E), and 14 nm (F). | ||
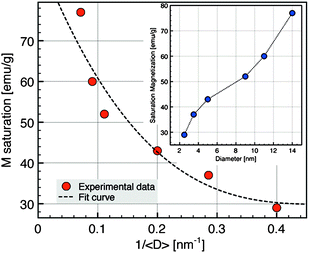 | ||
| Fig. 5 Saturation magnetization evolution as a function of nanocrystal diameters at 5 K. | ||
The values of magnetic moment per nanoparticle (Table 2) have been calculated from the saturation magnetization at 5 K and the average diameter deduced from TEM.
| 〈D〉/nm | D/meV Å2 | J/kB/K | T C/K | m NP/µB |
|---|---|---|---|---|
| 05 | 290 | 10 | 600 | 1500 |
| 09 | 400 | 14 | 750 | 10![[thin space (1/6-em)]](https://www.rsc.org/images/entities/char_2009.gif) 300 300 |
| 11 | 610 | 20 | 830 | 21600 |
The variation of the saturation magnetization versus the average diameter of NCs has been fitted considering the contributions of a surface component and a volume component according to a core–shell model using the following relation:
| M = (MShl × VShl + MCor × VCor)/Vtot | (1a) |
| M = MShl + (MCor − MShl)(1 − 2e/D) | (1b) |
At high temperatures, all samples exhibit a superparamagnetic behavior. The blocking temperature (TB), at the maximum of the ZFC curve, increases continuously with the increase of the average size of the NCs: 10 K (2.5 nm), 18 K (3.5 nm), 22 K (5 nm), 36 K (9 nm), 61 K (11 nm) and 100 K (14 nm). The broadening of the ZFC curves for the largest diameters (11 and 14 nm) can be explained by substantial spreading of size distribution. The determination of TB allows an estimation of the mean energy barrier using the classical formula14
| EB = ln (t0/τ0)kBTB | (2) |
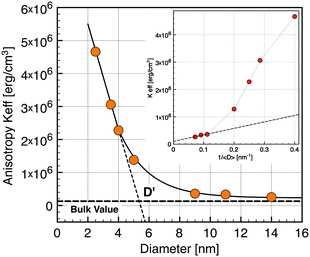 | ||
| Fig. 6 Effective anisotropy versusnanocrystal diameter. (Inset) Keffvs. inverse diameter. Horizontal dashed line exhibits the value for the bulk magnetite. | ||
In the simplest approximation, the effective anisotropy constant14 can be written as the sum of a volume term KV and a surface term KS according to the phenomenological expression:
| Keff = KV + (6Φ/D)KS | (3) |
Interactions between particles have been neglected in our analysis. It is known that such interactions increase the value of the blocking temperature.51,52 Hence it could be argued that the values of Keff have been overestimated. In order to estimate the influence of dipolar interactions, the dynamics of the blocking process has been studied in more detail by AC susceptibility measurements. The temperature variation of χ(ω,T) has been measured at fixed frequencies between 1 Hz and 1 kHz. The component χ′(T) and χ″(T) of the magnetic susceptibility of nanocrystals of 5 nm at different excitation frequencies are displayed in Fig. 7. χ″(T) exhibits a maximum at a temperature Tω that increases with increasing frequency. For a single domain nanoparticle the thermal reversal of the magnetic moment over the anisotropy energy barrier leads to a relaxation time τ characterized by the Arrhenius law14
| τ(T) = τ0 exp (EB/kBT) | (4) |
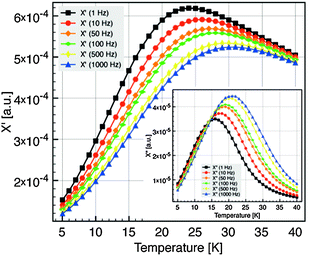 | ||
| Fig. 7 Component χ′(T) and χ″(T) (inset) of the magnetic susceptibility at different excitation frequencies, for the 5 nm diameter NC. | ||
The plot of ln (τ) = ln (1/ω) versus of 1/Tω (Fig. 8) is a straight line, consistent with an Arrhenius law, from which we deduce the mean energy barrier EB = 480 K and the intrinsic jump time τ0 = 5.3 × 10⁻¹³ s. The plot does not show any deviation that could indicate the presence of interactions although τ0 is rather short. From the value of EB we obtain an effective anisotropy value of Keff = 1 × 10⁶ erg cm−3 in good agreement with the value deduced from the ZFC measurement.
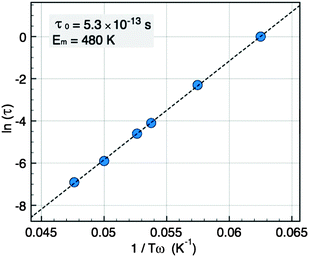 | ||
| Fig. 8 Arrhenius plot of the relaxation time τversus the peak temperatures Tω for NCs of 5 nm. | ||
In fact the strength dipolar interaction energy between spheres14 can be estimated according to
| Edd/kB = (µ0/4πkB)(m2NP/d3) | (5) |
After the size-dependence of the magnetization and the anisotropy of the particles, we also investigated the thermal variation of the particle magnetization for different sizes.
The variation of the saturation magnetization with temperature for the samples of 5, 9, and 11 nm was deduced from data recorded at H = 30 kOe and corrected according to a Langevin field dependence in the superparamagnetic regime (Fig. 9). The thermal decrease of the magnetization between 5 and 300 K was fitted to a spin-wave-type dependence (Bloch law):
| MS(T) = MS(0)[1 − B0Tβ] | (6) |
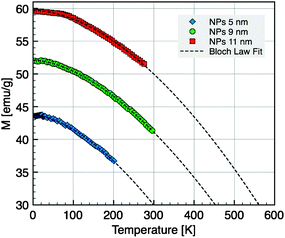 | ||
| Fig. 9 Magnetization versus temperature for NC diameters of 5 nm, 9 nm and 11 nm taken at H = 30 kOe. The dashed line is the fit according to the Bloch law. | ||
In the simple spin-wave theory,59 the Bloch constant values lead to the determination of spin-wave stiffness constant D through the following expression:
| D = (2.612)2/3[gµB/MS(0)B0]2/3(kB/4π) | (7) |
Conclusion
We demonstrated the influence of the type of solvent and the ratio ligand/precursor on the nanocrystal growth mechanism and the possibility to combine these two experimental parameters to obtain very small iron oxide NCs. TEM and XRD measurements revealed that the NCs have a structure intermediate between maghemite and magnetite, of the type Fe3−xO4 for all the sizes, which evolves toward the structure of γ-Fe2O3 for the smallest sizes. High quality iron oxide NCs with narrow size distribution and average particle size between ∼2 nm up to 14 nm have been thus obtained, allowing subsequent investigations of their size-dependent magnetic properties. We have demonstrated that the surface influence is predominant on the values of the magneto-crystalline anisotropy and magnetization. It was found that a surface magnetization of 30 emu g−1 associated to a thickness of 1 nm implies that it is necessary to consider a shell to describe the surface influence. The AC measurement revealed only a weak impact of the role of dipolar interactions on the magnetic behavior for the small size materials. Finally, it is showed that the evolution of the J exchange integrals is indicative of a decrease of the atom coordination in NCs.Acknowledgements
The authors thank the CNRS, the University of Strasbourg, and the National Agency for Research (ANR DENDRIMAT) for funding, and Alain Derory (SQUID) for technical support.References
- G. S. Chaubey, V. Nandwana, N. Poudyal, C.-B. Rong and J. P. Liu, Chem. Mater., 2008, 20, 475 CrossRef CAS.
- I. Anton, I. de sabata and L. Vekas, J. Magn. Magn. Mater., 1990, 85, 219 CrossRef CAS.
- D. Weller and T. McDanie, Advanced Magnetic Nanostructures, 2006, vol. 11 Search PubMed.
- A. Demortière and C. Petit, Langmuir, 2007, 23, 8575 CrossRef CAS.
- Y. Jun, J.-H. Lee and J. Cheon, Angew. Chem., Int. Ed., 2008, 47, 5122 CrossRef CAS.
- S. Mornet, S. Vasseur, F. Grasset and E. Duguet, J. Mater. Chem., 2004, 14, 2161 RSC.
- K. Hayashi, M. Moriya, W. Sakamoto and T. Yogo, Chem. Mater., 2009, 21, 1318 CrossRef CAS.
- J.-P. Fortin, C. Wilhelm, J. Servais, C. Menager, J. C. Bacri and F. Gazeau, J. Am. Chem. Soc., 2007, 129, 2618.
- P. Poddar, T. Fried and G. Markovich, Phys. Rev. B: Condens. Matter Mater. Phys., 2002, 65, 172405 CrossRef.
- H. Zeng, C. T. Black, R. L. Sandstrom, P. M. Rice, C. B. Murray and S. Sun, Phys. Rev. B: Condens. Matter Mater. Phys., 2006, 73, 020402 CrossRef.
- M. P. Pileni, J. Phys. Chem. C, 2007, 111, 9019 CrossRef CAS.
- K. M. Krishnan, A. B. Pakhomov, Y. Bao, P. Blomqvist, Y. Chun, M. Gonzales, K. Griffin, X. Ji and B. K. Roberts, J. Mater. Sci., 2006, 41, 793 CrossRef CAS.
- A. G. Roca, D. Niznansky, J. Poltierova-Vejpravova, B. Bittova, M. A. González-Fernández, C. J. Serna and M. P. Morales, J. Appl. Phys., 2009, 105, 114309 CrossRef.
- S. Bedanta and W. Kleemann, J. Phys. D: Appl. Phys., 2009, 42, 013001 CrossRef.
- M. Jamet, W. Wernsdorfer, C. Thirion, D. Mailly, V. Dupuis, P. Mélinon and A. Pérez, Phys. Rev. Lett., 2001, 86(20), 4676 CrossRef CAS.
- I. M. L. Billas, A. Chatelain and W. A. de Heer, Science, 1994, 265, 1682 CrossRef.
- G. F. Goya, T. S. Berquo, F. C. Fonseca and M. P. Morales, J. Appl. Phys., 2003, 94(5), 3520 CrossRef CAS.
- P. Poddar, T. Telem-Shafir, T. Fried and G. Markovich, Phys. Rev. B: Condens. Matter Mater. Phys., 2002, 66, 060403 CrossRef.
- S. A. Majetich and M. Sachan, J. Phys. D: Appl. Phys., 2006, 39, 407.
- V. F. Puntes, K. M. Krishnan and A. P. Alivisatos, Science, 2001, 291(5511), 2115 CrossRef CAS.
- B. A. Korgel and D. Fitzmaurice, Adv. Mater., 1999, 10(9), 661.
- V. F. Puntes, K. M. Krishnan and P. Alivisatos, Appl. Phys. Lett., 2001, 78(15), 2187 CrossRef CAS.
- X. Sun, Z. Y. Jia, Y. H. Huang, J. W. Harrell, D. E. Nikles, K. Sun and L. M. Wang, J. Appl. Phys., 2004, 95(11), 6747 CrossRef CAS.
- S. Peng, C. Wang, J. Xie and S. Sun, J. Am. Chem. Soc., 2006, 128(33), 10676 CrossRef CAS.
- S. Sun, H. Zeng, D. B. Robinson, S. Raoux, P. M. Rice, S. X. Wang and G. Li, J. Am. Chem. Soc., 2004, 126, 273 CrossRef CAS.
- S. G. Kwon, Y. Piao, J. Park, S. Angappane, Y. Jo, N.-M. Hwang, J.-G. Park and T. Hyeon, J. Am. Chem. Soc., 2007, 129(41), 12571 CrossRef CAS.
- D. V. Talapin, A. L. Rogach, A. Kornowski, M. Haase and H. Weller, Nano Lett., 2001, 1(4), 207 CrossRef CAS.
- T. Hyeon, S. S. Lee, J. Park, Y. Chang and H. B. Na, J. Am. Chem. Soc., 2001, 123(51), 12798 CrossRef CAS.
- K. Woo, J. Hong, S. Choi, H.-W. Lee, J.-P. Ahn, C. Sung Kim and S. Won Lee, Chem. Mater., 2004, 16, 2814 CrossRef CAS.
- J. Park, E. Lee, N.-M. Hwang, M. Kang, S. C. Kim, Y. Hwang, J.-G. Park, H.-J. Noh, J.-Y. Kim, J.-H. Park and T. Hyeon, Angew. Chem., Int. Ed., 2005, 44(19), 2872 CrossRef CAS.
- J. Park, K. An, Y. Hwang, J.-G. Park, H.-J. Noh, J.-Y. Kim, J.-H. Park, N.-M. Hwang and T. Hyeon, Nat. Mater., 2004, 3, 891 CrossRef CAS.
- L. M. Bronstein, X. Huang, J. Retrum, A. Schmucker, M. Pink, B. D. Stein and B. Dragnea, Chem. Mater., 2007, 19, 3624 CrossRef CAS.
- S. Sun and H. Zeng, J. Am. Chem. Soc., 2002, 124(28), 8204 CrossRef CAS.
- N. Bao, L. Shen, P. Padhan and A. Gupta, Appl. Phys. Lett., 2008, 92, 173101 CrossRef.
- J. Cheon, N. J. Kang, S.-M. Lee, J.-H. Yoon and S. Jun Oh, J. Am. Chem. Soc., 2004, 126, 1950 CrossRef CAS.
- M. V. Kovalenko, M. I. Bodnarchuk, R. T. Lechner, G. Hesser, F. Schaffler and W. Heiss, J. Am. Chem. Soc., 2007, 129, 6352 CrossRef CAS.
- A. G. Roca, D. Niznansky, J. Poltierova-Vejpravova, B. Bittova, M. A. Gonzales-Fernandez, C. J. Serna and M. P. Morales, J. Appl. Phys., 2009, 105, 114309 CrossRef.
- A. E. Saunders, M. B. Sigman, Jr and B. A. Korgel, J. Phys. Chem. B, 2004, 108, 193 CrossRef CAS.
- T. Sugimoto, Monodisperse Particles, Elsevier, 2001 Search PubMed.
- E. V. Shevchenko, D. V. Talapin, H. Schnablegger, A. Kornowski, Ö. Festin, P. Svedlindh, M. Haase and H. Weller, J. Am. Chem. Soc., 2003, 125(30), 9090 CrossRef CAS.
- S.-J. Park, S. Kim, S. Lee, Z. G. Khim, K. Char and T. Hyeon, J. Am. Chem. Soc., 2000, 122(35), 8581 CrossRef CAS.
- C. Martínez-Boubeta, K. Simeonidis, M. Angelakeris, N. Pazos-Pérez, M. Giersig, A. Delimitis, L. Nalbandian, V. Alexandrakis and D. Niarchos, Phys. Rev. B: Condens. Matter Mater. Phys., 2006, 74, 054430 CrossRef.
- T. J. Daou, G. Pourroy, S. Bégin-Colin, J. M. Grenèche, C. Ulhaq-Bouillet, P. Legaré, P. Bernhardt, C. Leuvrey and G. Rogez, Chem. Mater., 2006, 18(18), 4399 CrossRef CAS.
- T. J. Daou, J. M. Grenèche, G. Pourroy, S. Buathong, A. Derory, C. Ulhaq-Bouillet, B. Donnio, D. Guillon and S. Bégin-Colin, Chem. Mater., 2008, 20, 5869 CrossRef CAS.
- M. P. Morales, M. Andres-Verges, S. Veintemillas-Verdaguer, M. I. Montero and C. J. Serna, J. Magn. Magn. Mater., 1999, 203(146), 148.
- J. L. Dormann, D. Fiorani and E. Tronc, Adv. Chem. Phys., 1997, 98, 283 CAS.
- R. Yanes, O. Chubykalo-Fesenko, H. Kachkadi, D. A. Garanin, R. Evans and R. W. Chantrell, Phys. Rev. B: Condens. Matter Mater. Phys., 2007, 76, 064416 CrossRef.
- R. Yanes and O. Chubykalo-Fesenko, J. Phys. D: Appl. Phys., 2009, 42, 055013 CrossRef.
- F. Bodker, S. Morup and S. Linderoth, Phys. Rev. Lett., 1994, 72, 282 CrossRef.
- V. P. Shilov, Yu. L. Raikher, J.-C. Bacri, F. Gazeau and R. Perzynski, Phys. Rev. B: Condens. Matter Mater. Phys., 1999, 60(17), 11902 CrossRef CAS.
- D. Kechrakos and K. N. Trohidou, Phys. Rev. B: Condens. Matter Mater. Phys., 1998, 58, 12169 CrossRef CAS.
- D. Kechrakos and K. N. Trohidou, J. Magn. Magn. Mater., 1998, 177, 943 CrossRef.
- P. V. Hendriksen, S. Linderoth and P. A. Lindgard, J. Magn. Magn. Mater., 1992, 104, 1577 CrossRef.
- A. T. Ngo, P. Bonville and M. P. Pileni, J. Appl. Phys., 2001, 89(6), 3370 CrossRef.
- J. P. Chen, C. M. Sorensen, K. J. Klabunde, G. C. Hadjipanayis, E. Devlin and A. Kostikas, Phys. Rev. B: Condens. Matter, 1996, 54(13), 9288 CrossRef CAS.
- D. Zhang, K. J. Klabunde, C. M. Sorensen and G. C. Hadjipanayis, Phys. Rev. B: Condens. Matter Mater. Phys., 1998, 58(21), 14167 CrossRef CAS.
- B. Martinez, A. Roig, X. Obradors, E. Molins, A. Rouanet and C. Monty, J. Appl. Phys., 1996, 79, 2580 CrossRef CAS.
- C.-B. Rong, D. Li, V. Nandwana, N. Poudyal, Y. Ding, Z. L. Wang, H. Zeng and J. P. Liu, Adv. Mater., 2006, 18, 2984 CrossRef CAS.
- R. Hasegawa and R. Ray, Phys. Rev. B: Condens. Matter, 1979, 20(1), 211 CrossRef CAS.
- B. Martinez, A. Roig, X. Obradors, E. Molins, A. Rouanet and C. Monty, J. Appl. Phys., 1996, 79(5), 2580 CrossRef CAS.
- C. M. Srivastava, G. Srinivasan and N. G. Nanadikar, Phys. Rev. B: Condens. Matter, 1979, 19(1), 499 CrossRef CAS.
- H. Kachkachi, A. Ezzir, M. Nogues and E. Tronc, Eur. Phys. J. B, 2000, 14, 681 CrossRef CAS.
- A. Demortière, S. Buathong, B. P. Pichon, D. Guillon, S. Bégin-Colin and B. Donnio, Small, 2010, 12, 1341 CrossRef.
| This journal is © The Royal Society of Chemistry 2011 |