 Open Access Article
Green synthesis of ultrathin 2D nanoplatelets, hematene and magnetene, from mineral ores in water, with strong optical limiting performance†
Apostolos
Koutsioukis
a,
Georgios
Florakis
a,
Nikolaos
Samartzis
 b,
Spyros N.
Yannopoulos
b,
Michalis
Stavrou
bc,
Dionysia
Theodoropoulou
bc,
Nikolaos
Chazapis
bc,
Stelios
Couris
b,
Spyros N.
Yannopoulos
b,
Michalis
Stavrou
bc,
Dionysia
Theodoropoulou
bc,
Nikolaos
Chazapis
bc,
Stelios
Couris
 bc,
Argiris
Kolokithas-Ntoukas
d,
Georgios
Asimakopoulos
e,
Dimitrios P.
Gournis
 e,
Vasileios
Tzitzios
 f,
Elias
Sakellis
f,
Stylianos F.
Tombros
a,
Sotirios
Kokkalas
g and
Vasilios
Georgakilas
f,
Elias
Sakellis
f,
Stylianos F.
Tombros
a,
Sotirios
Kokkalas
g and
Vasilios
Georgakilas
 *a
*a
aDepartment of Materials Science, University of Patras, Patras 265 04, Greece. E-mail: viegeorgaki@upatras.gr
bFoundation for Research and Technology Hellas-Institute of Chemical Engineering Sciences (FORTH/ICE-HT), 26504 Rio-Patras, Greece
cDepartment of Physics, University of Patras, Patras 265 04, Greece
dDepartment of Pharmacy, School of Health Sciences, University of Patras, 26504 Patras, Greece
eDepartment of Materials Science & Engineering, University of Ioannina, Ioannina 451 10, Greece
fInstitute of Nanoscience and Nanotechnology, National Centre for Scientific Research “Demokritos”, 15310 Athens, Greece
gDepartment of Geology, University of Patras, Patras 265 04, Greece
First published on 26th January 2023
Abstract
Following the long-standing use of the liquid exfoliation of graphite for the production of graphene, a number of analogous van der Waals 2D nanomaterials have been also produced and studied extensively for several applications. Recently, liquid exfoliation has also been applied to isolate non-van der Waals 2D nanostructures. Here, we describe a green procedure for the liquid exfoliation of natural hematite and magnetite – natural iron ores – obtained from the Greek territory. Natural iron ores were exfoliated in a solution of melamine in water under mild sonication. The ultrathin exfoliated nanoplatelets, hematene and magnetene, respectively, form stable dispersions in pure water and have been extensively characterized by spectroscopic and microscopic techniques. Optical limiting experiments reveal the efficiency of the present non-van der Waals 2D nanomaterials, rendering them highly attractive for several applications in opto-electronics and photonics.
Introduction
The successful application of ultrasound for the exfoliation of a 3D structured material into a 2D analogue such as graphite and graphene,1 constituted a milestone in the development of a series of analogous 2D inorganic graphene-like materials such as germanene,2 hexagonal boron nitride (hBN),3 transition metal dichalcogenides,4 metal oxides,5etc.6 The common characteristic of these materials is the presence of layers where atoms are bound by covalent bonding, while the layers interact via van der Waals forces, towards the formation of a 3D structure. For this, such materials are often called van der Waals solids.7 Recently, ultrasound proved to be able to also deconstruct non van der Waals solids such as hematite ore, affording a 2D analogue which is called “hematene”.8 Since then, similar non-van der Waals 2D structures have also been isolated from magnetite, ilmenite and chromite ores.9 The basic idea, that is also exploited here, is that the ultrasound energy is enough to overcome even stronger forces that create the 3D structure of those non van der Waals ores.The prospect of 2D materials is very high especially their potential applications in catalysis, photocatalysis, sensing, water splitting, magnetic storage media, photonics, etc.10 On the other hand, it is very important that their physical and chemical characteristics and properties such as magnetic susceptibility, light absorption, and dispersibility in solvents and conductivity are remarkably altered due to the confinement effect as the thickness of the 2D nanostructures is limited to a few nanometers.11
Inspired by the successful exfoliation of graphite in water that was recently presented,12 we decided to study the behavior of hematite and magnetite ores in water solution under mild sonication. As a first important result of this work, we describe here the successful production of ultrathin 2D nanoplatelets from hematite and magnetite ores in a water solution of melamine, after mild sonication for one hour. The motivation underlying the current work is the use of a green method as regards the solvent used and the low energy consumption of the process. Indeed, the current approach has been successful by employing only water as the solvent for the main treatment as well as for the purification step and a short time (1 hour) sonication in a bath as an energy source.
It is important to note also that this method in the case of hematite produces two different 2D nanoplatelets, which (following the recent literature) are denoted as Hematene I and II. The dispersibility of the two products in water was the crucial difference. Together with the so-called Magnetene that was produced from magnetite ore, the products of our method were fully characterized by spectroscopic (UV-Vis, FT-IR, and Raman) and microscopic techniques (AFM and TEM). By comparison with the corresponding results of similar nanostructures reported in the literature, similarities and differences have been observed. Finally, the present work is a first attempt, to the best of our knowledge, for the assessment of the optical limiting (OL) performance of these materials, in view of photonic applications.
Results and discussion
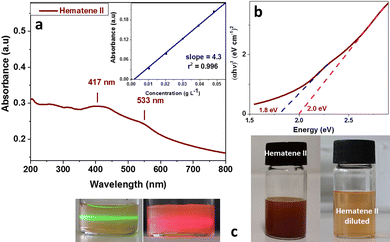
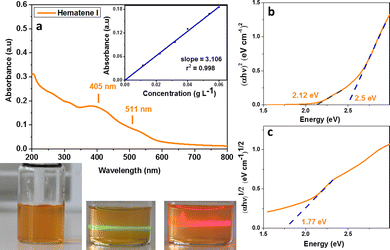
The mild sonication of hematite in a water solution of melamine resulted in the production and isolation of a red orange component (Hematene II, see Fig. 1) with a high yield (∼50%). A yellow orange component was also isolated, as a second product, with much lower yield (∼10%), which exhibited stable dispersion in water at least for two months (Hematene I, see Fig. 2). Hematene II was much less stable in water. The UV-Vis spectroscopic analysis of the products showed that the Hematene II absorption spectrum is characterized by a broad band with a maximum at 417 nm and a shoulder at 533 nm (based on peak analysis, see Fig. S1a, ESI†). The absorption coefficient ε(417) of Hematene II in water was calculated to be 4.31 L cm−1 g−1. Based on the Tauc plot method, Hematene II showed two direct transitions with band gaps at 2.1 and 1.8 eV. Hematene II product was quite similar to that presented recently by Ajayan et al.12 as regards the absorption maxima (λmax above 400 nm) and band gap (2.2 eV). The lower band around 417 nm and the broad shoulder at 533 nm are attributed to the ligand (O2−, 2p) to metal (Fe3+, 3d) charge transfer transitions and ligand field (or d–d) transitions respectively.12,13 Elsewhere, the broad band between 400 and 600 nm is attributed to the pair excitation process.14The yellow orange product that was isolated due to its high hydrophilicity, Hematene I, showed in the UV-Vis absorption spectrum a similar broad band, but blue shifted with a maximum absorption at 405 and a shoulder at 511 nm (see Fig. 2a and peak analysis at Fig. S1b, ESI†). The shifting of the absorption band from 417 nm to 405 nm is due to quantum confinement and indicates that Hematene I consisted of nanostructures with lower thickness and lateral dimensions.11 In accordance, the absorption spectrum of Hematene I exhibited much less reflectance, compared with that of Hematene II (see Fig. 1a and 2a). The absorption coefficient ε(405) of Hematene I in water was calculated to be 3.11 L cm−1 g−1. Hematene I showed two band gaps for direct transitions at 2.5 and 2.12 eV and one for indirect transition at 1.77 eV (see Fig. 2b and c).12
By comparing between the absorption spectra of Hematene I and II, and their absorption coefficients, it is observed that Hematene II exhibits higher optical absorptivity and a much more extended absorption spectrum that exceeds the visible region. This is probably due to increased orbital overlap or a change in the density of states.15
The Raman spectrum of bulk hematite (a-Fe2O3) consists of five internal vibrational modes (2A1g + 3Eg) which involve atomic motions within a single FeO6 octahedral unit, and two external modes (2Eg) which are due to rotations and translations of these units (see Fig. 3).16 These seven modes arise from the transverse optical (TO) branch,17,18 and their energies are situated at ∼225 cm−1 (A1g), ∼245 cm−1 (Eg), ∼295 cm−1 (Eg), ∼300 cm−1 (Eg), ∼410 cm−1 (Eg), ∼500 cm−1 (A1g), and ∼610 cm−1 (Eg). The band detected at ∼1320 cm−1 has been attributed to a two-phonon scattering process,17,19,20 whereas others assign this band to a two magnon scattering.21
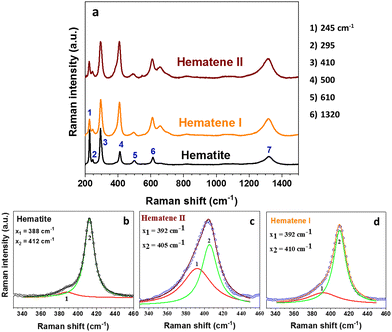 | ||
| Fig. 3 (a) Representative Raman spectra of bulk Hematite and exfoliated Hematene nanoplatelets. Analysis of T mode (peak 1) at bulk hematite (b), Hematene II (c) and Hematene I (d). | ||
The Raman spectra of the exfoliated Hematene crystals bear significant differences in relation to the spectrum of bulk Hematite (see Fig. 3). Certain criteria testifying the success of exfoliation have been suggested based on the change of the relative intensities of selected Raman bands.21 The following spectral changes are revealed by the comparison of the Raman spectra shown in Fig. 3. First, the relative intensity ratio, IA1g/IEg, of the A1g (∼225 cm−1) and the Eg (∼295 cm−1) modes changes significantly. The IA1g/IEg amounts to ∼0.96 for the bulk hematite crystal, while it assumes much lower values of about 0.45 for the exfoliated crystals. Second, the intensity of the Eg mode (∼410 cm−1) of the exfoliated flakes, exhibits a threefold increase compared to the mode at ∼295 cm−1, in relation to the bulk materials. Third, the T mode (peak 1 shown in Fig. 3b–d) becomes much more prominent in the case of the exfoliated samples. This mode has been assigned to the compensation of the surface by oxygen atoms.18,21 In the current case, the relative intensity of this mode ratio seems to be gradually increasing from Hematene I to Hematene II. Fourth, exfoliation significantly increases the intensity of the forbidden Eu mode at ∼660 cm1, which arises from symmetry breaking, from ∼0.19 (bulk Hematite) to ∼0.54 (Hematene I) or 0.6 (Hematene II). The weak intensity of this band in bulk Hematite has been assigned to the polycrystalline nature of the material.22 The above findings, provide solid evidence for the successful exfoliation of a-Fe2O3.21 The peaks at the XRD patterns of Hematene I and II appeared slightly shifted and broader compared with that of the Hematite crystal due to the confinement (see Fig. S2, ESI†).
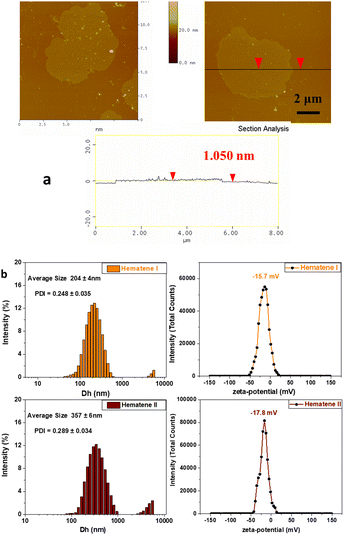
The microscopic analysis of Hematene I showed that it consisted of very thin nanoplatelets with lateral dimensions that exceed 200 nm and thicknesses between 1 and 1.5 nm (see Fig. 4a and Fig. S3, ESI†). The mean size of Hematene I and II nanosheets by DLS analysis was estimated to be 204 ± 4 and 357 ± 6 nm and the zeta potential value was determined to be −15.7 and −17.8 mV (see Fig. 4b).
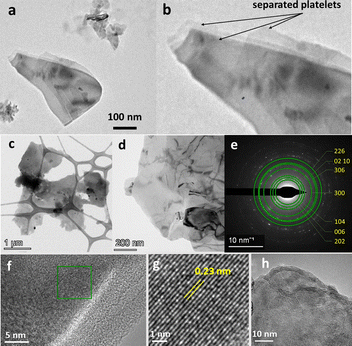
Comparing with Hematene produced from Hematite under sonication in DMF,8 with a thickness between 1 and 4 nm and lateral size of a few micrometers, and melamine assisted exfoliation of hematite in water produced thinner nanoplatelets with much lower lateral dimensions. To confirm the 2D nature, as well as the crystallinity of the corresponding Hematene derivatives, the materials were subjected to transmission electron microscopy (TEM) measurements (Fig. 5 and 6). The low magnification TEM images in both samples indicate clearly the 2D structuring morphology with the formation of single and few layer sheets in the few microns size regime. Furthermore, in both Hematene I and Hematene II samples, the planar d-spacings are 0.23 and 0.25 nm which correspond to the (113) and (110) lattice respectively of the Hematite structure, as evidenced by the high-resolution images (Fig. 5g and 6g). Fig. 5e and 6a present the selected area electron diffraction (SAED) patterns which in both cases indicate the good crystallinity of the exfoliated material.
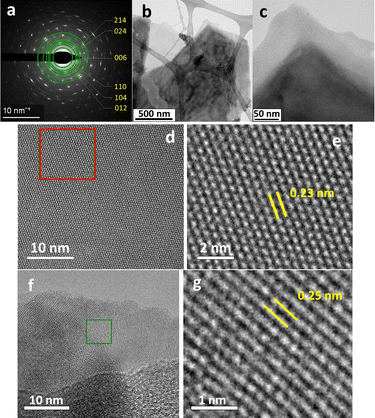 | ||
| Fig. 6 TEM (b–d and f) and HRSTEM (e and g) images and SAED pattern (a) of Hematene II nanoplatelets. | ||
The sonication treatment of Hematite in pure water was also examined. Under the same conditions (sonication time, purification procedure), Hematite in pure water was similarly exfoliated, affording only an orange-red product (named here Hematene-H2O). The UV-Vis spectrum of Hematene-H2O was also very similar to that of Hematene II, regarding λ maxima at 413 and 529 nm (see the peak analysis in Fig. S1c, ESI†), the reflectance and the intensities of the bands (see Fig. 7). In addition, Hematene-H2O showed poor stability in water dispersion.
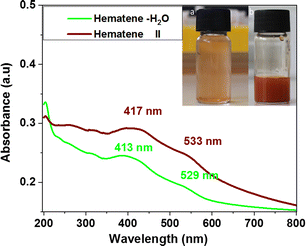 | ||
| Fig. 7 UV-Vis spectra of Hematene II (sonication in melamine solution) and Hematene-H2O (sonication in water). | ||
The above evidence suggests that melamine has a crucial contribution in the yield of Hematene production and moreover in the production of Hematene I, reported for the first time in the literature. The melamine molecules with a parallel position, could interact with the Hemetene surface through π bonding or hydrogen bonds. Although the role of melamine is not fully uncovered, it could be reasonably assumed that the planarity of the molecule, the polar NH2 groups and the hydrophilicity are important factors supporting this mechanism.22
The interaction of the Hematene surface with melamine was examined by FTIR spectroscopy. Hematene (I & II) that was isolated from the liquid phase after the LPE of hematite by filtration, showed characteristic bands of both Hematene and melamine (see Fig. S4, ESI†). A broad band with λmax at 3120 and 3340 cm−1 that appeared in the spectrum of Hematene is evidence for the formation of hydrogen bonds between the NH2 groups of melamine and Hematene surface. The peaks at 590 and 560 cm−1 that are hardly observed at the end of the spectrum belong to Fe–O vibrations of Hematene. Dzade et al.23 have shown that benzene molecules are absorbed on the hematite surface in a similar way resulting in a reduction of its bandgap.
The melamine solution was also used for the sonication of magnetite ore. The water dispersible nanocrystals showed a pale almost colorless liquid phase. The UV-Vis absorption spectrum of the product is presented in Fig. 8a. It consisted of continuous increasing absorption without the existence of a maximum in the UV-Vis region. The AFM image showed that magnetene nanoplatelets have a mean thickness of about 5.4 nm and a size range between 100 and 500 nm (see Fig. 8b). The yield of the magnetene production was close to 10%, much lower in comparison with that of Hematene.
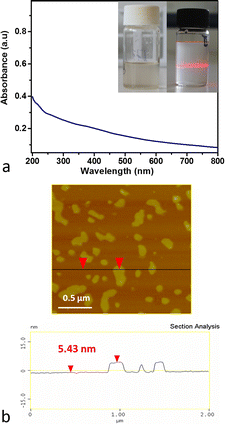 | ||
| Fig. 8 (a) UV-Vis spectrum of magnetene in water. The inset photo shows magnetene dispersion in water (Tyndall effect). (b) AFM image and the height profile of magnetene nanoplatelets. | ||
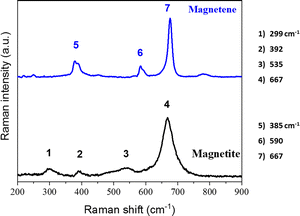
The Raman spectra of bulk magnetite exhibited three main bands located at ∼667 cm−1 (A1g), ∼535 cm−1 (T2g) and ∼299 cm−1 (Eg). A weak band at ∼392 cm−1 that is observed in the spectrum of the bulk magnetite might be related to the existence of FeOOH minorities.24 The Raman spectrum of Magnetene is significantly different than that of the bulk crystal (see Fig. 9). The strongest band is blue-shifted at ∼676 cm−1 and appears much sharper (which indicates high crystallinity), while the bands at ∼535 cm−1 and ∼299 cm−1 are absent. The band at ∼385 cm−1 that is attributed to the FeOOH species becomes more prominent in the case of Magnetene, which could imply an increased surface exposure to the solvent, leading to a higher surface to volume ratio and therefore point towards a successful exfoliation. Lastly, for the case of Magnetene, a new band emerges at ∼590 cm−1 which may be due to wustite (FeO).24
In the case of the exfoliation of magnetite, the low magnification TEM images (Fig. 10a and b) confirm the formation of 2D sheets of Magnetene, while the SAED pattern (inset in Fig. 10c), shows the d-spacings 0.31, 0.24 and 0.21 which correspond to the (220), (311) and (400) planes respectively, in good agreement with the magnetite crystallographic data (JCPDS card No (# 19-0629)). Additionally, the high-resolution image from a different area, Fig. 10d, shows, according to the Fast Fourier Transform (FFT) pattern (as inset), d-space 0.21 nm which corresponds to the (400) crystal lattice of magnetite.
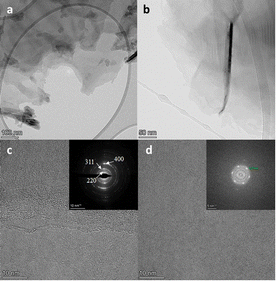 | ||
| Fig. 10 Representative TEM (a and b), and HRTEM (c and d) images of Magnetene sheets. SAED and FFT images presented as insets in the (c) and (d) images respectively. | ||
The OL performance of Hematene I and Magnetene aqueous dispersions was studied under 4 ns, 532 nm laser irradiation. The results are presented in Fig. 11. The dotted straight lines correspond to the samples’ linear transmittance, which was about ∼93% at 532 nm, while the solid lines connecting the experimental data points have been drawn to guide the eye. The neat solvent (i.e., water) did not exhibit any OL for the range of incident laser fluences, Fin, used (i.e., up to ∼1.5 J cm−2). Therefore, the observed OL of the dispersions can be attributed exclusively to the Hematene I and Magnetene nanoplatelets. As can be seen, Hematene I exhibited lower OL onset value than Magnetene, corresponding to a more efficient OL performance. In more detail, the onsets of the optical limiting of Hematene I and Magnetene were determined to be ∼0.34 and ∼0.44 J cm−2, respectively. The enhanced OL performance of Hematene I can be described by considering the optical transitions occurring in these non van der Waals 2D materials. In particular, under 532 nm excitation, Hematene I reveals strong ligand to metal charge transfer (LMCT) and d–d transitions as well, while Magnetene presents only intraband and interband transitions between the Fe 3d bands.25 Therefore, it can be reasonably assumed that the enhanced OL efficiency of Hematene I can be attributed to ligand to metal charge transfer.
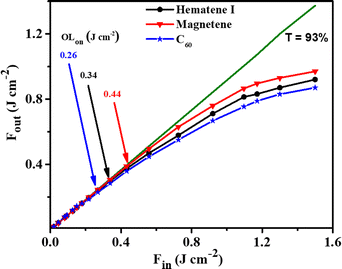 | ||
| Fig. 11 Optical limiting performance of aqueous Hematene I and Magnetene dispersions under 532 nm laser irradiation. The dispersions’ linear transmittance at 532 nm was ∼93%. | ||
For comparison purposes, similar OL measurements were performed on a 1,2-dichlorobenzene fullerene-C60 dispersion, which is generally considered as a benchmark material for optical limiting applications. To facilitate the comparison, the fullerene-C60 dispersion was prepared to exhibit the same linear transmittance at 532 nm as the Hematene I and Magnetene samples, i.e., ∼93%. The obtained results are also shown in Fig. 11. As can be seen, the OLon value of fullerene-C60 was found to be ∼0.26 J cm−2, suggesting a very similar OL performance to that of Hematene I and Magnetene nanoplatelets under visible laser radiations. The finding is even more important when considering that the present 2D nanoplatelets are dispersible in water, while fullerene-C60 is dispersible only in organic solvents. It is worth noting that Hematene I and Magnetene revealed comparable or even lower OLon values than other 2D nanomaterials studied so far (see Table S1, ESI†), although the present samples had a significantly larger linear transmittance at 532 nm. The present preliminary results are of high importance, as they demonstrate the OL efficiency of the present non-van der Waals 2D materials, rendering them highly attractive for several OL related applications in opto-electronics and photonics, including the protection of human retinal and delicate optical sensors from high-power laser radiations, for the compression of optical pulses, passive mode locking, etc.26
Similar OL experiments on Hematene I and Magnetene dispersions performed under infrared (i.e. 1064 nm) laser irradiation did not reveal any significant OL action, as the transmittance of the samples was found to follow the Beer–Lambert regime for all the incident laser fluences used (i.e., up to ∼5 J cm−2), indicating the absence of OL effects.
Since, often, OL behavior can arise from scattering phenomena of the incident radiation, the presence of such phenomena was also investigated. So, to check for any significant nonlinear scattering (NLS) signal contributing to the OL action of Hematene and Magnetene, a sensitive photodiode mounted on a goniometer apparatus, being capable of moving freely around the sample at different angles with respect to the laser beam propagation axis, was employed. However, for the range of incident laser intensities used, the NLS signal was very weak, indicating a rather negligible contribution on the OL performance of the samples.
Concerning the origins of the optical limitation phenomena of the investigated Hematene I and Magnetene nanoplatelets under ns irradiation, they can be understood by evoking different physical processes, such as excited state absorption (ESA), two- or multi-photon absorption (TPA/MPA), nonlinear scattering (NLS), and thermal lensing effects.27 The presence of any NLS was checked and was found to be negligible under the present experimental conditions. In addition, any contribution arising from thermal lensing effects can be excluded, as the laser repetition rate was kept at as low as 1 Hz. Furthermore, measurements using higher repetition rates (i.e., up to 10 Hz) did not show significant modifications of the transmittance of the samples, indicating the absence of thermal effects. Hence, the photo-response mechanisms contributing to the observed OL action should be most likely attributed to ESA or TPA/MPA processes. In this direction, further work is in progress aiming to study the underlying operating physical mechanisms of the OL behavior and the nonlinear optical properties of the Hematene I and Magnetene nanoplatelets.
Conclusions
We present a highly efficient green method to produce 2D iron oxide nanoplatelets, Hematene and Magnetene, based on a mild sonication procedure in water solution of melamine. The produced ultrathin 2D nanoplatelets are dispersible in pure water. Hematite exfoliation led to two different Hematene products. Apart from the red orange nanoplatelets (Hematene II), which are like those produced in water or in dimethylformamide, a yellow orange product (Hematene I) was isolated for the first time here. Hematene I nanoplatelets were much more stable in water and have a different bandgap. Preliminary experiments showed that the as-produced 2D nanomaterials, Hematene I and Magnetene, exhibit highly efficient optical limiting behavior.Experimental
The raw materials are natural ferroxides, hematite and magnetite, collected from the mining areas of Selero, in Xanthi (North Greece) and Avisalos, on Serifos Island (Cyclades, Aegean Sea), respectively. Both samples are associated with Fe-skarns formed in the vicinity of granodiorite intrusions in the upper crust. Hematite occurs as patches replacing magnetite due to supergene oxidation. XRD patterns are presented in Fig. S2 and S5 (ESI†). The samples were ground in an agate mortar to fine powder as observed in scanning electron microscopy (SEM) images (see Fig. S6, ESI†).Sonication of hematite in melamine solution. 20 mg of powder hematite was added to a solution of melamine in water (100 mg in 40 mL). The mixture was sonicated for 1 h (bath sonication). The non-dispersed hematite was left to precipitate for 1 h and the liquid was centrifuged for 25 min at 10![[thin space (1/6-em)]](https://www.rsc.org/images/entities/char_2009.gif) 000 rpm. The supernatant was filtered (membrane filter 0.2 μm) and the isolated yellow orange powder was washed thoroughly with water and dispersed in water (Hematene I). The red precipitate was redispersed in water, filtered (membrane filter 0.2 μm) and washed with water (Hematene II).
000 rpm. The supernatant was filtered (membrane filter 0.2 μm) and the isolated yellow orange powder was washed thoroughly with water and dispersed in water (Hematene I). The red precipitate was redispersed in water, filtered (membrane filter 0.2 μm) and washed with water (Hematene II).
Sonication of hematite in water. 20 mg of hematite was added to water (40 mL). The mixture was sonicated for 1 h (bath sonication). The non-dispersed hematite was left to precipitate for 1 h and the liquid was filtered (membrane filter 0.2 μm) and the isolated orange-red powder was washed thoroughly with water and dispersed in water (Hematene-H2O).
Sonication of magnetite in melamine solution. 20 mg of magnetite ore was added to a solution of melamine in water (100 mg in 40 mL). The mixture was sonicated for 1 h (bath sonication). The non-dispersed magnetite was left to precipitate for 1 h and the supernatant was purified by removing magnetic nanoparticles, using an external magnet, filtrated (membrane filter 0.2 μm) and washed with water (Magnetene).
Sonication of magnetite in water. 20 mg of magnetite ore was added to water (40 mL). The mixture was sonicated for 1 h (bath sonication). The non-dispersed magnetite was left to precipitate for 1 h and the supernatant was purified using an external magnet, filtrated (membrane filter 0.2 μm) and washed with water.
Raman spectra were recorded with a micro-Raman spectrometer (HORIBA Jobin-Yvon T-64000) using a He–Ne laser source with an excitation wavelength of 632.8 nm, and a 50× microscope objective. The laser power on the sample was 0.9 mW. The spectra have been calibrated with respect to the 520 cm−1 band of crystalline Si. Atomic force microscopy (AFM) images were recorded on silicon wafer substrates using tapping mode with a Bruker Multimode 3D Nanoscope (Ted Pella Inc., Redding, CA, USA). XRD patterns were conducted with a D8 Advance Bruker diffractometer (Bruker AXS, Karlsruhe, Germany) using a CuKa (lD 1.5418) radiation source (40 kV, 40 mA) and a secondary beam graphite monochromator. The laser power was 1.082 mV. Diffraction patterns were recorded in the 2-theta (20) scale from 2° to 80°, in steps of 0.02° and with a counting time of 2 s per step. The optical spectra were recorded in water dispersion with a Hitachi Digilab, Model U2800-Double-Beam-UV/Vis. The absorption coefficient ε was calculated according to the Beer–Lambert law, A = εlC (where A is the absorbance, l is the cell length and C is the concentration of Hematene in g L−1) and a calibration curve. The TEM and HRTEM images were obtained using a FEG HR Scanning-Transmission Electron Microscope (Thermo Fisher Scientific Talos F200i S/TEM). SEM analysis was carried out on a Zeiss EVO-MA10 (Carl Zeiss Microscopy GmbH, Jena, Germany) operating at 12.05 kV. Infrared spectra were recorded with a Fourier transform spectrometer (Excalibur, Digilab) using an ATR technique.
Optical limiting. For the investigation of the optical limiting (OL) performance of Hematene I and Magnetene aqueous dispersions transmission measurements were performed using the infrared (fundamental) and visible (SHG) outputs of a Q-switched Nd:YAG laser (EKSPLA NT 342/3/UVE/AW) operating at 1064 and 532 nm, delivering 4 ns pulses with a variable repetition rate from 1 to 10 Hz. For the OL experiments, the Hematene I and Magnetene dispersions were placed in 1 mm thick quartz cells. The concentration of each dispersion was adjusted so that all studied dispersions exhibit the same linear transmittance (i.e., 93%) at the irradiation wavelength (i.e., 1064 and 532 nm) to allow for direct comparisons. The laser beam energy was monitored by means of a calibrated joulemeter (Coherent, J-10 MT–10 KHZ).
The OL efficiency of a sample, in general, is described in terms of its optical limiting onset (OLon), which is defined as the value of incident fluence where the transmittance of the sample begins to deviate from the Beer–Lambert regime. So, aiming to assess the OL efficiency of Hematene and Magnetene dispersions, the OLon values for each sample were determined. For that purpose, the samples were positioned at the focal plane of a 20 cm focal length lens and irradiated with different laser beam energies, with the incident, Ein, and outcoming, Eout laser energies, monitored by means of a joulemeter. Each measurement corresponds to the average of 100 laser pulses, and the standard deviation was less than 5% in all cases. Then, the input, Fin, and output, Fout, fluences, just prior to and after the sample, respectively, were calculated from the following relation: F = E/πw02, where w0 is the beam radius at the focal plane. The beam radii at the focal plane were measured by a CCD camera and found to be about 18 and 30 μm for the 532 and 1064 nm laser beams, respectively. Due to the precipitation observed in the case of Hematene II dispersions, only the OL performance of Hematene I and Magnetene aqueous dispersions were evaluated.
Author contributions
V. G., supervised the project, A. K., G. F., and V. G. conceived the project, performed the experiments, and wrote the original manuscript, N. S., S. N. Y., M. S., D. T., N. C., S. C., A. K.-N., G. A., D. P. G., V. T., E. S. and S. F. T. S. K. performed the experiments and contribute to the data collections. All authors contributed to the review and editing of the manuscript.Conflicts of interest
There are no conflicts to declare.Acknowledgements
M. Stavrou acknowledges support from the Hellenic Foundation for Research and Innovation (HFRI) under the HFRI PhD Fellowship grant (number: 83656).Notes and references
- Y. Hernandez, et al. , Nat. Nanotechnol., 2008, 3, 563–568 CrossRef CAS; N. Ton, M. Q. Ha, T. Ikenaga, A. Thakur, H. C. Dam and T. Taniike, 2D Mater, 2021, 8, 015019 CrossRef; A. Ciesielski and P. Samori, Chem. Soc. Rev., 2014, 43, 381–398 RSC.
- T. Giousis, et al. , Angew. Chem., Int. Ed., 2021, 60, 360–365 CrossRef CAS.
- Y. Lin, T. V. Williams, T. B. Xu, W. Cao, H. E. Elsayed-Ali and J. W. Connell, J. Phys. Chem. C, 2011, 115, 2679–2685 CrossRef CAS; Y. Lin, T. V. Williams, T. B. Xu, W. Cao, H. E. Elsayed-Ali and J. W. Connell, J. Phys. Chem. C, 2011, 115, 2679–2685 CrossRef; Y. Lin, T. V. Williams, T. B. Xu, W. Cao, H. E. Elsayed-Ali and J. W. Connell, J. Phys. Chem. C, 2011, 115, 2679–2685 CrossRef.
- T. P. Nguyen, S. Choi, J. M. Jeon, K. C. Kwon, H. W. Jang and S. Y. Kim, J. Phys. Chem. C, 2016, 120, 3929–3935 CrossRef CAS; F. Goni, A. Chemelli and F. Uhlig, Nanomaterials, 2021, 11, 3253 CrossRef.
- P. Kumbhakar, C. C. Gowda, P. L. Mahapatra, M. Mukherjee, K. D. Malviya, M. Chaker, A. Chandra, B. Lahiri, P. M. Ajayan, D. Jariwala, A. Singh and C. S. Tiwary, Mater. Today, 2020, 45, 142–168 CrossRef.
- N. Mandal, A. Pramanik, A. Dey, P. Kumbhakar, V. Kochat, A. R. S. Gautam, N. Glavin, A. K. Roy, P. M. Ajayan and C. S. Tiwary, Opt. Mater., 2023, 135, 113325 CrossRef CAS.
- R. Frisenda, Y. Niu, P. Gant, M. Muñoz and A. Castellanos-Gomez, npj 2D Mater. Appl., 2020, 4, 38 CrossRef.
- P. A. Balan, et al. , Nat. Nanotechnol., 2018, 13, 602–609 CrossRef PubMed.
- A. B. Puthirath, et al. , Small, 2020, 16, 2004208 CrossRef CAS PubMed; T. P. Yadav, et al. , Adv. Mater. Interfaces, 2018, 5, 1800549 CrossRef; A. P. Balan, et al. , Chem. Mater., 2018, 30, 5923–5931 CrossRef.
- A. G. Tamirat, J. Rick, A. A. Dubale, W. N. Su and B. J. Hwang, Nanoscale Horiz., 2016, 1, 243–267 RSC.
- M. Fondell, T. J. Jacobsson, M. Boman and T. Edvinsson, J. Mater. Chem. A, 2014, 2, 3352–3363 RSC.
- A. Koutsioukis, G. Florakis, E. Sakellis and V. Georgakilas, ACS Sustainable Chem. Eng., 2022, 10(38), 12552–12558 CrossRef CAS.
- G. Ren, Y. Sun, M. Sun, Y. Li, A. Lu and H. Ding, Minerals, 2017, 7, 230 CrossRef.
- A. Sunny, N. Prasad, D. Subbaiyan, S. Dillibabu and K. Balasubramanian, Appl. Phys. A: Mater. Sci. Process., 2018, 124, 677 CrossRef.
- M. Fondell, T. J. Jacobsson, M. Boman and T. Edvinsson, J. Mater. Chem. A, 2014, 2, 3352–3363 RSC.
- C. P. Marshall, W. J. B. Dufresne and C. J. Rufledt, J. Raman Spectrosc., 2020, 51, 1522–1529 CrossRef CAS; M. J. Massey, U. Baier, R. Merlin and W. H. Weber, Phys. Rev. B: Condens. Matter Mater. Phys., 1990, 41, 7822–7827 CrossRef PubMed; S. P. S. Porto and R. S. Krishnan, J. Chem. Phys., 1967, 47, 1009 CrossRef.
- L. B. Modesto Lopez, J. D. Pasteris and P. Biswas, Appl. Spectrosc., 2009, 63, 627–635 CrossRef PubMed.
- I. V. Chernyshova, M. F. Jr and A. S. Hochella Madden, Phys. Chem. Chem. Phys., 2007, 9, 1736–1750 RSC.
- S. H. Shim and T. S. Duffy, Am. Mineral., 2001, 87, 318–326 CrossRef.
- K. F. McCarty, Solid State Commun., 1988, 68, 799–802 CrossRef CAS.
- A. P. Balan, et al. , Nat. Nanotechnol., 2018, 13, 602–609 CrossRef.
- A. M. Rodrıguez, A. B. Munoz-Garcıa, O. Crescenzi, E. Vazquez and M. Pavone, Phys. Chem. Chem. Phys., 2016, 18, 22203 RSC.
- N. Y. Dzade, A. Roldan and N. H. de Leeuw, Minerals, 2014, 4, 89–115 CrossRef.
- M. Hanesch, Geophys. J. Int., 2009, 177, 941–948 CrossRef CAS.
- D. A. Wheeler, G. Wang, Y. Ling, Y. Li and J. Z. Zhang, Energy Environ. Sci., 2012, 5, 6682–6702 RSC; D. Grave, N. Yatom, D. Ellis, M. Toroker and A. Rothschild, Adv. Mater., 2018, 30, 1706577 CrossRef CAS; S. Park, T. Ishikawa and Y. Tokura, Phys. Rev. B: Condens. Matter Mater. Phys., 1998, 58, 3717–3720 CrossRef; Z. Zhang and S. Satpathy, Phys. Rev. B: Condens. Matter Mater. Phys., 1991, 44, 13319–13331 CrossRef.
- C. W. Spangler, J. Mater. Chem., 1999, 9, 2013–2020 RSC; L. W. Tutt and T. F. Boggess, Prog. Quantum Electron., 1993, 17, 299–338 CrossRef CAS.
- M. Feng, H. Zhan and Y. Chen, Appl. Phys. Lett., 2010, 96, 033107 CrossRef CAS; Z. B. Liu, Y. Wang, X. L. Zhang, Y. F. Xu, Y. S. Chen and J. G. Tian, Appl. Phys. Lett., 2009, 94, 021902 CrossRef; M. Stavrou, D. Panáček, A. Bakandritsos and S. Couris, J. Phys. Chem. C, 2022, 126, 14339–14345 CrossRef.
Footnote |
| † Electronic supplementary information (ESI) available. See DOI: https://doi.org/10.1039/d2tc04524a |
| This journal is © The Royal Society of Chemistry 2023 |

