 Open Access Article
Performance of a membrane fabricated from high-density polyethylene waste for dye separation in water
Utari Zulfiania,
Afdhal Junaidia,
Cininta Nareswaria,
Badrut Tamam Ibnu Alia,
Juhana Jaafarb,
Alvin Rahmad Widyantoa,
Saiful c,
Hadi Nugraha Cipta Dharmab and
Nurul Widiastuti
 *a
*a
aDepartment of Chemistry, Faculty of Science and Data Analytics, Institut Teknologi Sepuluh Nopember, Sukolilo, Surabaya 60111, Indonesia. E-mail: nurul_widiastuti@chem.its.ac.id
bAdvanced Membrane Technology Research Centre (AMTEC), Universiti Teknologi Malaysia, 81310 Skudai, Johor Bahru, Malaysia
cDepartment of Chemistry, Faculty of Mathematic and Natural Science, Universitas Syiah Kuala, Banda, Aceh 23111, Indonesia
First published on 8th March 2023
Abstract
Industrial growth can have a good impact on a country's economic growth, but it can also cause environmental problems, including water pollution. About 80% of industrial wastewater is discharged into the environment without treatment, of which 17–20% is dominated by dyes, such as methylene blue (MB) and methyl orange (MO) from the textile industry. Only about 5% of a textile dye is used in the dyeing process and the rest is discarded. This problem, of course, requires special handling considering the harmful effects to health. On the other hand, the abundance of plastic waste is increasing by 14% or 85![[thin space (1/6-em)]](https://www.rsc.org/images/entities/char_2009.gif) 000 tons per year. This problem must be solved due to its film-forming properties. High-density polyethylene (HDPE) is one type of plastic used as a membrane material. Therefore, in this study, HDPE plastic waste was utilized as a membrane for dye removal. In this study, HDPE plastic waste was fabricated via a thermal-induced phase-separation method using mineral oil as a solvent at various concentrations of 8%, 10%, 13%, and 15% (w/w). All the membranes were characterized by scanning electron microscopy, Fourier transform infrared spectroscopy, and contact angle measurements. The results showed that the HDPE membrane at a concentration of 15% displayed the best performance compared to the others in terms of MB rejection. The negative charge (−36.9) of the HDPE membrane was more effective for cationic dye removal compared to the anionic dye. The flux and rejection of HDPE 15% for 100 ppm MB and MO removal were 2.71 and 4.93 L m−2 h−1, and 99.72% and 89.8%, respectively. The pure water flux of the membrane was 15.01 L m−2 h−1 and the tensile strength was 0.3435 MPa.
000 tons per year. This problem must be solved due to its film-forming properties. High-density polyethylene (HDPE) is one type of plastic used as a membrane material. Therefore, in this study, HDPE plastic waste was utilized as a membrane for dye removal. In this study, HDPE plastic waste was fabricated via a thermal-induced phase-separation method using mineral oil as a solvent at various concentrations of 8%, 10%, 13%, and 15% (w/w). All the membranes were characterized by scanning electron microscopy, Fourier transform infrared spectroscopy, and contact angle measurements. The results showed that the HDPE membrane at a concentration of 15% displayed the best performance compared to the others in terms of MB rejection. The negative charge (−36.9) of the HDPE membrane was more effective for cationic dye removal compared to the anionic dye. The flux and rejection of HDPE 15% for 100 ppm MB and MO removal were 2.71 and 4.93 L m−2 h−1, and 99.72% and 89.8%, respectively. The pure water flux of the membrane was 15.01 L m−2 h−1 and the tensile strength was 0.3435 MPa.
1 Introduction
The abundance of plastic waste poses a problem that requires serious attention. Its fabrication for various uses makes it not easily decomposed, causing its abundance to increase.1 This situation was exacerbated by the COVID-19 pandemic, where the demand for single-use plastic continued to increase but without additional handling for its disposal. As a result, 8.4 ± 1.4 million tons of plastic waste were produced from 193 countries, of which it was estimated that 25.9 ± 3.8 thousand tons of this waste was dumped into the global oceans and about 72% of this waste came from Asia.2 In 2022, based on Indonesia waste management information data, plastic is ranked second after food waste and accounts for around 17.47% of the total waste. Hidayat et al.1 reported that the use of plastic in Indonesia reaches 85![[thin space (1/6-em)]](https://www.rsc.org/images/entities/char_2009.gif) 000 tons annually and as many as 3.2 million tons are dumped into the sea, this ranks Indonesia as the second worst country in the world in terms of poor waste management after China.3
000 tons annually and as many as 3.2 million tons are dumped into the sea, this ranks Indonesia as the second worst country in the world in terms of poor waste management after China.3
Besides the problem of plastic waste, the issue of clean water is taking center stage in various countries due to the increase in population and industrial growth.4 Zhang et al.5 estimated that approximately 1.84 × 10¹⁰ m3 of dye wastewater is produced from industries. Some industries that produce dye waste with high concentrations include dye manufacture, tanning and painting, paper and pulp, dyes, and textile. The highest percentage of dye waste disposal is textile.6 There are about 100![[thin space (1/6-em)]](https://www.rsc.org/images/entities/char_2009.gif) 000 types of dyes with a total annual production of 7 × 10⁵ tons.7 The textile industry produces about 15% or 1000 tons of waste annually with a concentration of 5–1500 ppm that is discharged into aquatic waters.7,8
000 types of dyes with a total annual production of 7 × 10⁵ tons.7 The textile industry produces about 15% or 1000 tons of waste annually with a concentration of 5–1500 ppm that is discharged into aquatic waters.7,8
Dyes, even in low concentration (<1 ppm), can be visually detected due to their high visibility and can affect aquatic life and so are not only aesthetically displeasing but also toxicologically harmful.7,9,10 Azo-derived dyes account for about 70% of the total world dye production.11 Among all the tested dyes, azo, direct dyes (anionic dyes), and basic dyes (cationic dyes) showed the highest rates of toxicity.7 Methylene blue (MB) and methyl orange (MO) are cationic and anionic dyes that are commonly used for dyeing cotton, wood, and silk.9,10,12 According to KEP-51/MENLH/10/1995, the maximum limit of dye toxicity in water is <5 ppm.13,14 MB and MO contamination in water can cause health problems in humans, such as eye, respiratory, and digestive disorders and thus requires a treatment process before being discharged into water bodies.9,12,15 The most applicable advanced wastewater treatments are chemical precipitation, nanofiltration, advanced oxidation, ion exchange, adsorption, membrane separation, electrocoagulation, and electrodialysis. However, these technologies are generally very expensive and not a sustainable mechanism for wastewater treatment in every sector, especially in developing countries.10
The membrane process is one of the most popular separation techniques today.16 Its easy fabrication and high selectiveness make the membrane technology widely applied in purification processes.17 In particular, the membrane process has been widely applied in the dye filtration process, both through the microfiltration (MF) process to reverse osmosis (RO).18–22 Nanofiltration membranes (NFs) are more commonly used for dye filtration due to their smaller pore size than the MF process. Membranes can be fabricated with a variety of materials from natural to synthesized, such as cellulose acetate, polyvinylidene fluoride (PVDf), and polyethersulfone (PES).23,24 In the membrane process, in addition to the membrane performance, several factors, such as operational costs and material safety, also require attention. The use of economical and environmentally safe materials is preferred in the membrane industry.25 Therefore, it is expected that the abundance of plastic waste could provide alternative solutions in dye processing because plastic can form films, thus, it could be applied as a basic material for making membranes.26
One plastic-type that is widely used as a packaging material in Indonesia is high-density polyethylene (HDPE), and commercial HDPE material has been widely applied as a membrane manufacturing material and shown good performance in water treatment, with humic acid rejection rate of 89.54% and flux of 5 L m−2 h−1.25 This study used HDPE plastic waste as a membrane material to remove dye in water.
A membrane from HDPE plastic waste was also reported by Zukimin et al.27 to reduce the turbidity of a river. Still, the rejection results showed a low rejection rate of only 12–35% using the sintering method with various solvents, such as water, cooking oil, olive oil, and ethylene glycol. Still, the addition of additives or a combination of HDPE with other polymers could improve the performance of the membrane, whereby HDPE membranes with a mixture of low-density polyethylene (LDPE), PES, and kaolin using xylene and toluene solvents could achieve rejection rates of 69.3%, 76.2%, and 82.5% for the removal of Cd, Pb, and Cu metals.27,28
The solvent factor also determines the performance of HDPE membranes. Shokri et al.29 reported that HDPE had poor compatibility with several types of solvents and additives, which would impact the performance of the resulting membrane. Commercial HDPE could not achieve a homogeneous phase with polyethylene glycol (PEG) because of the low solubility between HDPE and PEG.25 Therefore, the dissolution and homogenization process to produce a membrane dope solution is a challenge in this research. HDPE has been reported to be soluble in several solvents, including xylene, toluene, mineral oil, dibutyl phthalate, and diisodecyl phthalate.25,28,30,31 This study chose mineral oil as a solvent, as besides being cheap, this solvent is also safer for health and is environmentally friendly.29 Mineral oil is a mineral oil derived from petroleum, and is produced as a by-product of petroleum distillation. It consists of straight-chain hydrocarbons, branched, cycloalkanes, and aromatic structures with boiling points ranging from 270 °C to 525 °C. Mineral oil is also widely used in the cosmetic and pharmaceutical mixtures.32,33 This research focused on the utilization of HDPE plastic waste as a membrane material, which was fabricated using a simple method with cheap and environmentally friendly solvents but had good performance. Therefore, in this research, solvent selection and concentration optimization for the HDPE membranes were carried out to determine the optimum concentration of the membrane, for which the fabricated membrane was used for the separation of cationic and anionic dyes, namely MB and MO.
2 Experimental
2.1 Materials
The materials used in this study included HDPE plastic sheets waste, which was used as the base polymer, and N-methyl-2-pyrrolidone (NMP, 99%, Sigma Aldrich), poly(ethylene glycol) (PEG, MW: 200, Merck), n-hexane (99%, Merck); dimethylformamide (DMF, 99%, Smart Lab), dimethyl sulfoxide (DMSO, 99%, Merck); xylene (99.8%, Merck), toluene (99%, Smart Lab), phenol (99%, Merck), cooking oil, and mineral oil (pharmaceutical grade, local distributors PT Heansa Kimia), which were used as the solvent. Acetone (Technic 98%, local distributors PT. Sumber Ilmiah Persada) was used as the extractor. Methylene blue (MB, MW: 319.86 g mol−1, MERCK) and methyl orange (MO, MW: 327.33 g mol−1, Sigma Aldrich) were used as the model contaminants.2.2 Solvent selection and preparation of the HDPE membrane
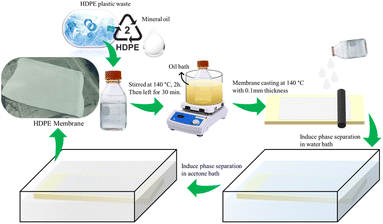
The dissolution of HDPE plastic cut to a size of ±1 × 1 cm in various solvents (i.e., NMP, DMF, DMSO, xylene, toluene, PEG, cooking oil, n-hexane, and mineral oil) was carried out under the boiling point of the solvent, which was in the range of 110–200 °C for 4 h. It was noted that the boiling point of n-hexane was 68 °C, thus the temperature used for this solvent was controlled at 60 °C to avoid boiling of the solvent. The concentration of the polymer was kept at 8% (w/w). Furthermore, the solution that reached the homogeneous phase was fabricated as a membrane.27,34The membrane was fabricated by thermally induced phase separation (TIPS) using the method of Shokri et al.29 with several modifications. HDPE plastic was dissolved in mineral oil at various polymer concentrations of 8%, 10%, 13%, and 15% (w/w), the proportions are listed in Table 1. The mixture was homogenized at a temperature of 140 °C with a rotation of 100 rpm for 2 h and left for 30 min to remove the gases. The homogeneous solution was then poured and cast on a glass sheet that had been heated. The glass plate was immediately quenched in a water bath to induce phase separation. After peeling off the plates, the membranes were immersed in acetone for 24 h to extract the mineral oil and dried at room temperature.29 The preparation scheme is shown in Fig. 1.
| Membrane (% w/w) | HDPE (g) | Mineral oil (g) |
|---|---|---|
| R-HDPE 8% | 4 | 46 |
| R-HDPE 10% | 5 | 45 |
| R-HDPE 13% | 6.5 | 43.5 |
| R-HDPE 15% | 7.5 | 42.5 |
2.3 Membrane characterizations
The morphology of the cross-sectional and the surface of the HDPE membrane were analyzed by scanning electron microscopy (SEM) with energy dispersive X-ray spectroscopy (EDX, Zeis Evo MA 10 and Hitachi flex SEM 100) with an accelerating voltage of 20.0 kV. For the cross-section imaging, the membranes were cut inside a flow of liquid nitrogen to obtain a smooth cross-section of the surface. Then, the membranes were coated with a thin layer of gold and inserted into the specimen chamber for analysis of the morphological structure.35 SEM in this research was used to study the effect of the polymer concentration on the pore structure in the membranes. The average pore size on the membrane was measured using ImageJ software. The porosity of the membrane was measured with Archimedes method. The membrane was cut to a specific size (0.005 m2) and dried in an oven at 110 °C for 30 min before soaking for 24 h in isobutanol. The wet membrane was then weighed. The porosity was calculated by eqn (1), where ε is the porosity (%); W1 is the mass of the wet sample (g); W2 is the mass of the dry sample (g); ρ1 is the density of HDPE (0.941 g cm−3); and ρ2 is the density of isobutanol (0.802 g cm−3):30
 | (1) |
Fourier transform infrared spectroscopy (FTIR, Thermo Scientific Nicolet iS10) was used to determine the functional groups on the membrane. The membrane was cut to a size of 1 × 1 cm and inserted in a sample holder for analysis using infrared (IR) rays in the wavenumber range of 400–4000 cm−1.25
The hydrophobicity of the HDPE membrane was investigated by measuring the contact angle using a 3D optical microscope (3D OM, vhx-5000) at room temperature with 3 L of deionized water as the probe solvent. The surface charge of the membrane was tested by measuring the zeta potential using a Melvern Zetasizer Nano ZS. The mechanical properties of the membranes were measured by dynamic mechanical analysis (DMA, SDTA861, Mettler) with the force ranging from 0.01 to 1 N. The tensile strength of membrane was calculated with eqn (2), where τ is the tensile strength (MPa), Fmax is the maximum strength load (N), and A is the membrane area (m2):
 | (2) |
Meanwhile, the elongation at break was calculated with eqn (3), where ε is the elongation (%), d is the length at break (mm), and a is the initial length (mm):
 | (3) |
2.4 Membrane performance
Water flux and dye rejection tests were performed using a crossflow reactor (Sartorius, viva flow 50R) with an effective membrane area of 50 cm2. In this system, the flow rate of the feed flow solution was 100 mL min−1. The membrane flux was calculated with eqn (4),36 where J, V, A, and t are the permeate (L m−2 h−1), permeate mass (m), membrane surface area (m2), and permeation time (h).
 | (4) |
The rejection of dye was measured using eqn (5),36 where CP and CF are the permeate and feed concentrations of dyes. The concentration of dye was measured using a UV-752N UV-Vis spectrophotometer.
 | (5) |
3 Result and discussion
3.1 Solvent selection
The challenge of using HDPE plastic as a membrane material is due to its resistance to various types of solvents.37 In the process of membrane formation through TIPS, the polymer must dissolve homogeneously in the solvent. In this research, an attempt to dissolve the HDPE plastic waste was conducted by using several solvents, including NMP, DMF, phenol, xylene, toluene, cooking oil, and mineral oil.As can be seen in Table 2, HDPE plastic waste could not reach a homogeneous phase when using DMF, DMSO, phenol, and n-hexane, while it could be only partially dissolved in cooking oil. HDPE plastic waste exhibited homogeneous phases in xylene, toluene, and mineral oils. In the polymer dissolution process, there are 2 key influencing factors: the dielectric constant (ε) and refractive index.38 The dielectric constant (ε) is used to measure the ability of a material to store charge or to act as a capacitor in an electric field. A higher dielectric constant of a solvent is correlated with a higher ability of the solvent to dissolve salts, where a higher ε means higher polarity, and a greater ability to stabilize charges.34 The refractive index is a material property that describes how a material affects the speed of light traveling through it.39 In general, when a compound is denser or, in other words, the molecules are more tightly packed, the refractive index of that substance is expected to be high; thus the higher the refractive index, the higher would be the solubility parameters.34 HDPE has a low polarity, thus requiring a solvent with a low dielectric constant and refractive index.40 Thus, HDPE plastic waste was insoluble in DMF, NMP, DMSO, and phenol solvents due to its high dielectric constant value. The dielectric constant (ε) and refractive index values of the solvents used in this study are mentioned in Table 2.
| Types of solvents | DMF | DMSO | Toluene | Xylene | Phenol | Cooking oil | n-Hexane | Mineral oil | NMP |
|---|---|---|---|---|---|---|---|---|---|
| Result | Insoluble | Insoluble | Soluble | Soluble | Insoluble | Partially soluble | Insoluble | Soluble | Insoluble |
| Dielectric constant (ε) | 38.3 | 47.2 | 2.4 | 2.37 | 15 | 3.23 | 1.88 | 2.1 | 32.16 |
| Refractive index | 1.430 | 1.479 | 1.497 | 1.5 | 2.37 | 1.44 | 1.38 | 1.48 | 2.15 |
According to the results in Table 2, HDPE waste could be dissolved in toluene, xylene, and mineral oil. However, because the boiling point of xylene and toluene only ranged from 110–140 °C,30 this solution could be very easily compacted when poured on a glass plate. As a result, this would certainly complicate the membrane casting process. The doping solution produced from xylene and toluene solvents also produced more bubbles. On the other hand, mineral oil with a boiling point of 220 °C![[thin space (1/6-em)]](https://www.rsc.org/images/entities/char_2009.gif) 41 resulted in a more stable doping solution at room temperature compared to the doping solutions with xylene and toluene solvents. In terms of health and economy, mineral oil is safer and much cheaper than xylene and toluene solvents because the grade of mineral oil used is pharmaceutical grade.33
41 resulted in a more stable doping solution at room temperature compared to the doping solutions with xylene and toluene solvents. In terms of health and economy, mineral oil is safer and much cheaper than xylene and toluene solvents because the grade of mineral oil used is pharmaceutical grade.33
3.2 FTIR analysis
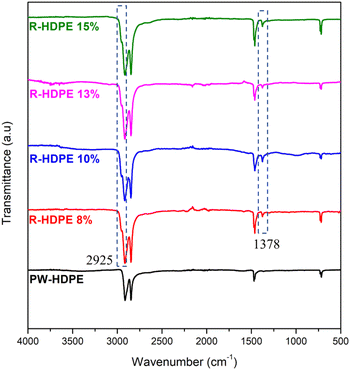
Generally, a filler is added to plastic products during the production process. In polyethylene-type plastics, that fillers that are commonly used are talc and CaCO3.42 Thus, in this study, FTIR spectroscopy was used to identify the functional groups on the HDPE membranes, as shown in Fig. 2. The FTIR spectra measured included HDPE plastic waste (PW-HDPE), recycled HDPE 8% (R-HDPE 8%), recycled HDPE 10% (R-HDPE 10%), and recycled HDPE 15% (R-HDPE 15%) PW-HDPE is a plastic waste that is used as a raw material for making 8%, 13%, 10%, and 15% R-HDPE membranes. PW-HDPE FTIR spectral peaks appeared in the 2913.63 and 2847.54 cm−1 regions indicating CH2 stretching, 1471.38 cm−1 indicating CH2 bending, and 729.63 and 717.69 indicating CH2 rocking. Peaks with the same range also appeared in R-HDPE 8%, 10%, and 15%, namely 2915.21 and 2847.41 CH2 stretching; 1472.10, 1462.00, and 1376.57 cm−1 for CH2 bending; and 729.95 and 719.07 for CH2 rocking (R-HDPE 8%). The peaks for R-HDPE 10% were at 2916.39 and 2848.32 for CH2 stretching, 1461.98 and 1376.61 for CH2 bending, and 719.35 for CH2 rocking. CH2 stretching at R-HDPE 15% appeared at 2915 and 2347.4 cm−1, CH2 bending at 1472.12 and 1462.01 cm−1, and CH2 rocking at 730.04 and 718.99 cm−1.This shows that the HDPE structure of the plastic waste was maintained on the 8%, 10%, 13%, and 15% R-HDPE membranes. The additional peak intensity for all the membranes was due to the occurrence of overlapping peaks between HDPE and mineral oil. The addition of new peaks also occurred in all membranes, namely at 1378 and 2925 cm−1, which were the peaks of the CH2 bending vibration of mineral oil.43 It was assumed that there was likely residual solvent on the membrane, which would be in accordance with the mineral oil spectra reported by Bálint Németh et al.43 The spectral results revealed that HDPE did not have a polar functional group and consisted only of a hydrocarbon structure and no other additives, such as talc or CaCO3, were detected. The results from the HDPE spectra in this study were in accordance with commercial HDPE spectra based on this theory, namely stretching CH2 at 2950–2850 cm−1; bending vibration CH2 at 1470–1460 cm−1; and rocking vibrations of CH2 at 730–700 cm−1.44
3.3 Morphology of the membrane
The surface and cross-sectional morphology of the membranes were analyzed using SEM. The results of the SEM cross-sections of the HDPE membranes showed that the pores of the HDPE membranes were 8% wider than those of the 10%, 13%, and 15% HDPE membranes (Fig. 3). The narrower pore sizes in the R-HDPE 10% and 15% were due to the increase in polymer used in the membrane fabrication. The smallest pore size was for membrane R-HDPE 15%, but between R-HDPE 8% and 10% did not show a significant difference because the concentration in the membrane was almost the same (Fig. 4).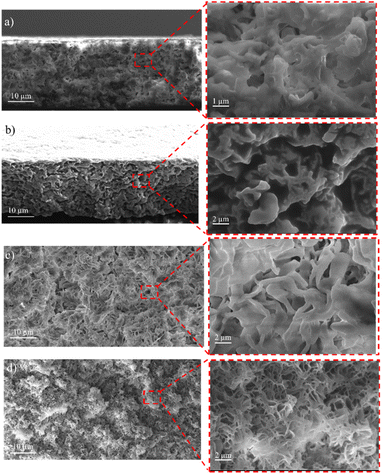 | ||
| Fig. 3 Cross-sections of the HDPE membranes: (a) R-HDPE 8%, (b) R-HDPE 10%, (c) R-HDPE 13%, and (d) R-HDPE 15%. | ||
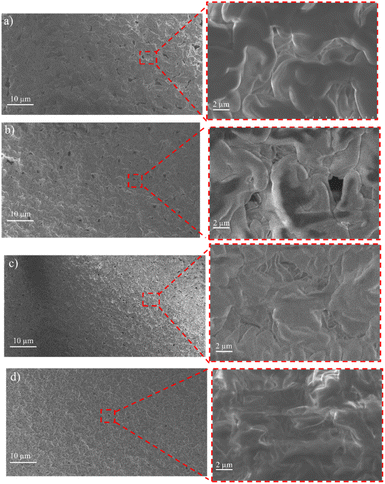 | ||
| Fig. 4 Surfaces of the HDPE membranes: (a) R-HDPE 8%, (b) R-HDPE 10%, (c) R-HDPE 13%, and (d) R-HDPE 15%. | ||
Ajari et al.30 also reported that increasing the polymer concentration in polyethylene membranes decreased the porosity of the membranes due to a decrease in the coagulation rate due to the increased polymer concentration. The formation of the membrane morphology is also influenced by the membrane fabrication method, which in this study used the TIPS method. Pore formation in this method occurred after soaking the membrane in the extractant, namely acetone.45 The membranes exhibited cellular-like pores, which are the typical structures that result from the thermally induced phase-separation method.46
For all the cases, the pore sizes at the surfaces of the membranes were smaller than the interior pore sizes (Table 3). The smaller pores at the surfaces may be attributed to the higher cooling rate in the surface layers brought about by the contact with water, whereby there would be less time for the formed droplets to coarse in the surface layers in cooling process. As summarized in Table 3, the porosity of the membranes varied in a small range and showed a slight decreasing tendency with the increase in the total polymer concentration. This may be associated with the reduced volume fraction of the polymer-poor phase in the high polymer concentration case.
| Membrane | Pore size area (μm2) | Average pore size (μm) | Porosity (%) | ||
|---|---|---|---|---|---|
| Interior | Surface | Interior | Surface | ||
| R-HDPE 8% | 34.744 | 9.884 | 5.729 | 3.637 | 50.1 |
| R-HDPE 10% | 19.928 | 5.812 | 3.570 | 2.579 | 42.9 |
| R-HDPE 13% | 6.955 | 4.850 | 2.053 | 2.138 | 36.1 |
| R-HDPE 15% | 3.683 | 1.241 | 1.505 | 0.950 | 25.5 |
3.4 Contact angle
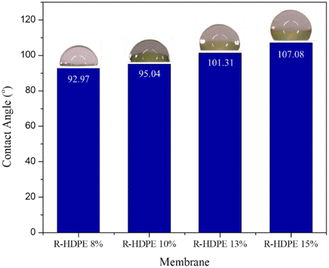
The contact angle is a parameter that determines the hydrophilicity properties of a membrane. Fig. 5 shows the change in contact angle in the fabricated HDPE membranes. The increase in concentration resulted in membranes with a contact angle greater than 90°. Thus, the membrane could be categorized as hydrophobic.47 An increased contact angle with increased concentration is generally associated with the roughness of the membrane surface. The increase in concentration affected the roughness on the surface, causing the hydrophilicity properties of the membrane to decrease. Ajari et al.30 reported the same thing in LDPE membranes, where an increase in polymer concentration from 5% to 10% led to an increase in the contact angle of the membrane due to increasing the roughness of the membrane surface.3.5 Mechanical strength
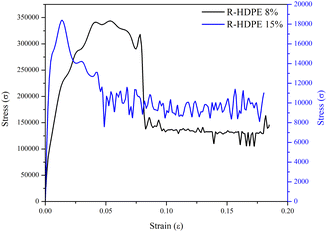
The mechanical strength of a membrane can be determined by the tensile strength and the elongation. In this research, testing was carried out on the membranes with the lowest concentration, namely R-HDPE 8%, and the highest concentration, namely R-HDPE 15%. Fig. 6 shows the stress–strain curves of the tensile strength of HDPE membranes.Based on the stress–strain curves, the tensile strength, elongation, and Young's modulus of R-HDPE 8% were 0.0184 MPa, 18.03%, and 4 MPa, respectively. The R-HDPE 15% membrane, which was the highest concentration of polymer tested here, had tensile strength, elongation, and Young's modulus values of 0.3435 MPa, 18.47%, and 40 MPa, respectively. Based on the tensile strength tests, the membrane with a concentration of 15% was stronger than the membrane with a concentration of 8%. This suggests that the increase in the polymer concentration had an impact on the strength of the membrane.
3.6 Membrane performance tests
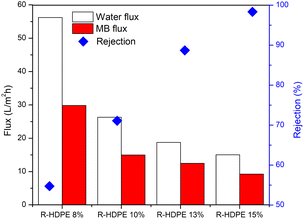
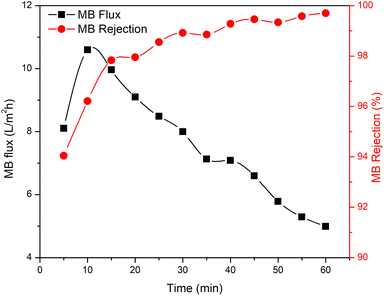
The membrane performance was tested, including the water flux, MB flux, and MB rejection (Fig. 7). The results obtained showed that the R-HDPE 8% membrane had a water flux of 56.2 L m−2 h−1, MB flux of 29.8 L m−2 h−1, and rejection rate of 54.73%; while the R-HDPE 10% membrane had a water flux of 24.43 L m−2 h−1, MB flux of 14.97 L m−2 h−1, and rejection rate of 71.09%, and the R-HDPE 13% membrane had a water flux of 18.75 L m−2 h−1, MB flux of 12.48 L m−2 h−1, and MB rejection rate of 88.69%. The highest rejection results were found in R-HDPE 15%, namely 98.33%; but this membrane had the lowest water flux and MB flux, which were 15.01 and 9.25 L m−2 h−1, respectively. The MB flux values on the R-HDPE 8% and R-HDPE 10% membranes were higher than those of the R-HDPE 15% membrane, but the rejection values of the R-HDPE 8% and R-HDPE 10% membranes were lower than the rejection value of the R-HDPE 15% membrane. This shows that the polymer concentration affected the pore density of the membrane, whereby the membranes with a higher concentration had smaller pores, which led to a higher rejection of MB.30 The same result was also reported by Othman et al.,48 namely that polypropylene membranes with a concentration of 20% had smaller pore sizes than membranes with a concentration of 15%, i.e. 11.5 vs. 9.01 μm. In an LDPE (low density polyethylene) membrane, the water flux in the membrane with a concentration of 10% also had a lower flux value than that of a 5% LDPE membrane, i.e. 0.7 vs. 1.5 L m−2 h−1.30The test results reported in Fig. 7 are the average flux and membrane rejection rates carried out for 30 min using 10 ppm MB. Based on this test, the R-HDPE 15% membrane showed the best performance with a higher rejection rate than the other membranes. Therefore, the test on the R-HDPE 15% membrane was continued for 90 min to determine the durability of the membrane. Based on Fig. 8, there was an increase in rejection from 5 to 40 min, then at 45 to 60 min, the rejection rate became more stable. At 60 min, the flux and rejection rate of 4.99 L m−2 h−1 and 99.69% were obtained. The test was then continued for 30 min with the same membrane without washing and the flux and rejection were then 3.6 L m−2 h−1 and 99.75%. In general, there was no significant change in the membrane rejection value, but in terms of the flux, there was a significant decrease at 30, 60, and 90 min of the test, namely 9.25, 6.14, and 3.6 L m−2 h−1, respectively.
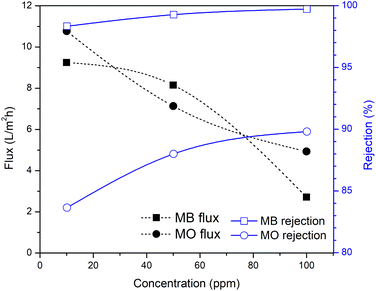
As indicated by the results in Fig. 8 and 9, the rejection increased with increasing the filtration time and dye concentration. This was because as the feed concentration increased, more dye particles would be collected on the surface of the membrane, which increased the fouling, and thereby reduced the flux and increased the percentage of dye rejection. On the other hand, the average percentage of dye rejection increased as the time filtration increased.49
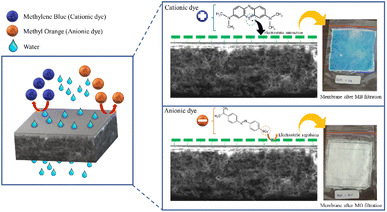
Fig. 9 shows the performance of the R-HDPE 15% membranes on the separation of MB and MO dye with several concentrations. Based on the rejection data, the R-HDPE 15% membranes had a higher percentage of rejection in MB separation than for MO. MB is cationic, while MO is an anionic dye. Based on the potential zeta measurements, HDPE had a negative charge of −36.9 with water dispersions; thus MB had a high rejection percentage due to the strong electrostatic interaction between the positive charge of the MB dye and negative charge of the R-HDPE 15% membrane. MO filtration showed lower rejection rates than MB, while MO is an anionic dye, thus improving the repulsive force between the dye molecules and membrane surface. This phenomenon is described in Fig. 10. Gnanasekaran et al.50 also reported that incorporating MIL-100 (Fe) into chitosan led to a high rejection of MB due to the negative charge of the membrane. Based on comparisons with HDPE waste membranes from previous reported studies and commercial HDPE in Table 4, the membranes in this study showed higher rejection of the dyes.
| Membrane | Contaminant | Rejection (%) | Ref. |
|---|---|---|---|
| a Commercial membranes. | |||
| HDPE | MB 10 ppm | 98.33 | This research |
| MB 50 ppm | 99.27 | ||
| MB 100 ppm | 99.72 | ||
| MO 10 ppm | 83.64 | ||
| MO 50 ppm | 88 | ||
| MO 100 ppm | 89.8 | ||
| HDPE | River turbidity | 12–35 | Zukimin et al.27 |
| PES/HDPE/LDPE/kaolin | Cd 50 ppm | 69.3 | Mubarak et al.28 |
| Pb 50 ppm | 76.2 | ||
| Cu 50 ppm | 82.5 | ||
| HDPEa | Humic acid | 89.54 | Akbari et al.25 |
| HDPEa | BSA | 68 | Shokri et al.29 |
| HDPE/EVAa | Salt | 99.9 | Tang et al.51 |
| PPSUa | Drupel black NT 50 ppm | 85 | Ghadhban et al.52 |
| Bentonitea | MB 20 ppm | 78 | Bouazizi et al.53 |
| DR 80 20 ppm | 99 | Daraei et al.54 | |
| AO 74 20 ppm | 83 | ||
| PVDF/chitosan/claya | MB 1 ppm | 85 | |
| PAAa | MO 32,7 ppm | 86 | Fradj et al.55 |
| Toluidine blue 27 ppm | 89 | ||
4 Conclusions
HDPE plastic waste can be used as a membrane material to remove MB and MO from water. By comparing the use of commercial HDPE and plastic HDPE for membrane manufacture, the results showed that the concentration of commercial HDPE required was higher, namely 20% w/w, compared to HDPE plastic waste (15% w/w). Both HDPE membranes were made using the TIPS method with mineral oil solvents, resulting in low solvent costs. Due to its negative charge, this membrane was effective for rejecting dye stuffs with positive charge, such as MB, with a rejection of up to 99.72% at an initial MB concentration of 100 ppm. On the other hand, for anionic dyes, such as MO, the percentage rejection was lower at up to 89.8% with the same concentration. Based on the research, membranes with a composition of 15% were more effective in removing MB and MO than the other membranes. Higher polymer concentrations resulted in better rejection results, but lower flux yields. The low flux value produced in the membrane with a concentration of 15% was due to the denser pore size as a result of the addition of the polymer.Author contributions
Utari Zulfiani: conceptualization, investigation, resources, methodology, and writing – original draft. Afdhal Junaidi and Cininta Nareswari: review & editing. Badrut Tamam Ibnu Ali: conceptualization and methodology. Nurul Widiastuti: conceptualization, supervision, review & editing. Saiful: supervision, review and editing. Juhana Jaafar: supervision and resources, and formal analysis. Alvin Rahmad Widyanto: conceptualization, review – editing and visualization. Hadi Nugraha Cipta Dharma: formal analysis.Conflicts of interest
There are no conflicts to declare.Acknowledgements
The authors would like to appreciate the research funding provided by the Ministry of Education and Culture Republic of Indonesia under Penelitian Magister Menuju Doktor Sarjana Unggul, Contract number: 1478/PKS/ITS/2022.References
- Y. A. Hidayat, S. Kiranamahsa and M. A. Zamal, AIMS Energy, 2019, 7, 350–370, DOI:10.3934/ENERGY.2019.3.350.
- Y. Peng, P. Wu, A. T. Schartup and Y. Zhang, Proc. Natl. Acad. Sci. U. S. A., 2021, 118(47), 1–6, DOI:10.1073/pnas.2111530118.
- R. Jambeck Jenna, G. Roland, W. Chris, R. Siegler Theodore, P. Miriam, A. Anthony, N. Ramani and L. K. Lavender, Science, 2015, 347, 768–770, DOI:10.1126/science.1260352.
- M. M. A. Shirazi, A. Kargari and M. J. A. Shirazi, Desalin. Water Treat., 2012, 49, 368–375, DOI:10.1080/19443994.2012.719466.
- Y. Zhang, W. Cao, B. Zhu, J. Cai, X. Li, J. Liu, Z. Chen, M. Li and L. Zhang, J. Colloid Interface Sci., 2022, 611, 706–717, DOI:10.1016/j.jcis.2021.12.073.
- I. I. Khan, K. Saeed, I. Zekker, B. Zhang, A. H. Hendi, A. Ahmad, S. Ahmad, N. Zada, H. Ahmad, L. A. Shah, T. Shah and I. I. Khan, Water, 2022, 14, 242, DOI:10.3390/w14020242.
- A. Ajmal, I. Majeed, R. N. Malik, H. Idriss and M. A. Nadeem, RSC Adv., 2014, 4, 37003–37026, 10.1039/c4ra06658h.
- S. Rafaqat, N. Ali, C. Torres and B. Rittmann, RSC Adv., 2022, 12, 17104–17137, 10.1039/d2ra01831d.
- G. Muthuraman, T. T. Teng, C. P. Leh and I. Norli, J. Hazard. Mater., 2009, 163, 363–369, DOI:10.1016/j.jhazmat.2008.06.122.
- J. Fito, S. Abrham and K. Angassa, Int. J. Environ. Res., 2020, 14, 501–511, DOI:10.1007/s41742-020-00273-2.
- A. A. Setyo Purnomo, Biodegradasi Metilen Biru, Deepublish Publisher, Surabaya, 2021 Search PubMed.
- E. Oyarce, K. Roa, A. Boulett, S. Sotelo, P. Cantero-López, J. Sánchez and B. L. Rivas, Polymers, 2021, 13(19), 3450, DOI:10.3390/polym13193450.
- P. K. Gillman, Anaesthesia, 2006, 61, 1013–1014, DOI:10.1111/j.1365-2044.2006.04808.x.
- N. W. Yuningrat, N. Retug and I. M. Gunamantha, J. Sci. Technol., 2016, 5, 692–701, DOI:10.23887/jst-undiksha.v5i1.8275.
- K. O. Iwuozor, J. O. Ighalo, E. C. Emenike, L. A. Ogunfowora and C. A. Igwegbe, Curr. Res. Green Sustainable Chem., 2021, 4, 100179, DOI:10.1016/j.crgsc.2021.100179.
- N. Widiastuti, A. R. Widyanto, I. S. Caralin, T. Gunawan, R. Wijiyanti, W. N. Wan Salleh, A. F. Ismail, M. Nomura and K. Suzuki, ACS Omega, 2021, 6, 15637–15650, DOI:10.1021/acsomega.1c00512.
- N. Widiastuti, I. S. Caralin, A. R. Widyanto, R. Wijiyanti, T. Gunawan, Z. A. Karim, M. Nomura and Y. Yoshida, R. Soc. Open Sci., 2022, 9, 322–334, DOI:10.1098/rsos.211371.
- A. Nasir, F. Masood, T. Yasin and A. Hameed, J. Ind. Eng. Chem., 2019, 79, 29–40, DOI:10.1016/j.jiec.2019.06.052.
- S. Ali, I. A. Shah, I. Ihsanullah and X. Feng, Chemosphere, 2022, 308, 136329, DOI:10.1016/j.chemosphere.2022.136329.
- I. Ihsanullah and M. Bilal, Chemosphere, 2022, 303, 135234, DOI:10.1016/j.chemosphere.2022.135234.
- W. Zhang, H. Song, L. Zhu, G. Wang, Z. Zeng and X. Li, J. Environ. Chem. Eng., 2022, 10, 107202, DOI:10.1016/j.jece.2022.107202.
- N. Widiastuti, R. S. Silitonga, H. N. C. Dharma, J. Jaafar, A. R. Widyanto and M. Purwanto, RSC Adv., 2022, 12, 22662–22670, 10.1039/d2ra04005k.
- B. T. I. Ali, M. Permatasari, N. Widiastuti, Y. Kusumawati, D. Ermavitalini, T. Q. Romadiansyah and W. C. Lestari, in AIP Conference Proceedings, ed. Y. Kusumati and A. S. Purnomo, American Institute of Physics Inc., Department of Chemistry, Faculty of Science and Data Analytics, Institut Teknologi Sepuluh Nopember, Sukolilo, Surabaya, 60111, Indonesia, 2021, vol. 2349, p. 020079, DOI:10.1063/5.0052180.
- N. Widiastuti, E. Sukma Ningtiar, F. Nafilah, B. Tamam Ibnu Ali, A. Setyo Purnomo and T. Qodar Romadiansyah, Mater. Today Proc., 2022, 65, 2940–2945, DOI:10.1016/j.matpr.2022.02.525.
- A. Akbari, R. Yegani, B. Pourabbas and A. Behboudi, Chem. Eng. Res. Des., 2016, 109, 282–296, DOI:10.1016/j.cherd.2016.01.031.
- M. M. Aji, S. Narendren, M. K. Purkait and V. Katiyar, J. Environ. Chem. Eng., 2020, 8, 103650, DOI:10.1016/j.jece.2019.103650.
- N. W. Zukimin, N. Jullok, A. N. M. Razi and M. H. H. Fadzilah, J. Teknol., 2017, 79, 83–88, DOI:10.11113/jt.v79.10441.
- M. F. Mubarak, M. A. Zayed, A. Nafady and A. E. L. Shahawy, Adsorpt. Sci. Technol., 2021, 2021, 1–15, DOI:10.1155/2021/6695398.
- E. Shokri, R. Yegani, S. Heidari and Z. Shoeyb, Chem. Eng. Res. Des., 2015, 100, 237–247, DOI:10.1016/j.cherd.2015.05.025.
- H. Ajari, A. Zrelli, B. Chaouachi and M. Pontié, Int. Polym. Process., 2019, 34(3), 376–382, DOI:10.3139/217.3717.
- H. Matsuyama, K. Hayashi, T. Maki, M. Teramoto and N. Kubota, J. Appl. Polym. Sci., 2004, 93(1), 471–474, DOI:10.1002/app.20461.
- J. E. Anderson, B. R. Kim, S. A. Mueller and T. V. Lofton, Crit. Rev. Environ. Sci. Technol., 2003, 33(1), 73–109, DOI:10.1080/10643380390814460.
- R. Pirow, A. Blume, N. Hellwig, M. Herzler, B. Huhse, C. Hutzler, K. Pfaff, H. J. Thierse, T. Tralau, B. Vieth and A. Luch, Crit. Rev. Toxicol., 2019, 49(9), 742–789, DOI:10.1080/10408444.2019.1694862.
- S. L. Wong, N. Ngadi and T. A. T. Abdullah, Appl. Mech. Mater., 2014, 695, 170–173, DOI:10.4028/www.scientific.net/AMM.695.170.
- M. Fonouni, R. Yegani and S. Anarjani dan, Polyolefins J., 2017, 4, 13–26, DOI:10.22063/POJ.2016.1343.
- H. Barzegar, M. A. Zahed and V. Vatanpour, J. Water Process Eng., 2020, 38, 101638, DOI:10.1016/j.jwpe.2020.101638.
- S. Yang, C. Xiao, Y. Huang, D. Ji and K. Chen, J. Mater. Sci., 2022, 57(7), 4834–4849, DOI:10.1007/s10853-021-06673-9.
- Y. Chernyak, J. Chem. Eng. Data, 2006, 51(2), 416–418, DOI:10.1021/je050341y.
- J. F. Rogers, H. Farazmand and D. E. Creasy, J. Chem. Eng. Data, 1974, 19(2), 118–120, DOI:10.1021/je60061a016.
- Z. Shoeyb, R. Yegani and E. Shokri, Iran. J. Polym. Sci. Technol., 2015, 28, 149–159, DOI:10.22063/JIPST.2015.1241.
- IARC, IARC Monogr. Eval. Carcinog. Risks to Humans, 2014, 100F, 423–428 Search PubMed.
- B. Bodzay and G. Bánhegyi, Int. J. Des. Sci. Technol., 2017, 22, 109–138 Search PubMed.
- Bálint Németh Editor, Proceedings of the 21st International Symposium on High Voltage Engineering, Springer International Publishing, Cham, 2020, vol. 598 Search PubMed.
- J.-H. Lin, Y.-J. Pan, C.-F. Liu, C.-L. Huang, C.-T. Hsieh, C.-K. Chen, Z.-I. Lin and C.-W. Lou, Materials, 2015, 8, 8850–8859, DOI:10.3390/ma8125496.
- X. M. Tan and D. Rodrigue, Polymers, 2019, 11(8), 1160, DOI:10.3390/polym11081310.
- C. Zhang, Y. Bai, Y. Sun, J. Gu and Y. Xu, J. Memb. Sci., 2010, 365, 216–224, DOI:10.1016/j.memsci.2010.09.007.
- M. A. Kivi, H. Alinia, Y. Jafarzadeh and R. Yegani, J. Appl. Polym. Sci., 2019, 136(35), 1–11, DOI:10.1002/app.47914.
- N. Othman, N. Harruddin, A. Idris, Z. Y. Ooi, N. Fatiha and R. N. Raja Sulaiman, Desalin. Water Treat., 2016, 57(26), 12287–12301, DOI:10.1080/19443994.2015.1049554.
- A. Ahmad, S. Puasa and S. Abiding, ASEAN J. Sci. Technol. Dev., 2007, 23(3), 207–216, DOI:10.3125/asean.v23i3.420.
- G. Gnanasekaran, M. S. P. Sudhakaran, D. Kulmatova, J. Han, G. Arthanareeswaran, E. Jwa and Y. S. Mok, Chemosphere, 2021, 284(June), 131244, DOI:10.1016/j.chemosphere.2021.131244.
- N. Tang, X. Hua, Z. Li, L. Zhang, J. Wang, J. Xiang, P. Cheng and X. Wang, Chin. J. Chem. Eng., 2019, 27(5), 1058–1066, DOI:10.1016/j.cjche.2018.12.004.
- M. Y. Ghadhban, H. S. Majdi, K. T. Rashid, Q. F. Alsalhy, D. S. Lakshmi, I. K. Salih dan and A. Figol, Membranes, 2020, 10, 47 CrossRef CAS PubMed.
- A. Bouazizi, M. Breida, B. Achiou, M. Ouammou, J. I. Calvo, A. Aaddane and S. A. Younssi, Appl. Clay Sci., 2017, 149(May), 127–135, DOI:10.1016/j.clay.2017.08.019.
- P. Daraei, S. S. Madaeni, E. Salehi, N. Ghaemi, H. S. Ghari, M. A. Khadivi and E. Rostami, J. Memb. Sci., 2013, 436, 97–108, DOI:10.1016/j.memsci.2013.02.031.
- A. Ben Fradj, R. Lafi, S. Ben Hamouda, L. Gzara, A. H. Hamzaoui and A. Hafiane, J. Photochem. Photobiol., A, 2014, 284, 49–54, DOI:10.1016/j.jphotochem.2014.04.003.
| This journal is © The Royal Society of Chemistry 2023 |

