 Open Access Article
Programmable alignment media from self-assembled oligopeptide amphiphiles for the measurement of independent sets of residual dipolar couplings in organic solvents†
Yuexiao
Lin‡
a,
Jiaqian
Li‡
a,
Si-Yong
Qin‡
 b,
Han
Sun
 c,
Yan-Ling
Yang
a,
Armando
Navarro-Vázquez
 d and
Xinxiang
Lei
 *ab
*ab
aSchool of Pharmaceutical Sciences, South-Central University for Nationalities, Wuhan, 430074, China. E-mail: xxlei@mail.scuec.edu.cn
bKey Laboratory of Analytical Chemistry of the State Ethnic Affairs Commission, South-Central University for Nationalities, Wuhan, 430074, China
cGroup of Structural Chemistry and Computational Biology, Leibniz-Forschungsinstitut für Molekulare Pharmakologie (FMP), 13125 Berlin, Germany
dDepartamento de Química Fundamental, Universidade Federal de Pernambuco Cidade Universitária, CEP 50740-540 Recife, PE, Brazil
First published on 14th April 2022
Abstract
NMR spectroscopy in anisotropic media has emerged as a powerful technique for the structural elucidation of organic molecules. Its application requires weak alignment of analytes by means of suitable alignment media. Although a number of alignment media, that are compatible with organic solvents, have been introduced in the last 20 years, acquiring a number of independent, non-linearly related sets of anisotropic NMR data from the same organic solvent system remains a formidable challenge, which is however crucial for the alignment simulations and deriving dynamic and structural information of organic molecules unambiguously. Herein, we introduce a programmable strategy to construct several distinct peptide-based alignment media by adjusting the amino acid sequence, which allows us to measure independent sets of residual dipolar couplings (RDCs) in a highly efficient and accurate manner. This study opens a new avenue for de novo structure determination of organic compounds without requiring prior structural information.
NMR spectroscopy is one of the classical techniques for structural elucidation of small molecules, relying on a number of complementary structural parameters, such as chemical shifts (δ), nuclear Overhauser effects (NOE), and scalar couplings (J). Advances in the obtention of residual anisotropic NMR parameters in weakly-aligning media enable the determination of constitution,1 conformation, and configuration of organic molecules more accurately than ever before. Among these different anisotropic NMR parameters, such as residual quadrupolar couplings (RQCs),2 residual chemical shift anisotropies (RCSAs),3–7 and residual dipolar couplings (RDCs),6–10 RDCs have been exploited mostly so far. These parameters provide valuable long-range orientation restraints and correlate the spatial disposition of remote chiral centers. For structural elucidation purposes, RDCs should be acquired in a weakly aligned environment, where the isotropic tumbling of analytes is restricted at a very low degree so that high-resolution solution NMR spectra can still be obtained. To introduce such a low degree of alignment, a number of polymer-based lyotropic liquid crystals (LLCs)11–13 and anisotropically swollen gels14–16 have been introduced and developed in the past 20 years.
Anisotropic NMR parameters do not only reveal structural “static” information about the studied molecular system but also dynamical information(which) provided that five sets of observables, obtained by measurement in five different alignment media. These sets should be independent, i.e., not related with each other by linear transformation. Several studies on the dynamic properties of biomolecular systems that make use of a number of water-compatible aligned media have been reported.17,18 A combination of mechanical polymer deformation with a magnetically oriented LC in a variable angle probe has been proposed by Tolman as a means for the obtention of five independent aligning conditions.19
Very recently the groups of Reggelin and Thiele proposed to make use of independent sets of RDCs as a means to resolve de novo the stereochemical configuration of organic compounds.20–23 The increased amount of information provided by the use of independent data sets can, in principle, avoid the use of the generation of trial configurations. In principle, the independent data set should be obtained in alignment media as closely related as possible to minimize changes in the conformational space and this means the use of the same solvent. Although this can be more easily done in water, due to a large variety of available alignment media, measurements of at least five independent sets of RDCs in the same organic solvent remain a formidable challenge, which hampers the application of the de novo structural elucidation techniques mentioned above.
Molecular self-assembly has become a recent strategy for the development of novel alignment media, which relies on the usage of low-molecular-weight molecules as building blocks instead of polymers, which usually require complex synthesis procedures. Furthermore, in contrast to mechanically constrained polymer gels, alignment induced by molecular self-assembly is spontaneous and does not require any special mechanical devices. Until now, several low-molecular-weight compounds that are able to form ordered supramolecular structures by self-assembly have been introduced as alignment media,24–26 some of them belonging to the family of chromonic LC systems.27,28 One such example is the employment of peptide self-assembly for the targeted purpose. Solid-phase peptide synthesis (SPPS) is a mature technique, which allows peptide preparation and programmable design of new peptides in a highly efficient manner. The combination of high structural diversity of peptides and their robust self-assembly ability has thus enabled the development of a number of new alignment media that are compatible with different types of organic solvents and analytes. In 2017, our group pioneered the usage of AAKLVFF as an alignment medium, an oligopeptide that is able to be self-assembled into nanotubes, which became the first methanol compatible LC alignment medium for RDC measurement.29 Following this work, we introduced a number of self-assembling oligopeptide amphiphiles (OPAs) consisting of an aliphatic tail and a peptide as alignment media.30–33 These OPA-based media are compatible with different polar solvents such as CD3OD, DMSO-d6, and D2O, allowing the facile anisotropic NMR measurements of organic molecules with different polarities.31 They provided very high quality NMR spectra allowing the measurement of anisotropic NMR parameters with high accuracy.
The relative stereochemical configuration of a number of novel natural products such as sarcomililate A,34 xylarichalasin A,35 spiroepicoccin A,6 polyoxygenated sesquiterpenoid,36 curtachalasins,37 herpotrichones A and B,38 chaetolactam A,39 and scopariusicide C40 has been elucidated based on RDCs obtained in our peptide-based media. Nonetheless, the unique potential of anisotropic NMR spectroscopy for structural determination has not been fully unfolded yet. In this regard, recent work based on model-free analysis seems very promising.
A fundamental main prerequisite of these methods is the acquisition of multiple independent RDC datasets in the same organic solvent system.20,41–43 Furthermore, the effective measurements of RDC data in multiple alignment media have also been revealed to be essential for the extraction of dynamic properties of the molecules,44,45 and paving the way for the determination of the relative configuration of small molecules using simulations of the alignment process.46 To this end, the development of alignment media, with sufficiently divergent orientations, for the measurement of independent RDC datasets is urgently needed.
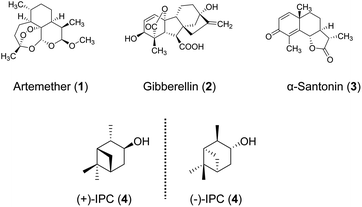
Keeping this in mind, we aimed to redesign different OPAs for acquiring multiple sets of RDC data in the same solvent system. Generally, OPAs consisting of a palmitic acid tail and a charged peptide head revealed high propensity for self-assembling in different organic solvents. The structural similarity of the existing OPAs inspired us to develop new programmable alignment media through adjustment of the peptide sequence. The existing OPAs contain either a positive or negative net charge. In contrast, we tailored within this study a neutral zwitterionic OPA with the C16-VVAAEEKK-NH2 sequence (named as OPA-1, Scheme 1), which is also able to self-assemble in methanol. Furthermore, it should be noted that the original self-aligning peptide AAKLVFF was derived from the core section of β-amyloid (Aβ),29 where the π–π stacking interaction in the contiguous diphenylalanine motif (FF) plays a critical role in the molecular self-assembly. Peptides containing the FF segment have been reported to exhibit much higher propensities to form a liquid-crystalline phase with a long-range order.47,48 Inspired by this, we further modified OPA-1 and incorporated an FF segment into it to obtain C16-FFVVAAEEKK-NH2 peptide (OPA-2). The same type of modification was employed with the previously reported OPA C16-VVVVKKK-NH2 (OPA-3) to obtain C16-FFVVVVKKK-NH2 (OPA-4, Scheme 1). Both OPA-2 and OPA-4 exhibit similar self-assembly properties when compared with the OPA-1 and OPA-3 parent structures.
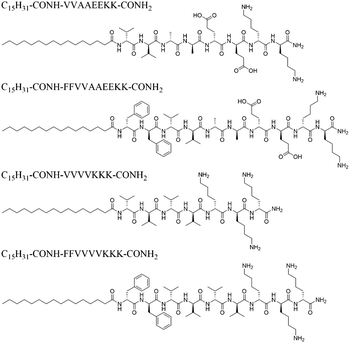 | ||
| Scheme 1 Sequence structures of OPAs are used for creating the programmable alignment media for RDC measurements. | ||
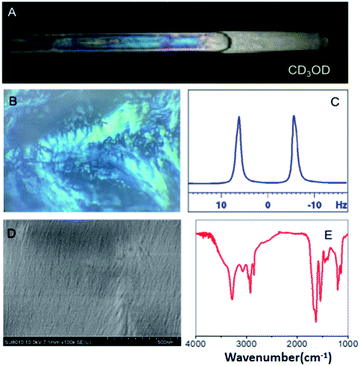
An OPA-1 methanol solution displayed bright birefringence between the two polarizers (Fig. 1A) of a polarized optical microscope (POM) (Fig. 1B), evidencing the formation of a liquid crystal phase. The morphology of the self-assembly was investigated through scanning electron microscopy (SEM). As shown in Fig. 1D, a fibrillar ordered structure was observed. We further studied the self-assembly mechanism of OPA-1, where infrared (FT-IR) and circular dichroism (CD) spectroscopies were used to probe the secondary structure of OPA-1. The FT-IR spectrum of lyophilized nanofibers showed an amide I band near 1629 cm−1 and an amide II band near 1540 cm−1 (Fig. 1E), indicating that OPA-1 adopts a β-sheet conformation when self-assembled. In addition, the N–H stretching band at 3285 cm−1 evidences hydrogen bonding in the formed β-sheet. This β-sheet motif was confirmed by CD spectroscopy, where positive (195 nm) and negative (216 nm) bands typical of β-sheet structures, appear in the spectrum (Fig. S8, ESI†).
In parallel, we recorded a 1D 2H NMR spectrum of CD3OD in 5% OPA-1, where a RQC of 10 Hz was measured for the CD3 signal (Fig. 1C) evidencing the alignment of the LC OPA-1 phase in the magnetic field. This data indicated the potential alignment properties of OPA-1 for anisotropic NMR investigation. We then recorded a set of NMR spectra for our first test compound, artemether 1 (Scheme 2), a derivative of artemisinin with high antimalarial activity. After introducing 10 mg of 1 into the medium, the RQCs of CD3 and OD signals remained nearly unchanged in the 1D 2H NMR spectrum of CD3OD (Fig. S28†) showing that the LC phase remains stable upon addition of the analyte. Notably, the 1H NMR spectrum of 1 in a 5% OPA-1 CD3OD solution presents a very moderate degree of broadening (Fig. S10†), and we then recorded [1H, 13C]-CLIP-HSQC spectra of 1 in OPA-1/CD3OD and isotropic CD3OD, respectively (Fig. 2). By subtracting the couplings measured in the isotropic media from the ones under the anisotropic conditions, an experimental RDC dataset ranging from −15.0 to 22.4 Hz was obtained (Table 1). These observations indicate very good applicability of OPA-1 for anisotropic NMR measurements.
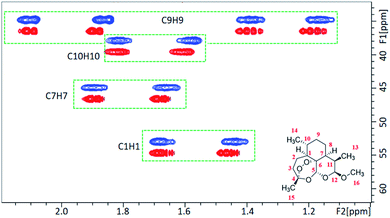 | ||
| Fig. 2 A portion of the CLIP-HSQC spectrum of artemether 1 in the isotropic CD3OD medium (red) and anisotropic OPA-1 phase (blue). | ||
| Artemether atom number | 1 D CH | |||
|---|---|---|---|---|
| OPA-1 | OPA-2 | OPA-3 | OPA-4 | |
| C1H1 | 20.7 | 24.2 | −10.8 | 18.3 |
| C3H3a | 3.6 | −1.9 | −1.7 | −3.6 |
| C3H3b | 20.2 | 39.9 | 6.4 | 25.8 |
| C5H5 | 2.0 | 32.0 | 30.0 | 31.2 |
| C7H7 | 22.4 | 22.0 | −11.8 | 14.5 |
| C9H9a | −15.0 | 7.6 | 26.1 | 16.6 |
| C9H9b | 19.7 | 19.7 | −15.8 | 13.3 |
| C11H11 | −5.8 | 26.9 | 28.1 | 25.6 |
| C12H12 | −11.6 | −25.7 | −10.4 | −18.3 |
| C13H13(Me) | 0.4 | 3.9 | −0.7 | 2.6 |
| C14H14(Me) | 2.2 | 7.2 | 5.5 | 8.2 |
| C15H15(Me) | 7.4 | 6.8 | 2.6 | 2.0 |
| Q factor | 0.07 | 0.07 | 0.06 | 0.06 |
| GDO | 7.6 × 10⁻⁴ | 1.3 × 10⁻³ | 9.6 × 10⁻⁴ | 1.1 × 10⁻³ |
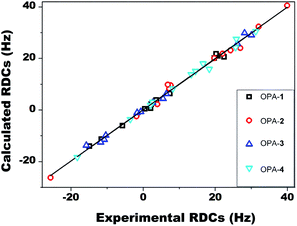
To examine the accuracy of experimental RDCs, we fitted the experimental RDC values to the structure of 1 optimized at the DFT level. Here, the singular value decomposition (SVD) method as implemented in the program MSpin49 was employed to determine the alignment tensor and to obtain the back-calculated RDCs and generalized degree of order (GDO) values. As shown in Fig. 3, excellent agreement between experimental and back-calculated RDC values was obtained, with a low Q factor of 0.07, confirming the accuracy of the RDC measurement of artemether 1 in OPA-1. The obtained alignment tensor presented a generalized degree of order (GDO) of 7.6 × 10⁻⁴.
Acquisition of RDC data for artemether 1 in OPA-2/CD3OD solution furnished values in a range of −25.7 to 39.9 Hz (Table 1). The ratio of GDO values between OPA-2 and OPA-1 is 1.72, indicating a significantly stronger alignment of the analyte 1 in the OPA-2 medium compared to OPA-1 (Table 2). Interestingly, we found that the RDCs acquired from OPA-2 did not linearly scale with the corresponding ones measured in OPA-1. Some of the RDC values showed even opposite signs in the two media. For instance, RDCs of −15.0 Hz and −5.8 Hz from the OPA-1 medium corresponding to C9–H9a and C11–H11 changed to 7.6 Hz and 26.9 Hz in the OPA-2 medium, respectively. These data clearly indicate that artemether 1 exhibits significantly different orientations, when aligned in OPA-1 or OPA-2, respectively.
| Ratio of GDO | OPA-1 | OPA-2 | OPA-3 | OPA-4 |
|---|---|---|---|---|
| β-angle | ||||
| a G: GDO. | ||||
| OPA-1 | — | G 2/G 1 = 1.72 | G 3/G 1 = 1.26 | G 4/G 1 = 1.40 |
| OPA-2 | 42.8 | — | G 3/G 2 = 0.73 | G 4/G 2 = 0.81 |
| OPA-3 | 91.7 | 51.4 | — | G 4/G 3 = 1.10 |
| OPA-4 | 61.9 | 35.1 | 57.3 | — |
In addition, we used the β angle as a quantitative measure for the difference of the orientation.11 A β angle of 0 indicates that the orientation of the same analyte in two different media remains the same. Note that a 90° change in the orientation of the principal axes is correlated with a 60° change in the angle. A 90° change in the β angle implies not only a 90° rotation of the principal axes but a full change in the rhombicity of the tensor. The β angle has been frequently used to quantify the enantiodiscriminating properties of the alignment media.50 For analyte 1 measured in OPA-1 and OPA-2, we obtained a β angle of 42.8° (Table 2), indicating a considerably different orientation of the same analyte in the two structurally related media. Alignment and inertia tensors of artemether 1 in OPA-1 and OPA-2 are shown in Fig. 4.
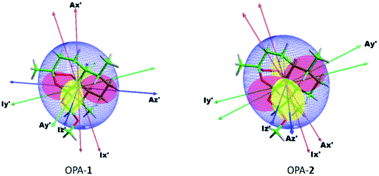 | ||
| Fig. 4 Principle axes (PA) of the inertia tensor (I), and PA and surface representation51 of the alignment tensor (A) of artemether in OPA-1 and OPA-2. | ||
For many alignment media, the concentration of the medium can drastically affect the alignment strength. We reduced the peptide concentration here to investigate its influence on the degree of alignment. Using just 2% of OPA-2, 12 1DCH of 1 were obtained using RDCs in a range of −17.5 to 29.0 Hz, corresponding to a GDO of 8.6 × 10⁻⁴ (Table S3†). The same Q-factor of 0.07 was obtained using the RDCs from the 2% OPA-2 solution. This observation suggests that the alignment strength in OPA-2 is enhanced by the FF moiety in the peptide sequence, thus enabling self-assembly at even a lower peptide concentration. Additionally, we compared the RDCs acquired in OPA-2 with those of different peptide concentrations (2% and 5%). If we compare the RDC values of analyte 1 in the 2% and 5% solutions they are nearly linearly correlated with a very small β angle of 14.1°, indicating that the orientation of the analyte does not differ significantly by changing the medium concentration.
We further measured the RDCs of 1 in 5% OPA-3 and OPA-4, ranging from −15.8 to 30.0 Hz for OPA-3 and −18.3 to 31.2 Hz for OPA-4, respectively (Table 1). The size of the RDC values is comparable with the ones acquired in OPA-1 and OPA-2, suggesting that OPA-3 and OPA-4 are also suitable weak alignment media for small molecules. A GDO of 9.6 × 10⁻⁴ in OPA-3 and 1.1 × 10⁻³ in OPA-4 indicated again that the alignment strength is enhanced by the incorporation of an FF segment into the peptide sequence. Moreover, we systematically compared the GDO and β angle derived from the RDC data of 1 measured in four different media, OPA-1 to OPA-4 (Table 2). Intriguingly, large angles were obtained in all pairwise comparisons. This result clearly suggested that it is possible to measure four independent RDC datasets using these media that were modified by simply adjusting their peptide sequences.
To further test the applicability of these novel self-aligning peptides as alignment media, we chose gibberellin 2 as a second test compound. Using the medium OPA-1, RDCs of gibberellin ranging from −13.8 to 15.7 Hz were acquired from the [1H, 13C]-CLIP-HSQC spectra (Table S6†). Similar to 1, larger RDCs ranging from −21.8 to 24.3 Hz were obtained from the medium OPA-2 at the same concentration. In consistence with analyte 1, a larger GDO for 2 was obtained when an FF segment is introduced into the sequence (ratio of GDO![[thin space (1/6-em)]](https://www.rsc.org/images/entities/char_2009.gif) :
:![[thin space (1/6-em)]](https://www.rsc.org/images/entities/char_2009.gif) OPA-2/OPA-1 = 1.62) again indicating that the alignment strength is increased due to the π–π stacking effect by introducing the FF segment into the peptide sequence.
OPA-2/OPA-1 = 1.62) again indicating that the alignment strength is increased due to the π–π stacking effect by introducing the FF segment into the peptide sequence.
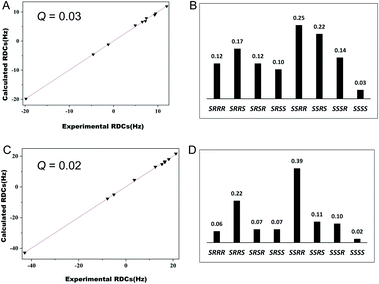
Furthermore, we evaluated the possibility of employing these new media for stereochemical elucidation. We chose α-santonin 3 as a test compound. [1H, 13C]-CLIP-HSQC spectra of 3 were recorded in OPA-1 and OPA-2 media, respectively. RDCs ranging from −19.8 to 12.0 Hz for OPA-1 and −42.9 to 21.2 Hz for OPA-2 were accordingly extracted (Tables S11 and S12†). We fitted the experimental RDCs to the DFT optimized structures of eight possible relative configurations of 3. For both RDC data in OPA-1 and OPA-2, the correct stereoisomer SSSS exhibits the lowest Q factors (0.03 for OPA-1 and 0.02 for OPA-2), whereas the Q factors of other configurations are significantly larger (Fig. 5). Interestingly, RDC data in OPA-1 could distinguish the correct configuration from the wrong ones, better than those of OPA-2. This result does not necessarily indicate that OPA-1 is a better alignment medium than OPA-2, but rather shows that a number of independent RDC datasets measured in different alignment media could increase the unambiguity for the stereochemical elucidation.
According to our previous study, the self-assembled AAKLVFF medium is not suitable for the RDC measurement of chiral alcohol isopinocampheol (IPC) 4,29 however the same difficulty was also found for some other media.25 Herein, we tested the applicability of these four new self-assembled OPAs for the RDC measurement of (+)-4. Interestingly, all of the OPAs could form a stable LC phase with 4 (Fig. S31†), while the RDCs could be effectively extracted from these media (Fig. 6). As an example, using OPA-1, we extracted a set of RDCs ranging from −10.0 to 8.8 Hz. As a next step, we investigated the enantiodifferentiating properties of OPA-1 using both enantiomeric forms of 4 as test compounds. Here, both L-OPA-1 and D-OPA-1 were synthesized. We measured the RDCs of (+)-4 and (−)-4 in both enantiomeric phases of OPA-1 and calculated the β angle pairwise. As shown in Fig. 7, the β angles derived from the RDC data in enantiomorphous combination (e.g. (+)-4 and (−)-4 in L-OPA-1) are remarkably larger than the ones from diastereomorphous combination (e.g. (+)-4 in L-OPA-1 and (−)-4 in D-OPA-1). Although these data indicated much weaker enantiodiscriminating properties of OPA-1 compared to polyacetylenes,11 they shed light on the further development of new chiral alignment media based on the self-aligning peptides.
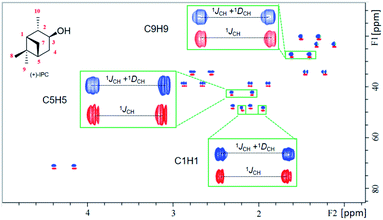 | ||
| Fig. 6 Overlaid [1H, 13C]-CLIP-HSQC spectra of (+)-IPC in the isotropic phase (red contours) and 5% OPA-4 alignment medium (anisotropic, blue contours). | ||
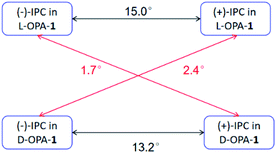 | ||
| Fig. 7 Comparison of the β angles of both enantiomorphous (black lines) and diastereomorphous (red lines) interactions for (+)-IPC and (−)-IPC with D- and L-OPA-1, respectively. | ||
Since self-assembled peptides could be effectively programmed by tailoring the OPA structures, we speculated that the crude peptides without the further purification process may be ready to be used as alignment media, as the main impurities should present a similar structure to the component. We, therefore, used a crude OPA-1 phase with a purity of 85.7% as the anisotropic medium for aligning α-santonin. A 2H quadrupole splitting of crude OPA-1 for CD3 and the OD signal of the solvent was observed (Fig. S30†), indicating the formation of an anisotropic phase in the crude OPA-1 medium. We further measured RDCs of α-santonin ranging from −14.5 to 7.9 Hz. As shown in Table S15 and Fig. S60,† a Q factor of 0.05 for the correct SSSS configuration was determined by structural fitting, which was only slightly higher than the one obtained from OPA-1 with a purity of 98.0% (Table 3). Furthermore, we could show that the RDC data were accurate enough to differentiate the correct stereoisomer SSSS from the wrong ones. This result therefore suggested that the crude OPA phases could be directly exploited as the alignment media for RDC measurement, without the time-consuming and complicated peptide purification process.
| Analyte | Purity [%] | RDC range [Hz] | Q factor |
|---|---|---|---|
| α-Santonin | 98.0 | −19.8 to 12.0 | 0.03 |
| 85.7 | −14.5 to 7.9 | 0.05 |
As for some rare analytes such as new natural and synthetic products, it is desirable to retrieve the analytes after the anisotropic NMR measurements. We thus tested here the feasibility to recollect all analytes 1–3 from the anisotropic phases. Due to the remarkable difference in their polarities, OPAs could be easily separated from the analytes using column chromatography separation. Based on the ultraviolet detection, a recovery of 80–90% for three analytes was determined (Table S22†). This simple recovery process of the analytes from OPA phases indicates that OPAs are suitable alignment media for the structural elucidation of organic molecules with limited availability.
To further verify the linear independence of the alignment tensors, the RDC data of gibberellin and α-santonin in OPA-3 and OPA-4 media were also collected. The intertensor β angles for compounds 1–4 were calculated for the four media. As expected, significantly different orientations were obtained, as shown in Tables S10, S16 and S21.† Furthermore, a PCA analysis of all the compounds obtained in the four media using the SECONDA method52,53 revealed three non-zero eigenvalues as expected for four independent alignment media. We quantified the degree of data independence furnished by RDC measurement in the four OPA alignment media. As proposed by Tolman,18 this can be done by SVD decomposition of a bidimensional matrix where its columns contain the RDC data obtained in each alignment medium. The ratio between the first and last singular values quantifies the condition of the matrix. The low condition numbers so obtained indicate good independence of the here-synthesized media. We also evaluated how efficient would be the combination of only three media. As shown in Table 4, the best behaving combinations, with condition numbers always below 20, for the four molecules herein tested are OPA-1/OPA-2/OPA-4 and OPA-2/OPA-3/OPA-4.
| Condition numbers | OPA-1,2,3 | OPA-1,2,4 | OPA-1,3,4 | OPA-2,3,4 | OPA-1,2,3,4 |
|---|---|---|---|---|---|
| Artemether | 12.13 | 17.15 | 7.55 | 13.06 | 22.14 |
| Gibberellin | 29.01 | 17.10 | 32.29 | 18.27 | 36.57 |
| α-Santonin | 16.67 | 14.85 | 21.45 | 15.01 | 26.67 |
| IPC | 9.55 | 15.41 | 25.00 | 8.21 | 26.86 |
Conclusions
In this work, we demonstrated a programmable strategy for constructing multiple self-aligning peptide-based alignment media by adjusting the peptide sequences. These new media enabled the measurement of a number of independent sets of RDCs in the same organic solvent system. In addition, our study here revealed that the incorporation of an aromatic FF into the oligopeptide backbone could enhance the alignment strength of the media. Owing to the programmable feature, we can enrich the existing alignment media and extract the RDCs of some analytes that were difficult to measure using the original AAKLVFF phase, as was demonstrated with IPC. Intriguingly, OPAs possess weak enantiodiscriminating properties, which paves the way for developing new chiral alignment media based on the self-aligning peptides. We further showed that the crude peptides without the purification procedure could be readily used as alignment media for the precise RDC measurement, which remarkably simplified the preparation procedure of the alignment media. We further showed that the analytes could be retrieved with a simple procedure with a high recovery rate of 80–90%. This feature is important for RDC measurements of rare analytes. We believe that this study demonstrated a new strategy for developing novel independent alignment media with conceivable efforts and thus offers a unique opportunity for de novo structural determination of organic molecules without prior structural information.Data availability
The datasets supporting this article have been uploaded as part of the ESI.†Author contributions
X. Lei designed the study and supervised the project. Y. X. Lin, J. Q. Li and S.-Y. Qin performed the experiments. Y.-L. Yang, H. Sun and A. Navarro-Vázquez collected and analyzed the data. All the authors discussed the results and co-wrote the manuscript.Conflicts of interest
There are no conflicts to declare.Acknowledgements
This work was supported by the National Natural Science Foundation of China (21874158), and the Natural Science Foundation of Hubei province of China (2019CFA072). We thank the Analytical & Measuring Center, School of Pharmaceutical Sciences, SCUN for their help with NMR measurements. ANV thanks Conselho Nacional de Desenvolvimento Científico e Tecnológico (CNPQ) for financial support (426216/2018-0) and a personal research fellowship (311683/2019-3).Notes and references
- G. Kummerlőwe, B. Crone, M. Kretschmer, S. F. Kirsch and B. Luy, Angew. Chem., Int. Ed., 2011, 50, 2643–2645 CrossRef PubMed.
- P. Lesot, R. R. Gil, P. Berdagué and A. Navarro-Vázquez, J. Nat. Prod., 2020, 83, 3141–3148 CrossRef CAS PubMed.
- F. Hallwass, M. Schmidt, H. Sun, A. Mazur, G. Kummerlöwe, B. Luy, A. Navarro-Vázquez, C. Griesinger and U. M. Reinscheid, Angew. Chem., Int. Ed., 2011, 50, 9487–9490 CrossRef CAS PubMed.
- D. J. Milanowski, N. Oku, L. K. Cartner, H. R. Bokesch, R. T. Williamson, J. Saurí, Y. Liu, K. A. Blinov, Y. Ding, X.-C. Li, D. Ferreira, L. A. Walker, S. Khan, M. T. Davies-Coleman, J. A. Kelley, J. B. McMahon, G. E. Martin and K. R. Gustafson, Chem. Sci., 2018, 9, 307–314 RSC.
- N. Nath, J. C. Fuentes-Monteverde, D. Pech-Puch, J. Rodríguez, C. Jiménez, M. Noll, A. Kreiter, M. Reggelin, A. Navarro-Vázquez and C. Griesinger, Nat. Commun., 2020, 11, 4372 CrossRef CAS PubMed.
- X.-L. Li, L.-P. Chi, A. Navarro-Vázquez, S. Hwang, P. Schmieder, X.-M. Li, X. Li, S.-Q. Yang, X. Lei, B.-G. Wang and H. Sun, J. Am. Chem. Soc., 2020, 142, 2301–2309 CrossRef CAS PubMed.
- I. E. Ndukwe, Y. H. Lam, S. K. Pandey, B. E. Haug, A. Bayer, E. C. Sherer, K. A. Blinov, R. T. Williamson, J. Isaksson, M. Reibarkh, Y. Liu and G. E. Martin, Chem. Sci., 2020, 11, 12081–12088 RSC.
- G.-W. Li, H. Liu, F. Qiu, X.-J. Wang and X. Lei, Nat. Prod. Bioprospect., 2018, 8, 279–295 CrossRef CAS PubMed.
- Y. Liu, A. Navarro-Vázquez, R. R. Gil, C. Griesinger, G. E. Martin and R. T. Williamson, Nat. Protoc., 2019, 14, 217–247 CrossRef CAS PubMed.
- P. Tzvetkova, U. Sternberg, T. Gloge, A. Navarro-Vázquez and B. Luy, Chem. Sci., 2019, 10, 8774–8791 RSC.
- N.-C. Meyer, A. Krupp, V. Schmidts, C. M. Thiele and M. Reggelin, Angew. Chem., Int. Ed., 2012, 124, 8459–8463 CrossRef.
- G.-W. Li, J.-M. Cao, W. Zong, L. Hu, M.-L. Hu, X. Lei, H. Sun and R. X. Tan, Chem.–Eur. J., 2017, 23, 7653–7656 CrossRef CAS PubMed.
- A. Krupp, M. Noll and M. Reggelin, Magn. Reson. Chem., 2021, 59, 577–586 CrossRef CAS PubMed.
- J. C. Freudenberger, P. Spiteller, R. Bauer, H. Kessler and B. Luy, J. Am. Chem. Soc., 2004, 126, 14690–14691 CrossRef CAS PubMed.
- C. Merle, G. Kummerlöwe, J. C. Freudenberger, F. Halbach, W. Stöwer, C. L. V. Gostomski, J. Höpfner, T. Beskers, M. Wilhelm and B. Luy, Angew. Chem., Int. Ed., 2013, 125, 10499–10502 CrossRef.
- K. A. Farley, M. R. M. Koos, Y. Che, R. Horst, C. Limberakis, J. Bellenger, R. Lira, L. F. Gil-Silva and R. R. Gil, Angew. Chem., Int. Ed., 2021, 133, 26518–26523 CrossRef.
- J. Meiler, J. J. Prompers, W. Peti, C. Griesinger and R. Brüschweiler, J. Am. Chem. Soc., 2001, 123, 6098–6107 CrossRef CAS PubMed.
- J. R. Tolman, J. Am. Chem. Soc., 2002, 124, 12020–12030 CrossRef CAS PubMed.
- K. Ruan and J. R. Tolman, J. Am. Chem. Soc., 2005, 127, 15032–15033 CrossRef CAS PubMed.
- M. Köck, M. Reggelin and S. Immel, Mar. Drugs, 2021, 19, 283 CrossRef PubMed.
- S. Immel, M. Köck and M. Reggelin, Mar. Drugs, 2022, 20, 14 CrossRef CAS PubMed.
- F. A. Roth, V. Schmidts and C. M. Thiele, J. Org. Chem., 2021, 86, 15387–15402 CrossRef CAS PubMed.
- F. A. Roth, V. Schmidts, J. Rettig and C. M. Thiele, Phys. Chem. Chem. Phys., 2022, 24, 281–286 RSC.
- Lokesh and N. Suryaprakash, Chem. Commun., 2013, 49, 2049–2051 RSC.
- M. Leyendecker, N.-C. Meyer and C. M. Thiele, Angew. Chem., Int. Ed., 2017, 56, 11471–11474 CrossRef CAS PubMed.
- K. Knoll, M. Leyendecker and C. M. Thiele, European J. Org. Chem., 2019, 2019, 720–727 CrossRef CAS.
- E. Troche-Pesqueira, M.-M. Cid and A. Navarro-Vázquez, Org. Biomol. Chem., 2014, 12, 1957–1965 RSC.
- D. G. B. Silva, F. Hallwass and A. Navarro-Vázquez, Magn. Reson. Chem., 2020, 59, 408–413 CrossRef PubMed.
- X. Lei, F. Qiu, H. Sun, L. Bai, W. X. Wang, W. Xiang and H. Xiao, Angew. Chem., Int. Ed., 2017, 56, 12857–12861 CrossRef CAS PubMed.
- S.-Y. Qin, W.-Q. Ding, Z.-W. Jiang, X. Lei and A.-Q. Zhang, Chem. Commun., 2019, 55, 1659–1662 RSC.
- S. Qin, Y. Jiang, H. Sun, H. Liu, A. Zhang and X. Lei, Angew. Chem., Int. Ed., 2020, 59, 17097–17103 CrossRef CAS PubMed.
- W.-Q. Ding, H. Liu, S.-Y. Qin, Y. Jiang, X. Lei and A.-Q. Zhang, ACS Appl. Bio Mater., 2020, 3, 8989–8996 CrossRef CAS PubMed.
- Y. Jiang, Y. Zhao, A.-Q. Zhang, X. Lei and S.-Y. Qin, Chem. Commun., 2021, 57, 6181–6184 RSC.
- M. Yang, X.-L. Li, J.-R. Wang, X. Lei, W. Tang, X.-W. Li, H. Sun and Y.-W. Guo, J. Org. Chem., 2019, 84, 2568–2576 CrossRef CAS PubMed.
- W. X. Wang, X. Lei, Y. L. Yang, Z. H. Li, H. L. Ai, J. Li, T. Feng and J. K. Liu, Org. Lett., 2019, 21, 6957–6960 CrossRef CAS PubMed.
- Q. Wu, F. Ye, X.-L. Li, L.-F. Liang, J. Sun, H. Sun, Y.-W. Guo and H. Wang, J. Org. Chem., 2019, 84, 3083–3092 CrossRef CAS PubMed.
- W.-X. Wang, X. Lei, H.-L. Ai, X. Bai, J. Li, J. He, Z.-H. Li, Y.-S. Zheng, T. Feng and J.-K. Liu, Org. Lett., 2019, 21, 1108–1111 CrossRef CAS PubMed.
- W. Han, G.-Y. Wang, J. Tang, W. Wang, H. Liu, R. R. Gil, A. Navarro-Vázquez, X. Lei and J. Gao, Org. Lett., 2020, 22, 405–409 CrossRef CAS PubMed.
- W.-Y. Zu, J.-W. Tang, K. Hu, Y.-F. Zhou, L.-L. Gou, X.-Z. Su, X. Lei, H.-D. Sun and P.-T. Puno, J. Org. Chem., 2021, 86, 475–483 CrossRef CAS PubMed.
- S.-P. Chen, K. Hu, X.-R. Li, L. Zhang, H.-D. Sun and P.-T. Puno, Tetrahedron Lett., 2021, 73, 153133 CrossRef CAS.
- W. Peti, J. Meiler, R. Brüschweiler and C. Griesinger, J. Am. Chem. Soc., 2002, 124, 5822–5833 CrossRef CAS PubMed.
- F. Li, A. Grishaev, J. Ying and A. Bax, J. Am. Chem. Soc., 2015, 137, 14798–14811 CrossRef CAS PubMed.
- K. Ruan, K. B. Briggman and J. R. Tolman, J. Biomol. NMR, 2008, 41, 61–76 CrossRef CAS PubMed.
- J. R. Tolman and K. Ruan, Chem. Rev., 2006, 106, 1720–1736 CrossRef CAS PubMed.
- Y. Wang, L. An, Y. Yang and L. Yao, Anal. Chem., 2020, 92, 15263–15269 CrossRef CAS PubMed.
- A. Ibáñez de Opakua, F. Klama, I. E. Ndukwe, G. E. Martin, R. T. Williamson and M. Zweckstetter, Angew. Chem., Int. Ed., 2020, 59, 6172–6176 CrossRef PubMed.
- M. Reches and E. Gazit, Science, 2003, 300, 625–627 CrossRef CAS PubMed.
- Y. Wang, W. Qi, J. Wang, Q. Li, X. Yang, J. Zhang, X. Liu, R. Huang, M. Wang, R. Su and Z. He, Chem. Mater., 2018, 30, 7902–7911 CrossRef CAS.
- A. Navarro-Vázquez, Magn. Reson. Chem., 2012, 50, S73–S79 CrossRef PubMed.
- A. Navarro-Vázquez, P. Berdagué and P. Lesot, ChemPhysChem, 2017, 18, 1252–1266 CrossRef PubMed.
- F. Kramer, M. V. Deshmukh, H. Kessler and S. J. Glaser, Concepts Magn. Reson., 2004, 21, 10–21 CrossRef.
- J. C. Hus, W. Peti, C. Griesinger and R. Brüschweiler, J. Am. Chem. Soc., 2003, 125, 5596–5597 CrossRef CAS PubMed.
- J. C. Hus and R. Brüschweiler, J. Biomol. NMR, 2002, 24, 123–132 CrossRef CAS PubMed.
Footnotes |
| † Electronic supplementary information (ESI) available. See https://doi.org/10.1039/d2sc01057g |
| ‡ These authors contributed equally to this work. |
| This journal is © The Royal Society of Chemistry 2022 |

