 Open Access Article
Exploiting directed self-assembly and disassembly for off-to-on fluorescence responsive live cell imaging†‡
Niamh Curtin a,
Massimiliano Garre
 a,
Jean-Baptiste Bodin
 b,
Nicolas Solem
 c,
Rachel Méallet-Renaultb and
Donal F. O'Shea
 *a
*a
aDepartment of Chemistry, RCSI, 123 St Stephen's Green, Dublin 2, Ireland. E-mail: donalfoshea@rcsi.ie
bUniversité Paris-Saclay, Institut des Sciences Moléculaires d’Orsay (ISMO), CNRS, 91400 Orsay, France
cUniversité Paris-Saclay, CNRS, Institut des Sciences Moléculaires d'Orsay, 91405, Orsay, France
First published on 13th December 2022
Abstract
A bio-responsive nanoparticle was formed by the directed self-assembly (DSA) of a hydrophobic NIR-fluorophore with poloxamer P188. Fluorophore emission was switched off when part of the nanoparticle, however upon stimulus induced nanoparticle dis-assembly the emission switched on. The emission quenching was shown to be due to fluorophore hydration and aggregation within the nanoparticle and the turn on response attributable to nanoparticle disassembly with embedding of the fluorophore within lipophilic environments. This was exploited for temporal and spatial live cell imaging with a measurable fluorescence response seen upon intracellular delivery of the fluorophore. The first dynamic response, seen within minutes, was from lipid droplets with other lipophilic regions such as the endoplasmic reticulum, nuclear membranes and secretory vacuoles imageable after hours. The high degree of fluorophore photostability facilitated continuous imaging for extended periods and the off to on switching facilitated the real-time observation of lipid droplet biogenesis as they emerged from the endoplasmic reticulum. With an in-depth understanding of the principles involved, further assembly controlling functional responses could be anticipated.
Introduction
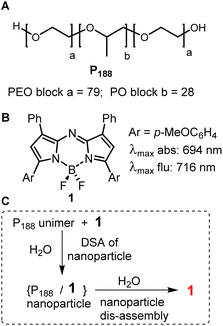
The controlled interplay of self- and dis-assembly in complex aqueous living systems occurs throughout nature for functional gain. Ordered structures emerge from individual building blocks to generate a functioning structure and may disassemble to form another.1 Natural examples of this are seen in the assembly/disassembly of proteins for cell signalling and double stranded DNA for replication. These come about by the spontaneous organisation of two or more components into ordered structures that occur due to van der Waals, π–π, hydrophobic and hydrophilic interactions within an aqueous environment. They are generally associated with the thermodynamic energy of the system going to a minimum due to interactions within the aqueous environment.1,2 Non-natural mimics of these processes are highly sought-after to gain fundamental insights into biological processes, with applications ranging from diagnostics of disease status to responsive therapeutics.3–5 Aqueous based artificial directed self-assembly (DSA) is often based on hydrophilic/hydrophobic principles to control the self-assembly through modulating interactions between two or more components.1,6 Triggers that induce spontaneous disassembly include molecular recognition of a host or micro-environmental change. Fundamental investigations of the design principles of self-assembly and disassembly could be expanded upon for both biomedical research and clinical needs.In this study two complementary components were used which had limited capacity for self-assembly. Despite this, a DSA could be templated of both in water due to hydrophobic–hydrophobic interactions. The constituents used were a polymer poloxamer-188 (P188) and a hydrophobic fluorophore 1 (Fig. 1A and B). P188 is a clinically approved triblock copolymer (poloxamer) consisting of poly(ethylene oxide) (PEO) and poly(propylene oxide) (PPO) segments structurally arranged as (PEO)79–(PPO)28–(PEO)79. The hydrophilic–hydrophobic–hydrophilic structural arrangement of polymer components allows for both hydrophilic and hydrophobic interactions, but the high ratio of hydrophilic PEO restricts self-association in water.7 In combination with P188, the near-infrared (NIR) emitting fluorophore 1 was selected as the template for DSA in this study. Fluorophore 1 is a hydrophobic fluorophore, lacking in hydrophilic functionalities, with a relatively planar surface volume of 454 cm3 mol−1. Structurally, it is the simplest of the NIR-AZA fluorophore class, which is more commonly further derivatised to suit a diverse set of biological and material purposes.8–17
Previously we have shown that 1 and P188 spontaneously undergo a DSA in water to form nanoparticles NP1-P188 of ∼100 nm size with the fluorescence from 1 quenched (Fig. 1C).18 These nanoparticles (NP) were capable of dynamically modulating their emission intensity from off to on and this was exploited for selective labelling and real-time imaging of drug crystal surfaces, natural fibres and insulin fibrils in water. The trigger for this fluorescence functional response was adsorption of P188 components of the NP through its PPO block to hydrophobic surfaces resulting in particle disassembly. The functional response could be attributed to changes in the micro-environmental lipophilicity surrounding the fluorophore, which were associated with disassembly of the particle. A brief preliminary study of the interactions with cells also showed an off to on functional fluorescence response.18
In this report, the temporal and spatial intracellular responses of NP1-P188 particles in live cells has been extensively investigated and an understanding of how the emissive response functions obtained. Previous imaging applications using NIR-AZA fluorophores have shown this class to be particularly attractive, as they have no cellular or in vivo toxicity in concentrations used for imaging. With excellent photo-stability and emission wavelengths beyond 720 nm they are attractive for both continuous live cell imaging, in vivo small animal research and clinical imaging.10,15,19–22
Results and discussion
P188 has a molecular weight of 8,400, consisting of 158 PEO units to just 28 PPO units, with a high hydrophilic–lipophilic balance (HLB) value of 29 making it one of the most hydrophilic poloxamers. It favours the unimer state even at high concentrations in water making it an ideal starting point for directed assembly into more complex structures. As such, when challenged with a suitable hydrophobic template such as 1 a DSA to nanoparticle occurs (Fig. 2). The ability of P188 to DSA with other hydrophobic molecules has recently been reported in the literature, for example, the anti-breast cancer celastrol with P188 created NPs for drug delivery and other NIR-AZA fluorophores for sensors and imaging applications.23–25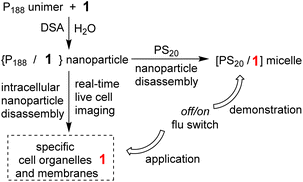 | ||
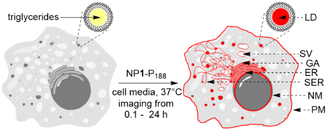
| Fig. 2 Demonstration and application of the fluorescence functional response of NP1-P188 in aqueous and cellular systems. | ||
Prior to a chemical biology study of its interactions with live cells it was necessary to demonstrate that transfer of 1 from within its nanoparticle form of NP1-P188 to another entity could occur in water with a resulting functional fluorescence response. To achieve this, solutions of NP1-P188 were challenged with a polysorbate 20 (PS20) as a competing surfactant. PS20 is a fatty acid ester of PEO substituted sorbitan with a critical micelle concentration (CMC) of 0.08 mM, which is much lower than P188 (>6.1 mM). It is one of the most commonly used non-ionic surfactants in the biotechnology industry and is currently used in formulation of protein biopharmaceuticals.26 It was anticipated that micellar PS20 would act as a competing surfactant for 1 with the potential to sequester it from NP1-P188 with a switch on of the fluorescence (Fig. 2).
Preparation of aqueous 1.2 mM P188 solutions of 1 (5 μM) were routinely achieved by first dissolving 1 and the polymer in THF, then removing the THF under vacuum and adding water with agitation. Solutions remained stable for over 40 days, as judged by UV-visible spectroscopy (ESI, Fig. S1†). The processes of NP1-P188 assembly and dis-assembly could also be observed using DLS and emission measurements. Starting with the 6.4 nm sized unimer of P188 in water, it underwent DSA with 1 to produce ∼100 nm sized particles of NP1-P188 (Fig. 3A, entries 1, 2).
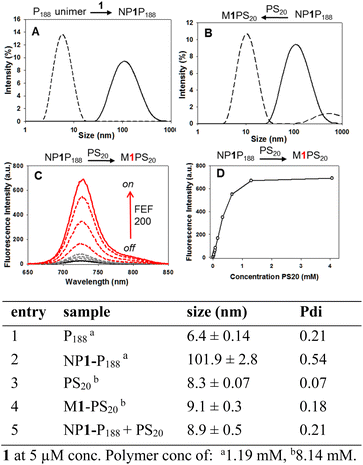 | ||
| Fig. 3 Assembly and disassembly responsive photophysical and size characteristics of aqueous NP1-P188 solutions and their response to competing surfactant PS20. | ||
This was confirmed with nanoparticle tracking analysis (NTA) measuring particle size as 89 ± 28 nm and negative stained transmission electron microscopy (TEM) giving an averaged value of 91 ± 29 nm (ESI Fig. S3 and S4†). Strongly fluorescent aqueous PS20 solutions of 1 were made in a similar manner with dynamic light scattering (DLS) measurements confirming, as expected, a micelle size of 8.3 nm for the surfactant itself and 9.1 nm for PS20 + 1 which is termed M1-PS20 (Fig. 3 entries 3, 4 and ESI S2†). The emission from aqueous NP1-P188 was negligible, yet when titrated with aliquots of PS20 the fluorescence intensity sequentially increased as more PS20 was added up to a concentration of 1.3 mM (Fig. 3C). DLS measurement showed that the NP1-P188 particle had dis-assembled with transferal of 1 into the micelle of PS20 (M1-PS20) (Fig. 3B, entry 5). Encouragingly, measurement of the integrated emission area showed M1-PS20 to be over 200 fold brighter at the end of the titration than NP1-P188 at the beginning due to the transfer of 1 to the micellar core of PS20. The 1.30 mM PS20 concentration required to reach maximum emission intensity is 22 fold greater than its CMC confirming that the nanoparticle has an intrinsic degree of stability and disassembles when the template 1 is transferred to an alternative highly lipophilic environment (Fig. 3D).
Encouraged by this demonstration result we sought to apply these principals to continuous live cell imaging. The goal being to exploit the controlled assembly and dis-assembly of NP1-P188 to conduct a spatial mapping of emission turn on and the time frame(s) at which they occur in live cells. Several possible lipophilic organelles and membranes where emission switch on could occur were envisaged including the plasma (PM) and nuclear membranes (NM), endoplasmic reticulum (ER), Golgi apparatus (GA), secretory vacuoles (SV) and lipid droplets (LD) (Fig. 4).
Cell imaging with NP1-P188
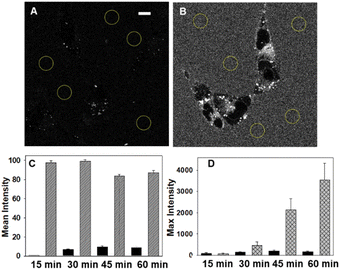
Live cell imaging used the epithelial human breast cancer cell line MDA-MB 231, a highly aggressive triple-negative cell line with its invasiveness mediated by proteolytic degradation of the extracellular matrix.27 Recurrent breast cancer is the leading cause of deaths from the disease and is thought to come from enduring cancer stem cells that survive initial therapeutic intervention.28 It has been shown that an association between dysregulation of lipid metabolism and breast cancer stem cells exists with a correlation between the number of lipid droplets and stemness.29 This makes dynamic imaging tools for lipophilic cellular regions of fundamental research importance.For live MDA-MB 231 cell experiments, chamber slide seeded cells were positioned under the microscope objective surrounded by an incubator to maintain the temperature at 37 °C and CO2 at 5%. At the outset, it was necessary to confirm that NP1-P188 remained off in cell media and this was done by comparing with the always on solution of M1-PS20. Using a confocal laser scanning microscope (CLSM), an imaging field of view (FOV) containing viable cells was chosen and either NP1-P188 or M1-PS20 was added to give the equivalent of 5 μM concentration of fluorophore. Following the addition, images were taken using identical confocal microscope settings at 15, 30, 45 and 60 min (ESI, Fig. S5†). Averaged extracellular and intracellular mean pixel fluorescence intensity were measured using equal region of interest (ROI) areas for each time point. From Fig. 5 panels A and C it can be seen that the very low extracellular fluorescence for NP1-P188 was maintained for 60 min whereas the micelle system of M1-PS20 was at least 9 fold higher at all time points (panels B and C).
This confirmed that the integrity of the off state of NP1-P188 nanoparticles remained in cell media, which is an important feature for real-time live cell imaging. Comparison of extra- and intra-cellular intensities for NP1-P188 treated cells showed the internal fluorescence consistently increased over the 60 min, indicating that cellular uptake had occurred and fluorescence had been switched on, whereas in contrast the intensity from outside the cell remained consistently low (Fig. 5D, ESI S5,† panel B). After 30 min the ratio of external to internal emission intensity was 3, whereas by 60 min this had changed to 21, identifying this early time period as important for live cell imaging.
Next, the temporal and spatial characteristics of intracellular emission turn on over the first hour of incubation were investigated by recording Z-stack images every 5 min immediately following treatment of cells with NP1-P188. This 4D time-lapse reconstruction can be viewed as SI Movie S1.† Once introduced into cell media, the first interaction of NP1-P188 would be with the PM. P188 itself is known to interact closely with the lipid bilayer, with the hydrophilic blocks of P188 adsorbed at the polar interface, while the more hydrophobic PPO blocks penetrate into the aliphatic tail region of the PM.30 Its potential to stabilise damaged membranes has prompted investigations of its medical potential for cardiomyopathy and sickle cell disease.31,32 Yet its ability to transport small molecules across the cell membrane has also been investigated for the delivery of drugs such as doxorubicin and ibuprofen.33–35 As such, it was of interest to investigate if an emission from 1 would emerge from the PM. Within ten min post treatment, intracellular spot-like fluorescence was observed which continued to increase over time, but at no stage was the PM observable (Fig. 6A and B). This effectively shows that 1 can be transported through the outer cell membrane by its DSA with P188. To confirm that an active transport was involved, a repeat experiment was conducted in which the cells were first fixed using 4% formaldehyde solution and then treated with NP1-P188. Following fixation, the plasma membrane bilayer remains intact but the active transport across the membrane is no longer functioning. In this experiment, an accumulation of 1 within the lipid bilayer occurred with a clear turn on of fluorescence from the membrane showing its ability to effect a switch on, with only minor intracellular fluorescence observed (ESI Fig. S6, ESI Movie S2 and S2A†). In comparison, by 60 min of live cell imaging over one hundred discrete vesicles were observable with little detectable background fluorescence (Fig. 6C, ESI S7†). It was judged that these vesicles could be LDs, the most concentrated lipophilic cellular regions.
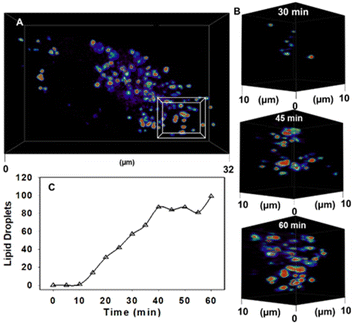 | ||
| Fig. 6 CLSM 4D time dependant accumulation of 1 into lipid droplets inside MDA-MB 231 cell following treatment with NP1-P188. (A) Image of a single cell following 60 min incubation with NP1-P188, (B) expansion of boxed 10 μm3 FOV from (A) showing increasing number of LDs at 30, 45 and 60 min. (C) Graphed plot showing the increase in number of LDs over time following cell treatment with NP1-P188. See ESI Movie S1 for video and S1A† for duplicate experiment. | ||
LDs are ubiquitous intracellular organelles that are storage vessels for lipid molecules such as triacylglycerols and cholesterol esters enclosed by a phospholipid monolayer.36,37 Their importance is increasingly being recognised for both normal and abnormal cellular functions including energy generation, membrane synthesis, protein degradation and viral replication, with an increased number of LDs being associated with inflammatory and cancer cells.38,39 New cancer therapeutic strategies are emerging that target LDs as a means to inhibit cell proliferation.40 LDs have also been linked to many neurodegenerative disorders such as Huntington's, Parkinson's and Alzheimer's disease.41 In eukaryotes cells, the site of biogenesis of LDs is the phospholipid bilayer of the ER.37,42,43 As triacylglycerol's are biosynthesised within the ER they accumulate within its bilayer leading first to the budding and then monolayer enclosing of a LD.37 This phospholipid monolayer provides structural integrity and stability to the LD in the cell.36,37 LDs have been imaged previously using shorter wavelength fluorophore dyes such as BODIPY and Nile red, though these dyes are not always suitable for prolonged continuous real-time imaging.44,45 StatoMerocyanines, coumarin, 1,8-naphthalimide, and excited-state intramolecular proton transfer based probes based LD probes have recently been used for longer wavelength imaging.46,47
Encouragingly, LD motion was readily observable using confocal microscopy without any notable photo-bleaching of the emission signal from 1 (Fig. 7A, ESI Movie S3†). The averaged measured size distribution of fifty vesicles was 577(±90) nm consistent with previously reported ranges for MDA-MB 231 cell LDs (Fig. 7B).28 Measurement of the fluorescence intensity from a single cell over 10 min, during which time 1260 individual images were acquired, showed no loss of intensity (Fig. 7C and ESI S9†). Comparison of a spectrometer recorded fluorescence spectrum of 1 in a triglyceride triolein solution with that from the intracellular LD vesicles showed the same λmax from both at 720 nm (Fig. 7D). Additionally, fluorescence lifetime imaging (FLIM) was used to measure the intra LD lifetime as 3.1 ns which matched that of 1 dissolved in triolein (3.1 ns) strongly indicating that transfer of 1 from nanoparticle into LD had occurred (ESI Fig. S8†).
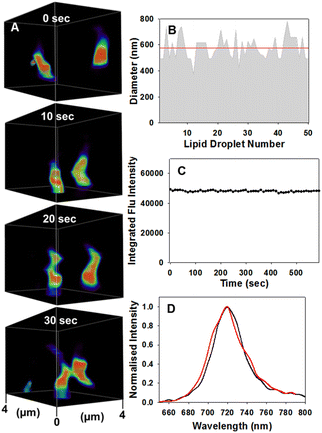 | ||
| Fig. 7 CSLM imaging of dynamic motion and physical characteristics of LDs. (A) Motion of two LDs over 30 s within 4 μm3 FOV area, see ESI Movie S3 for video, full FOV ESI Movie S3A, alternative FOV ESI Movie S3B and duplicate experiment ESI Movie S3C† (B) average size (red line) of fifty individual LDs. (C) Continual integrated fluorescence intensity from a single cell FOV area during continuous imaging (image acquired every 10 s) for 10 min. (D) CLSM acquired emission spectra taken of an individual LD (red trace) and from a triolein solution of 1 (black trace) recorded on a fluorimeter. | ||
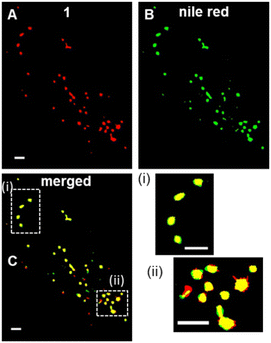
Encouraged by the high photostability of 1, continuous live cell super resolution radial fluctuations (SRRF) imaging was conducted showing the compatibility of 1 with this highly intensive imaging technique (Fig. 8).48 Following an initial optimisation of SRRF parameters (ESI Fig. S10†), live cell imaging was achievable with relative ease and the LD movement could be tracked over 2 min following a 1 h incubation with NP1-P188 (ESI Fig. S11†). SRFF time-lapse imaging was reconstructed from an acquisition of 100 images within 2 s to produce a single super resolution frame, which was repeated every 20 s for 2 min (ESI Fig. S11†). The constant motion of LDs could be observed without loss of imaging integrity, with an average LD diameter measured as 554 nm (ESI Movie S4, S5†). Additional confirmation of LDs was obtained using dual staining of 1 with Nile red. Following co-incubation of live cells with NP1-P188 and Nile red for 1 h, cells were fixed and images acquired using excitations at 496 nm and 630 nm for Nile red and 1 respectively (Fig. 8A, B and ESI S12†). Overlaying of the lower wavelength emission of Nile red with that from 1 showed the fluorescence from both was confined to the same subcellular regions (Fig. 8C). Analysis gave a Pearson correlation coefficient of 0.94 and Manders' coefficients values of 0.85 and 0.88 for tM1 and tMNile-red respectively, confirming a very high level of co-localisation. Having confirmed LDs as the first observable cellular region in which an NP1-P188 disassembly induced emission occurred, a longer time frame of 24 h was next investigated.
Following 60 min incubation with NP1-P188, imaging gives the impression that LDs are in isolation within the cytosol despite the fact that the cellular site of triacylglyceride biosynthesis is the ER. The ER consists of a meshwork of tubular membrane vesicles forming a continuous membrane within the cytoplasm.39,49 In an effort to identify the underpinning ER architecture to which LDs are connected, an imaging study following a 24 h incubation was undertaken (Fig. 9A, ESI Movie S6†). Pleasingly, the extensive ER network could be observed, using confocal microscopy, criss-crossing throughout the cytosol (expansion i). Remarkably, LDs could be seen located at junction sites of the ER indicative of defined positions from which they are formed (expansion ii).50 Another site of accumulation of 1 was within SVs of varying maturity. SVs in MDA-MB 231 cells are varying sized and shaped organelles that act as a storage pool for cellular secretory products.51 They originate from the trans-Golgi where small vessels bud off which in turn fuse multiple times forming an immature vacuoles. Upon maturation these vacuoles form a dense core, become filled with secretory materials and may comprise several internal compartments. The staining of these cellular compartments is consistent of the passaging of 1 from the ER into the Golgi and via the trans-Golgi into SVs. Additionally the nuclear membrane was clearly stained with 1, though penetration into the nucleus itself was not apparent (Fig. 9, expansion iv).
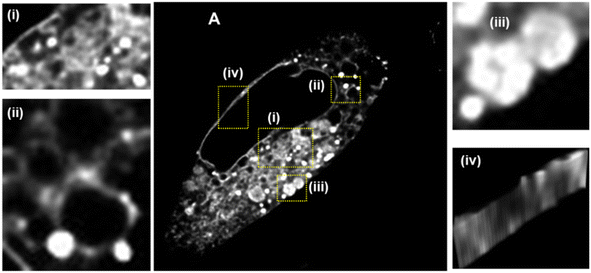 | ||
| Fig. 9 CLSM image showing an MDA-MB 231 cell following 24 h incubation with NP1-P188. (A) Whole cell with fluorescence shown in white for clarity, scale bar 5 μm (i) LDs in close proximity to the extended branching ER network; (ii) central ER network with LDs; (iii) large vacuoles; (iv) nuclear membrane. See ESI Movie S6 for video and ESI Fig. S13† for duplicate experiment. | ||
While a close association of LDs with the ER was identifiable, relatively little is known about the molecular processes and sites that control LD biogenesis. We reasoned that the responsive imaging characteristics of NP1-P188 would allow LD formation to be visualized, in real-time, if the fluorophore was pre-positioned in the ER prior to LD biogenesis. To live capture LD formation would first require the cell to be conditioned such that LDs within the cell were suppressed, then the fluorophore would be placed into position in an off state ready to respond once LD formation commenced, which would stimulate an emission (Fig. 10A).
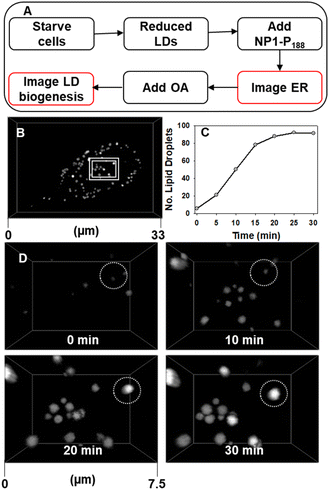 | ||
| Fig. 10 CLSM imaging of starved MDA-MB 231 cells response to treatment with oleic acid. (A) Experimental workflow for LD biogenesis imaging (B) cell imaged at 30 min post treatment showing LDs had formed, (C) plot of the increasing number of LDs in a single cell for 30 min post treatment with oleic acid. (D) Expansion of area shown in panel A at 0, 10, 20 and 30 min post treatment with OA, circled FOV shows the emergence of a single LD. See ESI Movie S7 for D video and S7A† for full cell view. | ||
As LDs are a lipid energy storage site in cancerous MDA-MB 231 cells, starvation of the cells prior to treatment causes the number of LDs to be dramatically reduced (ESI Fig. S14†).50–52 This is to be expected as the lipid stores are used to maintain cellular function under nutrient deficient conditions. But while LDs are supressed the ER, NM and SVs are not and can be visualised as before. This pre-staining of the ER network allows cell regions to be identified from which LDs are likely to emerge. Stimulation of LD growth was achievable by then adding oleic acid (OA) to the cell media which upon uptake is biosynthetically converted to its triglyceride triolein and passaged to LD sites for storage.50 We were delighted to be able to capture these events as they occurred, with the number of countable LDs within a cell increasing more than ten-fold in 30 min, as did their average size from 440 nm at 10 min to 600 nm at 30 min (Fig. 10 panels C and D, ESI S15, ESI Movie S7 and S7A†). Looking in more detail it was possible to identify regions of the ER network from which LDs develop in response to the OA treatment. In Fig. 11 two LDs can be seen to emerge and grow over 20 min from the ER (ESI Movie S8, see ESI Fig. S16† for bigger FOV). To the best of our knowledge, this is the first example demonstrating continuous imaging of LD biogenesis which is captured by pre-positioning a responsive molecular NIR-fluorophore.
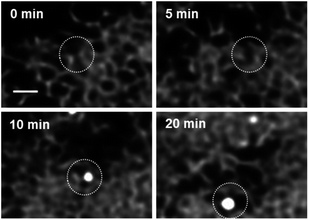 | ||
| Fig. 11 CLSM imaging time course of LD biogenesis from ER, scale bar 1 μm. See ESI Movie S8 for video, see ESI Fig. S16 for bigger FOV and see ESI Fig. S17 and ESI Movie S8A† for duplicate experiment. | ||
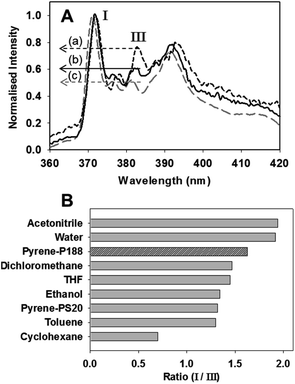
Having established the assembly/disassembly imaging potential of NP1-P188, for completion it was important to identify the chemistry basis for the emission quenching of 1 within the nanoparticle. To this end, the polarity sensitive emissive probe pyrene was used as its properties are well understood. The intensity of the first and third emission bands of pyrene are sensitive to the polarity of the solvent or local environment in which it is dissolved.53 Fluorescence spectra were recorded in six different organic solvents (acetonitrile, dichloromethane, THF, ethanol, toluene and cyclohexane), water, aqueous PS20 and compared to that in aqueous P188. Aqueous solutions of pyrene/P188 and pyrene/PS20 were made in an identical manner to that of 1 and DLS measurements showed the DSA of a nanoparticle (205 nm) had occurred with P188 while PS20 produced micelles (ESI Fig. S18D†). Representative spectra are shown in Fig. 12A for toluene, water and aqueous P188, with the others in the ESI (Fig. S18A–C†). A set of polarity calibration values were created using the ratio of intensity of first band at λmax 372 nm, to that of the third band at λmax 384 nm for each spectrum. From the data shown in Fig. 12B it can be seen that solvents with low polarity indexes such as cyclohexane have a low ratio of 0.70, increasing to 1.47 for intermediate polarity dichloromethane, and for high polarity solvents such as water the ratio is the largest at 1.94. Using this as a reference scale, the environmental polarity within P188 nanoparticles could be gauged. NP-pyrene-P188 had a ratio of 1.63 indicating that a pyrene molecule within the DSA nanoparticle of P188 is in a hydrated polar environment. This is plausible as the oxygen atoms within both the PEO and PPO components of P188 are known to form hydrogen bonds with water molecules.54 This would position 1 in a hydrated micro-environment close to water which would quench emission and broaden absorbance bands.
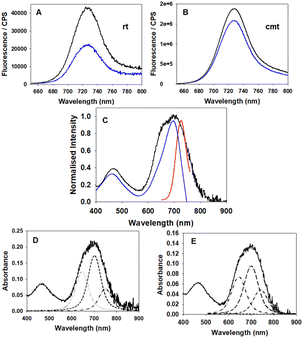
To confirm a role of water in quenching the emission of 1 when confined within NP1-P188 particle, the measurable albeit weak fluorescence spectrum of NP1-P188 was compared in H2O and D2O (Fig. 13A). It is known that fluorophore emission can be quenched by H2O due to energy transfer from the excited state fluorophore to vibrational mode of water.55 This was confirmed by comparing the emission intensity from solutions of NP1-P188 in H2O and D2O for which the intensity was two times greater in D2O. This result is consistent with the PPO block within the NP being hydrated, albeit much less so than the PEO block.54 Further confirmation of this was achieved by heating these solutions to their critical micelle temperature (CMT) at which point the PPO block would dehydrate.56 For spectra recorded above CMT, the difference between H2O and D2O emission intensities was small at only 1.2. As it is known that only the PPO blocks of poloxamers dehydrate upon heating with the PEO remaining hydrated, this is an additional indicator that 1 is closely associated with the PPO segments of the NP.54
Another impact of the aqueous microenvironment within the NP would be aggregation of 1 which could also play a contributing role to the switch off of emission within NP1-P188. The time-resolved photophysics of the NP1-P188 highlighted the presence of two lifetimes: 3.07 ns close to the lifetime of the solvated dye in organic solvents such as chloroform (3.4 ns), and another one which is shorter at 0.72 ns (ESI Fig. S19†). This was further investigated as the presence of a shorter lifetime would be a characteristic of aggregates. Comparison of the absorption, emission and fluorescence excitation scan of NP1-P188 was revealing (Fig. 13C). The significant broadening of the absorption band (black trace) indicates aggregation and the excitation scan showed only the central portion of this band (blue trace, λmax at 698 nm) was attributable to the weak emission. Also, the emission band (red trace) is entirely overlaid by the broad absorption band. Examination of the absorption band in more detail using peak fitting software (Voigt Gaussian/Lorentzian function) gave a good fit for three component bands centred at 647, 702 and 751 nm (Fig. 13D). The band centred at 702 nm is consistent with the excitation scan spectrum, indicating that some solvated 1 exists within the NP and that it was the main contributor to the weak emission, with the 751 and 647 nm bands not contributing. As such, it could be proposed that the bands at 647 and 751 nm are indicative of the aggregated non-emissive 1 within the NP. To gain supporting evidence for this, the formation of aggregates of 1 was investigated using a mixed water/THF solvent system. Spectra were recorded using solutions varying from pure THF to 10% THF/90% water, with the latter being optimal for aggregate formation (ESI Fig. S20†). Notably, in a 1:![[thin space (1/6-em)]](https://www.rsc.org/images/entities/char_2009.gif) 9 solvent mixture the absorption spectrum has a similar broad profile as that of NP1-P188, and similarly peak fitting also gave three contributing bands centred at 645, 700, and 741 nm (Fig. 13E). While in itself non-emissive, the aggregate can also act as an energy transfer sink, contributing to emission quenching as the NP1-P188 absorption band centred at 702 nm closely overlaps spectrally with the emission spectrum.
9 solvent mixture the absorption spectrum has a similar broad profile as that of NP1-P188, and similarly peak fitting also gave three contributing bands centred at 645, 700, and 741 nm (Fig. 13E). While in itself non-emissive, the aggregate can also act as an energy transfer sink, contributing to emission quenching as the NP1-P188 absorption band centred at 702 nm closely overlaps spectrally with the emission spectrum.
To summarise the spectroscopic evidence, NP quenching of 1 can be attributed to a twofold effect of its hydrated microenvironment. Water quenching of solvated fluorophore can occur, plus reabsorption of emission by non-emissive aggregates due to their overlapping absorption band.
Conclusion
The DSA of a stable nanoparticle with an NIR fluorophore was achieved with distinctive properties associated with its assembly and disassembly. The key quenched fluorescence property of the assembled nanoparticle is attributable to the hydration and aggregation of 1 within the particle. Disassembly of the nanoparticle within cells was successful, with a first dynamic fluorescence response seen from internalization within LDs. A high degree of photostability of 1 permitted continuous imaging of LDs allowing properties such as size, motion and biogenesis from the ER to be determined. Increasing the temporal scale of observation allowed for additional spatial regions to be imaged such as the ER, SVs and the nuclear membrane. With the knowledge gained from this study, other assemblies with distinctive micro-environmental functional responses are currently under development.Experimental
Materials
P188, PS20 pyrene, and oleic acid were purchased from Sigma Aldrich. Compound 1 was synthesised following literature procedures.57 MDA MB-231 breast cancer cell line used was purchased from ATCC.General
All water used was deionised water. Fluorescence spectra were recorded with a Varian Cary Eclipse Fluorescence Spectrometer and a FluoroMax Plus spectrofluorometer. Absorbance spectra were recorded with a Varian Cary 50 Scan ultraviolet-visible spectrometer. PeakFit software v4.12 (Systat Software Inc) was used for generating convolved spectra. Particle size and polydispersity index (PI) was measured using a zetasizer NanoZS (Malvern Instrument, Malvern, UK) with a 633 nm wavelength He–Ne laser and scattering angle of 173° through the plastic cuvette with measurements taken in triplicate at concentration fluorophore 5 μM and 25 °C. Data was analysed using Zetasizer Nano software (version 7.13). Widefield images acquired using an Olympus IX73 epi-fluorescent microscope fitted with an Andor iXon Ultra 888 EMCCD and controlled by MetaMorph (v7.8). Fluorescence illumination was provided by a Lumencor Spectra X light engine containing a solid state light source. Deconvolution of widefield images was performed using Huygen's Professional (SVI, v15.10) software. Confocal images acquired using Leica Stellaris 8 (100X/1.49 HC PL APO CS2) and were processed used lightning function. Analysis of raw files using ImageJ 1.53q.Aqueous preparation of hydrophobic fluorophores with polymers
P188 or PS20 (100 mg) was dissolved in THF (8 mL). Fluorophore 1 (50 nmol) or pyrene (50 nmol) in THF (1 mL) was added to the polymer solution and sonicated for 1 min. THF was removed by rotavap followed by 30 min under high vacuum. The mixture was dissolved in water (8 mL), sonicated for 2 min, syringe filtered (MF-millipore, 33 mm) into a volumetric flask (10 mL), made up to the mark with water giving a solution with final concentration fluorophore 5 μM and polymer 1% w/v (P188 1.18 mM, PS20 8.14 mM).Titration of aqueous NP1-P188 with PS20
Aqueous NP1-P188 solutions were treated with PS20 (8.14 mM in water) to give solutions containing ratios of NP1-P188![[thin space (1/6-em)]](https://www.rsc.org/images/entities/char_2009.gif) :
:![[thin space (1/6-em)]](https://www.rsc.org/images/entities/char_2009.gif) PS20 of 100
PS20 of 100![[thin space (1/6-em)]](https://www.rsc.org/images/entities/char_2009.gif) :
:![[thin space (1/6-em)]](https://www.rsc.org/images/entities/char_2009.gif) 0, 99.8
0, 99.8![[thin space (1/6-em)]](https://www.rsc.org/images/entities/char_2009.gif) :
:![[thin space (1/6-em)]](https://www.rsc.org/images/entities/char_2009.gif) 0, 99.6
0, 99.6![[thin space (1/6-em)]](https://www.rsc.org/images/entities/char_2009.gif) :
:![[thin space (1/6-em)]](https://www.rsc.org/images/entities/char_2009.gif) 0.4, 99.4
0.4, 99.4![[thin space (1/6-em)]](https://www.rsc.org/images/entities/char_2009.gif) :
:![[thin space (1/6-em)]](https://www.rsc.org/images/entities/char_2009.gif) 0.6, 99.2
0.6, 99.2![[thin space (1/6-em)]](https://www.rsc.org/images/entities/char_2009.gif) :
:![[thin space (1/6-em)]](https://www.rsc.org/images/entities/char_2009.gif) 0.8, 99
0.8, 99![[thin space (1/6-em)]](https://www.rsc.org/images/entities/char_2009.gif) :
:![[thin space (1/6-em)]](https://www.rsc.org/images/entities/char_2009.gif) 1, 98
1, 98![[thin space (1/6-em)]](https://www.rsc.org/images/entities/char_2009.gif) :
:![[thin space (1/6-em)]](https://www.rsc.org/images/entities/char_2009.gif) 2, 96
2, 96![[thin space (1/6-em)]](https://www.rsc.org/images/entities/char_2009.gif) :
:![[thin space (1/6-em)]](https://www.rsc.org/images/entities/char_2009.gif) 4, 92
4, 92![[thin space (1/6-em)]](https://www.rsc.org/images/entities/char_2009.gif) :
:![[thin space (1/6-em)]](https://www.rsc.org/images/entities/char_2009.gif) 8, 84
8, 84![[thin space (1/6-em)]](https://www.rsc.org/images/entities/char_2009.gif) :
:![[thin space (1/6-em)]](https://www.rsc.org/images/entities/char_2009.gif) 16, 50
16, 50![[thin space (1/6-em)]](https://www.rsc.org/images/entities/char_2009.gif) :
:![[thin space (1/6-em)]](https://www.rsc.org/images/entities/char_2009.gif) 50 and 0
50 and 0![[thin space (1/6-em)]](https://www.rsc.org/images/entities/char_2009.gif) :
:![[thin space (1/6-em)]](https://www.rsc.org/images/entities/char_2009.gif) 100 to give PS20 concentrations of 0.00, 0.02, 0.03, 0.05, 0.07, 0.08, 0.16, 0.33, 0.65, 1.30, 4.07 and 8.14 mM respectively at 5 μM concentration of 1. Solutions were stored for 16 h following which DLS and fluorescence measurements (excitation 630 nm, slit widths 5/5 nm) were taken.
100 to give PS20 concentrations of 0.00, 0.02, 0.03, 0.05, 0.07, 0.08, 0.16, 0.33, 0.65, 1.30, 4.07 and 8.14 mM respectively at 5 μM concentration of 1. Solutions were stored for 16 h following which DLS and fluorescence measurements (excitation 630 nm, slit widths 5/5 nm) were taken.
Cell imaging
MDA-MB 231 cells were seeded on an eight well chamber slide and allowed to proliferate for 24 h at 5.0% CO2 and 37 °C. Cells were cultured in Dulbecco's Modified Eagle Medium (DMEM) supplemented with 10% foetal bovine serum (FBS), 1% penicillin/streptomyosin and 1% L-glutamine.NP1-P188 (50 μM, 1.18 mM) or M1-PS20 (50 μM, 8.14 mM) solution was diluted to 5 μM in cell media and added to wells for desired incubation/imaging time (0–24 h). Nile red (9 μM) in phosphate-buffered saline solution (PBS) was diluted to 3 μM in cell media and added to wells for 1 h. As required cells were fixed with 4% paraformaldehyde (PFA) in PBS for 20 min.
Fixed cell plasma membrane staining
Cells were washed with PBS (2 × 200 μL) and fixed with 4% PFA in PBS for 20 min. Cells were washed with PBS (2 × 200 μL). Fixed cells were incubated with NP1-P188 diluted to conc. 1 5 μM in PBS (200 μL) and imaged every 5 min for 60 min at 37 °C.Background emission analysis
NP1-P188 and M1-PS20 were added to separate wells and imaged z stack (11 slices, 10 μm total thickness) of FOV containing both cells and background every 5 min for 1 h using identical microscope settings. Used 1 slice for analysis of FOV NP1-P188 and M1-PS20. ImageJ measure function was used to measure an averaged mean grey values from 5 extracellular regions of equal size in FOV of each well at each time point. To measure increase in intensity intracellularly over time 5 intracellular and extracellular regions for NP1-P188 were measured for their average max grey value (max brightness) at each time point.Live MDA-MB 231 cell uptake analysis
Cells were treated with NP1-P188 and imaged cell z stack (11 slices, 10 μm total thickness) every 5 min for 1 h. LDs counted using ImageJ 3D Objects Counter v2.0.Measuring photostability of intracellular 1
Cells treated with NP1-P188 for 2 h. Z stack (21 slices) images were acquired of cell every 10 s for 10 min. ImageJ project Z mean intensity tool was used to make one image for each time point and measured integrated density for each time point.Measuring lipid droplet size
LDs were segmented by adjusting threshold and a binary image created. The process/binary/watershed tool was used to separate vesicles next to each other. The analyse particles tool (set measurements: ferrets diameter, include holes, show outlines) was used to measure size of LDs.SRRF imaging of MDA-MB 231 cells
Live cells were treated with NP1-P188 for 2 h prior to imaging. A stream of 100 cell images (frame rate of 50 images per second) were taken every 20 seconds using a widefield microscope. Image J plugin Nano-J-SRRF was used to generate high quality SRRF images (ring radius 1 (see ESI Fig. S10†), radiality magnification 10, axes in ring 6).Co-incubation of Nile red and 1 in MDA-MB 231 cells
Cells were treated with Nile red (3 μM) and NP1-P188 (1 conc. 5 μM) for 1 h. Cells were fixed and imaged using widefield microscope for Nile red (FITC filter illumination 30 units exposure 30 units) and for 1 imaged (NIR filter excit 630 ± 15 nm emission 692 LP, illumination 10 units, exposure 10 units). Pearson's and Manders coefficients were calculated using imageJ plugin JACoP. The experiment was repeated in triplicate and the results averaged.Imaging the biogenesis of lipid droplets
MDA-MB 231 cells were seeded on an eight well chamber slide and allowed to proliferate for 24 h at 5.0% CO2 and 37 °C. After 24 h cell media was removed and cells washed with PBS (200 μL). Cells were then starved by culturing in cell media free from FBS for 48 h. Cells were then treated with NP1-P188 for 3 h. Images of the endoplasmic reticulum were acquired following which oleic acid (175 μg mL−1) was added to cell media. Cell z stack images (10 slices, 6 μm every 30 s for 30 min) or (6 slices, 1.68 μm every 1 min for 30 min) were acquired. Lipid droplets were counted using ImageJ 3D Objects Counter v2.0.Pyrene environmental probe emission study
Pyrene (0.5 μM) was dissolved in organic solvents (acetonitrile, dichloromethane, THF, ethanol, toluene and cyclohexane) and water containing 0.5% DMSO. Pyrene-P188 (5 μM, 1.18 mM) and Pyrene-PS20 (5 μM, 8.14 mM) prepared as per above. Fluorescence spectra recorded of each solution with excitation at 333 nm slits widths 1/1.5 nm. Experiments were repeated in triplicate and average ratio of first to third band calculated.Emission properties of 1 in D2O
Solutions of NP1-P188 (5 μM, 1.18 mM) and M1-PS20 (5 μM, 8.14 Mm) in D2O were prepared as described above and fluorescence spectra were recorded (excit 630 nm. Slit widths 5/10 nm or 2/2 nm respectively) at rt and 65 °C. Experiments were repeated in triplicate and average ratio calculated.Aggregation study of 1 in THF/water mixtures
Solutions of 1 (5 μM) in varying THF/water (3 mL) mixtures of 2![[thin space (1/6-em)]](https://www.rsc.org/images/entities/char_2009.gif) :
:![[thin space (1/6-em)]](https://www.rsc.org/images/entities/char_2009.gif) 98, 5
98, 5![[thin space (1/6-em)]](https://www.rsc.org/images/entities/char_2009.gif) :
:![[thin space (1/6-em)]](https://www.rsc.org/images/entities/char_2009.gif) 95 and 10
95 and 10![[thin space (1/6-em)]](https://www.rsc.org/images/entities/char_2009.gif) :
:![[thin space (1/6-em)]](https://www.rsc.org/images/entities/char_2009.gif) 90 were prepared and their absorbance spectra recorded after standing at rt for 1 h.
90 were prepared and their absorbance spectra recorded after standing at rt for 1 h.
Conflicts of interest
DFOS has a financial interest in patents filed and granted relating to NIR-fluorophores and processes for visual determination of tissue biology.Acknowledgements
DOS gratefully acknowledges funding support from the Irish Government Department of Business, Enterprise and Innovation's Disruptive Technology Innovation Fund and Science Foundation Ireland grant number AMBER 12/RC/2278 P2. NC acknowledges the RCSI Apjohn Fellowship for PhD funding. Images acquired in the RCSI Super Resolution Imaging Facility funded by Science Foundation Ireland (18/RI/5723).References
- G. M. Whitesides and B. Grzybowski, Science, 2002, 295, 2418–2421 CrossRef CAS PubMed.
- M. Grzelczak, J. Vermant, E. M. Furst and L. M. Liz-Marzán, ACS Nano, 2010, 4, 3591–3605 CrossRef CAS PubMed.
- A. C. Mendes, E. T. Baran, R. L. Reis and H. S. Azevedo, Wires Nanomed. Nanobi., 2013, 5, 582–612 CrossRef CAS PubMed.
- D. Lombardo, P. Calandra, L. Pasqua and S. Magazù, Materials, 2020, 13, 1048 CrossRef CAS PubMed.
- M. C. Branco and J. P. Schneider, Acta Biomater., 2009, 5, 817–831 CrossRef CAS PubMed.
- N. Stephanopoulos, J. H. Ortony and S. I. Stupp, Acta Mater., 2013, 61, 912–930 CrossRef CAS PubMed.
- J. G. Moloughney and N. Weisleder, Recent Pat. Biotechnol., 2012, 6, 200–211 CrossRef CAS PubMed.
- D. Wu, S. Cheung, M. Devocelle, L.-J. Zhang, Z.-L. Chen and D. F. O'Shea, Chem. Commun., 2015, 51, 16667–16670 RSC.
- D. Wu, H. C. Daly, M. Grossi, E. Conroy, B. Li, W. M. Gallagher, R. Elmes and D. F. O'Shea, Chem. Sci., 2019, 10, 6944–6956 RSC.
- A. E. O'Connor, M. M. M. Gee, Y. Likar, V. Ponomarev, J. J. Callanan, D. F. O'Shea, A. T. Byrne and W. M. Gallagher, Int. J. Cancer, 2012, 130, 705–715 CrossRef PubMed.
- M. H. Y. Cheng, A. Maruani, H. Savoie, V. Chudasama and R. W. Boyle, Org. Biomol. Chem., 2018, 16, 1144–1149 RSC.
- G. Bhat, M. Kielar, H. Rao, M. D. Gholami, I. Mathers, A. C. R. Larin, T. Flanagan, E. Erdenebileg, A. Bruno, A. S. Pannu, K. E. Fairfull-Smith, E. L. Izake, P. Sah, Y. M. Lam, A. K. Pandey and P. Sonar, InfoMat, 2022, e12345 CAS.
- N. Curtin, D. Wu, R. Cahill, A. Sarkar, P. M. Aonghusa, S. Zhuk, M. Barberio, M. A. Taher, J. Marescaux, M. Diana and D. F. O'Shea, Int. J. Med. Sci., 2021, 18, 1541 CrossRef CAS PubMed.
- D. Wu, S. Cheung, G. Sampedro, Z.-L. Chen, R. A. Cahill and D. F. O'Shea, Biochim. Biophys. Acta, Biomembr., 2018, 1860, 2272–2280 CrossRef CAS PubMed.
- H. C. Daly, E. Conroy, M. Todor, D. Wu, W. M. Gallagher and D. F. O'Shea, Theranostics, 2020, 10, 3064 CrossRef CAS PubMed.
- A. Fernandez, N. Kielland, A. Makda, N. Carragher, M. C. Gonzalez-García, L. Espinar-Barranco, J. A. Gonzalez Vera, A. Orte, R. Lavilla and M. Vendrell, RSC Chem. Biol., 2022, 3, 1251–1259 RSC.
- A. Kamkaew and K. Burgess, Chem. Commun., 2015, 51, 10664–10667 RSC.
- S. Cheung and D. F. O'Shea, Nat. Commun., 2017, 8, 1–12 CrossRef CAS PubMed.
- H. C. Daly, G. Sampedro, C. Bon, D. Wu, G. Ismail, R. A. Cahill and D. F. O'Shea, Eur. J. Med. Chem., 2017, 135, 392–400 CrossRef CAS PubMed.
- S. Cheung, D. Wu, H. C. Daly, N. Busschaert, M. Morgunova, J. C. Simpson, D. Scholz, P. A. Gale and D. F. O'Shea, Chem, 2018, 4, 879–895 CAS.
- S. N. Ng, A. Kamkaew, N. Fu, C. S. Kue, L. Y. Chung, L. V. Kiew, J. Wittayakun, K. Burgess and H. B. Lee, Int. J. Pharm., 2020, 579, 119189 CrossRef CAS PubMed.
- Z. Shi, H. Xu, W. Hu, H. Bai, B. Peng, L. Ji, Q. Fan, L. Li and W. Huang, Chem. Soc. Rev., 2020, 49, 7533–7567 RSC.
- T. Huang, Y. Wang, Y. Shen, H. Ao, Y. Guo, M. Han and X. Wang, Sci. Rep., 2020, 10, 8851 CrossRef CAS PubMed.
- B. Saremi, V. Bandi, S. Kazemi, Y. Hong, F. D'Souza and B. Yuan, Polymers, 2020, 12, 540 CrossRef CAS PubMed.
- K. Chansaenpak, S. Tanjindaprateep, N. Chaicharoenaudomrung, O. Weeranantanapan, P. Noisa and A. Kamkaew, RSC Adv., 2018, 8, 39248–39255 RSC.
- N. Doshi, R. Fish, K. Padilla and S. Yadav, J. Pharm. Sci., 2020, 109, 2986–2995 CrossRef CAS PubMed.
- A. Taherian, X. Li, Y. Liu and T. A. Haas, BMC Cancer, 2011, 11, 293–307 CrossRef CAS PubMed.
- B. J. Hershey, R. Vazzana, D. L. Joppi and K. M. Havas, J. Clin. Med., 2019, 9, 87 CrossRef PubMed.
- L. Tirinato, F. Pagliari, T. Limongi, M. Marini, A. Falqui, J. Seco, P. Candeloro, C. Liberale and E. D. Fabrizio, Stem Cells Int., 2017, 1656053 CAS.
- A. Goliaei, E. Y. Lau, U. Adhikari, E. Schwegler and M. L. Berkowitz, J. Phys. Chem. B, 2016, 120, 8631–8641 CrossRef CAS PubMed.
- C. F. Spurney, A. D. Guerron, Q. Yu, A. Sali, J. H. van der Meulen, E. P. Hoffman and K. Nagaraju, BMC Cardiovasc. Disord., 2011, 11, 1–10 CrossRef PubMed.
- B. Sandor, M. Marin, C. Lapoumeroulie, M. Rabaï, S. D. Lefevre, N. Lemonne, W. E. Nemer, A. Mozar, O. Francais and B. L. Pioufle, Br. J. Haematol., 2016, 173, 145–149 CrossRef CAS PubMed.
- T. Tagami, Y. Ando and T. Ozeki, Int. J. Pharm., 2017, 517, 35–41 CrossRef CAS PubMed.
- Q. T. H. Shubhra, J. Tóth, J. Gyenis and T. Feczkó, Polym. Rev., 2014, 54, 112–138 CrossRef CAS.
- M. Newa, K. H. Bhandari, D. X. Li, T.-H. Kwon, J. A. Kim, B. K. Yoo, J. S. Woo, W. S. Lyoo, C. S. Yong and H. G. Choi, Int. J. Pharm., 2007, 343, 228–237 CrossRef CAS PubMed.
- J. A. Olzmann and P. Carvalho, Nat. Rev. Mol. Cell Biol., 2019, 20, 137–155 CrossRef CAS PubMed.
- R. V. Farese Jr and T. C. Walther, Cell, 2009, 139, 855–860 CrossRef PubMed.
- P. Shyu, X. F. A. Wong, K. Crasta and G. Thibault, Biosci. Rep., 2018, 38, BSR20180764 CrossRef PubMed.
- W. M. Henne, M. L. Reese and J. M. Goodman, EMBO J., 2018, 37, e98947 CrossRef PubMed.
- Q. Liu, Q. Luo, A. Halim and G. Song, Cancer Lett., 2017, 401, 39–45 CrossRef CAS PubMed.
- B. C. Farmer, A. E. Walsh, J. C. Kluemper and L. A. Johnson, Front. Neurosci., 2020, 14, 742 CrossRef PubMed.
- T. B. Nguyen and J. A. Olzmann, J. Cell Biol., 2019, 218, 1089–1091 CrossRef CAS PubMed.
- S. Y. Dejgaard and J. F. Presley, Int. J. Mol. Sci., 2021, 22, 2776 CrossRef CAS PubMed.
- G. Diaz, M. Melis, B. Batetta, F. Angius and A. M. Falchi, Micron, 2008, 39, 819–824 CrossRef CAS PubMed.
- E. E. Spangenburg, S. J. P. Pratt, L. M. Wohlers and R. M. Lovering, J. Biomed. Biotechnol., 2011, 598358 Search PubMed.
- Y. Zhao, W. Shi, X. Li and H. Ma, Chem. Commun., 2022, 58, 1495–1509 RSC.
- L. Guo, M. Tian, Z. Zhang, Q. Lu, Z. Liu, G. Niu and X. Yu, J. Am. Chem. Soc., 2021, 143, 3169–3179 CrossRef CAS PubMed.
- S. Culley, K. L. Tosheva, P. M. Pereira and R. Henriques, Int. J. Biochem. Cell Biol., 2018, 101, 74–79 CrossRef CAS PubMed.
- G. K. Voeltz, M. M. Rolls and T. A. Rapoport, EMBO Rep., 2002, 3, 944–950 CrossRef CAS PubMed.
- A. Kassan, A. Herms, A. Fernández-Vidal, M. Bosch, N. L. Schieber, B. J. N. Reddy, A. Fajardo, M. Gelabert-Baldrich, F. Tebar, C. Enrich, S. P. Gross, R. G. Parton and A. Pol, J. Cell Biol., 2013, 203, 985–1001 CrossRef CAS PubMed.
- W. Zhu, H. Qu, K. Xu, B. Jia, H. Li, Y. Du, G. Liu, H.-J. Wei and H.-Y. Zhao, Anim. Cells Syst., 2017, 21, 190–198 CrossRef CAS PubMed.
- N. Ahmadiankia, M. Bagheri and M. Fazli, Asian Biomed., 2019, 13, 123–129 CrossRef CAS.
- D. C. Dong and M. A. Winnik, Can. J. Chem., 1984, 62, 2560–2565 CrossRef CAS.
- R. Dahanayake, U. Dahal and E. E. Dormidontova, J. Mol. Liq., 2022, 362, 119774 CrossRef CAS.
- J. Maillard, K. Klehs, C. Rumble, E. Vauthey, M. Heilemann and A. Fürstenberg, Chem. Sci., 2021, 12, 1352–1362 RSC.
- Z. Zhou and B. Chu, J. Colloid Interface Sci., 1988, 126, 171–180 CrossRef CAS.
- A. Gorman, J. Killoran, C. O'Shea, T. Kenna, W. M. Gallagher and D. F. O'Shea, J. Am. Chem. Soc., 2004, 126, 10619–10631 CrossRef CAS PubMed.
Footnotes |
| † Electronic supplementary information (ESI) available: Figures (S1–S20) and Movies (M1–M8). See DOI: https://doi.org/10.1039/d2ra06534g |
| ‡ Dedicated to the memory of John S. Fossey. |
| This journal is © The Royal Society of Chemistry 2022 |

