 Open Access Article
Research output software for energetic materials based on observational modelling 2.1 (RoseBoom2.1©)†
Sabrina
Wahler
 ab and
Thomas M.
Klapötke
 *a
*a
aDepartment of Chemistry Energetic Materials Research Ludwig-Maximilian University of Munich Butenandtstr, 5–13 (Haus D), D-81377 Munich, Germany. E-mail: tmk@cup.uni-muenchen.de
bCEO and Founder of RoseExplosive UG (haftungsbeschränkt), Germany Web: https://www.roseexplosive.com/
First published on 16th August 2022
Abstract
There is huge scope for the implementation of sustainable methods in the research of new energetic materials and there are a number of ways this can be achieved. With the development of the program “Research output software for energetic materials based on observational modelling”(RoseBoom©), it is hoped that the development of new modern energetic materials will be advanced, since it aims to provide access to quick and easy prediction methods which will indicate performance parameters (e.g. the detonation velocity and pressure, the key indicator for the power of an explosive) – before they have been synthesized.
Introduction
Modern green chemistry should not only focus on aspects like atom economy,1 but also to eliminate failed synthesis attempts. Not only would it decrease the waste production and the profusion of chemicals, but it would also save a lot of time, meaning that the progress humanity makes in a certain research field is speeded up. The synthesis of energetic materials is associated with considerable risks – especially when synthesizing a new explosive with unknown sensitivity and strength. Therefore, decreasing the amount of practical work in this field would also increase the safety. To achieve this, a computer program would be employed. There are many computer codes already available such as EXPLO52 or Cheetah 9.0,3 however, they both require an accurate density and heat of formation for the explosive as the input in order to calculate the detonation velocity and detonation pressure. Or they need the user to supply a lot of information about the molecule manually like Energy4 and EMDB.5 Therefore, it is of great interest to find other methods for calculating the detonation velocity, detonation pressure and other related values which are more time-efficient and don’t require knowledge of the density or necessitate calculation of the heat of formation for an unknown compound, which can be time-consuming to calculate, or needs to be determined experimentally. Another problem that occurs when determining many properties using experimental methods is that many of the tests require larger amounts of the explosive, which are often not available.6 For this reason, theoretical calculations of explosives provide not only safer working conditions for the research scientists, but can also provide information about a compound that has not or cannot be obtained experimentally.6The computer program developed in this thesis, has the advantage of requiring only information that can be obtained from drawing the structure of the compound on a piece of paper and doesn’t require for some of the methods included the density or heat of formation that both the EXPLO5 and Cheetah programs require (Table 1).
| Method | EXPLO5 | Cheetah 9.0 | RoseBoom2.1© |
|---|---|---|---|
| Pros | Accurate results | Accurate results | Fast |
| Results known for a large number of compounds for comparison | Results known for a large number of compounds for comparison | Requires only a sketch of the structure of the compound | |
| Cons | Heat of formation must be calculated using composite methods which requires computer cluster or determined experimentally | Only available in the US | Results may be less accurate |
| Heat of formation must be calculated using composite methods or determined experimentally |
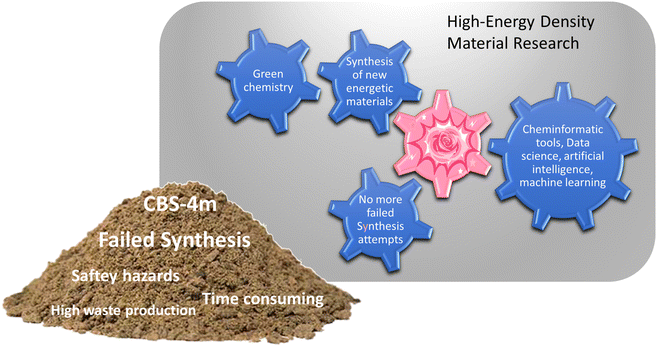
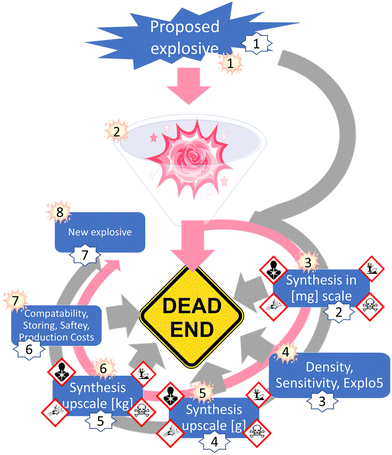
Developing a computer program that would provide accurate predictions about the performance of an energetic materials, based only on the structural formula would already add a new aspect to the research on energetic materials. Such a predictive tool could function as an intersection between machine learning, artificial intelligence, data science tools, and synthetic work. As a proof of concept, first big steps towards this future goal have already been made in this work namely, testing the selected empirical relationships in combinations with cheminformatic tools, as well as linking the program to an optical structure recognition software.7 However, before these high-tech routes can be used to optimum capability, a foundation needs to be built, which can process the generated information from currently available informatic tools. A visual representation of the gap RoseBoom© fills and the gravel in the gearbox it removes is shown in Fig. 1.
Currently, the energetic-materials community is trying to find a replacement for commonly used explosives which exhibit high toxicities such as RDX, HMX and TNT.6 Furthermore, to commercialize promising environmentally friendly alternatives, inexpensive starting materials must be used, which are then converted to the desired product, in high yields.6 This is why modern research on energetic materials goes hand in hand with green chemistry (Fig. 1). However, so far it has not been possible to combine these goals with the one dream every synthetic chemist has, that is to obtain a compound with the desired properties in every synthesis that is attempted. The most promising method to reducing waste and emission in research in the future, is to incorporate theoretical methods like cheminformatic methods, artificial intelligence, data science and machine learning. Currently, there is a gear missing in the big machine of high-energy density materials research, which is the pink cog (Fig. 1). RoseBoom© aims to connect all of these disciplines and clean out all of the gravel in the gearbox that is currently taking its place. The goal for this work is to build the first prototype of this cog, connecting the different aspects and disciplines of high-energy density materials research, allowing the machine to run smoothly.
The program
RoseBoom2.1© can be used to quickly predict the detonation parameters of CHNO compounds based on their structural formula. Currently, it is intended to be used as a tool to support the development of new energetic materials, by allowing quick scanning of a long list of compounds to evaluate which ones are worth of pursuing further. It is based on different empirical models. In order to provide a general overview of which methods are efficient and could potentially replace thermodynamic codes, a general overview of empirical methods to predict the detonation velocity, detonation pressure, heat of formation and density tested in this work is given in Fig. 2.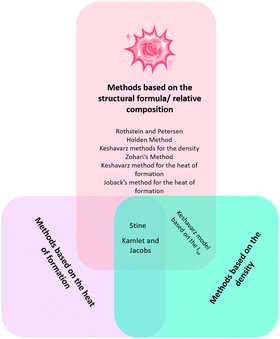 | ||
| Fig. 2 A schematic overview of the empirical relationships evaluated in this thesis and their scientific basis. | ||
Generally, there are three different variables which the selected methods were based on, that were used in this work: heat of formation, density and relative composition/structural formula (or the molecular moieties present in the molecules). In order to obtain insight into how important the density and heat of formation for the prediction of the detonation velocity is, two methods based on the two values were selected, namely, the Stine as well as Kamlet and Jacobs methods. The Keshavarz model for the detonation velocity and pressure was also selected, which is based on the density and the structural formula. This was used in order to provide insight into how important the heat of formation is with respect to prediction of the detonation parameters. The Rothstein and Petersen method was selected to get an insight in to the accuracy of the predicted detonation parameters if the empirical relationship is solely based on the structural formula. Lastly, four different methods based on the sum formula and structural formula to predict the density were evaluated: Keshavarz model for ionic compounds, his method for molecules containing nitro groups, Zohari's model for azides and the Holden method. An approach by Keshavarz to predict the heat of formation based on the structural formula was also tested and the Joback model.
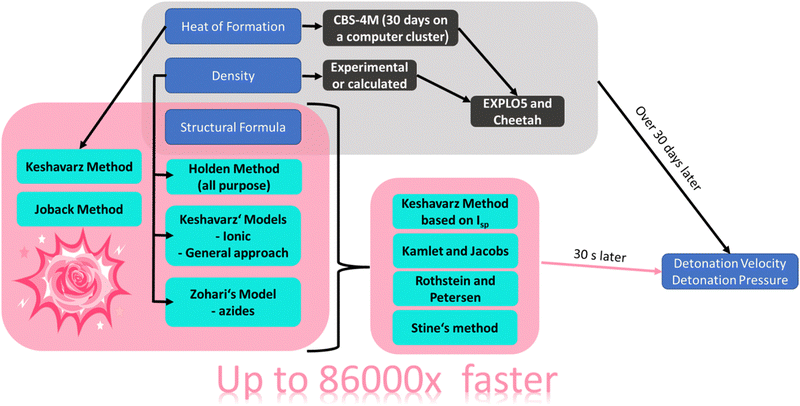
A schematic overview of the route with RoseBoom2.1©, is shown in Fig. 3.
After encoding all of the empirical relationships into the new computer program RoseBoom2.1©, the goals of this work were set even higher, and it was decided that the aim should be to be able to calculate the different parameters in 30 seconds with only the structural formula. By achieving this goal, the computational development of new energetic materials could be up to 86![[thin space (1/6-em)]](https://www.rsc.org/images/entities/char_2009.gif) 000 times faster – depending on the size of the energetic molecule under consideration. For a comparison: The circumference of the earth is about 40
000 times faster – depending on the size of the energetic molecule under consideration. For a comparison: The circumference of the earth is about 40![[thin space (1/6-em)]](https://www.rsc.org/images/entities/char_2009.gif) 000 km. If one were to surround it with a constant speed of 100 km h−1, it would take about 16.6 days. If it was possible to go 86
000 km. If one were to surround it with a constant speed of 100 km h−1, it would take about 16.6 days. If it was possible to go 86![[thin space (1/6-em)]](https://www.rsc.org/images/entities/char_2009.gif) 000 times faster, hence 8.6 mio km h−1 it would only take 16.7 seconds to be back to the starting point.
000 times faster, hence 8.6 mio km h−1 it would only take 16.7 seconds to be back to the starting point.
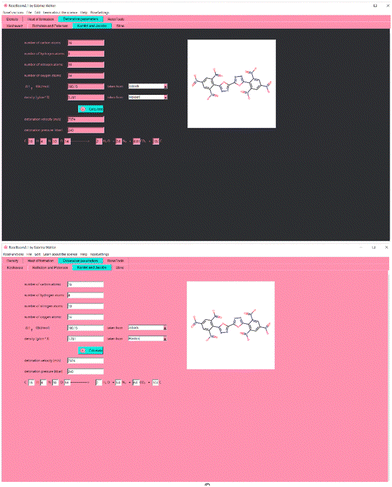
As a background color for the interface, Baker–Miller–pink was chosen. In psychology experiments it has been proven to reduce aggressive behavior,8 which is very common in scientists’ reactions to computer programs which don’t work properly, mostly due to wrong installation or wrong use. Even if RoseBoom© runs very smoothly in windows, meaning it shouldn’t cause any aggression, some other problems may occur when using a computer program leading to aggressive behavior, which can be reduced by a careful choice of the background color. Reduced aggression may also increase attention span and concentration, because it is easier to focus when experiencing lower stress and aggression levels. However, no effects on the concentration of Baker-Miller-Pink have been reported in experiments.9 But, since it has been proven that pink results in less emotional responses than other colors,10 pink programs in science may lead to more objective results. The interface of RoseBoom2.1© is shown in Fig. 4.
A lot of user friendliness in RoseBoom2.1© is provided by the Sloth-function, which allows the user to enter his molecule as a SMILES (Simplified Molecular Input Line Entry Specification), which will fill out all the entry boxes. This reduces man-made mistakes and saves a lot of time. It is also possible to upload a picture of a molecule into RoseBoom2.1© or take a photo with your webcam, with the RoseCam© function, which will then be converted in to SMILES. Another useful RoseFunction© is RoseDanger©, with which the user can take a picture of any chemical bottle, and the corresponding safety data is automatically opened.
Materials and methods
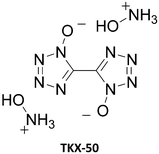
There are many empirical models for predicting the density, heat of formation, detonation pressure and detonation velocity published in the literature. All of them have been trained on compound sets, which naturally could only include molecules which were known at the time the model was established. Hence, the Rothstein and Petersen (published in 1978) or Holden (1970's or even earlier)4 approaches were not trained on modern explosives such as TKX-50 or TKX-55. Modern energetic compounds utilize different functional groups and structural approaches to those used 60 years ago, and often utilize the concept of nitrogen-rich compounds which was not the case in the past (Fig. 5). Therefore, it is important to test these models on a wide variety of compounds including “modern” explosive compounds, for example LLM-105 or TEX, and not just presume that they are applicable to such modern explosives because they were suitable for long-known explosive compounds such as TNT, TATB etc. which typically contain a carbon backbone which acts as a fuel with and nitro groups which act as an oxidizer. A general overview of the evolution of explosives is displayed in Fig. 5 along with the chronological order of the different empirical models implemented in RoseBoom2.1©, a direct comparison between old and modern explosives is given in Table 2.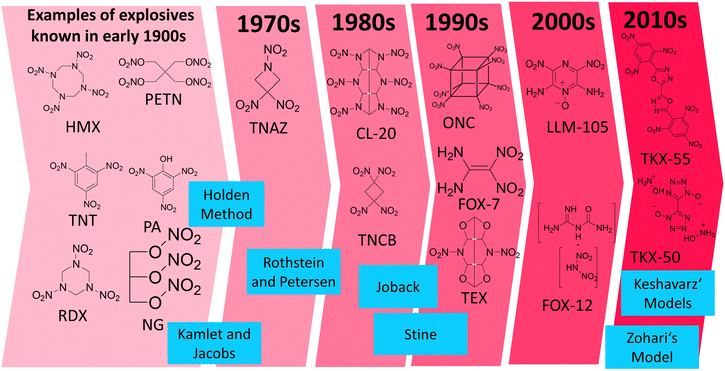 | ||
| Fig. 5 The evolution of explosives in chronological order of their discovery along with the empirical models in the chronological order of their development which are employed in RoseBoom2.1©. | ||
The work reported in this thesis contributed to the further testing of these models, with the aim of determining whether they are only suitable for the classical nitrated-carbon-backbone type of explosive molecules, or whether they can also be applied to the new-generation explosives from the 2000s and 2010s which are commonly nitrogen-rich, contain N-oxide groups or are cages, and which have not been tested using the older models of Rothstein and Petersen,11 Holden,4 Stine,12 Joback,13 Kamlet and Jacobs.14 Additionally, recent models by Zohari15 and Keshavarz16–19 were implemented into RoseBoom2.1© to investigate whether using the newer models will provide more accurate predictions. The Models are described in the ESI.†
Results
In order to find out which models are suited to predict the detonation parameter of the newer classes of compounds, 482 molecules were calculated in RoseBoom2.1© out of which most molecules were designed and published in the years 2017 or later. The molecules were sorted into 19 categories to thoroughly evaluate whether the selected models are suited for the class of compounds. The mean absolute percent deviations (MAPE) are shown in Table 3.| Compound class | Samplesize | MAPE Keshavarz [%] | MAPE Rothstein and Petersen [%] | MAPE Kamlet and Jacobs [%] | MAPE Stine [%] | MAPE RoseHybrid© [%] |
|---|---|---|---|---|---|---|
| All Molecules | 482 | 6.3 | 6.7 | 7.5 | 4.2 | 5 |
| Neutral molecules | 332 | 4.9 | 9.8 | 7.7 | 4.2 | 4.6 |
| Ionic | 113 | 11 | 6 | 8 | 4.2 | 5.9 |
| Zwitter ionic | 3 | 1.9 | 2.9 | 7.5 | 3.4 | 7.5 |
| Aromatic | 418 | 6.1 | 6 | 7.6 | 4.1 | 4.6 |
| Non aromatic | 67 | 8.3 | 9.4 | 5.8 | 4.4 | 0.9 |
| Cyclic nitramines | 15 | 3.8 | 7 | 3.6 | 3.6 | 3.5 |
| Acyclic nitamines | 113 | 7.3 | 4.3 | 6.1 | 3 | 3.5 |
| Molecules with Nitro groups | 377 | 5.9 | 6.1 | 5.8 | 3.6 | 3.7 |
| Molecules without Nitro groups | 104 | 7.7 | 15.4 | 13.4 | 6.2 | 9.2 |
| Diazoles | 137 | 4 | 4.5 | 5.8 | 3.2 | 2.9 |
| Triazoles | 115 | 8.9 | 6.6 | 9.6 | 4.7 | 5.9 |
| Tetrazoles | 133 | 5.8 | 6.5 | 9.6 | 4.6 | 5.5 |
| Oxazole | 96 | 6.1 | 5.8 | 6.7 | 3.7 | 3.7 |
| Ethers and esters | 34 | 7.5 | 10.3 | 4 | 2.8 | 4.6 |
| Peroxides | 10 | 4.8 | 37.8 | 9.3 | 10.99 | 15.9 |
| Nitroxides | 45 | 5.86 | 9 | 8.2 | 4.1 | 5.6 |
| Molecules with –C(NO2)3 groups | 28 | 4.9 | 4.97 | 2.7 | 2.9 | 3.3 |
| Azides | 41 | 4 | 11.68 | 8.2 | 2.5 | 4 |
| Nitrate esters | 25 | 6.4 | 5.3 | 3.4 | 3 | 3.7 |
The goal was to predict the detonation velocity within a range of 5% of the EXPLO5 values, because the predicted values in EXPLO5 differ by up to 5% of the experimental values.23 Taking a look at Table 3 shows, that the Stine method produced values closest to the EXPLO5 values for most compound classes. The few exceptions were: zwitterionic molecules, cyclic nitramines, peroxides and molecules containing trinitromethylgroups. However, it is important to note, that the Stine and Kamlet and Jacobs equations require both a density and a heat of formation which can be difficult to determine. Therefore, ideally a method should be used which doesn’t need these two values. One such method is that of Rothstein and Petersen. This empirical relationship shows a high deviation of 10.0% from the EXPLO5 values and above for molecules without nitro groups, peroxides and for diazoles. This may be due to the way the model was formed: It was developed in 1978 for compounds which generally contained an oxidized carbon backbone, and therefore, the training set of molecules that was used to establish the relationship and was never adjusted to consider tetrazoles, triazoles, diazoles etc. which are a major current trend in energetic materials of the future. This model performed even worse for peroxides with a deviation of 37.8%, which may be due to the same reason. Surprisingly, the Keshavarz model predicted the detonation velocity better for peroxides, even though it was not fitted to peroxides. However, the deviation of 31.4% for the detonation pressure is predicted very poor.
With respect to the different categories, it appears that, even though the average deviation for the RoseHybrid© value may be higher than for the other methods, less values with extreme deviations are observed as in the case of the other models. Therefore, the average deviation may be higher, but there is a higher certainty that the predicted values are somewhere within the range of the EXPLO5 values. However, the Stine method remained the closest to the EXPLO5 Values (Fig. 6).
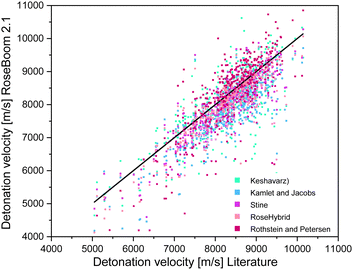 | ||
| Fig. 6 Scattering plot of the detonation velocities predicted with the methods implemented in RoseBoom2.1©, plotted against the literature values. | ||
The detonation pressure was predicted for the same set of molecules as the detonation velocity. The molecules were sorted into the same 19 Categories to thoroughly evaluate whether the selected models are suited for the corresponding compound class. The mean absolute percent deviations (MAPE) are shown in Table 4.
| Compound class | Sample size | MAPE Keshavarz [%] | MAPE Rothstein and Petersen [%] | MAPE Kamlet and Jacobs [%] | MAPE RoseHybrid© [%] |
|---|---|---|---|---|---|
| All molecules | 476 | 15 | 39.2 | 8.8 | 11.2 |
| Neutral molecules | 327 | 15.5 | 27.3 | 9.2 | 11.7 |
| Ionic | 113 | 13 | 23.04 | 7.6 | 10 |
| Zwitter ionic | 3 | 12.4 | 16.6 | 9.1 | 8 |
| Aromatic | 416 | 15.8 | 24 | 8.4 | 8.6 |
| Non aromatic | 63 | 17.4 | 25.8 | 9.9 | 12 |
| Cyclic nitramines | 15 | 8.7 | 16.2 | 4.6 | 4.7 |
| Acyclic nitamines | 112 | 9.5 | 15.6 | 7.5 | 7.3 |
| Molecules with nitro groups | 377 | 12.1 | 37.1 | 7.2 | 8.4 |
| Molecules without nitro groups | 104 | 16.8 | 46.2 | 13.9 | 23.9 |
| Diazoles | 137 | 9.6 | 16.4 | 6.5 | 6.7 |
| Triazoles | 115 | 12.3 | 25.1 | 9.8 | 9.8 |
| Tetrazoles | 133 | 12.6 | 20.7 | 9 | 8.9 |
| Oxazole | 96 | 11.1 | 18.6 | 7.4 | 7.4 |
| Ethers and esters | 34 | 24.7 | 26 | 10 | 12.4 |
| Peroxides | 10 | 31.4 | — | 17.4 | 20.0 |
| Nitroxides | 45 | 11.2 | 27.6 | 9.3 | 10.1 |
| Molecules with −C(NO2)3 groups | 28 | 14.8 | 17.7 | 9.9 | 14 |
| Azides | 41 | 11.5 | 7.6 | 10.6 | 42 |
| Nitrate esters | 22 | 12.7 | 14.3 | 5.2 | 7.3 |
Since the goal of this project is to predict detonation parameters solely based on the structural formula, the Rothstein and Petersen method may appear at first glance to be the better choice for this purpose than the Keshavarz equations based on the specific impulse, since the former doesn’t require the density. But since the new version of RoseBoom© has density prediction methods implemented which can predict the density within 5% of the experimental value (Table 5) the absence of a value for the density of a compound can be somewhat combatted. Overall, the two methods which don’t need a heat of formation should give satisfying results if the compound class is taken into consideration and the better equation for this class of compound is selected.
| Compound class | MAPE Keshavarz Ionic [%] | MAPE Azides [%] | MAPE Keshavarz General [%] | MAPE Holden [%] | MAPE RoseHybrid© [%] |
|---|---|---|---|---|---|
| All molecules | 4.8 | 16.5 | 7.1 | 4.0 | 5.0 |
| Neutral molecules | — | 16.03 | 7.3 | 3.7 | 5.0 |
| Ionic | 4.8 | — | — | 5.1 | 5.1 |
| Zwitter ionic | 1.2 | — | 12.2 | 3.2 | 3.6 |
| Aromatic | 4.8 | 21.4 | 7.5 | 3.9 | 5.1 |
| Non aromatic | 3.4 | 6.3 | 5.1 | 4.8 | 4.4 |
| Cyclic nitramines | — | 3.7 | 4.22 | 4.2 | |
| Acyclic nitamines | 5.5 | 14.05 | 7.4 | 4.15 | 5.3 |
| Molecules with nitro groups | 3.7 | 15.44 | 5.1 | 3.8 | 4.1 |
| Molecules without nitro groups | 5.6 | 12.4 | 15.74 | 5.1 | 7.6 |
| Diazoles | 3.6 | 18.8 | 7.7 | 3 | 5 |
| Triazoles | 5.6 | 26.5 | 9.1 | 4.4 | 5.7 |
| Tetrazoles | 4.8 | 20.9 | 10.3 | 3.5 | 5.7 |
| Oxazole | 4.1 | — | 5.4 | 4.1 | 4.4 |
| Ethers and esters | — | 6.2 | 8.4 | 4.9 | 4.6 |
| Peroxides | — | — | 4.4 | 5.6 | 4.7 |
| Nitroxides | 6.1 | — | 9.5 | 3.4 | 6.2 |
| Molecules with −C(NO2)3 groups | 3.1 | 8.9 | 4.7 | 4.0 | 4.4 |
| Azides | 2.1 | 16.6 | 17.8 | 5.4 | 9.7 |
| Nitrate esters | 3 | — | 5.3 | 3.4 | 3.5 |
With the newly introduced “value” in this work, the RoseHybrid© value, it appears that it isn’t more accurate than the other methods, but also not that much worse (Fig. 13).
As a benchmark, the range of the deviation between theory and experiment of 10% was selected, because the predicted values in EXPLO5 differ by up to 10% from the experimental values.23 The model by Rothstein and Petersen gave the least satisfying results. Only the detonation pressures of cyclic nitramines could be predicted within a reasonable range. Peroxides, ethers and esters seem to be difficult regardless of the method used. But if a deviation of 10% of the EXPLO5 value is taken to be acceptable, the Keshavarz method based on the specific impulse becomes a lot more promising. Following this assumption almost all values are within a useful range, except for peroxides, esters and ethers. The poorly predicted detonation pressure for peroxides is very surprising because this model performs best for the detonation velocity. Since the two equations for the detonation pressure and detonation velocity were fitted using two different regression plots, they can be considered as being two different models. This, explains the different accuracy of the two values. A scattering plot of the all the predicted values is shown in Fig. 7.
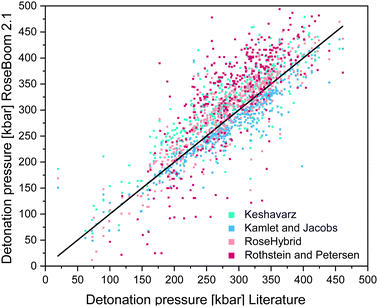 | ||
| Fig. 7 Scattering plot of the detonation pressures predicted with the methods implemented in RoseBoom2.1©, plotted against the literature values. | ||
Kamlet and Jacobs gave the most promising results, however it is important to note, that this method requires a heat of formation and a density as input, which can be difficult for some classes of compound even using the method implemented in RoseBoom2.1©.
The density was predicted for the same set of molecules as the detonation velocity. The molecules were sorted into the same 19 Categories to thoroughly evaluate whether the selected models are suited for the corresponding compound class. The mean absolute percent deviations (MAPE) are shown in Table 5.
The desired minimum accuracy for the prediction of the density is 5%, because this deviation can also be observed between values which were determined with a pycnometer and values which were calculated from a SC-XRD. Taking a look at the table it is obvious, that the volume-based Holden method gives overall the best results and except for peroxides and ionic molecules the benchmark of 5% is not exceeded. Even though, the method is old, it is still under non-disclosure by the US-Army, therefore, there is little information about its scientific basis readily available. The two compound classes: peroxides and non-aromatic molecules can be predicted within 5% of the experimental value with Keshavarz model for molecules with nitro groups. However, it is important to note that TPTP was calculated using the Holden method, since it wasn’t possible to predict it's density using the Keshavarz’ method because it doesn’t contain nitro groups. Therefore, peroxides which don’t contain nitro groups in addition still need to be predicted using Holden method. The other compound class, for which a different method should be used other than the Holden method is for ionic molecules. This category can be predicted within a range of 5% using the method for ionic molecules by Keshavarz. The only method which does not give satisfactory results is the model for azides by Zohari. This model could maybe be evaluated further with a focus on molecules with the molecular moieties which are accounted for in the method. But aside from the Keshavarz model for ionic compounds, the volume-based Holden method (where a functional group is assigned a specific volume) is found to provide better results than the correctional methods by Zohari and Keshavarz (Fig. 8). These later two methods function by correcting a value depending on the functional groups present in the molecules.
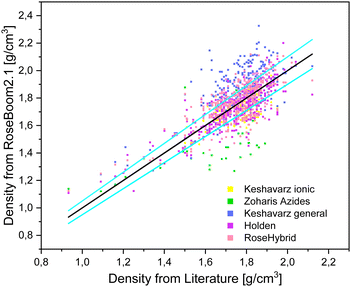 | ||
| Fig. 8 Scattering plot of the densities predicted with the methods implemented in RoseBoom2.1©, plotted against the literature values and sky-blue errorbars of 5%. | ||
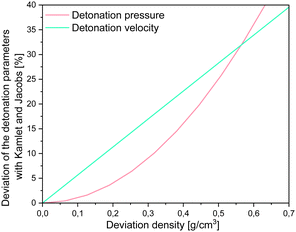
However, it is important to note, that for all of the methods implemented in RoseBoom2.1© only one method should be used as predictive tool for the evaluation of a set of compounds in order to get comparable results. As already mentioned, it is important to have a well predicted or measured densities to obtain well predicted detonation parameters. High deviations can cause major errors when predicting the detonation parameters as shown in Fig. 9.
It becomes very obvious when looking at Fig. 9, that for the more realistic deviations with practical relevance of ≤0.25 g cm−3, the impact on the detonation velocity is bigger than on the detonation pressure. Which means the density is actually very important in predicting molecules.
When considering the deviations, the functioning of empirical models comes in very handy, when one remembers what RoseBoom© is made for: Prediction of performance parameters, to evaluate which compounds are worth to pursue in a synthesis. Usually, a scientist will have several derivatives of one compound, with slightly different groups present. Thanks to the empirical models, it is possible to determine which groups attached will increase and decrease molecular stacking, hence which compounds will have a higher or lower density. With these predictive models, one can distinguish between compounds which should have a good performance and those which have a poor performance. Therefore, one should use RoseBoom© to compare different molecules, but not to replace proper experiments. Also, one needs to consider, that it is always possible, that a different polymorph is predicted than it was compared to, which means, that RoseBoom© may predict an undiscovered polymorph which is denser or less dense than the one RoseBoom©'s value is compared to.
In order to come one step closer to eliminating the time intensive CBS-4M calculations, an empirical relationship previously published by Keshavarz to estimate the heat of formation was implemented in RoseBoom2.1© and tested on 333 neutral molecules and compared to the Joback method, which is expanded with newly calculated RoseIncrements©. To obtain the RoseIncrements© molecules with the missing fragments were calculated, as if those fragments were not present, and the obtained values were subtracted from the literature values. Then the average of the difference was taken, which are now the RoseIncrements©. A value for a nitrogen with three neighbors in a ring, an azide group and a Cuban correction was obtained like this. Also, for the heat of formation a RoseHybrid©-value was tested by taking the average of the two previously mentioned methods. § The heat of formation was evaluated based on the average deviation of the calculated value from the reported literature in kJ mol−1 (Table 6).
| Compound class | Deviation Keshavarz [kJ mol−1] | Deviation Joback [kJ mol−1] | Deviation RoseHybrid© [kJ mol−1] |
|---|---|---|---|
| Neutral molecules | 134.6 | 157.2 | 118.4 |
| Aromatic | 126.9 | 165.9 | 119.7 |
| Non aromatic | 187.2 | 119.5 | 123.7 |
| Cyclic nitramines | 167.2 | 123.3 | 140.56 |
| Acyclic nitamines | 120.3 | 173.8 | 122.2 |
| Molecules with nitro groups | 123.35 | 146.8 | 111.2 |
| Molecules without nitro groups | 180 | 194.8 | 144.3 |
| Diazoles | 105.9 | 131.7 | 91.5 |
| Triazoles | 160.8 | 218.2 | 168.7 |
| Tetrazoles | 148.7 | 121 | 103.8 |
| Oxazole | 139.3 | 281.7 | 179.0 |
| Ethers and esters | 168.0 | 112 | 104.7 |
| Peroxides | 161.0 | 77.4 | 107.6 |
| Molecules with –C(NO2)3 groups | 115.0 | 103.6 | 93.0 |
| Azides | 217.9 | 155.0 | 110.4 |
| Nitrate esters | 73.3 | 176.0 | 108.4 |
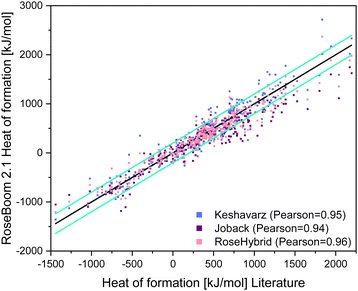
This is because it doesn’t make much sense to describe the deviation in % from the literature value, because for example, if the model predicts −2 kJ mol−1 as the heat of formation, but the literature value is 1, the deviation is 300%, however this minimal difference is not significant when using the heat of formation for the calculation of the detonation parameters. It is also important to take into consideration, that the heat of formation does not influence the detonation parameters as drastically as the density. Therefore, a prediction within ±200 kJ mol−1 is still useful. This range is depicted in Fig. 10.
The Pearson correlation value for all methods are similar, however the average deviation for Keshavarz’ method is 22.6 kJ mol−1 lower than for the Joback method, even though it was not taken into consideration that Keshavarz’ method is only fitted for molecules with a nitrogen content of less than 50%. The best predictions in RoseBoom2.1© come from combining the two models together into the RoseHybrid©-value with an average deviation of 118.4 kJ mol−1 (Table 6). Triazoles, oxazoles and nitrate esters are predicted better with Keshavarz’ model, while non-aromatic compounds and cyclic nitramines are predicted better with the Joback-method. However, the overall performance of the RoseHybrid©-value is better – and just like with the other values predicted in RoseBoom2.1© only one method should be used as predictive tool with each value, for the evaluation of a set of compounds to get comparable results. Hence, for the heat of formation the RoseHybrid©-value is the best choice. Aside from that, when taking a look at Fig. 10, the RoseHybrid©-value has the least outlier outside of the turquoise error bars.
It is also important to keep in mind, that for example in the Kamlet and Jacobs equations the heat of formation is divided by molar mass, which means, the bigger the molecule, the less significant the deviation. Moreover, it is multiplied by numerous factors and coefficient and then the forth root is taken from these factors. Unfortunately, due to the complexity of this equation it is not possible to graphically display the deviation in [%] against the deviation in [kJ mol−1] as for the density. But for visualization one can neglect all the detonation products and simply plot, the forth root of the heat of formation divided by the molar weight against the impact on the detonation velocity (Fig. 11).
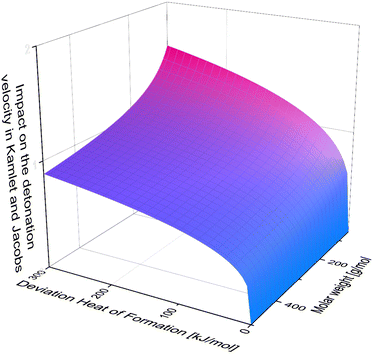 | ||
| Fig. 11 The Impact of heat of formation depending on the molar weight in neglect of the detonation products. | ||
Looking at Fig. 11, one can tell, that the accurate heat of formation is less important for molecules of high molar mass. Also, one can tell easily, that the impact difference between an error in the heat of formation of 200 kJ mol−1 and 300 kJ mol−1 is less dramatic than between 0 kJ mol−1 and 100 kJ mol−1. Therefore, the change of deviation for few values outside of the turquoise bars in Fig. 10, is less dramatic then the inside the error bar.
Conclusion
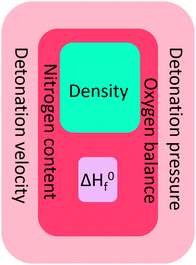
Since previous versions of RoseBoom© have already been employed in two research projects which lead to publications24,25 – even before it was published, it has already been proven, that it very useful and that there is a big demand for a computer program for the quick and easy prediction of performance parameters. Even though, RoseBoom2. 1© cannot replace a proper experiment, but it will give useful predictions to evaluate which molecules should be pursued in a synthesis. It is possible to predict a density close to experimental values, just like the heat of formation, which has a much smaller impact in the detonation parameters, than the density and the elemental composition, which are represented in Fig. 12 by the oxygen balance and the nitrogen content.RoseBoom© should be employed before every future synthesis, to evaluate whether the molecule is worth the synthesis or one should put the time, effort, chemicals and money into another compound.
Outlook – the RoseFuture
The next step for RoseBoom©, is to test more different models to predict the different parameters and hopefully find a more precise model. For the future of RoseBoom©, it is very important to be able to predict the heat of formation precisely. Because this would mean, that composite methods would not be required. Although RoseBoom© should contribute to increasing safety, because compounds which have undesirable properties can be eliminated before synthesis, a toxicity prediction in addition for the product would be of great interest. A promising method, that could be implemented in the future is Quantitative structure-activity relationships (QSARs).26 Implementing this into RoseBoom© would mean that researching scientists could prepare appropriately for dangers they might encounter during the synthesis. Another function that could be implemented in a future version of RoseBoom© is a synthesis planner, which would save a lot of time doing literature search.Currently, scientists have to go through a long journey to find a new explosive. First a small-scale synthesis needs to be done, in order to collect first knowledge about the sensitivity. Once the sensitivities are determined, the synthesis can be upscaled. Only after these steps have been completed, a few kilograms can be synthesized for thorough evaluation (Fig. 13).
This exhausting synthetic journey could lead to failure at every step, if the end-compound doesn’t have the desired properties. Additionally, the synthesis of energetic materials comes with many risks. Therefore, the future goal is to predict the properties of energetic materials with RoseBoom© so precisely, that only synthesis attempts are undertaken for compounds which have a future without failure.
The program RoseBoom2.1© is already superior to current programs based on empirical modeling like Energy4 and EMDB5 in terms of user-friendliness due to the sloth function, which also eliminates man-made mistakes when entering the variables. In addition to that it has no mistakes in the empirical formulas encoded into it unlike Energy.4
Author contributions
All the authors have accepted responsibility for the entire content of this submitted manuscript and approved submission.Notes
More information about the software can be acquired over https://www.roseexplosive.com/. To order it send an E-Mail to info@roseexplosive.com.Conflicts of interest
Sabrina Wahler, Founder and CEO of RoseEnergetic UG (haftungsbeschränkt) and RoseExplosive UG (haftungsbeschränkt) has a financial interest in the software presented in this publication.Acknowledgements
In memory of Alexandra Wahler. Sabrina Wahler thanks the ArianeGroup for awarding her the ArianeGroup Booster Award special price, which came with two Mentors: Ulrich Gotzig and Dr Guy Jacob, who she also wants to thank. Sabrina Wahler wants to thank M-j for the kind supervision of this project and the many valuable scientific discussions. She also thanks Prof. R. A. Fischer for the kind formal supervision at the TUM during her master thesis, which made it possible for her to work on this project.References
- B. M. Trost, Angew. Chem., Int. Ed. Engl., 1995, 34, 259–281 CrossRef CAS.
- https://www.ozm.cz/explosives-performance-tests/thermochemical-computer-code-explo5/, accessed on 20.12.2020.
- https://pls.llnl.gov/people/divisions/materials-science-division/cheeta, accessed on 20.12.2020.
- R. L. Willer, J. Mex. Chem. Soc., 2009, 53, 108–119 CAS.
- M. H. Keshavarz, T. M. Klapötke and M. Sućeska, Propellants, Explos., Pyrotech., 2017, 42, 854–856 CrossRef CAS.
- T. M. Klapötke, Chemistry of High-Energy Materials, DeGruyter, Berlin/Boston, 2019 Search PubMed.
- https://cactus.nci.nih.gov/cgi-bin/osra/index.cgi accessed on 7.5.2021.
- A. G. Schauss, Int. J. Biosoc. Res., 1985, 7, 55–64 Search PubMed.
- J. E. Gilliam and D. Unruh, J. Orthomol. Med., 1988, 3, 202–206 Search PubMed.
- L. Weller and R. Livingston, J. Gen. Psychol., 1988, 115, 433–440 CrossRef CAS PubMed.
- L. R. Rothstein and R. Petersen, Nav. Weapons Station. Yorktown, Virginia 23691, 1978.
- J. R. Stine, J. Energ. Mater., 1990, 8, 41–73 CrossRef CAS.
- K. G. Joback and R. C. Reid, Chem. Eng. Commun., 1987, 57, 233–243 CrossRef CAS.
- M. J. Kamlet and S. J. Jacobs, J. Chem. Phys., 1968, 48, 23–35 CrossRef CAS.
- N. Zohari and N. Sheibani, Z. Anorg. Allg. Chem., 2016, 642, 1472–1479 CrossRef CAS.
- B. Nazari, M. H. Keshavarz, M. Hamadanian, S. Mosavi, A. R. Ghaedsharafi and H. R. Pouretedal, Fluid Phase Equilib., 2016, 408, 248–258 CrossRef CAS.
- M. H. Keshavarz, Propellants, Explos., Pyrotech., 2008, 33, 360–364 CrossRef CAS.
- M. H. Keshavarz and H. R. Pouretedal, Indian J. Eng. Mater. Sci., 2004, 11, 429–432 CAS.
- M. H. Keshavarz and T. M. Klapötke, The Properties of Energetic Materials, De Gruyter, Berlin, 2018 Search PubMed.
- T. M. Klapötke, Energetic Materials Encyclopedia, Walter De Gruyter GmbH, Berlin/Boston, 2021, vol. 1 Search PubMed.
- T. M. Klapötke, Energetic Materials Encyclopedia, Walter De Gruyter GmbH, Berlin/Boston, 2021, vol. 2 Search PubMed.
- T. M. Klapötke, Energetic Materials Encyclopedia, Walter De Gruyter GmbH, Berlin/Boston, 2021, vol. 3 Search PubMed.
- M. Suceska, Proc. 32nd Int. Annu. Conf. ICT 2001, 1–13.
- E. Parisi, A. Landi, S. Fusco, C. Manfredi, A. Peluso, S. Wahler, T. M. Klapötke and R. Centore, Inorg. Chem., 2021, 60, 16213–16222 CrossRef CAS PubMed.
- T. M. Klapötke, J. T. Lechner and J. Stierstorfer, Propellants, Explos., Pyrotech., 2022, 47, 3 Search PubMed.
- L. S. McCarty, P. V. Hodson, G. R. Craig and K. L. E. Kaiser, Environ. Toxicol. Chem., 1985, 4, 595–606 CrossRef CAS.
Footnote |
| † Electronic supplementary information (ESI) available. See DOI: https://doi.org/10.1039/d2ma00502f |
| This journal is © The Royal Society of Chemistry 2022 |

