 Open Access Article
Creative Commons Attribution 3.0 Unported Licence
Investigation of matrix independent calibration of oxygen in glow discharge optical emission spectrometry
Volker
Hoffmann
 *a,
Bernhard
Gebel
a,
René
Heller
b and
Thomas
Gemming
 a
a
aLeibniz IFW Dresden, Helmholtzstr. 20, 01069, Dresden, Germany. E-mail: v.hoffmann@ifw-dresden.de
bHelmholtz-Zentrum Dresden-Rossendorf, Bautzner Landtr. 400, 01328, Dresden, Germany
First published on 28th April 2022
Abstract
The performance of glow discharge optical emission spectrometry for matrix independent oxygen determination was investigated using the spectral lines of atomic oxygen at 130 nm and 777 nm and standard conditions for dc discharge with a 4 mm anode (700 V, 20 mA). Using hot-pressed calibration samples of Cu-, Al- and Mg-powder mixed with their oxides, at 130 nm the dependence of the emission yield on these matrices was confirmed. However, at 777 nm oxygen has the same emission yield in these matrices. In order to compare the emission yield of oxygen with the emission yield in iron a thick 43 μm FeO-layer was prepared and characterized by Rutherford backscattering spectrometry, X-ray diffraction and glow discharge optical emission spectrometry. At 130 nm, the emission yield of oxygen in FeO is most similar to that in an Al-matrix. At 777 nm, the calibration revealed a higher emission yield of oxygen in FeO in comparison to the common emission yield of oxygen in Cu-, Al- and Mg-matrices.
Introduction
The continuous progress in the development of materials motivates the need for fast, reliable, and low-cost characterization techniques which allow correlation of the properties of materials to their composition and component distribution. This includes the characterization of all elements including the light ones (H, C, N, O, P, S). Solid state sampling techniques such as glow discharge (GD) – optical emission spectrometry (OES) and mass spectrometry (MS) are very attractive for industry and research since they allow fast and sensitive multi-element analysis and do not require laborious sample treatment. Therefore, research and application of both techniques were included in the European Metrology Research Programme (EMRP) project SIB09 Elements.1,2 In GD-OES the concept of constant emission yield is used, if matrix independent quantification is possible. In this case, at constant discharge conditions (e.g. constant voltage and current) the intensity of a spectral line is proportional to the sputtered mass per unit time of the corresponding element and the slope in the calibration graphs is independent of the matrix. Corrections of background and line interference are applied and the proportionality factor between intensity and sputtered mass of the element per unit time is defined as emission yield. During the course of this project a different emission yield of the oxygen line at 130.217 nm was found, when hot-pressed samples with Cu, Al and Mg and their oxides were used for calibration. This effect is caused by “A strong line shift effect”, which was found for the oxygen triplet at 130 nm by Michael Köster already in 2009.3 He reported the effect also for the other electronegative elements N and S and explained the line shift by the Doppler effect. Furthermore, he predicted the practical relevance of this effect for quantification.From early research in analytical glow discharge spectrometry it is known that it is possible to measure oxygen lines in the NIR region at 777 nm (triplet) and 844.636 nm.4 However, up to now all instrument producers use the VUV region at the production of their spectrometers and not much is known about the analytical possibilities using these lines in the NIR region. In1 it was already reported that the line shift effect is negligible at 777 nm. The independence of the emission yield of the oxygen line at 777.194 nm for Cu-, Al- and Mg-matrix was confirmed in.5 The application of this calibration to a hot-rolled steel sample, called Calamine (c(O) ≈ 28 m%, d ≈ 3.5 μm, produced at IRSID, France), resulted in 33 m% oxygen and nearly the expected thickness. Because Calamine is a technical product, where the oxide layer is a phase mixture consisting mainly of Fe3O4 (c(O) = 28 m%) and Fe2O3 (c(O) = 30 m%) and the layer thickness is only roughly known, this calibration was also used for quantification of the oxygen content in Fe–W layers.5 Beside the uncertainty of the oxygen concentration and the sputtering rate of Calamine, the scattering of the data points in the calibration curve of oxygen was higher than for the other elements. This enhanced scattering is well known from calibration using the 130 nm line (e.g.6,7) and has a different origin. A major problem consists in the contamination of the anode at sample exchange, where the sputtering source is vented. Additionally, the sample is covered by contamination of water, hydrocarbon and other compounds. These contaminations may vary from measurement to measurement and are reduced at presputtering. Weiss and Vlcak reported recently about the influence of these contaminations on the analysis of TiN and N-implanted Ti and proposed a correction algorithm.8 The higher uncertainty of the oxygen concentration and sputtering rate applies also to other calibration samples. Sample CE 650 from Swedish Institute for Metals Research with 34 m% oxygen is extremely hard and therefore has a very low sputtering rate, which is difficult to measure with high accuracy. Most other calibration samples for oxygen are not certified. For heterogeneous samples consisting of several phases, the time to achieve sputtering equilibrium must be also considered as a possible reason for enhanced scattering.9 If layered samples are used for calibration, uncertainties of concentration, thickness and density of the layers are higher than for bulk material. Further minor influences on the measured intensities were reported for the sample thickness, sample temperature, grain size and surface roughness.10,11
Research for matrix independent quantification of light elements by GD-OES and -MS continued over the years9,12 and it turned out that hot-pressed calibration material is very helpful for calibration and investigation of the dependence or independence of quantification on matrix. Such samples were also applied by Suzuki et al. for iron matrix specific calibration.13 Matrix independent calibration of oxygen at 130 nm using radiofrequency (rf) GD-OES was published 2008 by Malherbe et al.7 Using constant pressure and power, dc bias correction was applied to correct for impedance changes. Later on, Malherbe et al. studied the effect of glow discharge on the analysis of metal oxide films and produced about 2 μm thick homogeneous Fe3O4- and Fe2O3-layers on Si by physical vapour deposition.14 The small difference between the oxygen concentration in these phases as well as the difficulty to produce several micrometer thick layers of only one phase complicate the use of such layers for calibration purpose.
Still, one of the main fields of application of GD-OES are steel production and steel products, e.g. in the automotive sector. Therefore, it is essential to know, if the use of the NIR oxygen lines at 777 nm lines improves quantification of oxygen in iron-based material. Corresponding developments and investigations are reported in this paper.
It must be pointed out that this work does not intend to improve or study the detection limits of oxygen in solids measured by GD-OES, but focusses on the influence of the matrix on the emission yield of oxygen at different spectral lines. Therefore, we have deliberately produced and used calibration samples with high oxygen concentration and applied the calibration for the analysis of a well-defined iron oxide layer.
Experimental
Calibration samples
Preparation and characterization of hot-pressed samples with Cu-, Al- and Mg-matrices for calibration of oxygen is reported in ref. 1 and 12. For of all the samples used for calibration, concentration of oxygen, Sputtering Rate Factor (SRF) and argon discharge gas pressure at 700 V and 20 mA are summarized in Table 1. The SRF is defined as ratio of the sputtering rate of the sample divided by the sputtering rate of low alloyed steel. The sputtering rate of sample NBS 1761 at 700 V and 20 mA was 2.54 μg s−1. The pure compact samples HA-5 (c(Al) = 99.9 m%, Hungarian Aluminium Corporation), Mg_pure (c(Mg) = 99.8 m%, Alfa Aesar product number 10231), IARM 70B (c(Cu) = 99.9 m%) and NBS 1768 (c(Fe) = 99.94 m%) were used.| Sample (Matrix) | c(O)/m% | SRF | Pressure/hPa |
|---|---|---|---|
| HA-5 (Al) | 0 | 0.405 | 2.13 |
| 6gAl_0.5gAl2O3_0.3gMg (Al) | 3.46 | 0.289 | 2.19 |
| 6gAl_1gAl2O3_0.3gMg (Al) | 6.44 | 0.261 | 2.21 |
| 6gAl_2gAl2O3_0.3gMg (Al) | 11.34 | 0.253 | 2.23 |
| 6gAl_3gAl2O3 (Al) | 15.69 | 0.209 | 2.17 |
| Mg_pure (Mg) | 0 | 1.000 | 1.90 |
| 6gMg_0.5gMgO_0.3gAl (Mg) | 2.92 | 0.685 | 1.87 |
| 6gMg_1gMgO_0.3gAl (Mg) | 5.44 | 0.606 | 1.79 |
| 6gMg_1.5gMgO (Mg) | 7.94 | 0.562 | 1.64 |
| 6gMg_2gMgO_0.3gAl (Mg) | 9.57 | 0.556 | 1.76 |
| IARM 70B (Cu) | 0 | 3.571 | 2.64 |
| 30gCu_3gCu2O (Cu) | 1.02 | 3.226 | 2.50 |
| 30gCu_6gCu2O (Cu) | 1.86 | 2.857 | 2.47 |
| 30gCu_9gCu2O (Cu) | 2.58 | 2.703 | 2.45 |
| CE 650 (Al, TiC) | 34 | 0.189 | 2.36 |
| NBS 1768 (Fe) | 0.036 | 1.000 | 2.54 |
| FeO_IFW (Fe) | 23.7 | 0.641 | 2.48 |
| Calamine_IFW (Fe) | 30.1 | 0.654 | 2.44 |
For the determination of the emission yield of oxygen in iron-based material, a layered sample was produced. Chromium free construction steel (c(Fe) >99%, d = 2.5 mm) was oxidized in a commercial oven (HTM Reetz GmbH) for 10 min at 800 °C and 200 mbar O2 (5.0, Nippon). The thickness of two layers was measured with a 3D profilometer MicroProf (FRT, Germany) to 6.5 μm for the thinner top layer and 43 μm for the thick layer above the steel. Whereas the accuracy of the thickness of the top layer is low (≈20%), a maximum of 10% error is estimated for the thickness of the thicker layer.
The resulting sample is very similar to the sample produced by Suzuki et al., who annealed construction steel at 800 °C in air for an unknown time (see Fig. 5b in13). A thick FeO layer (wüstite) below a thinner layer with a phase mixture of Fe3O4 (magnetite) and Fe2O3 (hematite) was identified by XRD.13
Rutherford backscattering
The oxygen content of both layers produced at IFW and Calamine from IRSID was determined by Rutherford backscattering spectrometry (RBS) at HZDR ion beam center using 1.7 MeV He ions hitting the sample under normal incidence. The scattering angle was fixed to 170° and the used silicon detector covered approx. 3.5 msr of solid angle. An aperture of 1.25 mm was used to select the correct area on the samples' surface. For the measurement of the oxygen concentration in the FeO-layer, about 20 μm of the produced layered sample were sputtered away before RBS analysis and thus the upper layer was totally removed.X-Ray Diffraction
XRD measurements were done on the layered iron oxide sample produced at IFW using a X'Pert ProMPD (Panalytical, Netherlands) with monochromator and Co Kα radiation at 40 kV and 40 mA.Glow discharge-optical emission spectrometry
The used GD-OES instrument GDA750HR (Spectruma, Germany) includes a 750 mm Rowland circle optics for Photomultiplier Tube (PMT) detection (120–800 nm) and a 400 mm Rowland circle optics for CCD detection (215–780 nm). The line OI 130.217 nm and the line FeII 238.204 nm were measured by PMT at the 750 mm Rowland circle optics and the intensity of the triplet at 777 nm was measured by a 480 mm Czerny Turner monochromator with triple grating turret (240–1500 nm, Digikröm 480, USA). For the measurement in the near infrared range, a Peltier cooled PMT (Hamamatsu H14768) was adapted and used at 900 V. A yellow filter suppressed the light with wavelength smaller than 495 nm. Cooling of the PMT proved to be essential, because the dark current of NIR sensitive PMTs varies strong with temperature. The entrance and exit slit width of the monochromator was 50 μm, which resulted in a spectral resolution of 0.5 nm at 777 nm. During calibration total spectra of all bulk calibration samples were recorded by the CCD optics with 100 ms integration time and stored. Even if the sensitivity and speed of data acquisition by CCD is lower than by the used PMT optics, the total spectra are very valuable at evaluation of the results.All samples were measured at the commercial 4 mm Grimm type dc source at 700 V and 20 mA. After a presputter time of 90 s three measurements were started, each of 10 s integration time. For the intensities of the produced iron oxide layers (named Calamine_IFW and FeO_IFW) the mean values of an intensity–time profile between 100–150 s and 1000–1100 s was calculated, respectively. Line scans with PMT measurement at 130.217 nm were also started after 90 s presputtering time and took 60 s. The line scan for Calamine_IFW was started 100 s after ignition and for FeO_IFW at 600 s.
Results and discussion
Rutherford backscattering
The simulated oxygen signals of three samples (Calamine, surface layer above FeO-layer and FeO-layer) measured by RBS are shown in Fig. 1. The selected range of energy corresponds to the surface (near channel 340) to the depth before the Calamine and surface layer end (≈3 μm).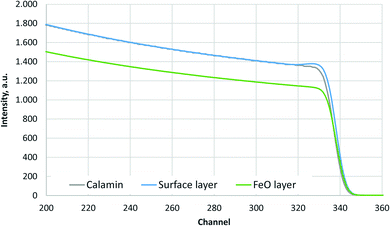 | ||
| Fig. 1 Simulated O-signal of the RBS measurements of Calamine, surface layer above FeO-layer and FeO-layer. | ||
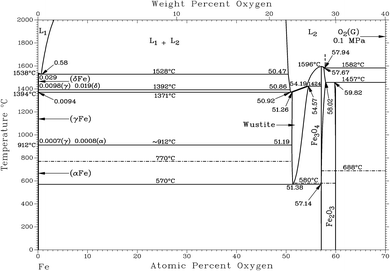
Fig. 1 shows that the Calamine sample and the surface layer above the FeO-layer produce very similar spectra in RBS. The simulated concentration of oxygen in these layers (c(O) = 60 at%, 30.1 m%) agrees very well with the expected concentration of a phase mixture of mainly Fe3O4 (c(O) = 57.1 at%) and Fe2O3 (c(O) = 60 at%) (see Fig. 2). Only at the upper surface a different contamination is present.
The contribution of O to the RBS spectra is much lower in the pure FeO-layer than in the other two measurements and the corresponding simulation results in 52 at% (23.7 m%) oxygen, which is in very good agreement with the value in the phase diagram for thermodynamic equilibrium (c(O) = 51.38 at%, see Fig. 2 (ref. 15)). The maximum error of the oxygen concentration in the FeO-layer is estimated to ±2 m%. However, in the thinner surface layer on FeO and in the Calamine sample ±(5–10) m% error should be expected since the method of RBS is limited here due to the rather small O scattering cross sections.
X-ray diffraction measurements
The XRD measurements of the layered sample with iron oxide on construction steel confirm the results reported in ref. 13. The upper layer is a phase mixture of Fe2O3 and Fe3O4 (not shown here), whereas the thick layer on steel only shows reflexes of the FeO-phase. This measurement shown in Fig. 3 was done on the backside of the layer, which was mechanically removed by bending of the metal sheet. Beside the FeO-phase, the XRD pattern measured after eroding about 20 μm by sputtering included also Fe and Fe3O4 (not shown here), which agrees well with changes of the iron valence by sputtering Fe2O3 and Fe3O4, reported in.14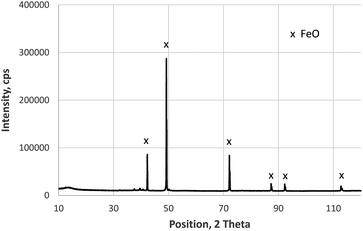 | ||
| Fig. 3 XRD measurement (Co Kα radiation) on the backside of the layer grown in 10 min on construction steel at 800 °C and 200 mbar O2. | ||
Glow discharge-optical emission spectrometry
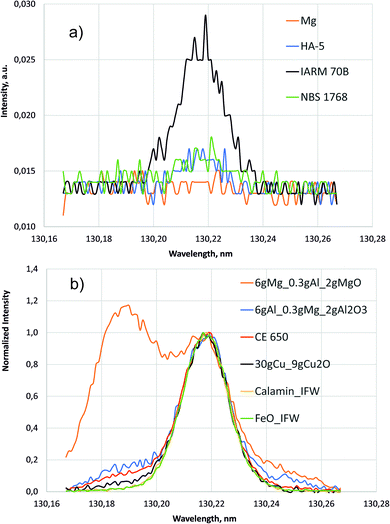 | ||
| Fig. 5 Line scans around 130.22 nm (700 V, 20 mA). (a) Intensities of the pure compact samples. (b) Normalized intensities of selected samples with high oxygen concentration. | ||
The higher background of the pure Cu sample IARM 70B in the inset of Fig. 4 is also in agreement with the former measurement in ref. 1. Up to now no conclusive explanation for this fact exists, but less gettering of oxygen from contamination might be considered.
Fig. 5 shows line scans of the intensity measured by the PMT at 130.217 nm for selected samples moving the entrance slit. Fig. 5a shows the background intensities of the pure compact samples, where again the background of Cu sample IARM 70B is considerably higher than in Mg, Al and Fe. Above a nearly constant background of about 0.013 a.u. clear oxygen line intensities exist at 130.217 nm for Cu, Al, and Fe, but in this wavelength range there are no strong Cu-, Al-, Mg- or Fe-lines. After correction of the spectral background all spectra in Fig. 5b were normalized to intensity 1 at 130.217 nm. The intensities in the lower wavelength region increase from Fe- to Cu-, Al- and Mg-matrix. The increase of these intensities correlates with pressure (see Table 1). Low pressure corresponds to a high blue shifted component and for the Mg matrix with lowest pressure, this component is even more intense than the line intensity at 130.217 nm. At the used constant voltage and current mode, the pressure reduces with higher secondary electron emission of the sample. This compensation of the impedance variation by active pressure regulation is preferred in compositional depth profiling (CDP) using dc excitation, because the influence of the pressure on emission yield was found to be smaller than the influence of voltage or current.16 The blue shifted component of sample CE 650 is near to that of the hot-pressed sample with Al-matrix. In both samples oxygen is bound to aluminium in Al2O3.
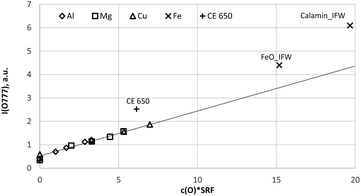 | ||
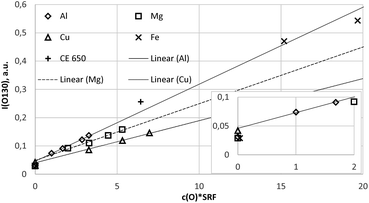
| Fig. 6 Calibration curve for 777 nm including all calibration samples (measured by a Peltier cooled PMT and monochromator). | ||
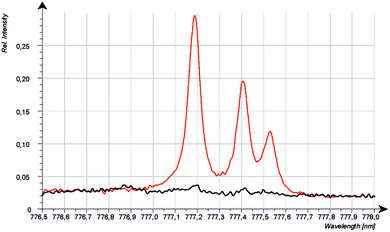
Because the wavelength shift caused by the Doppler effect is proportional to the wavelength, one would expect a clear separation of the lines without and with Doppler effect (about 0.2 nm difference are estimated from the wavelength shift at 130 nm). However, the line shift effect is not at all observed at 777 nm and even for the Mg-matrix, no blue shifted component was found below 777.194 nm (see Fig. 7). If the hypothesis of the Doppler effect3 is true, the transitions in the VUV region are preferred at deexcitation of neutralized negative oxygen ions. However, our investigations in the NIR region did not deliver an evidence for the Doppler effect in the VUV region. Furthermore, we found that the spectra of the iron oxide layers in the produced layered sample have no line shift effect at 777 nm.
Compositional depth profile of oxidized construction steel
Fig. 8a and b confirm the nearly constant composition of the thick FeO-layer. Using the emission yield of oxygen from the trendline in Fig. 6 an oxygen concentration of 28.2 m% (58.5 at%) can be calculated, which is about 5 m% above the real concentration. This is caused by the higher emission yield of oxygen in Fe-than in Cu-, Al- and Mg-matrix, which also led to a larger layer thickness compared to the measured data by the profilometer (6.5 μm and 43 μm). In the evaluation software constant densities of iron (7.874 g cm−3) and oxygen (2.9 g cm−3) are used. The density of oxygen is based on the hard-core model, where the volume of iron atoms is equal to their volume in pure iron. The density of oxygen atoms is estimated from the known density of the crystallographic phases (2.75 g cm−3 in Fe3O4 with 5.3 g cm−3 density and 3.14 g cm−3 in FeO with 5.75 g cm−3 density).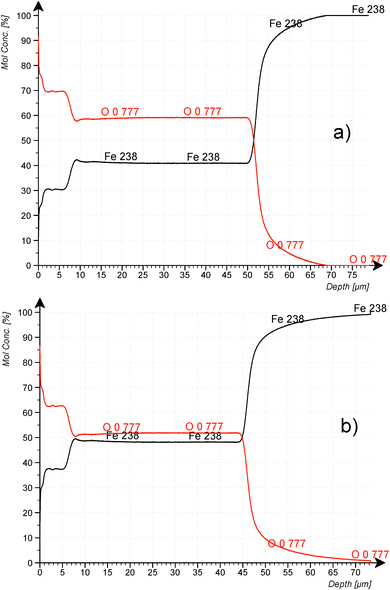 | ||
| Fig. 8 CDP analysis of construction steel oxidized at 800 °C for 10 min at 200 mbar O2. (a) using the emission yield of the calibration in Fig. 6 and (b) using the emission yield of FeO_IFW. | ||
Using the oxygen emission yield of FeO_IFW in Fig. 8b, c(O) = 51.8 at% are obtained, which is close to the concentration of oxygen in FeO in the phase diagram (see Fig. 2) and close to the RBS result (see Rutherford backscattering). This agreement however is not surprizing, because the matrix specific calibration is based on this sample and its composition. The calculated depth is also in good agreement with the measured thicknesses.
However, according to the stoichiometry even of the Fe2O3-phase with highest oxygen concentration of 60 at%, the concentration of oxygen in the surface layer (c(O) ≈ 62.5 at%) is higher than expected. The uncertainties of the composition due to the phase mixture of several FexOy-phases in this layer and contaminations as well as the larger error of the sputtering rate were already discussed in the Introduction. Also, the possibility for changes of the background intensity must be considered.
Summary and conclusion
Clean sample, source and vacuum conditions together with well-defined pre-sputter and measurement parameters and suitable calibration samples allow calibration of oxygen in dc-GD-OES with low scattering of the intensities (<2% RSD with PMT detection). The intensity of the oxygen lines at 777 nm can be measured with better sensitivity than at 130 nm with CCD detection as well as with a cooled PMT in combination with a monochromator.The line shift effect3 and matrix dependence of the emission yield of oxygen at 130 nm1 are confirmed. The line shift effect is not present at 777 nm and oxygen has the same emission yield in Cu-, Al- and Mg-matrix. In comparison, the emission yield of oxygen in a FeO-layer is higher. The emission yield of oxygen at 777 nm is also enhanced at the sample CE 650 and Calamine, where the above discussed larger uncertainties of composition and sputtering rate exist. These differences of the emission yield can be easily corrected, if more points are present in the calibration. So far, matrix specific calibration is recommended, if corresponding calibration samples are present. The thick FeO-layer produced by annealing of construction steel for 10 min at 800 °C in 200 mbar O2 atmosphere proved to be very suitably for this purpose.
It should be mentioned that the line shift effect, present in all used hot-pressed calibration samples was not observed during sputtering the iron oxide layers (see Fig. 5b). If the line shift effect at 130 nm is caused by the Doppler effect, this could mean that less oxygen atoms are ionized sputtering the iron oxide layers and thus the number of atoms, which are present in the plasma is higher than in the hot-pressed samples, when the same mass of oxygen is sputtered per time. More investigations are necessary to explain this deviation from a matrix independent calibration of oxygen at 777 nm. This should include more samples with defined composition and sputtering rate including line OI 844.636 nm, already reported by Grimm.4 Unfortunately, the used Peltier cooled PMT in combination with the used monochromator was not sensitive enough in this spectral region. Also, calibration at constant pressure in combination with correction of the changing impedance may be considered.
The large variation of the spectral background of the pure metals should be also included in further research, because the same effect may be responsible for sample and matrix dependent emission yields too.
Author contributions
Volker Hoffmann: methodology, validation, investigation, data curation, and writing – original draft, Bernhard Gebel: methodology of heat treatment, René Heller: methodology of Rutherford backscattering, writing – original draft, Thomas Gemming: conceptualization, resources, writing – review & editing.Conflicts of interest
There are no conflicts to declare.Acknowledgements
The authors like to thank B. Opitz, R. Keller, H. Merker and S. Donath for technical support at the preparation and characterization of hot-pressed materials and the produced layered iron oxide sample. We also thank Spectruma Analytik GmbH for good cooperation and support.References
- C. Gonzalez-Gago, P. Smid, T. Hofmann, C. Venzago, V. Hoffmann and W. Gruner, Anal. Bioanal. Chem., 2014, 406, 7473–7482 CrossRef CAS PubMed.
- A. Plotnikov, J. Pfeifer, S. Richter, H. Kipphardt and V. Hoffmann, Anal. Bioanal. Chem., 2014, 406, 7463–7471 CrossRef CAS PubMed.
- M. Köster, PW-96, CSI XXXVI, 2009, p. 361, https://tazgmbh.de/wp-content/uploads/2020/05/linienverschiebung-glimmentladugsspektrometrie.pdf Search PubMed.
- W. Grimm, presented in part at the 8 Spektrometertagung, Linz, 1970 Search PubMed.
- A. Mulone, A. Nicolenco, V. Hoffmann, U. Klement, N. Tsyntsaru and H. Cesiulis, Electrochim. Acta, 2018, 261, 167–177 CrossRef CAS.
- D. Alberts, V. Vega, R. Pereiro, N. Bordel, V. Prida, A. Bengtson and A. Sanz-Medel, Anal. Bioanal. Chem., 2010, 396, 2833–2840 CrossRef CAS PubMed.
- J. Malherbe, B. Fernandez, H. Martinez, P. Chapon, P. Panjan and F. X. Donard, J. Anal. At. Spectrom., 2008, 23, 1378–1387 RSC.
- Z. Weiss and P. Vlcak, J. Anal. At. Spectrom., 2017, 32, 2476–2484 RSC.
- V. Hoffmann, M. Uhlemann, S. Richter and J. Pfeifer, Spectrochim. Acta, Part B, 2021, 176, 106039 CrossRef CAS.
- K. Naganuma, M. Kubota and J. Kashima, Anal. Chim. Acta, 1978, 98, 77–84 CrossRef CAS.
- M. Fujita, J. Kashima and K. Naganuma, Anal. Chim. Acta, 1981, 124, 267–274 CrossRef CAS.
- C. Gonzalez-Gago, P. Smid, T. Hofmann, C. Venzago, V. Hoffmann, W. Gruner, J. Pfeifer, S. Richter and H. Kipphardt, J. Anal. At. Spectrom., 2019, 34, 1109–1125 RSC.
- S. Suzuki, K. Suzuki and K. Mizuno, Surf. Interface Anal., 1994, 22, 134–138 CrossRef CAS.
- J. Malherbe, H. Martinez, B. Fernandez, C. Pecheyran and O. F. X. Donard, Spectrochim. Acta, Part B, 2009, 64, 155–166 CrossRef.
- H. A. Wriedt, Fe–O(Iron–Oxygen), in Binary Alloy Phase Diagrams, ed. T. B. Massalski, H. Okamoto, P. R. Subramanian, and L. Kacprzak, American Society for Metals, Metals Park, OH, 2nd edn, 1990, vol. 2, pp. 1739–1744 Search PubMed.
- A. Bengtson and T. Nelis, Anal. Bioanal. Chem., 2006, 385, 568–585 CrossRef CAS PubMed.
| This journal is © The Royal Society of Chemistry 2022 |

