 Open Access Article
Creative Commons Attribution 3.0 Unported Licence
Adaptation of Cu(In, Ga)Se2 photovoltaics for full unbiased photocharge of integrated solar vanadium redox flow batteries†
Sebastián
Murcia-López
 *a,
Monalisa
Chakraborty
a,
Nina M.
Carretero
a,
Cristina
Flox
 a,
Joan Ramón
Morante
 ab and
Teresa
Andreu
 a
a
aCatalonia Institute for Energy Research (IREC), Jardins de les Dones de Negre 1, Sant Adrià de Besós, 08930, Spain. E-mail: smurcia@irec.cat
bUniversity of Barcelona (UB), Martí i Franquès 1, Barcelona, 08020, Spain
First published on 30th October 2019
Abstract
The integration of photovoltaics and vanadium redox flow batteries (VRFBs) is a promising alternative for the direct conversion and storage of solar energy in a single device, considering their inherent higher energy density versus other redox pairs. However, this integration is not seamless unless the photovoltaic system is customized to the voltage needs of the battery, which unlike artificial photosynthesis, continuously increase with the state-of-charge. We have developed an integrated solar VRFB with adapted low-cost Cu(In, Ga)Se2 modules of 3 and 4 series-connected cells (solar efficiency of mini-solar module 8.1%), and considering the voltage requirements (1.3–1.6 V), we have evaluated the influence of the photovoltaic operation region on the final efficiency of the solar VRFB. Full unbiased photocharge under 1 Sun illumination has been achieved resulting in high energy (77%), solar-to-charge (7.5%) and overall round trip energy conversion efficiencies (5.0%) exceeding the values reported in the literature for other solar VRFBs, thus demonstrating the feasibility and intrinsic potential of adapting low-cost commercial photovoltaics to such energy storage systems.
Introduction
The current progress in photovoltaic (PV) technology has led solar energy to be foreseen as the foremost source of renewable energy in a decarbonized long-term scenario. Still, the development of more efficient systems faces the intermittency issue inherent to sunlight and mismatching between production and demand as crucial limitations.1 In this context, the integration of PV and energy storage systems such as batteries is an appealing approach that pursues simplification through direct conversion and storage of solar into (electro)chemical energy. These so-called solar batteries offer the advantage of carrying out in a single device, a process normally done in several independent units.2,3 The historical development of photoelectrochemical (PEC) storage devices shows, however, that this is not a recent approach.4 Between the late 1970s and the late 1980s, many PEC approaches using organic and inorganic redox-pairs in stagnant configurations were developed, mostly with photoelectrodes in direct contact with the electrolyte and based on metal oxides, chalcogenides and III–V semiconductors. Although some systems demonstrated impressive efficiency values (e.g., solar-to-electrical energy conversion efficiency of 11.8%),5 relevant aspects such as limited availability of low-cost and efficient photo-absorbers and membranes notably restrained the interest in these approaches at the time. Over the last few years, with the progress in PV technology and electrochemical devices (with more efficient and cheaper membranes and cells) this possibility has re-gained attention, with configurations aiming to create compact and cost-effective devices by integrating PV materials or developing photoelectrodes in systems such as lithium-ion batteries6 and redox flow batteries (RFBs). The last ones, in particular, are probably the most seamless integration alternative, considering their advantages such as decoupling of power and energy capacity, long cycle life and scalability.7,8 More importantly, these systems possess analogous versatility compared to the initial stagnant PEC storage approaches, with the possibility of combining different redox pairs. In fact, some of the newest solar RFBs have re-introduced organic and inorganic species used in PEC systems in the 1980s.4 For instance, the iodide/polyiodide pair also used in the dye-sensitized solar cell (DSSC) technology has led to the development of integrated systems with DSSCs based on iodine catholytes and anolytes such as lithium9 or decamethylferrocene.10 These systems, however, are limited by the performance of TiO2 photoanodes. More recently, quinone/halogen RFBs with relatively low cell potential (∼0.8 V) have also appeared as examples of successful solar RFBs, by using photoelectrodes based on Si,11 DSSC12 or WSe2,13 although the intrinsic cell potential limits their discharge power. A more recent example of higher voltage batteries has been proposed by Wang and co-authors14 with a ferrocyanide/anthraquinone battery with an integrated Ta3N5 photoanode and GaN/Si photocathode reaching 1.2 V and operating under static conditions.Compared to other RFBs, all-vanadium redox flow batteries (VRFBs), which emerged in 1986, have minimized crossover effects15,16 and display a higher power density considering their standard cell potential of 1.26 V, reaching values of up to 1.7 V in real operation,17 but also represent a more challenging approach for PV integration. Despite this, they have already been demonstrated to be suitable energy storage systems for renewable solar and wind energy, even with power output fluctuations of the renewable system.17–20 Actually, a CdS/DSSC photoanode proposed by Azevedo et al., and a monolithic triple junction solar cell proposed by Urbain et al., are until now the only examples of integrated systems in full VRFBs,21,22 as the other studies on solar VRFBs have used TiO2 photoelectrodes, reaching limited state-of-charge (SoC) or providing photo-assisted charge under low bias conditions.23,24
Chalcopyrite Cu(In, Ga)Se2 (CIGS) light absorbers are a promising alternative to other thin-film PV technologies25 and even to crystalline silicon, given their higher absorption coefficient that allows using smaller amounts of active material.26,27 Therefore, CIGS-based PVs have been commercialized and become more cost competitive (see Table S1† for comparison with other technologies) with efficiency values of ∼16% (world record higher than 20%)1,25,28 and an additional advantage: CIGS can be directly grown on flexible substrates like metal foil, which can facilitate the integration into electrochemical cells. Moreover, several studies on photoelectrochemical water splitting using CIGS29,30 are good examples of how they can be properly customized to solar VRFBs. In fact, recently Bae et al. theoretically correlated several parameters of solar RFBs with single photo-absorbers and found that with low electrolyte resistance, commercial PV materials such as c-Si, GaAs and CIGS are promising alternatives.31 Though, this is not a straightforward task for achieving unbiased photocharge, the PV must properly match the energy requirements of the VRFB, considering also that the cell voltage varies with SoC following a Nernstian behavior (eqn (1)), while the overpotential available for photocharge (or the photocurrent) decreases at high SoC.4 Therefore, unlike systems coupling PVs and energy storage systems counting with power electronic devices for tracking the PV maximum power point (MPP) and controlling the charge of the battery, the main challenge to be solved for the integrated system is matching the PV MPP and the RFB considering the inherent potential shift of the latter.2 This is a critical aspect at high SoC, especially in systems with single photoabsorbers,31 but must be carefully considered even in devices using two photoelectrodes or PV configurations with tandem or multijunction approaches. A good example for this aspect has been addressed by Li et al.,32 for an integrated system with organic redox pairs and a III–V tandem solar cell (with a PV efficiency of 26.1%), reaching a record efficiency of 14.1%. Despite the promising value attained, an intrinsic loss of 0.6 V photovoltage resulting in undesired efficiency loss compared to the solar cell efficiency evinces the need for proper matching. Very recently, an organic solar RFB based on viologen- and ferrocene-derived redox couples with c-Si photoelectrodes has achieved a promising stable performance and solar round-trip energy efficiency of 5.4%,33 attributed to the proper matching between the photoelectrodes and the redox pairs, moving a step forward into the development of more efficient systems.
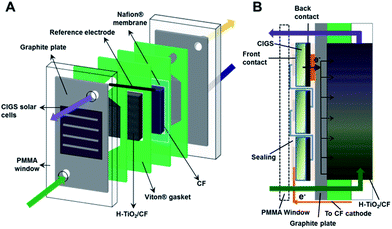
Based on this, we have carried out the integration of adapted CIGS (as “embedded” photoelectrodes) into VRFBs without additional power electronics (Fig. 1), by evaluating two mini-modules fabricated from commercial thin film PVs, in two different battery configurations (symmetric V4/V4 and asymmetric V4/V3). These systems reach full unbiased photocharge with high overall round trip energy conversion efficiencies. Moreover, the two adapted modules have been shown to work in different power regions, so that we have also assessed the influence of different charging conditions (constant and variable charge power) on the final performance of the solar VRFB. This work aims to develop integrated “embedded” minimodules by using thin film photovoltaics, adapted for fitting the specific requirements of the battery. Based on the intrinsic higher voltage requirements of the VRFB, two battery configurations and two multijunctions of 3 and 4 solar cells were successfully integrated, achieving proper matching of the operating conditions during photo-charge. Ultimately this approach opens the path to further real development of such systems by following relatively simple approaches, even starting with commercial photovoltaics.
Experimental part
CIGS PV module preparation
A thin film photovoltaic based on Cu(In, Ga)Se2 (CIGS) supported on stainless steel was purchased from SoloPower®. For the preparation of the PV modules, commercial CIGS foil was cut into small cells of 5.1–5.3 cm2 geometric area, after which the borders were etched with 0.5 M H2SO4 to dissolve the metal oxides and eliminate electrical shunts. The series-connected photovoltaic cells were wired with a conductive Cu sheet and Ag electrically conductive transfer tape (ECATT 9703, 3MTM). Hence, 3- and 4-cell PV modules (namely, 3CM and 4CM) were prepared, attaining different open circuit potentials and current densities. The PV modules were sealed to avoid contact with the electrolyte, with optically clear double-sided adhesive tape (THORLABS) and kapton® adhesive tape (Dupont). A scheme showing the different steps is included in Fig. S1.† The final geometric areas of the 3CM and 4CM were 16 and 20.4 cm2. The i–V characteristic curves of the CIGS modules were recorded at 30 mV s−1 using a VMP3 BioLogic potentiostat and a PEC-L01 solar simulator (PECCELL Technologies, Inc) with an AM 1.5G filter and 1 Sun irradiation.Preparation of carbon electrodes
Rayon-based carbon felt (CF) with a thickness of 6 mm was purchased from Mersen. A plasma etching process under an O2 atmosphere was carried out as pre-treatment prior to TiO2 deposition and/or assembling into the electrochemical cell. For the negative side, hydrogenated TiO2–CF electrodes (H–TiO2/CF) were prepared by following a previously reported hydrothermal procedure for depositing rutile nanorods,34 which were further hydrogenated by means of a thermal treatment under a H2/Ar atmosphere. These electrodes have previously shown a good performance for the V3+/V2+ side reaction in VRFBs, associated with the combination of (i) higher surface hydroxylation leading to a higher presence of active sites for V3+ reduction, (ii) HER inhibition, and (iii) partial hydrogenation improving the charge transfer at the electrode/electrolyte interface.34 On the positive side, O2-plasma etched carbon felts were used. The geometric area of the electrodes was 10 cm2.Full VRFB tests
The photo-assisted charge/discharge tests were performed in an adapted electrochemical cell with a poly(methyl methacrylate) (PMMA) window on one side, two graphite plates as current collectors (Electrocell), a Nafion® 117 membrane (pre-treated in 3% H2O2, H2O and 0.5 M H2SO4 at 80 °C) and the carbon felt electrodes in the corresponding compartment. The electrolyte flow was driven by peristaltic pumps (Major Science, MU-D02) with a volumetric flow rate of 13 mL min−1 and an estimated linear flow velocity of ∼8.1 cm min−1, for a 16% felt compression and a porosity of 0.8 (under compression). The “embedded” CIGS module was integrated by coupling on the negative side of the cell, between the PMMA window and the graphite current collector. Additionally a reference electrode (Ag/AgCl) was inserted into the negative side of the cell and the individual potentials vs. reference were followed during tests (Fig. 1A). The individual potentials have been referenced to the standard hydrogen electrode (SHE) by means of the expression: VSHE = VAg/AgCl + 0.059 pH + 0.199 V.Before performing the (photo)charge/discharge experiments, the V3+ anolyte was electrogenerated through a galvanostatic charge (30 mA cm−2) using 0.5 M VOSO4 in 3 M H2SO4 electrolyte on both sides (twice the volume of catholyte than anolyte), after which V2+ and VO2+ were obtained in the negative and positive sides, respectively. Afterwards, half of the volume was extracted from the catholyte and a galvanostatic discharge (30 mA cm−2) was performed in order to obtain V3+ and VO2+ as the starting catholyte and anolyte for the (photo)charge/discharge tests. Different volumes in the range of 7.5–15 mL in each compartment were used during the different tests.
Prior to the photo-assisted tests and in order to validate the effective performance of the cell, the full VRFB was tested under galvanostatic conditions, by means of charge/discharge cycles at two current densities: 10 and 20 mA cm−2 (see the ESI for more information†). Finally, an additional test by charging up to several SoC values and performing linear scan voltammetry (LSV) in the two-electrode configuration at 40 mV s−1 was carried out.
During the photocharge experiment, the CIGS modules were illuminated at 0 V with a PEC-L01 solar simulator (PECCELL Technologies, Inc) equipped with a 300 W Xe arc lamp and AM 1.5G filter. A cross-sectional view with the PV minimodule configuration and the electron transfer to the anolyte can be found in Fig. 1B. The irradiance was adjusted to 100 mW cm−2 (1 Sun) using a silicon diode (XLPF12-3S–H2-DO; Gentec-EO). Both the photocurrent generated at the PV system and the open circuit potential in the cell were followed with a VMP3 BioLogic potentiostat.
Although the potential depends on specific conditions such as temperature and concentration of active species, in general terms, the cell voltage in VRFBs varies between 1 and 1.55 V from the thermodynamic point of view and as predicted by the Nernst equation (eqn (1)), where cX is the given concentration of the ions involved in the overall reaction in the positive and negative sides, F is the Faraday constant, n is the number of electrons exchanged in the reaction, T is the temperature and R is the universal gas constant. Under real operation these values are expected to increase because of intrinsic overpotential and ohmic losses.
 | (1) |
Therefore, after reaching OCP values of 1.5–1.6 V and by considering the theoretical charge capacity and the coloration of the electrolytes, the battery was considered fully charged, the illumination was stopped and the galvanostatic discharge at a selected current density was carried out up to a cell voltage limit of 0.7 V, corresponding to a fully discharged battery under our established conditions.
V4/V4 VRFB test
Several solar rechargeable flow batteries have already been proposed in the literature, combining different vanadium species which adapt the overall redox potential to the photovoltage provided by the photoactive material. In particular, symmetrical configurations such as VO2+,VO2+‖VO2+,V3+ (V4/V4) and VO2+,V3+‖V3+,V2+ have been successfully photocharged with TiO2 (ref. 20) and CdS/CdSe materials.21 However, these battery configurations do not possess the overall potential compared to the full VO2+,VO2+‖V3+,V2+ VRFB, as seen from the reactions in eqn (2)–(4) and (5)–(7):| VO2+ + 2H+ + e− ↔ VO2+ + H2O E0 = 1.0VSHE | (2) |
 | (3) |
| VO2+ + 2H+ + V2+ ↔ VO2+ + H2O + V3+ E0 = 1.26VSHE | (4) |
| VO2+ + 2H+ + e− ↔ VO2+ + H2O E0 = 1.0VSHE | (5) |
 | (6) |
| VO2+ + V3+ ↔ 2VO2+ E0 = 0.66VSHE | (7) |
Besides the measurements performed under normal conditions with a full VRFB (V3/V4), a preliminary test with a symmetrical configuration using the same parent active species on both sides (VO2+, namely V4/V4) was carried out with the 3CM module. In this kind of RFB, the same parent molecule is oxidized and reduced on each half-cell.35,36 Thus, the charge parameters were evaluated by following the same photocharge procedure: initially 10 mL of fresh VO2+ electrolytes (0.5 M VOSO4 in 3 M H2SO4) were added into each compartment (without electrogeneration), after which the PV was illuminated under the same conditions as those in the full cell test. This way, the thermodynamic overall cell voltage decreased to around 0.66 V and the photocharge was completed after obtaining V3+ and VO2+ in the negative and positive reaction sides, respectively.
Efficiency calculation
The fill factor (FF) and the solar cell efficiency (η) of the CIGS PV modules were estimated according to eqn (8) and (9): | (8) |
 | (9) |
On the other hand, the VRFB efficiencies were determined from the (photo)charge/discharge curves. Coulombic (CE), voltage (VE) and energy (EE) efficiencies were calculated using following eqn (10)–(12).
 | (10) |
 | (11) |
| EE = CE·VE | (12) |
The electrolyte utilization was defined as the ratio between the capacity attained during discharge (Qdischarge) and the maximum theoretical capacity (Qtheoretical) according to the concentration and volume of active species in the electrolyte in both compartments.
In general, although VOC and OCP represent the open-circuit voltage, the former was referenced to the PV, and the latter, to the VRFB.
A solar-to-charge efficiency (ηSTC) was calculated as the ratio between the energy stored and the incident energy during the photocharge. Obviously, the instantaneous ηSTC changes with the SoC, and a general expression can be found in eqn (13):
 | (13) |
The overall round trip energy conversion efficiency (ηRT) can be expressed as the ratio between the total energy extracted from the system and the energy supplied during charge (i.e. incident photon energy) and can be calculated as expressed in eqn (14):
 | (14) |
Results and discussion
CIGS characterization
The single selected CIGS cell displays a VOC of 0.6 V and short circuit current of 35 mA cm−2 (Fig. S3†), leading, in our case, to an estimated solar cell efficiency of 10.3%. Considering these values and the cell voltages observed in the charge–discharge cycling of the VRFB, we determined that modules of at least 3 or 4 series-connected cells (namely 3CM and 4CM) were necessary for full unbiased photocharge. As seen in the i–V curves in Fig. S3,† we obtained the expected VOC values: 1.8 and 2.4 V for the 3 and 4-cell modules, respectively (Table S3†). However, slightly lower fill factors were obtained and the solar cell efficiencies in the multijunctions decreased to around 8.4–8.1%. This can be attributed to additional shunt resistances introduced during the preparation of the modules. Alternative interconnection strategies such as monolithic interconnection23 could probably lead to better solar cell efficiencies than the tabbing method used in the present work. Although the VOC values of the series-connected modules are high enough to accomplish the unbiased photocharge, it is also necessary to consider the potential variation of the battery cell voltage with the SoC, leading to a constant shift in the operation point of the PV system as shown in Fig. 2. The significant photocurrent decrease (Fig. S3†) in the 3CM (from 21% in the 4CM to around 59% in the 3CM) clearly illustrates that the operation point in this system is not the optimum, so this probably might limit the photocharge of the VRFB.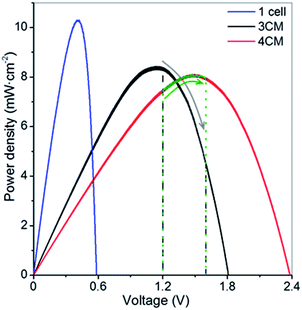 | ||
| Fig. 2 P–V curves of the CIGS modules under 1 Sun illumination. The marked areas indicate the voltage window during the photocharge step. | ||
3CM evaluation: V4/V4 and full VRFB
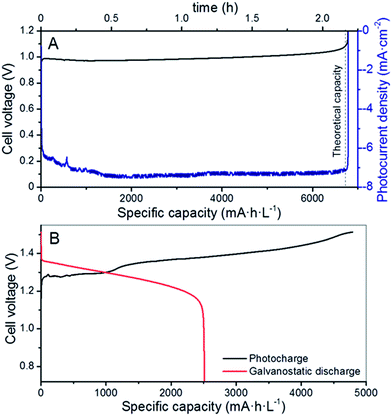
As a proof of concept, the 3CM was first evaluated in a RFB with a symmetrical VO2+,VO2+‖VO2+,V3+ (V4/V4) configuration, because of the lower standard redox potential between these two vanadium pairs (E0 = 0.66 V, eqn (7)).35 For this purpose, the same starting VO2+ electrolyte was used in both compartments. The charge profile and the photocurrent density are shown in Fig. 3A. The full charge was completed after ∼2.3 h of illumination, as indicated by the steep increase in the cell potential. At this point, the irradiation was stopped and the system remained at open-circuit conditions, reaching ∼0.8 V. Besides the color change of the electrolytes, the calculated capacity attained under photocharge (∼6700 mA h L−1) indicates that a SoC of around 98.5% was reached (namely, VO2+ and V3+ formed in the positive and negative sides, respectively). Therefore, the suitability of the 3CM for unbiased photocharge of the V4/V4 system was demonstrated, although certainly this configuration has limited practical interest given its lower energy density versus a full VRFB. Additionally, further optimization for specific reaction kinetics (in particular for the V3+/VO2+ half-reaction) would be necessary, as seen from the relatively high charge overpotential observed in this system, and probably justified by the use of an electrode enhanced for the V3+/V2+ reactions on the anode side.Once the V4/V4 configuration was assessed, the electrolytes were substituted by fresh VO2+ and V3+ solutions in the catholyte and anolyte, respectively, in a regular full VRFB configuration. The cell was assembled as described in Fig. 1 and the photocharge/discharge was evaluated. As seen in Fig. S4,† the variation of the cell potential during the photocharge remarkably matches the photocurrent of the PV system, which continuously drops with time as the SoC (i.e., cell potential) increases. The cell voltage slowly increased until reaching 1.5 V (Fig. 2B) and remained practically constant afterwards, with a photocurrent below 1.0 mA cm−2. After reaching a photocurrent of 0.5 mA cm−2 with a cell voltage of ∼1.52 V and considering the slow capacity increase (inset of Fig. S4†), the photocharge was stopped and the galvanostatic discharge started.
The fact that no steep increment was observed in the cell potential suggests two features, different to the galvanostatic charge or to the photocharge with 4CM (as shown later): (1) the 3CM is not able to provide enough voltage for other parasitic reactions such as water splitting to occur and (2) the photocurrent of the 3CM has such a significant decrease after a certain SoC, that the photocharge stops being effective and the overall cell potential (i.e. SoC) is not affected. Indeed, the galvanostatic discharge also reflects the difference between the photocharge and discharge capacities, resulting in poor coulombic and energy efficiencies (52 and 47%, respectively) and electrolyte utilization of only 37.5%.
An additional test with the 3CM under lower irradiation (50 mW cm−2, in order to work at ∼1 mA cm−2) and by leaving the battery to fully attain the maximum charge capacity is shown in Fig. S5.† Despite reaching the theoretical capacity after more than 7 h of photocharge, the cell voltage remained lower than 1.4 V. Moreover, the battery only reaches half of capacity during discharge, with a coulombic efficiency and electrolyte utilization of ∼54%. Interestingly, the solar-to-charge (ηSTC) and overall round trip energy conversion (ηRT) efficiencies11,13 calculated for the battery with the integrated 3CM under both conditions show very similar values. This way, average ηSTC and ηRT of 3.2 and 1.5–1.6% are respectively obtained, which, compared to the solar efficiency of 8.4%, evidences the limited power attained by the 3CM, inadequate for fully charging the VRFB. As observed in Fig. 2, assembling the system with this module implies that the photocharge starts at the PV MPP and moves towards a lower power direction (patterned zone). Interestingly, the ηSTC for the V4/V4 configuration with the 3CM leads to a higher value of 7.0%, demonstrating its suitability for photocharging a symmetrical V4/V4.
4CM evaluation in a full VRFB
Considering the limited operation of the 3CM, the battery was assembled with the 4CM in the full VRFB configuration. As seen in Fig. 4, the photocurrent of the PV module slightly varied between 6 and 4 mA cm−2, while the ones reached by the 3CM drastically dropped from 6 to 1 mA cm−2. In fact, the profiles of the curves were more stable with this module and the cell potential steeply increased after reaching high SoC. This way, full photocharges were achieved, leading to capacities close to the theoretical value. Thereafter, the galvanostatic discharges were carried out, leading to discharge capacities of ∼5000 mA h L−1 as shown in Fig. 5. In general, except for a minor imbalance observed during the first cycle, the battery shows a stable behavior during cycling, attaining very similar efficiencies and capacities with successive photocharges/discharges. Furthermore, the energy efficiency reached (77%) is similar to that of the galvanostatically charged VRFB (Table S4†).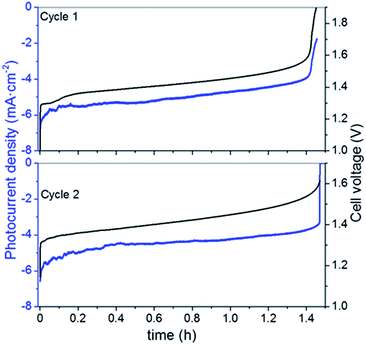 | ||
| Fig. 4 Variation of the photocurrent density and cell voltage during unbiased photocharge (cycles 1 and 2) with the 4CM. | ||
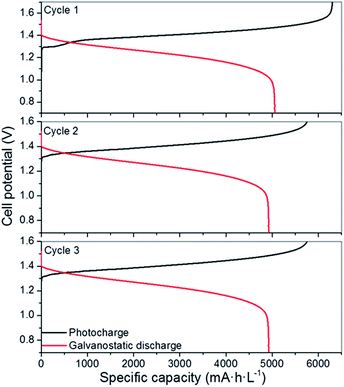 | ||
| Fig. 5 Photocharge/discharge curves of the VRFB with the 4CM. The galvanostatic discharge was carried out at 10 mA cm−2 (5 mA cm−2 per PV area). | ||
As in the galvanostatic cycling (see the ESI†), the individual electrode potentials on the positive (Ep) and negative (En) sides were simultaneously recorded by using a reference electrode (Fig. S6A†). A similar behavior is found regarding the evolution of the individual potentials of the galvanostatic charge/discharge: during photocharge, the Ep varies between 1.1 and 1.25 VSHE, close to the thermodynamic potential of the VO2+/VO2+ redox reaction and seems to more promptly increase after all the available VO2+ is oxidized, while the En steeply increases during discharge, after all the V2+ is re-oxidized to V3+. These results suggest that a minor imbalance also observed in the galvanostatic measurements is only related to the VRFB performance, rather than to the photovoltaics. However, as seen by the reached OCP of ∼1.5 V and by the electrolyte coloration before and after photocharge (Fig. S6B†), both compartments reach a high SoC.
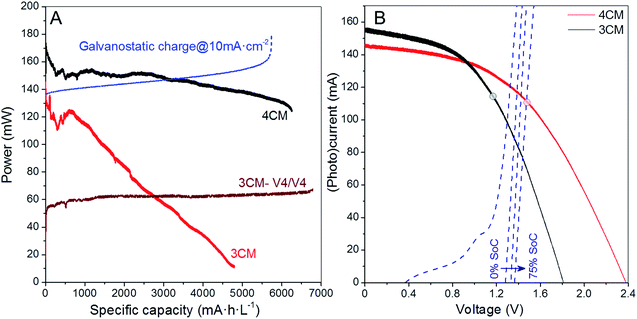
Additional comparison in terms of the power density gained during charge is included in Fig. 6A, where we compare the (photo)charge with 3CM, 4CM and galvanostatic conditions. While the power density constantly increases in the galvanostatic charge operating at constant current with a concomitant voltage increase, the power density with the 3CM continuously decreases (the photocharge starts at the MPP) and the one by the 4CM remains almost constant before reaching high SoC. In the 4CM, the minor photocurrent decrease is compensated by the continuous increase of the cell voltage in the battery. Ultimately, the specific energy density during the photocharge with the 4CM is even higher than that of the galvanostatic charge (845 versus 887 mW h cm−2 L−1). For comparison, the power density during the V4/V4 experiment with the 3CM is also included, showing a constant value. Despite the lower power, explained by the lower cell voltage under this configuration, the 3CM is again demonstrated to be suitable for photocharging a V4/V4 VRFB.
Linear scan voltammetry (LSV) was carried out on the battery at different SoCs, and the comparison of the i–V curves of the two modules is shown in Fig. 6B. At 0% SoC, the crossing point between the VRFB and the 3CM curves already overpasses the MPP of the PV, and a maximum photocurrent of 100 mA can be expected (∼6.5 mA cm−2 per PV area). For the 4CM, however, the MPP is not overpassed below a 75% SoC. This fact confirms that from the point of view of operation conditions, the 4CM properly matches the working voltage of the VRFB.
Besides the electrochemical efficiencies, we estimated the average ηSTC at high SoC (for instantaneous evolution, see Fig. S7†) and ηRT for the 4CM, obtaining values of 7.5 and 5.0%, respectively. In particular, the ηRT obtained with the 4CM is, to our knowledge, among the highest values reached for solar-driven redox flow batteries. Actually, Abruña et al.13 and Liao et al.11 have respectively obtained 2.8 and 1.0% efficiencies in organic/inorganic solar flow batteries providing a lower energy density than VRFBs, while the highest value has been reported by Li et al.,32 with a ηRT of ∼14.1%. Regarding solar-driven VRFBs, on the other hand, Liu et al.23 have reported 0.6% efficiency (comparative values are collected in Table S5†). In fact, considering the ratio between the overall round-trip energy and the photovoltaic efficiencies, our solar VRFB with the 4CM recovers around 62% of the solar energy converted into the PV, during the discharge, which in fact confirms the suitability of this adapted module for integration in the solar VRFB.
After considering the results we have obtained, the integration of multijunctions based on commercial photovoltaic systems has been demonstrated to be the most straightforward alternative for the deployment of solar redox flow batteries, from efficiency and cost perspectives. Additional effort must be devoted to the proper fabrication of such solar modules, but also a careful consideration of the operation performance before final integration is necessary. Although the energy storage system can also be adapted, as demonstrated by our results with the 3CM and the symmetric V4/V4 configuration, the technological development of such systems probably should go in the other direction, through the adaptation of the photovoltaic system to the needs of higher power density redox flow batteries. Besides the adaptation, alternative solutions such as using solar concentration might also contribute to advance in attaining more realistic devices.
Conclusions
The integration of thin film photovoltaic modules and a full vanadium redox flow battery (VRBF) in a single straightforward device has been successfully assessed, and the influence of the intrinsic photovoltaic module on the performance has been determined. This way, a strong correlation between the photovoltaic maximum power point and the VRFB has been demonstrated, for two different Cu(In, Ga)Se2 minimodules with 4- and 3-series-connected cells with two VRFB configurations: a symmetrical V4/V4 and full VRFB. Additionally, some simple tools for correlating the performance of the photovoltaics and the battery might be found in this work.The minimodule with 4 series-connected cells achieves full battery photocharge with round-trip energy efficiencies (∼5%) among the highest ones for solar VRFBs. In the case of the 3-cell module, a full dependence on the open-circuit potential of the battery was observed, leading to an excellent performance for a symmetrical V4/V4 configuration (constant power density) and to poor efficiency values in a full VRFB (decreasing power density).
Finally, we have demonstrated the tremendous potential of this kind of energy storage system by customizing commercial thin film photovoltaics for the first time, which might shed light on the road for the future development of such solar batteries based on more simple configurations by using already existing technology.
Conflicts of interest
There are no conflicts to declare.Acknowledgements
The authors thank the Generalitat de Catalunya for financial support through the CERCA Program and M2E (2017SGR1246). IREC also acknowledges support by the European Regional Development Funds (ERDF, FEDER) and by MINECO projects ENE2016-80788-C5-5-R and ENE2017-85087-C3-2-R. S. M.-L. thanks European Union’s Horizon 2020 and the Agency for Business Competitiveness of the Government of Catalonia for funding under the Marie Sklodowska-Curie grant agreement no. 712939 (TECNIOspring PLUS). M. C. thanks the DOC-FAM programme (H2020-MSCA grant agreement no. 754397).References
- J. Jean, P. R. Brown, R. L. Jaffe, T. Buonassisi and V. Bulovic, Energy Environ. Sci., 2015, 8, 1200–1219 RSC.
- A. Gurung and Q. Qiao, Joule, 2018, 2, 1217–1230 CrossRef CAS.
- Z. Yang, L. Li, Y. Luo, R. He, L. Qiu, H. Lin and H. Peng, J. Mater. Chem. A, 2013, 1, 954–958 RSC.
- K. Wedege, D. Bae, W. A. Smith, A. Mendes and A. Bentien, J. Phys. Chem. C, 2018, 122, 25729–25740 CrossRef CAS.
- S. Licht, G. Hodes, R. Tenne and J. Manassen, Nature, 1987, 326, 863–864 CrossRef CAS.
- H. D. Um, K. H. Choi, I. Hwang, S. H. Kim, K. Seo and S. Y. Lee, Energy Environ. Sci., 2017, 10, 931–940 RSC.
- C. Choi, S. Kim, R. Kim, Y. Choi, S. Kim, H. Jung, J. H. Yang and H. T. Kim, Renewable Sustainable Energy Rev., 2017, 69, 263–274 CrossRef CAS.
- M. Skyllas-Kazacos, M. H. Chakrabarti, S. A. Hajimolana, F. S. Mjalli and M. Saleem, J. Electrochem. Soc., 2011, 158, R55–R79 CrossRef CAS.
- M. Yu, W. D. McCulloch, D. R. Beauchamp, Z. Huang, X. Ren and Y. Wu, J. Am. Chem. Soc., 2015, 137, 8332–8335 CrossRef CAS PubMed.
- P. Liu, Y. L. Cao, G. R. Li, X. P. Gao, X. P. Ai and H. X. Yang, ChemSusChem, 2013, 6, 802–806 CrossRef CAS PubMed.
- S. Liao, X. Zong, B. Seger, T. Pedersen, T. Yao, C. Ding, J. Shi, J. Chen and C. Li, Nat. Commun., 2016, 7, 1–8 Search PubMed.
- W. D. McCulloch, M. Yu and Y. Wu, ACS Energy Lett., 2016, 1, 578–582 CrossRef CAS.
- J. R. McKone, F. J. DiSalvo and H. D. Abruña, J. Mater. Chem. A, 2017, 5, 5362–5372 RSC.
- Q. Cheng, W. Fan, Y. He, P. Ma, S. Vanka, S. Fan, Z. Mi and D. Wang, Adv. Mater., 2017, 29, 1700312 CrossRef PubMed.
- C. Flox, S. Murcia-López, N. M. Carretero, C. Ros, J. R. Morante and T. Andreu, ChemSusChem, 2018, 11, 125–129 CrossRef CAS PubMed.
- K. Wedege, D. Bae, E. Dražević, A. Mendes, P. C. Vesborg and A. Bentien, RSC Adv., 2018, 8, 6331–6340 RSC.
- R. López-Vizcaíno, E. Mena, M. Millán, M. A. Rodrigo and J. Lobato, Renewable Energy, 2017, 114, 1123–1133 CrossRef.
- T. Shibata, K. Takahiro, Y. Nagaoka, K. Kawase and K. Yano, SEI Tech. Rev., 2013, 76, 14–22 Search PubMed.
- E. Mena, R. López-Vizcaíno, M. Millán, P. Cañizares, J. Lobato and M. A. Rodrigo, Int. J. Energy Res., 2018, 42, 720–730 CrossRef CAS.
- J. Lobato, E. Mena and M. Millán, ChemistrySelect, 2017, 2, 8446–8450 CrossRef CAS.
- J. Azevedo, T. Seipp, J. Burfeind, C. Sousa, A. Bentien, J. P. Araújo and A. Mendes, Nano Energy, 2016, 22, 396–405 CrossRef CAS.
- F. Urbain, S. Murcia-López, N. Nembhard, J. Vázquez-Galván, C. Flox, V. Smirnov, K. Welter, T. Andreu, F. Finger and J. R. Morante, J. Phys. D: Appl. Phys., 2019, 52, 044001 CrossRef.
- Z. Wei, Y. Shen, D. Liu and F. Liu, Sci. Rep., 2017, 7, 1–9 CrossRef PubMed.
- S. Liao, J. Shi, C. Ding, M. Liu, F. Xiong, N. Wang, J. Chen and C. Li, J. Energy Chem., 2018, 27, 278–282 CrossRef.
- P. D. Matthews, P. D. McNaughter, D. J. Lewis and P. O'Brien, Chem. Sci., 2017, 8, 4177–4187 RSC.
- P. Reinhard, A. Chirilă, P. Blösch, F. Pianezzi, S. Nishiwaki, S. Buecheler and A. N. Tiwari, IEEE J. Photovolt., 2013, 3, 572–580 Search PubMed.
- J. Ramanujam and U. P. Singh, Energy Environ. Sci., 2017, 10, 1306–1319 RSC.
- M. Powalla, S. Paetel, D. Hariskos, R. Wuerz, F. Kessler, P. Lechner, W. Wischmann and T. M. Friedlmeier, Engineering, 2017, 3, 445–451 CrossRef CAS.
- C. Ros, T. Andreu, S. Giraldo, Y. Sánchez and J. R. Morante, Sol. Energy Mater. Sol. Cells, 2016, 158, 184–188 CrossRef CAS.
- M. Chen, Y. Liu, C. Li, A. Li, X. Chang, W. Liu, Y. Sun, T. Wang and J. Gong, Energy Environ. Sci., 2018, 11, 2025–2034 RSC.
- D. Bae, G. M. Faasse, G. Kanellos and W. A. Smith, Sustainable Energy Fuels, 2019, 3, 2399–2408 RSC.
- W. Li, H. C. Fu, Y. Zhao, J. H. He and S. Jin, Chem, 2018, 4, 1–14 Search PubMed.
- W. Li, E. Kerr, M. A. Goulet, H. C. Fu, Y. Zhao, Y. Yang, A. Veyssal, J. H. He, R. G. Gordon, M. J. Aziz and S. Jin, Adv. Energy Mater., 2019, 9, 1900918 CrossRef.
- J. Vázquez-Galván, C. Flox, C. Fàbrega, E. Ventosa, A. Parra, T. Andreu and J. R. Morante, ChemSusChem, 2017, 10, 2089–2098 CrossRef PubMed.
- W. Duan, B. Li, D. Lu, X. Wei, Z. Nie, M. Vijayakumar, J. P. Kizewski, A. Hollas, D. Reed, V. Sprenkle and W. Wang, J. Energy Chem., 2018, 27, 1381–1385 CrossRef.
- R. A. Potash, J. R. McKone, S. Conte and H. D. Abruña, J. Electrochem. Soc., 2016, 163, A338–A344 CrossRef CAS.
Footnote |
| † Electronic supplementary information (ESI) available: Detailed mini-module preparation, comparison of fabrication cost for different thin film PVs, galvanostatic measurements, estimated battery efficiencies, i–V curves of the CIGS modules, solar cell efficiencies, cell voltage and photocurrent variation during photocharge tests. See DOI: 10.1039/c9se00949c |
| This journal is © The Royal Society of Chemistry 2020 |

