 Open Access Article
Engineering doping-vacancy double defects and insights into the conversion mechanisms of an Mn–O–F ultrafine nanowire anode for enhanced Li/Na-ion storage and hybrid capacitors†
Yongfa
Huang
,
Rui
Ding
 *,
Danfeng
Ying
,
Wei
Shi
,
Yuxi
Huang
,
Caini
Tan
,
Xiujuan
Sun
,
Ping
Gao
and
Enhui
Liu
Key Laboratory of Environmentally Friendly Chemistry and Applications of Ministry of Education, College of Chemistry, Xiangtan University, Xiangtan, Hunan 411105, P. R. China. E-mail: drm8122@163.com; drm8122@xtu.edu.cn
First published on 14th October 2019
Abstract
The behavior of Li/Na-ion capacitors (LICs/NICs) is largely limited by the low number of electroactive sites in conventional insertion-type anodes. In this work, we demonstrated a novel doping-vacancy double-defective and conversion-type Mn–O–F ultrafine nanowire (denoted as MnF2-E) anode to boost the number of electroactive sites for enhanced LICs/NICs. Owing to the unique hetero oxygen-doping and intrinsic fluorine-vacancy double defects, the Mn–O–F nanowires exhibited superior electroactive sites and thus dramatically enhanced Li/Na-ion storage capability than pristine MnF2 micro/nano-crystals. Both the optimal MnF2 screened by orthogonal experiments and derived Mn–O–F anodes and commercial activated carbon (AC) cathode were used to construct MnF2//AC and MnF2-E//AC LICs/NICs, which were optimized by tuning the active mass ratios of the cathode/anode and the working voltage windows of the hybrid capacitors. The LICs/NICs based on the Mn–O–F anode demonstrated a considerably superior performance than the devices based on the MnF2 anode under the optimal voltages of 0–4 V and 0–4.3 V. The Mn–O–F anode exhibited dominant diffusion/surface-controlled kinetics for Li/Na-ion storage, respectively, showing a major conversion mechanism for the charge storage processes. This work provides a new concept of double-defective and conversion-type electrode materials to improve the Li/Na-ion storage capability and will have a significant impact on the relevant fields.
Introduction
Energy is increasingly inseparable from human life with the development of society; however, the disadvantages of the depletion of fossil fuel resources and environmental pollution limit their applications. Thus, electrochemical energy storage has become one of the most important strategies to solve these issues.1 Electrochemical energy storage, which is necessary for future large-scale power grids, is sustainable, green and responsive and can be used in electrochemical engines and smart devices.2 Electrochemical capacitors (ECs) or supercapacitors (SCs) as an important part of electrochemical energy storage have attracted wide interest from researchers,3 especially lithium-ion capacitors (LICs)4,5 and sodium-ion capacitors (NICs).6,7 Furthermore, non-aqueous hybrid ion capacitors8,9 usually show a higher working voltage, larger energy density and wider temperature scope than aqueous hybrid ion capacitors.10LIC was proposed by Amatucci's team in 2001.11,12 It uses a battery-type material as the negative electrode with high energy density and an electric double layer (EDL) carbon material as the positive electrode with high power density; thus, LICs can export high energy and power density simultaneously. However, the performance of LICs is largely limited by anode materials, which have low electrochemical activity. Thus, finding new anodes with high electroactive sites has become an important research direction. Various advanced materials such as Nb2O5,13 MnO,14 and BiVO4![[thin space (1/6-em)]](https://www.rsc.org/images/entities/char_2009.gif) 15 have been reported as intriguing anodes for LICs.
15 have been reported as intriguing anodes for LICs.
Nowadays, the depletion of lithium resources has caused widespread concern and more seriously, the development of lithium resources cannot keep up with the development of lithium-ion energy storage devices.16 Therefore, it is very important to find electrochemical energy storage devices with low cost, high safety, high energy/power densities and long cycle stability. It is particularly attractive to develop other ion energy storage devices for this purpose. Sodium (Na) ions are highly abundant and low cost in nature and have received great attention from researchers as alternatives to lithium ions.17 Sodium ion capacitors (NICs) also have the advantages of sodium ion batteries of high energy density and EDL capacitors of high power density. Some NICs even exhibit the same performance as LICs, such as Nb2O5@C/reduced graphene oxide (rGO),18 TiO2/C,19 N–TiO2,20 3D framework carbon (3DFC),21 peanut skin-derived carbon nanosheets-A (SCN-A).22
Electrode materials play a key role in electrochemical energy storage. The choice of materials should be based specifically on the following reasons: firstly, high specific surface area can afford rich electroactive sites, which can ensure high specific capacity. Secondly, high porosity can provide facile pathways for ion transportation and superior endurance for volume change, which can ensure high rate capability and stability. Thirdly, special morphologies such as nanowires and nanotubes, can facilitate the electron/ion transfer rates, which can further enhance the electrochemical performance.
In recent years, heteroatom doping has been widely used in electrochemical energy storage devices, which can greatly improve the surface properties of electrode materials, shorten the ion transport channels, and thus significantly improve the charge storage capability,23,24 which include (N or S)-doped graphene,25 (B, N or S)-doped hard carbon,26 and S-doped V6O13-x (VOS).27 Furthermore, vacancy defects can increase the number of electroactive sites and enhance the electron/ion transfer kinetics of electrode materials,23,24 such as O-vacancy-Co3O4,28 and Co-vacancy-CoSe2.29 Considering the above advantages, the Li/Na-ion storage capability of the pristine MnF2 anode can be significantly increased by simultaneously introducing hetero oxygen-doping and intrinsic fluorine anion-vacancies.
In this work, we report hetero oxygen-doping and fluorine anion-vacancy double-defective Mn–O–F ultrafine nanowires as novel promising anodes for LICs and NICs. Due to the disadvantages of large particle size and low specific surface area of pristine MnF2, we propose a simple method to solve these problems via the etching treatment of pristine MnF2 micro/nanocrystals with NaBH4 agents, which generates double-defective Mn–O–F ultrafine nanowires with high porosity and large specific surface area (the materials are denoted as MnF2-E). The performance of MnF2 candidates was firstly optimized via an orthogonal experiment (L934). The optimal MnF2 (8#) and etched MnF2 (8#)-E (Mn–O–F) anodes and commercial activated carbon (AC) cathode were used to construct the MnF2//AC and MnF2-E//AC LICs/NICs, which were optimized by tuning the active mass ratios of positive and negative electrodes and working voltage windows of the capacitors. Both the LICs and NICs based on the double-defective Mn–O–F anode showed much better electrochemical performance than the devices based on the MnF2 anode. The kinetics and mechanisms of the MnF2 and Mn–O–F anodes for both Li-ion and Na-ion storage were also investigated. Overall, this work addresses new insight into heteroatom doping and anion vacancy double-defective Mn–O–F anodes for advanced LICs and NICs and will have a significant impact on the development of advanced electrode materials for high-performance electrochemical energy storage devices.
Results and discussion
Physicochemical property
The optimal MnF2 8# (herein, the choice of MnF2 8# is owing to its overall superior specific capacity, rate capability and cycling behavior, Fig. S6 and Table S4, ESI†) and MnF2 8#-E (Mn–O–F) materials were characterized by X-ray diffraction (XRD), Fourier transform infrared spectroscopy (FTIR), X-ray photoelectron spectroscopy (XPS), scanning electron microscopy (SEM), transmission electron microscopy (TEM), high-resolution TEM (HRTEM), selected area electron diffraction (SAED), X-ray energy dispersive spectroscopy (EDS), mapping, and nitrogen isothermal sorption with Brunauer–Emmett–Teller (BET) and Barrett–Joyner–Halenda (BJH) methods. Fig. 1A shows the XRD patterns of the MnF2 8# and MnF2 8#-E samples, which correspond to tetragonal MnF2 with the space group of P42/mnm (the crystal structures of MnF2 8# and MnF2 8#-E are shown in Fig. S1†). The XRD patterns of the other eight samples from the orthogonal experiment (Fig. S2 and Tables S1, S2†) also correspond to the tetragonal MnF2 standard card, indicating the successful synthesis of the materials. It is apparent that the peak intensity of MnF2 8#-E is significantly weaker than that of MnF2 8#, which indicates that the particle size or crystallinity of the MnF2 8#-E sample decreased significantly. More interestingly, in the enlarged view of the crystal plane of (110), the peak position of MnF2 8#-E shows a slight negative shift by 0.03°, which may be due to oxygen heteroatom doping. The IR spectra of MnF2 8#-E and MnF2 8# in Fig. 1B demonstrate the presence of the Mn–O bond in MnF2 8#-E, which is direct evidence of the oxygen heteroatom doping. Fig. 1C shows the XPS survey scan spectra of MnF2 8# and MnF2 8#-E. The typical Mn 2p and F 1s can be clearly seen for MnF2. Notably, the O 1s peak of MnF2 8#-E is significantly stronger than that of MnF2 8#, whereas the F 1s peak of MnF2 8#-E is obviously weaker than that of MnF2 8#, which is attributed to the fact that the oxygen heteroatoms largely occupy the positions of the fluorine atoms, resulting in the presence of rich fluorine vacancies owing to the charge balance. The Mn 2p spectra of MnF2 8# and MnF2 8#-E are shown in Fig. 1D, where Mn 2p3/2 and Mn 2p1/2 are negatively shifted by 0.6 eV and 1.7 eV compared with the Mn 2p spectra of MnF2 8#, respectively, which is due to the formation of the Mn–O bond by oxygen doping. The F 1s spectrum of MnF2 8#-E in Fig. 1E is significantly lower than that of MnF2 8#, accompanied by a negative shift of 0.8 eV for MnF2 8#-E, which is due to the hetero oxygen doping and fluorine ion vacancy. Fig. 1F shows the O 1s spectra, where the O 1s peak of MnF2 8#-E exhibits a negative shift of 1.8 eV compared to that of MnF2 8#, which is due to the formation of a strong Mn–O bond by the hetero oxygen doping. Moreover, the ratio of Mn/O/F was estimated to be 1![[thin space (1/6-em)]](https://www.rsc.org/images/entities/char_2009.gif) :
:![[thin space (1/6-em)]](https://www.rsc.org/images/entities/char_2009.gif) 0.934/0.132 based on the XPS results, and thus the formula of Mn–O–F can be expressed as MnO0.934F0.132. Herein, the doping of oxygen heteroatoms and fluorine vacancy double defects gave Mn–O–F a distinct advantage in electrochemical performance.
0.934/0.132 based on the XPS results, and thus the formula of Mn–O–F can be expressed as MnO0.934F0.132. Herein, the doping of oxygen heteroatoms and fluorine vacancy double defects gave Mn–O–F a distinct advantage in electrochemical performance.
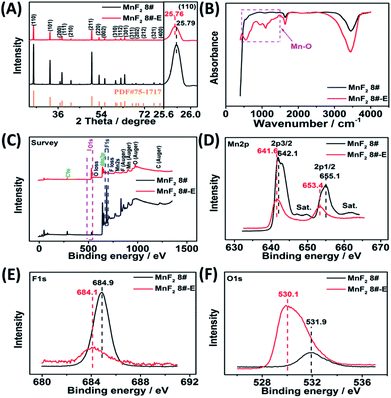 | ||
| Fig. 1 XRD patterns(A), FTIR spectra (B), XPS survey scan (C), and XPS Mn 2p (D), F 1s (E) and O 1s (F) spectra of the MnF2 8# and MnF2 8#-E samples. | ||
The SEM and TEM images of MnF2 8# are shown in Fig. 2A and B, respectively, showing a size range of around 0.5–2 μm. The HRTEM image of MnF2 8# in Fig. 2C shows the lattice fringes of 0.345 nm, which is matched with the (110) crystal plane of tetragonal MnF2. The SAED patterns in Fig. 2D exhibit the single-crystalline diffraction characteristics of MnF2 8# with the marked standard crystalline planes of (110), which are in good agreement with the HRTEM and XRD results. Furthermore, the mapping images of MnF2 8# in Fig. 2E–G demonstrate the uniform distributions of F/Mn species. Fig. 2H, I and S3† show the SEM/TEM images of MnF2 8#-E, which exhibit an ultrafine nanowire morphology with a diameter of about 10 nm, and a much more porous structure can be clearly seen for MnF2 8#-E (the possible formation process can be seen in Scheme 1, ESI†), which endows the MnF2 8#-E sample with more electroactive sites than the pristine MnF2 8# sample. The ultrafine nanowire morphology and porous structure also ensure a shorter ion transport length and provide a larger electrode/electrolyte interface for charge transport reactions, which is also reflected in its superior electrochemical performance.30 The HRTEM image and SAED pattern of MnF 8#-E are shown in Fig. 2J and K, respectively, in which a typical amorphous structure with a lightly larger lattice fringe of 0.35 nm corresponding to the (110) crystal plane can be detected. The mapping diagrams of MnF2 8#-E in Fig. 2L–O demonstrate the even distribution of Mn, O, and F elements in the MnF2 8#-E sample, which again prove hetero oxygen doping in the MnF2 structure. The different colors of MnF2 8# and MnF2 8#-E in Fig. S4† and the element results from the EDS data in Fig. S5† also reflect the doping of oxygen heteroatoms and the change in the intrinsic structure of the materials. Further changes can be also seen from the nitrogen isothermal sorption data, pore volume and pore size distribution of MnF2 8# and MnF2 8#-E (Fig. 3A–F). Specifically, MnF2 8# has a very small specific surface area of only 2.75 m2 g−1, while MnF2 8#-E exhibits a staggering value of 198.96 m2 g−1, and the pore volume of MnF2 8# is also very small (0.008 cm3 g−1) in comparison with the very large pore volume of MnF2 8#-E (0.95 cm3 g−1), and the pore size of MnF2 8# is mainly distributed at 2.23 nm in comparison with the bigger pore size distribution of MnF2 8#-E (11.26 nm), which indicate an enormous increase in specific surface area, pore volume and pore size by the introduction of hetero oxygen doping and fluorine vacancy double defects, ensuring the exceptionally superior electrochemical performance of the double-defective Mn–O–F ultrafine nanowires for Li/Na-ion storage.
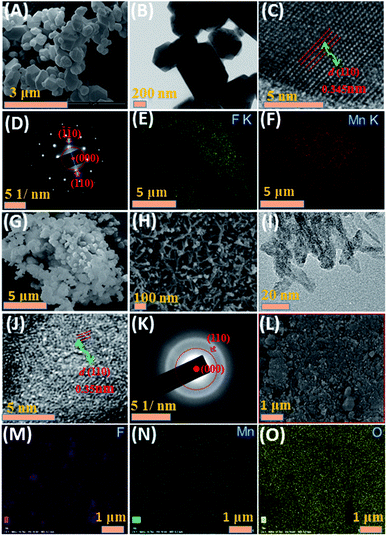 | ||
| Fig. 2 SEM (A), TEM (B), HRTEM (C), SAED (D) and mapping (E–G) images of MnF2 8# sample. SEM (H), TEM (I), HRTEM (J), SAED (K) and mapping (L–O) images of MnF2 8#-E sample. | ||
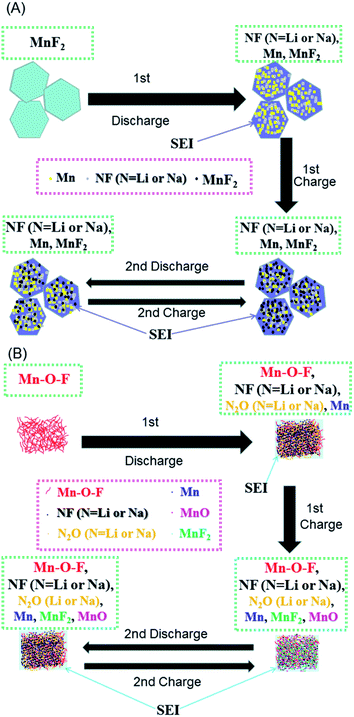 | ||
| Scheme 1 Schematics of the possible reaction mechanisms for the MnF2 (A) and MnF2-E (B) electrodes during the first two cycles of discharging/charging processes. | ||
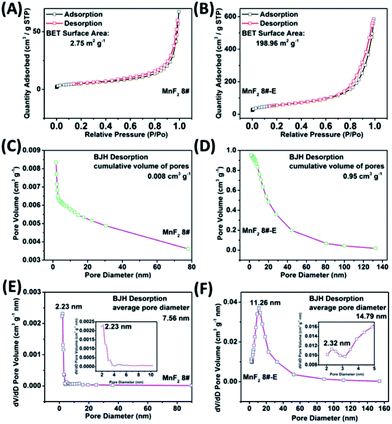 | ||
| Fig. 3 N2 isothermal sorption (A and B), pore volume (C and D) and pore size distribution (E and F) of the MnF2 8# and MnF2 8#-E samples, respectively. | ||
Performance for Li-ion storage
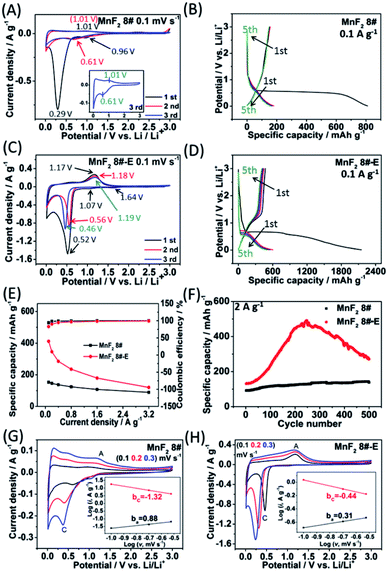
To evaluate the electrochemical performance of the MnF2 (1#–9#) samples and select the optimal candidate from the orthogonal experiments, Li//MnF2 half cells were assembled and tested via cyclic voltammetry (CV) and galvanostatic charge/discharge (GCD) between 0.01 and 3 V (vs. Li/Li+). Based on the results of the orthogonal analysis and performance comparison in Tables S3, S4 and Fig. S6,† MnF2 8# exhibited an overall superior performance. The cyclic voltammogram of the first three revolutions at 0.1 mV s−1 of MnF2 8# is shown in Fig. 4A, with one minor peak located at about 0.96 V and a sharp peak at around 0.29 V for the first cathode scan, which coincide with the platforms and the sloped regions at the low voltage appearing in the original discharge branch of the GCD curves at 0.1 A g−1 (Fig. 4B), respectively. These peaks are largely owing to the conversion of MnF2 into Mn/LiF and the formation of solid electrolyte interphase (SEI) films accompanied with a highly reversible interfacial Li-ion intercalation reaction within the Mn/LiF matrix in the low potential region, respectively.31–35 Also, the minor anodic peak at 1.01 V can be ascribed to the partial conversion of Mn/LiF into MnF2.31,32 However, the redox peaks were maintained at about 1.01/0.61 V in the subsequent cycles, and it can be seen from the charge–discharge curves that the capacity is basically unchanged in the subsequent cycles except for the much larger specific capacity of the original discharge, indicating that the internal structure is protected after the formation of the SEI films, and shows good electrochemical stability.31,32 Similar changing trends in the redox peaks and charge–discharge platforms can be also found from the CV curves and GCD plots of the other MnF2 samples, as shown in Fig. S7 and S8.†
Fig. 4C shows the CV plots of MnF2 8#-E at a sweep speed of 0.1 mV s−1, with two weak cathode peaks at 1.64 V and 1.07 V and a sharp cathode peak at 0.52 V in the first cathode sweep, which may be due to the conversion of Mn–O–F into Mn/LiF/Li2O and the formation of the SEI films, and the minor anodic peak at 1.17 V can be ascribed to the partial conversion of Mn/LiF/Li2O into MnF2/MnO.14,31,32 In the next two cycles, the cathode peaks shifted slightly from 0.56 V to 0.46 V, and the anode peaks shifted slightly from 1.18 V to 1.19 V, indicating good reversibility. Fig. 4E and F show the specific capacity and cycle performance of the MnF2 8# and MnF2 8#-E electrodes, respectively, where MnF2 8#-E provided the much bigger specific capacity of 411–120 mA h g−1 at 0.1–3.2 A g−1 in comparison with that of 153–89 mA h g−1 at 0.1–3.2 A g−1 for the MnF2 8# electrode. The more obvious gap is also reflected in the cycle performance after 500 cycles at 2 A g−1, where MnF2 8#-E exhibited 271 mA h g−1 (207% retention), whereas MnF2 8# exhibited only 138 mA h g−1 (152% retention). Moreover, the performance of the Mn–O–F anode is comparable or even superior to that of many state-of-the-art anode materials for Li-ion batteries (LIBs) (Table S5, ESI†) (the more detailed performance from the CV curves, GCD curves, rate capability and coulombic efficiency, cycling stability and coulombic efficiency of the MnF2 (1#–9#) and MnF2 8#-E electrodes can be seen in Fig. S7–S14†). The enhanced performance of the Mn–O–F ultrafine nanowires with the hetero oxygen doping and fluorine vacancies provides an important strategy for the promotion of charge storage capability of Li-ion anode materials. Herein, the initial increase in capacity for the MnF2 8# and MnF2 8#-E electrodes may be owing to the formation of continuous conductivity networks via the conversion, reversible reactions of SEI films and enhanced electroactive sites by the activation of the electrode,32 while the subsequent decrease in capacity for the MnF2 8#-E electrode may be owing to the decrease in the electroactive sites by the agglomeration of the amorphous ultrafine nanoparticles. The XRD patterns of the electrodes after cycling (Fig. S15A and B, ESI†) demonstrate the very faint diffraction peaks of MnF2 phase compared with the pristine states, and the TEM images of the electrodes after cycling (Fig. S15C–F, ESI†) show the presence of numerous ultrafine nanoparticles in the pristine nanocrystals or nanowires, suggesting the formation of a largely amorphous nanostructure for Li-ion storage after the long-term conversions. The CV plots at different sweep rates (0.1, 0.2, and 0.3 mV s−1) of the MnF2 8# and MnF2 8#-E electrodes are shown in Fig. 4G and H, and the relationship of lg![[thin space (1/6-em)]](https://www.rsc.org/images/entities/char_2009.gif) i–lg
i–lg![[thin space (1/6-em)]](https://www.rsc.org/images/entities/char_2009.gif) v (i = avb)36 for MnF2 8# and MnF2 8#-E electrodes derived from the CV plots are shown in the insets of Fig. 4G and H. Note that the slopes of ba and bc are 0.88 and −1.32 for MnF2 8#, in comparison with that of 0.31 and −0.44 for MnF2 8#-E, respectively. These results indicate that the kinetics of the MnF2 8# electrode is dominated by surface-controlled kinetics (i.e. pseudocapacitive behavior),37 whereas the MnF2 8#-E electrode has the typical diffusion-controlled property. Herein, the absolute b values (0.31/0.44) of the MnF2 8#-E electrode are lower than 0.5, indicating the deviation from the typical planar diffusion characteristics, which may be owing to the highly porous and rough structure of the electrode, leading to the partial spherical diffusion. Moreover, the pseudocapacitive contribution (k1v)36,37 at 0.1–0.3 mV s−1 was estimated to be 73–82% and 31–44% for the MnF2 8# and MnF2 8#-E electrodes, respectively (Fig. S16 and S17, ESI†).
v (i = avb)36 for MnF2 8# and MnF2 8#-E electrodes derived from the CV plots are shown in the insets of Fig. 4G and H. Note that the slopes of ba and bc are 0.88 and −1.32 for MnF2 8#, in comparison with that of 0.31 and −0.44 for MnF2 8#-E, respectively. These results indicate that the kinetics of the MnF2 8# electrode is dominated by surface-controlled kinetics (i.e. pseudocapacitive behavior),37 whereas the MnF2 8#-E electrode has the typical diffusion-controlled property. Herein, the absolute b values (0.31/0.44) of the MnF2 8#-E electrode are lower than 0.5, indicating the deviation from the typical planar diffusion characteristics, which may be owing to the highly porous and rough structure of the electrode, leading to the partial spherical diffusion. Moreover, the pseudocapacitive contribution (k1v)36,37 at 0.1–0.3 mV s−1 was estimated to be 73–82% and 31–44% for the MnF2 8# and MnF2 8#-E electrodes, respectively (Fig. S16 and S17, ESI†).
Electrochemical impedance spectroscopy (EIS) was used to investigate the electrochemical kinetics of the MnF2 and MnF2 8#-E electrodes for Li-ion storage. As shown in Fig. S19,† the Nyquist plots include a Z′-axis intercept at the superhigh frequency, one semicircle in the high frequency region, a short sloping line in the intermediate frequency region and an oversized curved arc in the low frequency region, which are considered as the internal ohmic resistance (Rs) (including resistances of electrode and electrolyte, and contact resistances between particles and/or between electrode and current collector), charge transfer resistance (Rct) related to the electrochemical kinetics process, Warburg impedance (W) related to the ion diffusion process and the electronic resistance related to the bulk materials, respectively.32 The equivalent circuit model is shown in Fig. S18 (ESI†), and the fitting results are listed in Table S6 (ESI†), in which the Mn–O–F electrode shows a smaller Rct (37.33 Ω) than the MnF2 electrodes (43.09–68.34 Ω), implying the faster electrochemical kinetics in the Mn–O–F electrode because of its superior morphology and porosity.
The MnF2//AC and MnF2-E//AC LICs were further assembled with MnF2 8# and MnF2 8#-E as the anodes and commercial AC as the cathode together with the anodes pre-charged (pre-lithiation) mode at 0.1 A g−1 for 3.5 turns (Fig. S20†). Different active mass ratios of the cathode/anode were examined firstly. For the MnF2//AC LICs, the performance comparison for different mass ratios in Fig. S22† makes it clear that MnF2//AC (1![[thin space (1/6-em)]](https://www.rsc.org/images/entities/char_2009.gif) :
:![[thin space (1/6-em)]](https://www.rsc.org/images/entities/char_2009.gif) 1) is the optimal LIC (the performance of the AC cathode is shown in Fig. S21,† and the voltage windows, GCD curves and CV plots of the MnF2//AC LICs with different mass ratios are shown in Fig. S23 and S24†). For the MnF2-E//AC LICs, the best mass ratio was determined to be 1
1) is the optimal LIC (the performance of the AC cathode is shown in Fig. S21,† and the voltage windows, GCD curves and CV plots of the MnF2//AC LICs with different mass ratios are shown in Fig. S23 and S24†). For the MnF2-E//AC LICs, the best mass ratio was determined to be 1![[thin space (1/6-em)]](https://www.rsc.org/images/entities/char_2009.gif) :
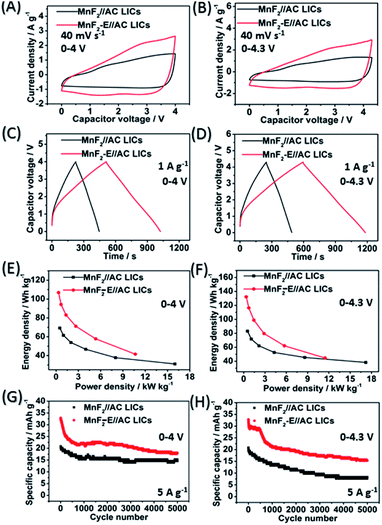
:![[thin space (1/6-em)]](https://www.rsc.org/images/entities/char_2009.gif) 2 based on the results shown in Fig. S25 and S26.† After selecting the optimal mass ratios of the LICs, different voltage windows (0–4 V and 0–4.3 V) were further examined. Fig. 5A–H show the CV plots at 40 mV s−1, GCD curves at 1 A g−1, Ragone behavior and cycling performance at 5 A g−1 of the MnF2//AC (1
2 based on the results shown in Fig. S25 and S26.† After selecting the optimal mass ratios of the LICs, different voltage windows (0–4 V and 0–4.3 V) were further examined. Fig. 5A–H show the CV plots at 40 mV s−1, GCD curves at 1 A g−1, Ragone behavior and cycling performance at 5 A g−1 of the MnF2//AC (1![[thin space (1/6-em)]](https://www.rsc.org/images/entities/char_2009.gif) :
:![[thin space (1/6-em)]](https://www.rsc.org/images/entities/char_2009.gif) 1) and MnF2-E//AC (1
1) and MnF2-E//AC (1![[thin space (1/6-em)]](https://www.rsc.org/images/entities/char_2009.gif) :
:![[thin space (1/6-em)]](https://www.rsc.org/images/entities/char_2009.gif) 2) LICs under the voltages of 0–4 V and 0–4.3 V. The MnF2-8#-E//AC capacitor exhibited a larger CV area and longer charge and discharge times, indicating its better performance (the CV plots at different sweep speeds and GCD curves under different current densities are shown in Fig. S26–S28†). Furthermore, the MnF2-E//AC LICs exhibited remarkable performances under both 0–4 V (106.8–41.4 W h kg−1/0.33–10.7 kW kg−1, 63.4% retention/3000 cycles/5 A g−1) and 0–4.3 V (132.2–44.6 W h kg−1/0.36–11.5 kW kg−1, 63.5% retention/1000 cycles/5 A g−1) in comparison with the MnF2//AC LICs at 0–4 V (69.2–31.1 W h kg−1/0.5–16.0 kW kg−1, 72.5% retention/3000 cycles/5 A g−1) and 0–4.3 V (82.9–38.2 W h kg−1/0.54–17.2 kW kg−1, 63.5% retention/1000 cycles/5 A g−1) (more details are shown in Table S7†). The remarkable performance of the MnF2-E//AC LICs further proves that the double-defective Mn–O–F ultrafine nanowire anode with hetero oxygen doping and intrinsic fluorine vacancy greatly enhances the energy storage performance. Moreover, the MnF2-E//AC and MnF2//AC LICs exhibited comparable or even better performance than many state-of-the-art LICs systems reported in the literature (Table S8†), demonstrating their promising application in Li-ion storage.
2) LICs under the voltages of 0–4 V and 0–4.3 V. The MnF2-8#-E//AC capacitor exhibited a larger CV area and longer charge and discharge times, indicating its better performance (the CV plots at different sweep speeds and GCD curves under different current densities are shown in Fig. S26–S28†). Furthermore, the MnF2-E//AC LICs exhibited remarkable performances under both 0–4 V (106.8–41.4 W h kg−1/0.33–10.7 kW kg−1, 63.4% retention/3000 cycles/5 A g−1) and 0–4.3 V (132.2–44.6 W h kg−1/0.36–11.5 kW kg−1, 63.5% retention/1000 cycles/5 A g−1) in comparison with the MnF2//AC LICs at 0–4 V (69.2–31.1 W h kg−1/0.5–16.0 kW kg−1, 72.5% retention/3000 cycles/5 A g−1) and 0–4.3 V (82.9–38.2 W h kg−1/0.54–17.2 kW kg−1, 63.5% retention/1000 cycles/5 A g−1) (more details are shown in Table S7†). The remarkable performance of the MnF2-E//AC LICs further proves that the double-defective Mn–O–F ultrafine nanowire anode with hetero oxygen doping and intrinsic fluorine vacancy greatly enhances the energy storage performance. Moreover, the MnF2-E//AC and MnF2//AC LICs exhibited comparable or even better performance than many state-of-the-art LICs systems reported in the literature (Table S8†), demonstrating their promising application in Li-ion storage.
Performance for Na-ion storage
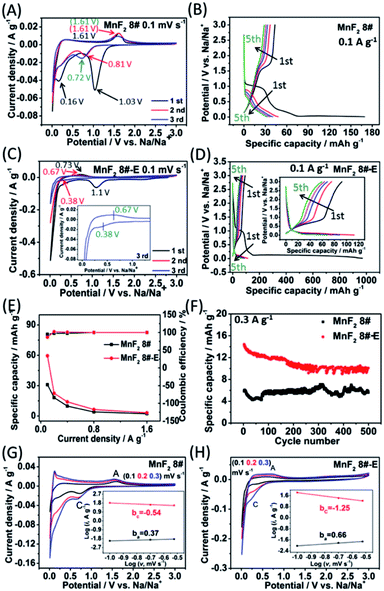
Due to the remarkable Li-ion storage capability of MnF2 8# and MnF2 8#-E, they were further investigated for Na-ion storage. In the CV plots of the MnF2 8# electrode at 0.1 mV s−1 (Fig. 6A), there was a big reduction peak at around 1.03 V and a small reduction peak at about 0.16 V, corresponding to the conversion of MnF2 into Mn/NaF and formation of SEI films in the first discharge, respectively. Moreover, the Na-ion storage capacity in the low potential region also originated from a reversible interfacial Na-ion intercalation reaction within the Mn/NaF matrix as Li-ion intercalation.31–35 Also, the minor anodic peak at about 1.61 V can be ascribed to the partial conversion of Mn/NaF into MnF2. In the second and third laps, the reduction peaks changed lightly from 0.81 V to 0.72 V, and the oxidation peaks were basically maintained at 1.61 V, indicating good reversibility. Fig. 6C shows the CV plots of the MnF2 8#-E electrode at a sweep speed of 0.1 mV s−1. A large cathode peak can be observed at about 1.1 V and small peak at around 0.4 V in the first round of negative sweep, which can be attributed to the conversion of Mn–O–F into Mn/NaF/Na2O and the formation of SEI films, respectively. Also, the minor anodic peak at 0.73 V during the first positive sweep can be ascribed to the partial conversion of Mn/NaF/Na2O into MnF2/MnO. During the next two turns, the cathode peaks were basically maintained at 0.38 V, while the anode peaks shifted lightly from 0.73 V to 0.67 V, indicating good reversibility. Fig. 6B and D show the GCD curves for the MnF2 8# and MnF2 8#-E electrodes in the first five laps of 0.1 A g−1, where the charge/discharge characteristics with the potential platforms coincide with the anodic/cathodic processes with redox peaks in their CV plots. Notably, the potential platforms of the MnF2 8#-E electrode are obviously lower than that of the MnF2 8# electrode for Na-ion storage, implying the superiority of the charge storage of the Mn–O–F anode. Fig. 6E and F show the gradient specific capacity and cycle behavior for the MnF2 8# and MnF2 8#-E electrodes, where MnF2 8# provides 31–2 mA h g−1 at 0.1–3.2 A g−1 with 5.4 mA h g−1 after 500 cycles at 0.3 A g−1 in comparison with the performance of 59–4 mA h g−1 at 0.1–3.2 A g−1 with 11 mA h g−1 after 500 cycles at 0.3 A g−1 for MnF2 8#-E (more details are shown in Fig. S29 and S30; Table S4†), which again shows that the double-defective Mn–O–F ultrafine nanowires anodes exhibit a big advantage in Na-ion storage. The XRD patterns of the electrodes after cycling (Fig. S31A and B†) show the slightly smaller diffraction peaks of the MnF2 phase, and the TEM images of the electrodes after cycling (Fig. S31C–F†) show the presence of a few of ultrafine nanoparticles in the pristine nanocrystals or nanowires, suggesting the formation of partially amorphous nanostructural products for Na-ion storage after the long-term conversions. Fig. 6G and H show the CV plots at different sweep speeds and the relationship between peak current density and sweep rate (lg![[thin space (1/6-em)]](https://www.rsc.org/images/entities/char_2009.gif) i = b
i = b![[thin space (1/6-em)]](https://www.rsc.org/images/entities/char_2009.gif) lg
lg![[thin space (1/6-em)]](https://www.rsc.org/images/entities/char_2009.gif) v + a) for the MnF2 8# and MnF2 8#-E electrodes, respectively. The ba and bc values for the MnF2 8# electrode are 0.37 and −0.54, respectively, suggesting the typical diffusion-controlled kinetics, and the ba and bc values for the MnF2 8#-E electrode are 0.66 and −1.25, respectively, implying the dominant surface-controlled kinetics. Herein, the kinetic behavior of the MnF2 8# and MnF2 8#-E electrodes showed obvious differences between Li-ion storage (surface control/diffusion control) and Na-ion storage (diffusion control/surface control), which may be due to the difference in the radius of the Na and Li ions and the surface morphology and structure of the MnF2 8# and MnF2 8#-E materials. Moreover, the pseudocapacitive contribution (k1v)36,37 at 0.1–0.3 mV s−1 was estimated to be 72–82% and 15–24% for the MnF2 8# and MnF2 8#-E electrodes (Fig. S32 and S33, ESI†), respectively. The electrochemical kinetics of the MnF2 8# and Mn–O–F electrodes for Na-ion storage were further analyzed via EIS tests (Fig. S34 and Table S9, ESI†), which show that the Mn–O–F electrode possessed a smaller Rct (106.7 Ω) than the MnF2 electrode (144.8 Ω), suggesting the faster electrochemical kinetics of the Mn–O–F electrode owing to its superior morphology and porosity.
v + a) for the MnF2 8# and MnF2 8#-E electrodes, respectively. The ba and bc values for the MnF2 8# electrode are 0.37 and −0.54, respectively, suggesting the typical diffusion-controlled kinetics, and the ba and bc values for the MnF2 8#-E electrode are 0.66 and −1.25, respectively, implying the dominant surface-controlled kinetics. Herein, the kinetic behavior of the MnF2 8# and MnF2 8#-E electrodes showed obvious differences between Li-ion storage (surface control/diffusion control) and Na-ion storage (diffusion control/surface control), which may be due to the difference in the radius of the Na and Li ions and the surface morphology and structure of the MnF2 8# and MnF2 8#-E materials. Moreover, the pseudocapacitive contribution (k1v)36,37 at 0.1–0.3 mV s−1 was estimated to be 72–82% and 15–24% for the MnF2 8# and MnF2 8#-E electrodes (Fig. S32 and S33, ESI†), respectively. The electrochemical kinetics of the MnF2 8# and Mn–O–F electrodes for Na-ion storage were further analyzed via EIS tests (Fig. S34 and Table S9, ESI†), which show that the Mn–O–F electrode possessed a smaller Rct (106.7 Ω) than the MnF2 electrode (144.8 Ω), suggesting the faster electrochemical kinetics of the Mn–O–F electrode owing to its superior morphology and porosity.
The MnF2//AC and MnF2-E//AC NICs were also assembled with MnF2 8# and MnF2 8#-E as anodes and commercial AC as the cathode along with the anodes pre-charged (pre-sodiation) at 0.1 A g−1 for 3.5 turns (Fig. S35†). Initially, different active mass ratios of the cathode/anode were examined. The performance comparison for the different mass ratios in Fig. S37† indicate that the MnF2//AC (1![[thin space (1/6-em)]](https://www.rsc.org/images/entities/char_2009.gif) :
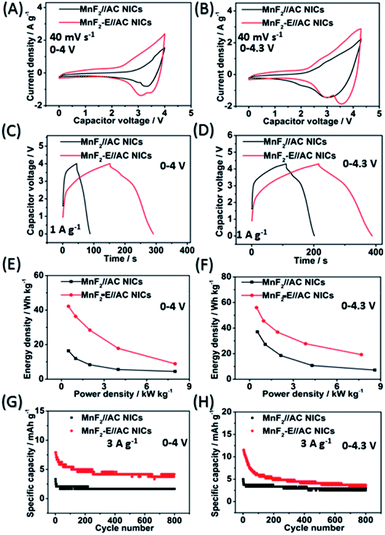
:![[thin space (1/6-em)]](https://www.rsc.org/images/entities/char_2009.gif) 1) NICs exhibited overall superior behavior (the performance of the AC cathode is shown in Fig. S36,† and the voltage windows, GCD curves and CV plots of the MnF2//AC NICs with different mass ratios are shown in Fig. S38 and S39†). The different potential windows were further examined under the optimal mass ratios of the NICs. Fig. 7A–H show the CV plots at 40 mV s−1, GCD curves at 1 A g−1, Ragone plots, and cycling behavior at 3 A g−1 for 800 cycles of the NICs under the voltages of 0–4 V and 0–4.3 V. The MnF2 8#-E//AC capacitor exhibited a larger CV area and longer charge and discharge times, indicating its better performance (the CV plots at different sweep speeds and GCD curves under different current densities are shown in Fig. S40 and S41,† respectively). The MnF2 8#-E//AC NICs exhibited a remarkable performance of 42.1–8.9 W h kg−1/0.5–8.0 kW kg−1, and 63.1% retention/200 cycles/3 A g−1 under 0–4 V and 55.9–19.2 W h kg−1/0.48–7.7 kW kg−1, and 45.3% retention/200 cycles/3 A g−1 under 0–4.3 V in comparison with that of the MnF 8#//AC NICs (16.4–4.4 W h kg−1/0.5–8.0 kW kg−1, 50.2% retention/200 cycles/3 A g−1/0–4 V and 37–7.2 W h kg−1/0.54–8.6 kW kg−1, 66.7% retention/200 cycles/3 A g−1/0–4.3 V, respectively). Furthermore, the MnF2-E//AC NICs and MnF2//AC NICs exhibited comparable or even better overall performances than that of many state-of-the-art NICs systems reported in the literature (Table S10†), showing their promising application in Na-ion storage.
1) NICs exhibited overall superior behavior (the performance of the AC cathode is shown in Fig. S36,† and the voltage windows, GCD curves and CV plots of the MnF2//AC NICs with different mass ratios are shown in Fig. S38 and S39†). The different potential windows were further examined under the optimal mass ratios of the NICs. Fig. 7A–H show the CV plots at 40 mV s−1, GCD curves at 1 A g−1, Ragone plots, and cycling behavior at 3 A g−1 for 800 cycles of the NICs under the voltages of 0–4 V and 0–4.3 V. The MnF2 8#-E//AC capacitor exhibited a larger CV area and longer charge and discharge times, indicating its better performance (the CV plots at different sweep speeds and GCD curves under different current densities are shown in Fig. S40 and S41,† respectively). The MnF2 8#-E//AC NICs exhibited a remarkable performance of 42.1–8.9 W h kg−1/0.5–8.0 kW kg−1, and 63.1% retention/200 cycles/3 A g−1 under 0–4 V and 55.9–19.2 W h kg−1/0.48–7.7 kW kg−1, and 45.3% retention/200 cycles/3 A g−1 under 0–4.3 V in comparison with that of the MnF 8#//AC NICs (16.4–4.4 W h kg−1/0.5–8.0 kW kg−1, 50.2% retention/200 cycles/3 A g−1/0–4 V and 37–7.2 W h kg−1/0.54–8.6 kW kg−1, 66.7% retention/200 cycles/3 A g−1/0–4.3 V, respectively). Furthermore, the MnF2-E//AC NICs and MnF2//AC NICs exhibited comparable or even better overall performances than that of many state-of-the-art NICs systems reported in the literature (Table S10†), showing their promising application in Na-ion storage.
Reaction mechanisms for Li/Na-ion storage
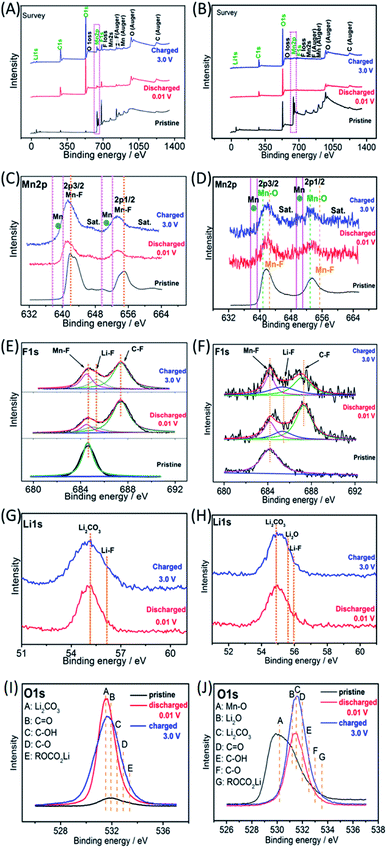
Ex situ X-ray photoelectron spectroscopy (XPS) was employed to investigate the possible reaction mechanisms of the MnF2 and MnF2-E electrodes for both Li-ion and Na-ion storage. Fig. 8 shows the XPS data of the pristine, fully charged (3.0 V) and fully discharged (0.01 V) states of the MnF2 8# and MnF2 8#-E anodes for the Li-ion storage. The survey scans in Fig. 8A and B, demonstrate the typical F 1s/Mn 2p/O 1s/C 1s in all three states. The much stronger C 1s/O 1s signals of MnF2 8# in the fully charged/discharged states than the pristine states is largely owing to the formation of SEI films with rich C/O-containing groups.32,38,39 For MnF2 8#-E, the much stronger C 1s signal in the fully charged/discharged states is also owing to the formation of SEI films, while the strong O 1s signals in the fully charged/discharged states originate from both the SEI films and the pristine Mn–O bond. The Mn 2p spectra of MnF2 8# and MnF2 8#-E in Fig. 8C and D present the Mn 2p3/2 and Mn 2p1/2 peaks and corresponding shakeup satellite peaks (Sat.). Notably, the peak positions of Mn 2p showed some negative shifts for the fully discharged and charged states in comparison with that of the pristine states, indicating the partial conversion MnF2 and Mn–O–F into Mn metal phases during the discharging/charging processes.14,31 Moreover, both the Mn–O and Mn–F bonds could be resolved for MnF2 8#-E in comparison with the sole Mn–F bond for MnF2 8#. The F 1s spectra in Fig. 8E and F reveal the Mn–F, Li–F and C–F (from polyvinylidene fluoride (PVDF) binder) bonds for the fully discharged/charged states in comparison with the Mn–F bonds in the pristine states. The Li 1s signals in Fig. 8G of the fully discharged and charged states originate from LiF and Li2CO3 (from SEI films) during the discharging/charging processes.32,38,39 Notably, additional Li2O signals (except LiF and Li2CO3) are present in the Li 1s spectra of MnF2 8#-E in Fig. 8H, which originated from one of the reaction products of Mn–O–F and Li-ion. Fig. 8I shows the O 1s spectra of MnF2 8#, which show a weak peak in the original state due to the presence of adsorbed oxygen (mainly H2O, which can be also detected from the large –OH absorption peak appearing at 3220 cm−1 in the IR spectra of Fig. 1B). The O 1s became sharp under the fully charged/discharged states, which is attributed to the formation of SEI films (mainly including Li2CO3, C![[double bond, length as m-dash]](https://www.rsc.org/images/entities/char_e001.gif) O, C–OH, C–O and ROCO2Li).32,39Fig. 8J show the O 1s spectra of MnF2 8#-E, which exhibit a sharp Mn–O bond in its original state, the signals of Li2CO3, C
O, C–OH, C–O and ROCO2Li).32,39Fig. 8J show the O 1s spectra of MnF2 8#-E, which exhibit a sharp Mn–O bond in its original state, the signals of Li2CO3, C![[double bond, length as m-dash]](https://www.rsc.org/images/entities/char_e001.gif) O, C–OH, C–O and ROCO2Li in the fully charged/discharged states, suggesting the formation of SEI films, and the additional Li2O in the fully charged/discharged states, indicating the reaction between Mn–O–F and Li-ion.
O, C–OH, C–O and ROCO2Li in the fully charged/discharged states, suggesting the formation of SEI films, and the additional Li2O in the fully charged/discharged states, indicating the reaction between Mn–O–F and Li-ion.
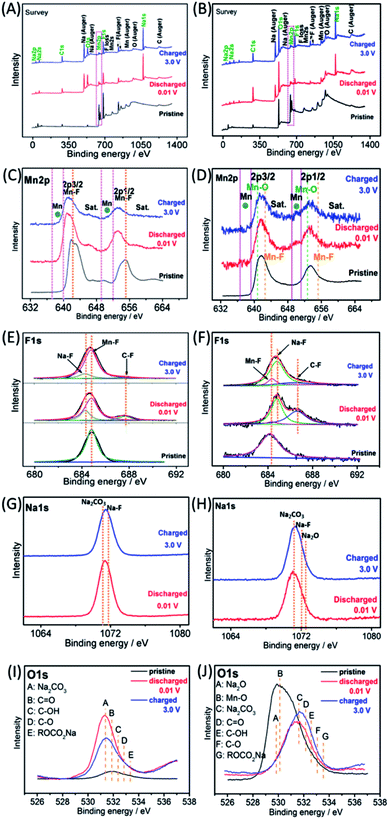
The Na-ion storage mechanisms of MnF2 and MnF2-E were further investigated by ex situ XPS measurements of the pristine, fully discharged/charged states in the first cycle. As shown in Fig. 9A and B, the survey scans display the presence of Mn, F, O, Na, C and O species, indicating the reactions between MnF2 or Mn–O–F electrodes and Na-ion and the formation of SEI films. The Mn 2p spectra of MnF2 8# in Fig. 9C show the negative shift in the fully charged/discharged states and the presence of Mn, indicating a typical conversion reaction between the MnF2 and Na-ion. The Mn 2p spectra of MnF2 8#-E in Fig. 9D demonstrate the presence of Mn, Mn–F and Mn–O bonds, revealing the typical characteristics of the conversion reaction between the Mn–O–F and Na-ion. Fig. 9E and F show the F 1s spectra of MnF2 8# and MnF2 8#-E, respectively, where the typical Na–F, Mn–F and C–F (from PVDF) can be resolved, which again prove that MnF2 8# and MnF2 8#-E exhibit typical conversion reactions. The Na 1s spectra of MnF2 8# in Fig. 9G indicate the presence of NaF (mainly produced by the conversion reaction) and Na2CO3 (from the SEI films). Fig. 9H shows the Na 1s spectra of MnF2 8#-E, where the Na2CO3 bonds indicate the formation of SEI films, and NaF and Na2O were formed by the feature reactions of Mn–O–F with Na-ion. Fig. 9I shows the O 1s spectra of MnF2, where the Na2CO3, C![[double bond, length as m-dash]](https://www.rsc.org/images/entities/char_e001.gif) O, C–OH, C–O and ROCO2Na bonds in both the fully discharged/charged states are due to the formation of SEI films.32,39 Na2O is also detected in the O 1s spectra of fully discharged/charged MnF2 8#-E (Fig. 9J), which is derived from the feature reaction of Mn–O–F with Na-ion.
O, C–OH, C–O and ROCO2Na bonds in both the fully discharged/charged states are due to the formation of SEI films.32,39 Na2O is also detected in the O 1s spectra of fully discharged/charged MnF2 8#-E (Fig. 9J), which is derived from the feature reaction of Mn–O–F with Na-ion.
Based on the above considerations, the possible reaction mechanisms of the MnF2 and Mn–O–F anodes for both Li-ion and Na-ion storage can be expressed as eqn (1)–(6). For MnF2, the mechanisms refer to eqn (1), (4) and (5) and for Mn–O–F, the mechanisms refer to eqn (2)–(6). A schematic of the possible processes for the first two discharging/charging cycles is illustrated in Scheme 1.
| xMnF2 + 2xN+ + 2xe− ↔ xMn + 2xNF | (1) |
| xMnO0.934F0.132 + 2xN+ + 2xe− → xMn + 0.934·xN2O + 0.132·xNF | (2) |
| 2xMn + xN2O + 2xNF ↔ xMnF2 + xMnO + 4xN+ + 4xe− | (3) |
| N+ +e− + electrolytes ↔ SEI films | (4) |
| yN+ + ye− + xMn/2xNF ↔ xMn/yN/2xNF | (5) |
| yN+ + ye− + xMn/xN2O ↔ xMn/yN/xN2O | (6) |
Conclusions
In summary, double-defective Mn–O–F ultrafine nanowires with hetero oxygen-doping and intrinsic fluorine-vacancies were introduced as advanced anodes for high-efficiency LICs and NICs. Owing to the unique doping-vacancy double defects, the Mn–O–F anode exhibited a superior performance than the pristine MnF2 anode, contributing to the superior performance of the Mn–O–F//AC LICs/NICs than the corresponding MnF2//AC LICs/NICs. The ex situ characterizations and electrochemical methods revealed that the Mn–O–F anode demonstrates typical conversion reaction mechanisms with dominant diffusion-controlled and surface-controlled kinetics for Li/Na-ion storage, respectively. Overall, this work provides new insight into heteroatom-doping and anion vacancy double-defective Mn–O–F ultrafine nanowires anode to improve the Li/Na-ion storage and will have a significant impact on the development of advanced electrochemical energy storage devices.Conflicts of interest
There are no conflicts to declare.Acknowledgements
Thanks for the financial support from National Natural Science Foundation of China (21506182), Natural Science Foundation of Hunan Province (2018JJ2382), Education Department of Hunan Province (18B077) and Hunan 2011 Collaborative Innovation Center of Chemical Engineering & Technology with Environmental Benignity and Effective Resource Utilization.Notes and references
- J. M. Tarascon and M. Armand, Nature, 2001, 414, 359–367 CrossRef CAS PubMed.
- Z. G. Yang, J. L. Zhang, M. W. KintnerMeyer, X. C. Lu, D. Choi, J. Lemmon and J. Liu, Chem. Rev., 2011, 111, 3577–3613 CrossRef CAS PubMed.
- J. Miller and P. Simon, Science, 2008, 321, 651–652 CrossRef CAS PubMed.
- B. Li, J. S. Zheng, H. Y. Zhang, L. M. Jin, D. J. Yang, H. Lv, C. Shen, A. Shellikeri, Y. R. Zheng, R. Q. Gong, J. Zheng and C. M. Zhang, Adv. Mater., 2018, 30, 1705670 CrossRef PubMed.
- H. W. Wang, C. R. Zhu, D. L. Chao, Q. Y. Yan and H. J. Fan, Adv. Mater., 2017, 29, 1702093 CrossRef PubMed.
- J. Ding, W. B. Hu, E. Paek and D. Mitlin, Chem. Rev., 2018, 118, 6457–6498 CrossRef CAS PubMed.
- F. Li and Z. Zhou, Small, 2018, 14, 1702961 CrossRef PubMed.
- S. Natarajan, Y.-S. Lee and V. Aravindan, Chem.–Asian J., 2019, 14, 936–951 CrossRef CAS PubMed.
- P. Sennu, N. Arun, S. Madhavi, V. Aravindan and Y.-S. Lee, J. Power Sources, 2019, 414, 96–102 CrossRef CAS.
- P. Pazhamalai, K. Krishnamoorthy, S. Sahoo and S.-J. Kim, J. Alloys Compd., 2018, 765, 1041–1048 CrossRef CAS.
- G. G. Amatucci, F. Badway, A. D. Pasquier and T. Zheng, J. Electrochem. Soc., 2001, 148, A930–A939 CrossRef CAS.
- S. Dsoke, B. Fuchs, E. Gucciardi and M. Wohlfahrt-Mehrens, J. Power Sources, 2015, 282, 385–393 CrossRef CAS.
- P. Y. Wang, R. T. Wang, J. W. Lang, X. Zhang, Z. K. Chen and X. B. Yan, J. Mater. Chem. A, 2016, 4, 9760–9766 RSC.
- C. F. Liu, C. K. Zhang, H. Q. Song, C. P. Zhang, Y. G. Liu, X. H. Nan and G. Z. Cao, Nano Energy, 2016, 22, 290–300 CrossRef CAS.
- D. P. Dubal, K. Jayaramulu, R. Zboril, R. A. Fischer and P. G. Romero, J. Mater. Chem. A, 2018, 6, 6096–6106 RSC.
- R. Ding, Q. Li and H. Y. Wang, Electrochim. Acta, 2013, 114, 726–735 CrossRef CAS.
- N. Yabuuchi, K. Kubota, M. Dahbi and S. Komaba, Chem. Rev., 2014, 114, 11636–11682 CrossRef CAS PubMed.
- E. Lim, C. Jo, M. S. Kim, M. H. Kim, J. Y. Chun, H. Kim, J. Park, K. C. Roh, K. Kang, S. Yoon and J. Lee, Adv. Funct. Mater., 2016, 26, 3711 CrossRef CAS.
- H. X. Li, J. W. Lang, S. L. Lei, J. T. Chen, K. J. Wang, L. Y. Liu, T. Y. Zhang, W. S. Liu and X. B. Yan, Adv. Funct. Mater., 2018, 28, 1800757 CrossRef.
- M. L. Kang, Y. Y. Wu, X. Huang, K. Q. Zhou, Z. G. Huang and Z. S. Hong, J. Mater. Chem. A, 2018, 6, 22840–22850 RSC.
- B. J. Yang, J. T. Chen, S. L. Lei, R. S. Guo, H. X. Li, S. Q. Shi and X. B. Yan, Adv. Energy Mater., 2018, 8, 1702409 CrossRef.
- H. L. Wang, D. Mitlin, J. Ding, Z. Li and K. Cui, J. Mater. Chem. A, 2016, 4, 5149–5158 RSC.
- Y. L. Huang, Y. X. Zeng, M. H. Yu, P. Liu, Y. X. Tong, F. L. Cheng and X. H. Lu, Small Methods, 2018, 2, 1700230 CrossRef.
- D. F. Yan, Y. X. Li, J. Huo, R. Chen, L. M. Dai and S. Y. Wang, Adv. Mater., 2017, 29, 1606459 CrossRef PubMed.
- S. B. Yang, L. J. Zhi, K. Tang, X. L. Feng, J. Maier and K. Müllen, Adv. Funct. Mater., 2012, 22, 3634–3640 CrossRef CAS.
- Z. F. Li, C. Bommier, Z. S. Chong, Z. L. Jian, T. W. Surta, X. F. Wang, Z. Y. Xing, J. C. Neuefeind, W. F. Stickle, M. Dolgos, P. A. Greaney and X. L. Ji, Adv. Energy Mater., 2017, 7, 1602894 CrossRef.
- T. Zhai, X. Lu, Y. Ling, M. Yu, G. Wang, T. Liu, C. Liang, Y. Tong and Y. Li, Adv. Mater., 2014, 26, 5869 CrossRef CAS PubMed.
- Y. C. Wang, T. Zhou, K. Jiang, P. M. Da, Z. Peng, J. Tang, B. Kong, W. B. Cai, Z. Q. Yang and G. F. Zheng, Adv. Energy Mater., 2014, 4, 1400696 CrossRef.
- Y. W. Liu, H. Cheng, M. J. Lyu, S. J. Fan, Q. H. Liu, W. S. Zhang, Y. D. Zhi, C. M. Wang, C. Xiao, S. Q. Wei, B. J. Ye and Y. Xie, J. Am. Chem. Soc., 2014, 136, 15670–15675 CrossRef CAS PubMed.
- L. Qie, W. M. Chen, Z. H. Wang, Q. G. Shao, X. Li, L. X. Yuan, X. L. Hu, W. X. Zhang and Y. H. Huang, Adv. Mater., 2012, 24, 2047 CrossRef PubMed.
- K. Rui, Z. Y. Wen, Y. Lu, J. Jin and C. Shen, Adv. Energy Mater., 2015, 5, 1401716 CrossRef.
- D. F. Ying, R. Ding, Y. F. Huang, W. Shi, Q. L. Xu, C. N. Tan, X. J. Sun, P. Gao and E. H. Liu, J. Mater. Chem. A, 2019, 7, 18257–18266 RSC.
- P. Balaya, H. Li, L. Kienle and J. Maier, Adv. Funct. Mater., 2003, 13, 621–625 CrossRef CAS.
- H. Li, G. Richter and J. Maier, Adv. Mater., 2003, 15, 736–739 CrossRef CAS.
- S. Grugeon, S. Laruelle, R. Herrera-Urbina, L. Dupont, P. Poizot and J.-M. Tarascon, J. Electrochem. Soc., 2001, 148, A285–A292 CrossRef CAS.
- J. Wang, J. Polleux, J. Lim and B. Dunn, J. Phys. Chem. C, 2007, 111, 14925–14931 CrossRef CAS.
- V. K. Mariappan, K. Krishnamoorthy, P. Pazhamalai, S. Sahoo, S. S. Nardekar and S.-J. Kim, Nano Energy, 2019, 57, 307–316 CrossRef CAS.
- Q. L. Xu, R. Ding, W. Shi, D. F. Ying, Y. F. Huang, T. Yan, P. Gao, X. J. Sun and E. H. Liu, J. Mater. Chem. A, 2019, 7, 8315–8326 RSC.
- W. Shi, R. Ding, Q. L. Xu, T. Yan, Y. X. Huang, C. N. Tan, X. J. Sun, P. Gao and E. H. Liu, Chem. Commun., 2019, 55, 6739–6742 RSC.
Footnote |
| † Electronic supplementary information (ESI) available. See DOI: 10.1039/c9na00521h |
| This journal is © The Royal Society of Chemistry 2019 |

