 Open Access Article
 This Open Access Article is licensed under a
 Creative Commons Attribution 3.0 Unported Licence
Functionalised microscale nanoband edge electrode (MNEE) arrays: the systematic quantitative study of hydrogels grown on nanoelectrode biosensor arrays for enhanced sensing in biological media†
Andrew
Piper
 a,
Ben M.
Alston
bc,
Dave J.
Adams‡
b and
Andrew R.
Mount
*a
a,
Ben M.
Alston
bc,
Dave J.
Adams‡
b and
Andrew R.
Mount
*a
aEaSTCHEM, School of Chemistry, The University of Edinburgh, Joseph Black Building, King’s Building’s, David Brewster Road, Edinburgh, EH9 3FJ, UK. E-mail: a.mount@ed.ac.uk
bDepartment of Chemistry, University of Liverpool, Crown Street, Liverpool, L69 7ZD, UK
cThe Leverhulme Research Centre for Functional Materials Design, University of Liverpool, UK
First published on 12th April 2018
Abstract
Nanoelectrodes and nanoelectrode arrays show enhanced diffusion and greater faradaic current densities and signal-to-noise ratios compared to macro and microelectrodes, which can lead to enhanced sensing and detection. One example is the microsquare nanoband edge electrode (MNEE) array system, readily formed through microfabrication and whose quantitative response has been established electroanalytically. Hydrogels have been shown to have applications in drug delivery, tissue engineering, and anti-biofouling; some also have the ability to be grown electrochemically. Here, we combine these two emerging technologies to demonstrate the principles of a hydrogel-coated nanoelectrode array biosensor that is resistant to biofouling. We first electrochemically grow and analyze hydrogels on MNEE arrays. The structure of these gels is shown by imaging to be electrochemically controllable, reproducible and structurally hierarchical. This structure is determined by the MNEE array diffusion fields, consistent with the established hydrogel formation reaction, and varies in structural scale from nano (early time, near electrode growth) to micro (for isolated elements in the array) to macro (when there is array overlap) with distance from the electrode, forming a hydrogel mesh of increasing density on progression from solution to electrode. There is also increased hydrogel structural density observed at electrode corners, attributable to enhanced diffusion. The resulting hydrogel structure can be formed on (and is firmly anchored to/through) an established clinically relevant biosensing layer without compromising detection. It is also shown to be capable, through proof-of-principle model protein studies using bovine serum albumin (BSA), of preventing protein biofouling whilst enabling smaller molecules such as DNA to pass through the hydrogel matrix and be sensed. Together, this demonstrates a method for developing reproducible, quantitative electrochemical nanoelectrode biosensors able to sense selectively in real-world sample matrices through the tuning of their interfacial properties.
Introduction
Nanoelectrodes and hydrogels are each of growing interest in the field of biosensors.1–5 Hydrogels can be used to encapsulate and support biomolecules on a macroelectrode surface, thereby increasing the shelf life of these biosensor systems whilst not impeding their biomolecular function.4–9 It has also been shown that hydrogels are permeable to small molecules10 and can be used to prevent electrode fouling in complex media such as human blood.11 Nanoelectrodes have been shown to possess enhanced mass transport which, coupled with a relatively small double layer charging current, yields a relatively large detection sensitivity and signal to noise ratio.12,13The use of nanoelectrode arrays containing multiple electrodes also allows the exploitation of the enhanced sensitivity of nanoelectrodes whilst measuring macroelectrode currents.14 We have detailed the reproducible fabrication through photolithographic processing of Microsquare Nanoband Edge Electrode (MNEE) arrays and shown through a combination of experiment and theory that steady-state and quantitative responses can readily and reproducibly be obtained, from which electroanalytical parameters can readily be extracted.12,13,15 MNEE arrays are fabricated by the controlled geometrical etching of an array of square micron dimension cavities of controlled depth through a layer of Pt (of a defined nanometre thickness) sandwiched between two insulators of controlled thickness. This results in an array of micron scale cavities of defined separation, each of which contains a Pt nanoband running around the inside of the cavity at a controlled depth, defined by the etch depth and the thickness of the insulators. These electrode arrays are highly sensitive, and also highly reactive (consistent with the Pt nanoelectrode dimension). This is likely to result in enhanced biofouling in biosensing applications.
In this paper, the potential for combining these technologies through the functionalization of these nanoelectrode systems with hydrogels is therefore investigated, with a view to fabricating electrochemical biosensors which display both enhanced nanoelectrode array performance and the enhanced longevity and resistance to biofouling produced by hydrogels. To enable localized functionalization of the nanoelectrodes with hydrogels under spatial control, we have used the electrochemically controlled growth of low molecular weight hydrogels on electrodes.16 We first establish the principle of electrochemical growth of hydrogels on MNEE arrays, then characterize the resulting hydrogel structures and finally determine the potential enhancement in biosensing characteristics of the combined system.
Experimental
MNEE fabrication
The MNEE array design, fabrication procedures and geometries are detailed elsewhere12,13 and shown below (Fig. 1).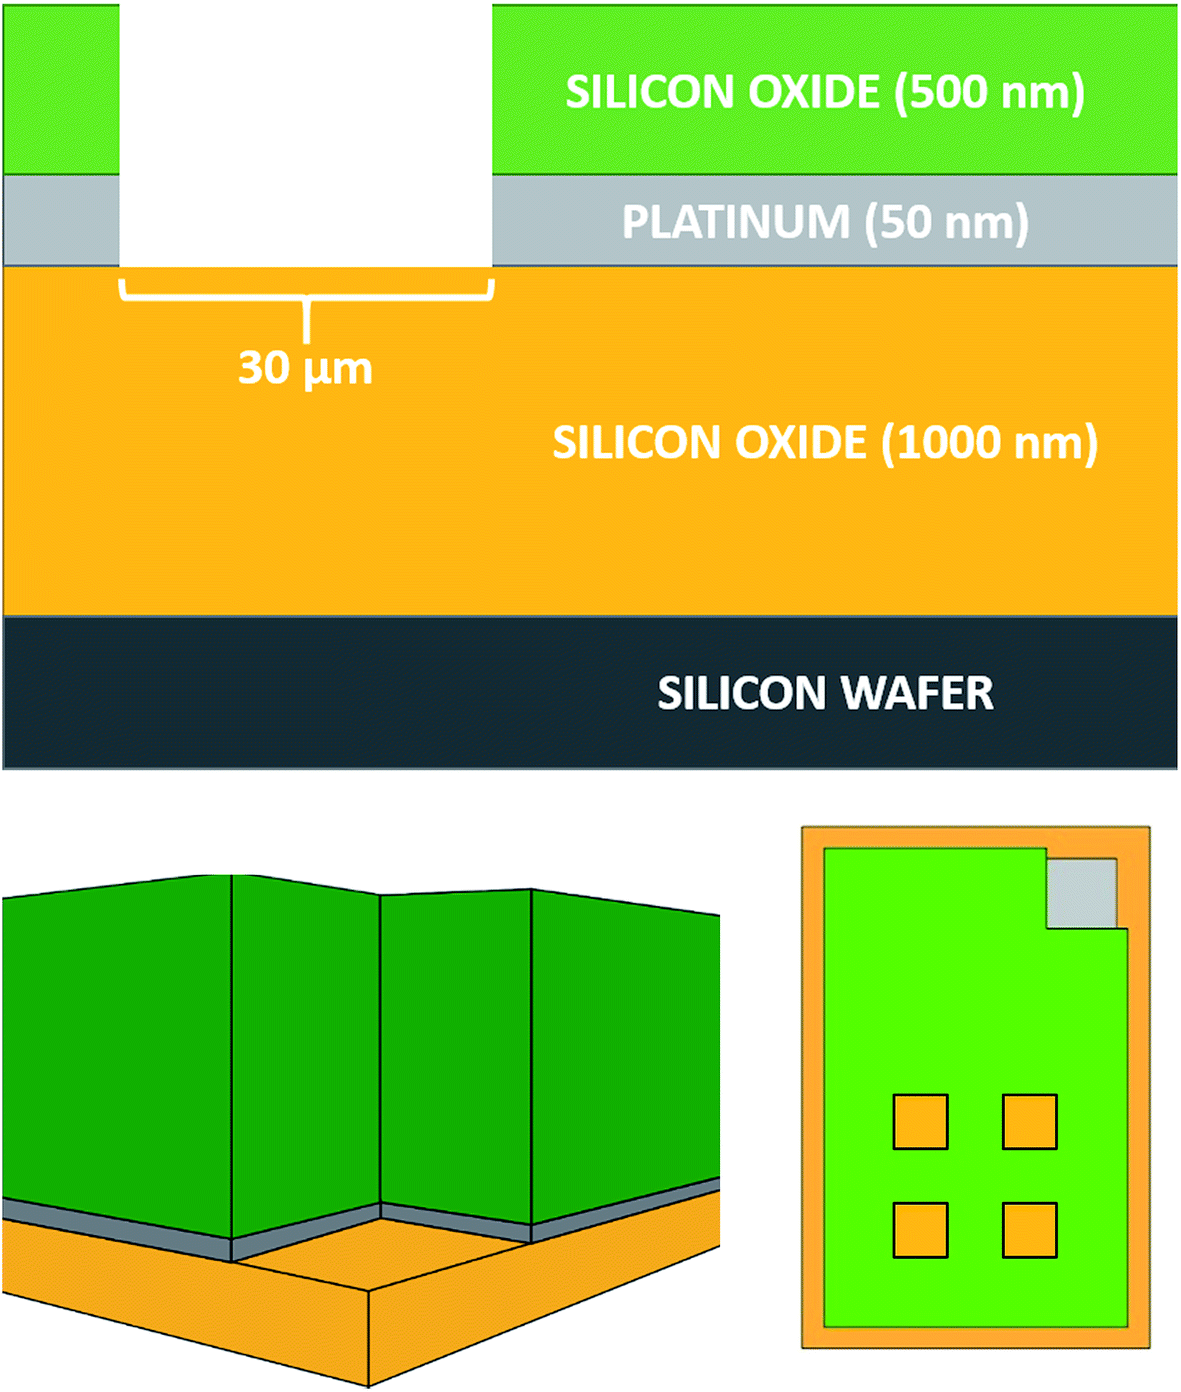 | ||
| Fig. 1 Schematic diagrams (not to scale) of an MNEE array, displaying a schematic cross section of the device architecture (top), a cross section through one of the square cavities showing an MNEE (bottom left) and a schematic top view (bottom right, not to scale) showing the arrangement of 4 of the 1764 cavities and the bond pad connection in the top right hand corner. | ||
All experiments were performed on these MNEE arrays, which consist of 1764 square cavities of 30 μm edge length placed in a square arrangement, with each cavity separated by 90 μm from its neighbors. The cavities were etched to a depth of 560 nm, exposing a nanoband electrode of 50 nm thickness around the perimeter located at the base of each cavity. The total geometrical electrode surface area of the array is therefore 1.0584 × 10⁻⁴ cm2.
Electrochemical experiments
All electrochemical measurements were made at a constant temperature of 25 °C, controlled by a water bath built in-house. They were performed in a Faraday cage using an Autolab PGSTAT128N with a FRA32 module (supplied by Metrohm Ltd.) controlled by a PC using NOVA 1.10 software. All potentials are reported with respect to the saturated calomel reference electrode (SCE, Accumet® 13-620-61, Fischer Scientific) unless otherwise stated, and the gauze counter electrode was made in-house using Pt gauze and wire (Sigma-Aldrich). All solutions were prepared using deionized water (18.2 MΩ cm−1, Millipore MilliQ) with sodium chloride (BioXtra ≥99.5%), potassium ferricyanide (ACS reagent ≥99%), potassium ferrocyanide (ACS reagent ≥99%) and hydroquinone (reagentplus® ≥99.5%) all supplied by Sigma Aldrich. All pH measurements were performed using a Fisherbrand Hydrus 400 pH meter with a Mettler Toledo InLab®Routine Pro pH probe. Electrochemical impedance spectroscopy (EIS) measurements were carried out in an aqueous solution of potassium ferrocyanide (1 mM, Sigma Aldrich) and potassium ferricyanide (1 mM, Sigma Aldrich) in KCl (0.1 M, Sigma Aldrich) background electrolyte. EIS was performed by applying a sinusoidal potential of 10 mV rms superimposed on the open circuit potential (OCP), to ensure no overall faradaic reaction. 50 logarithmically spaced frequencies were applied in the range between 100 kHz and 0.1 Hz. The OCP was measured before each EIS measurement and, as expected for the ferricyanide/ferrocyanide couple was typically between +165 and +170 mV with respect to SCE.Carbazole–alanine synthesis and hydrogel formation
The carbazole–alanine hydrogel was prepared as described previously.16 A solution of the gelator was prepared by stirring carbazole–alanine (2 mg mL−1) in aqueous sodium hydroxide (6.75 mM) at room temperature overnight until it had fully dissolved. Aqueous HCl (1 M) and NaOH (6.75 mM) solutions were used as appropriate to adjust the pH to 8. Hydroquinone (2.88 mg mL−1, Sigma Aldrich) and NaCl (0.1 M, Sigma Aldrich) were added as the pH swing inducer and the background electrolyte respectively. Gelation was induced using chronopotentiometry, holding the MNEE array working electrode at +100 μA unless otherwise stated in a three-electrode system using a Pt wire as a pseudo-reference electrode.Imaging (SEM and confocal microscopy with Nile blue stain)
SEM images were obtained using a Hitachi S-4800 FE-SEM at 3 keV. Hydrogels were electrochemically grown on to the MNEE and fixed onto aluminium SEM stubs with carbon tabs and air dried for direct imaging. The MNEE arrays were gold coated for 1.5 minutes at 20 mA using a EMITECH K550X sputter coater prior to imaging.Confocal microscopy images were obtained on a Zeiss LSM510 and a Plan-Apo 100× (1.4 NA oil) and 63× (1.46 NA oil) objective. The gelator solution was prepared as described previously, with the addition of 0.001 M Nile blue. Nile blue was excited at 633 nm using a helium neon laser and its emission was detected between 638 and 758 nm using a pinhole diameter of 1 Airy unit (approx. 0.8 μm resolution). The working electrode was placed in an uncoated borosilicate MatTek dish with a 20 mm diameter glass coverslip. Images were analyzed using the Zeiss AIM software (Zeiss, Jena, Germany) and ImageJ software.
PNA SAM formation, DNA target binding and biofouling studies
PNA SAM formation was carried out using 1.5 nM PNA (Panagene, Daejeon, South Korea), 150 nM tris-2-carboxymethylphosphine (TCEP, Sigma-Aldrich) and 30 nM 6-mercaptohexan-1-ol (MCH, Sigma-Aldrich) in a 50![[thin space (1/6-em)]](https://www.rsc.org/images/entities/char_2009.gif) :50 mixture by volume of DMSO and deionized water. 50 μL of this mixture was placed on the MNEE array for 1 hour to form the PNA SAM on the electrode surfaces, followed by growth of the carbazole–alanine hydrogel galvanostatically in gelator solution at +100 μA for 10 s. The functionalized MNEE array was then exposed to a 50 μL droplet of 100 μM aqueous solution of 30-mer complementary target DNA (Sigma-Aldrich) sequence:
:50 mixture by volume of DMSO and deionized water. 50 μL of this mixture was placed on the MNEE array for 1 hour to form the PNA SAM on the electrode surfaces, followed by growth of the carbazole–alanine hydrogel galvanostatically in gelator solution at +100 μA for 10 s. The functionalized MNEE array was then exposed to a 50 μL droplet of 100 μM aqueous solution of 30-mer complementary target DNA (Sigma-Aldrich) sequence:
5′-GTATGCTTTGGTCTTTCTGCATTCCTGGAA-3′for 30 minutes. Measurement of target binding involved performing EIS as above, using redox buffer (1 mM/1 mM [Fe(CN)6]3−/[Fe(CN)6]4−, in aqueous 1× Tris–HCl pH 4.3) so as to ensure gel stability. For biofouling kinetic experiments, this redox buffer was also used, as it has been previously established that bovine serum albumin (BSA) solution is stable at this pH.17 BSA (Sigma Aldrich, UK) was purchased as a lyophilized powder and made up to a final 100 μM concentration, followed by pH readjustment as required.
Results and discussion
The carbazole–alanine forms hydrogels by self-assembling into fibrous structures, induced by a pH decrease. In previous work, the electrochemical oxidation of hydroquinone at a macroelectrode surface has been used to lower the pH locally, so as to grow a hydrogel matrix.16 The linear diffusion regime established across these electrodes is assumed to produce a relatively homogeneous hydrogel. MNEE arrays have established enhanced steady-state mass transport with a mixture of coupled diffusional regimes (highly enhanced nanoscale diffusion near band electrodes, enhanced microscale diffusion within and immediately outside each cavity and macroscale diffusion where cavity array diffusional fields overlap).13 This was thought likely to lead to spatially inhomogeneous pH decrease and hydrogel formation, so the appropriate electrochemical hydrogel growth conditions and resulting hydrogel structures first needed to be established for MNEE arrays.Following the previous electrochemical hydrogel procedure,16Fig. 2a shows a typical potential time transient for hydrogel formation at the MNEE array, along with an image of the resulting hydrogel (Fig. 2b). During the gelation process, following the initial establishment of the characteristic hydroquinone oxidation potential above +1.0 V reported previously, over short periods of time (t < 400 s) the potential was seen to increase essentially linearly to around +1.3 V, consistent with the increased overpotential required to deliver this oxidation current through the growing hydrogel. After 400 s, the potential was seen to rise relatively rapidly to over +2.0 V, consistent with mass transfer of hydroquinone to the electrode surface being insufficient to support this current, and the growing importance of solvent oxidation and oxygen gas formation. This gas formation is the most likely cause of the bubbles that can be observed in the hydrogel in Fig. 2b. As these oxygen bubbles will compromise the hydrogel structure, growth was limited to times less than 400 s, where significant amounts of bubbles do not form.
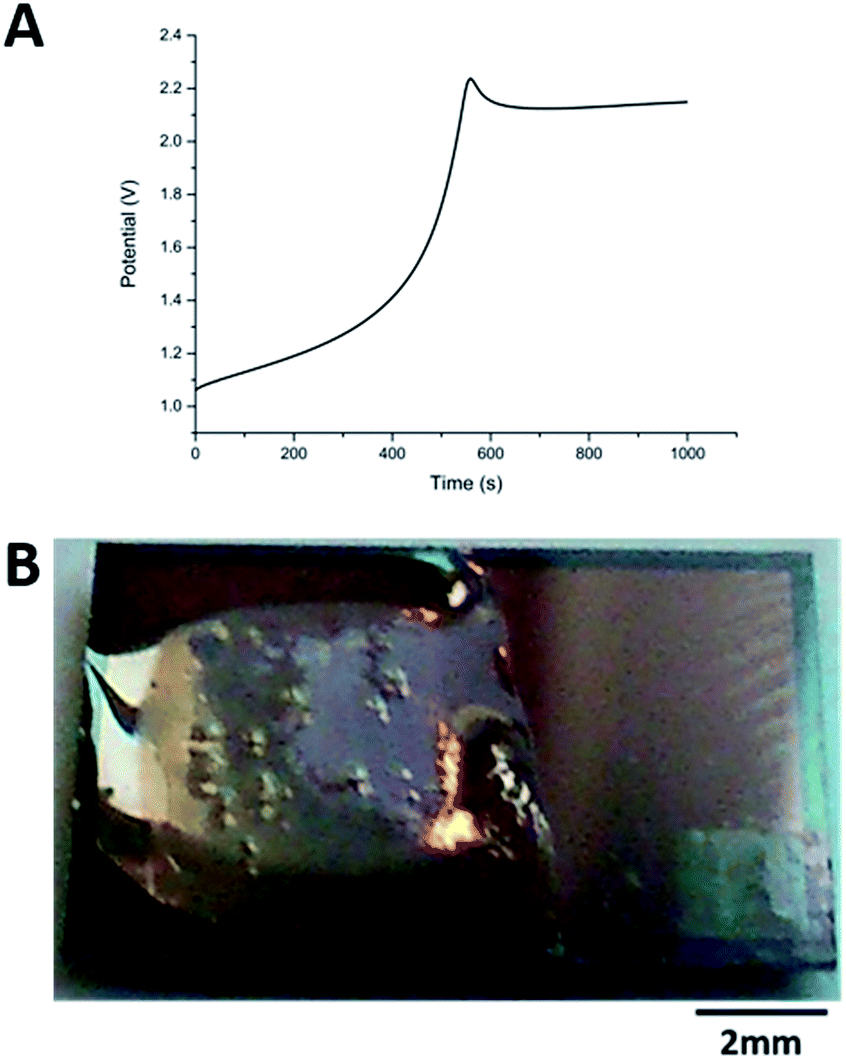 | ||
| Fig. 2 (A) Typical potential–time transient recorded during 15 min of galvanostatic hydrogel growth at +100 μA on an MNEE array and (B) a photograph of the resulting hydrogel. Note that potentials reported are with respect to the platinum pseudoreference. | ||
To investigate the different stages of electrochemical hydrogel formation, galvanostatic growth using this procedure was carried out for successive 5-second periods, followed by optical (using scanning electron microscopic, confocal microscopic and light microscopic imaging) and electrochemical characterization.
Fig. 3 shows typical Nyquist plots after these successive growth periods.
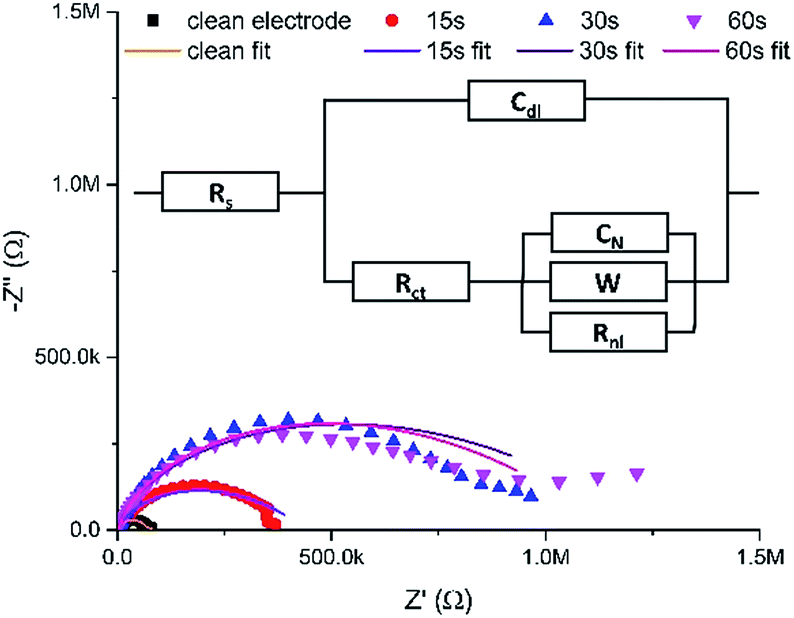 | ||
| Fig. 3 Typical EIS Nyquist data (points) for a clean MNEE array and an MNEE array after a total of 15 seconds, 30 seconds and 60 seconds of hydrogel growth, along with fits of these data (lines) to the general equivalent circuit (inset). Note that Table S1 in the ESI† contains the values for the fits of these data to the appropriate limiting case for the general equivalent circuit (inset). Also note that this is an extension of the established MNEE equivalent circuit,13 with an additional Warburg element to account for within hydrogel diffusion. All fits give relatively low fit values (with χ2 < 0.156). | ||
It is reassuring that the measured impedance values increased with longer hydrogel formation times, consistent with a progressive increase in surface hydrogel formation. The fits to these EIS data enable quantitative assessment of hydrogel characteristics (vide infra). The light microscopy images (Fig. 4) also confirm the progressive growth of hydrogel.
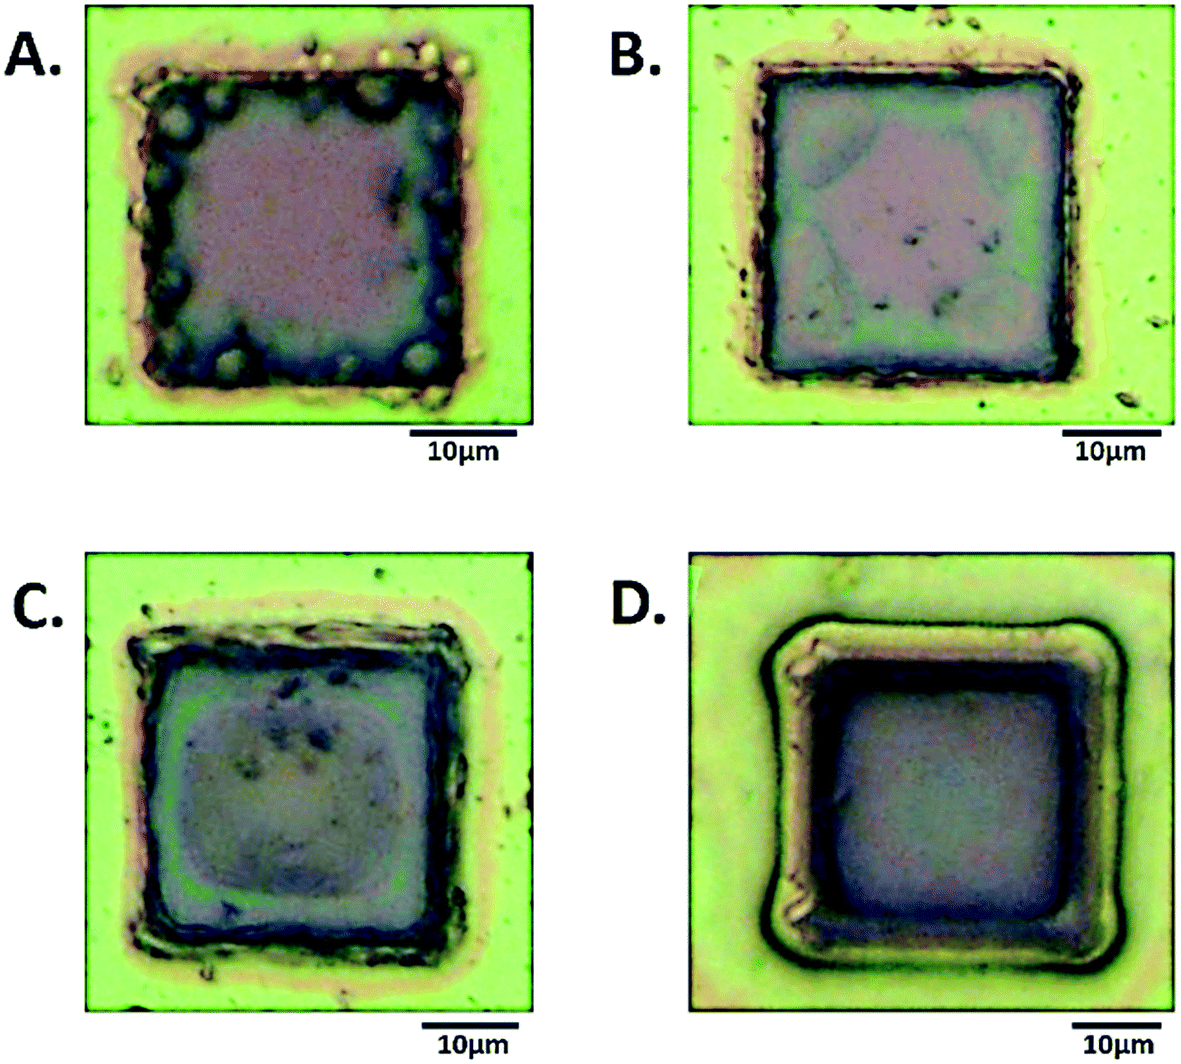 | ||
| Fig. 4 Light microscopy images of a single square in the MNEE array after (A) 5 seconds, (B) 10 seconds, (C) 15 seconds, (D) 20 seconds growth at 50 μA. | ||
The magnitude of the galvanostatic current and the potential profile suggest that the hydrogel growth is largely determined by diffusion, with hydroquinone diffusion and reaction at the electrode producing the required local pH decrease for hydrogel formation within the diffusion layer through proton production.16 Under these conditions, the thickness of the diffusion layer, l, as a function of time, t, can be estimated by:
| t ≈ l2/D | (1) |
Characterization of hydrogel growth; spatial determination of the hydrogel structure
It is also satisfying that the EIS fit values of Rs, Rct and Cdl remain relatively constant at 164 ± 5 Ω, 19 ± 6 nF (corresponding to 180 ± 60 μF cm−2 a typical double layer capacitance for an uncoated electrode of these dimensions21) and 19 ± 3 kΩ during hydrogel growth, (Fig. S1 and Table S1 in the ESI†). This confirms that the hydrogel is an open structure which does not hinder significantly the passage of electrolyte ions, and that the electrochemical response at the underlying electrode remains unchanged. However, there is a significant increase in Rnl and a decrease in Y0 (obtained from W) compared to the clean MNEE array after 5 seconds of hydrogel growth, with the observed mean value of D for ferri/ferrocyanide dropping from the accepted literature value22 of (7.7 ± 0.03) × 10−6 cm2 s−1 to (0.89 ± 0.01) × 10−6 cm2 s−1 from Rnl and (0.26 ± 0.02) × 10−6 cm2 s−1 from Y0 (see eqn S1 and S2†). This indicates that the progressive growth of the gel matrix does cause a decrease in D. It is interesting that the value derived from Y0 (due to linear diffusion close to the electrode) is now lower than that derived from Rnl hemispherical diffusion across the diffusion layer formed at each cavity, which suggests the inhibition of mass transport due to a relatively dense hydrogel formed at the electrode surface. This is to be expected, as electrochemical hydrogel formation must be localized at the nanoelectrode, where the hydrogel must therefore be of nanodimensions, producing a nanointerface. This is confirmed by confocal microscopy (Fig. 5a) and SEM (Fig. 6a), which show that hydrogel is firmly anchored to, and grows from the entire nanoband.
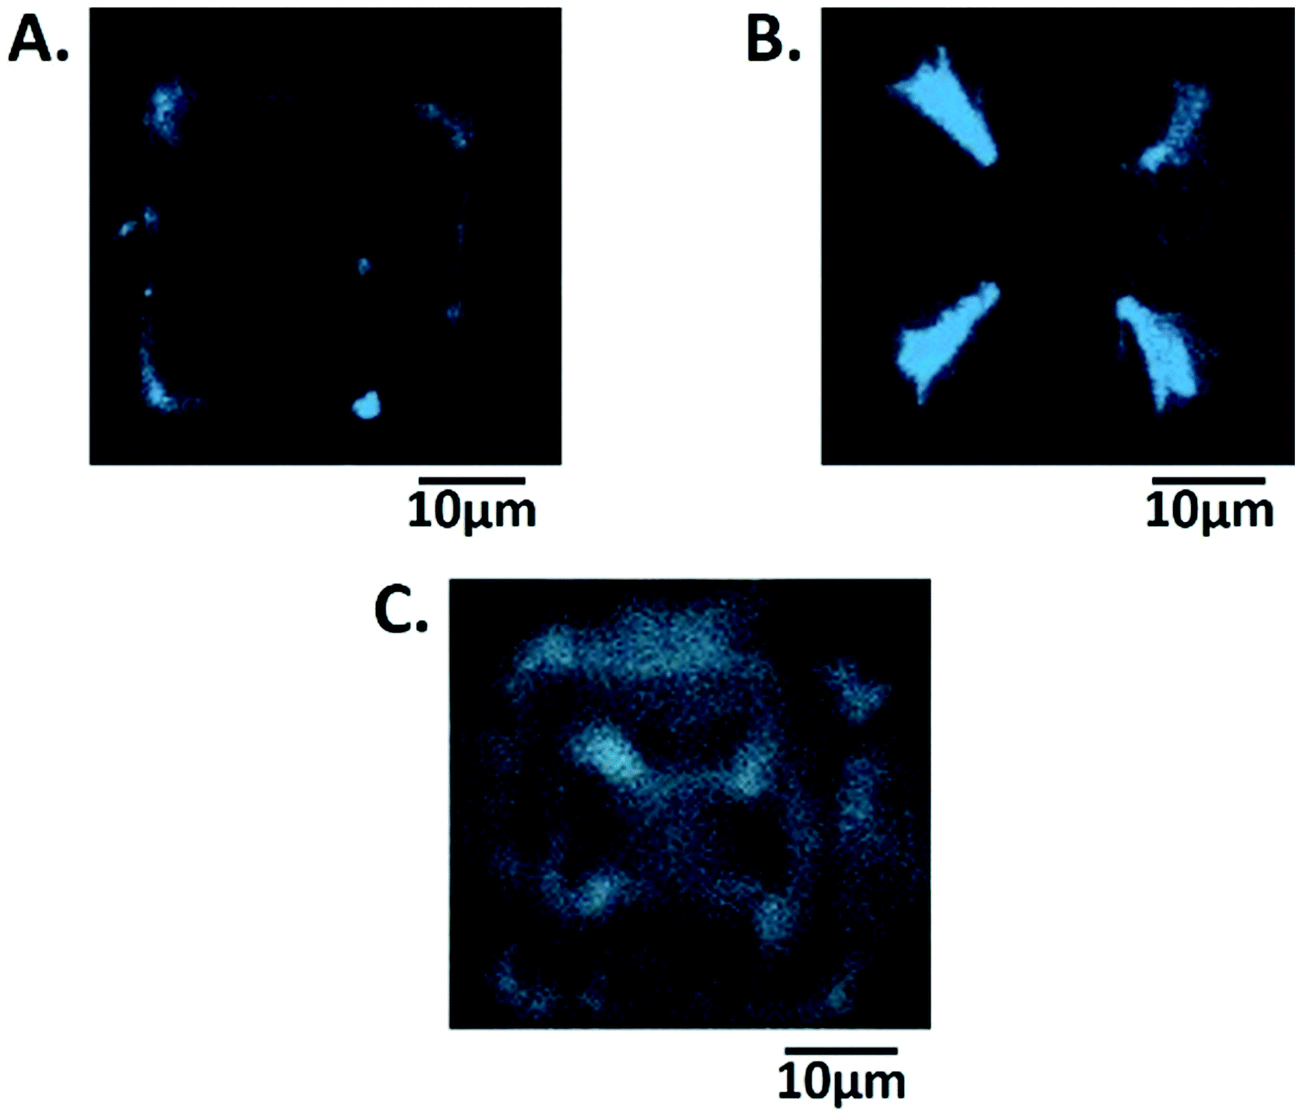 | ||
| Fig. 5 Confocal microscopy images of a single square cavity in the hydrated MNEE array after (A) 5 seconds (B) 10 seconds (C) 20 seconds of hydrogel growth, following staining and imaging with Nile blue. | ||
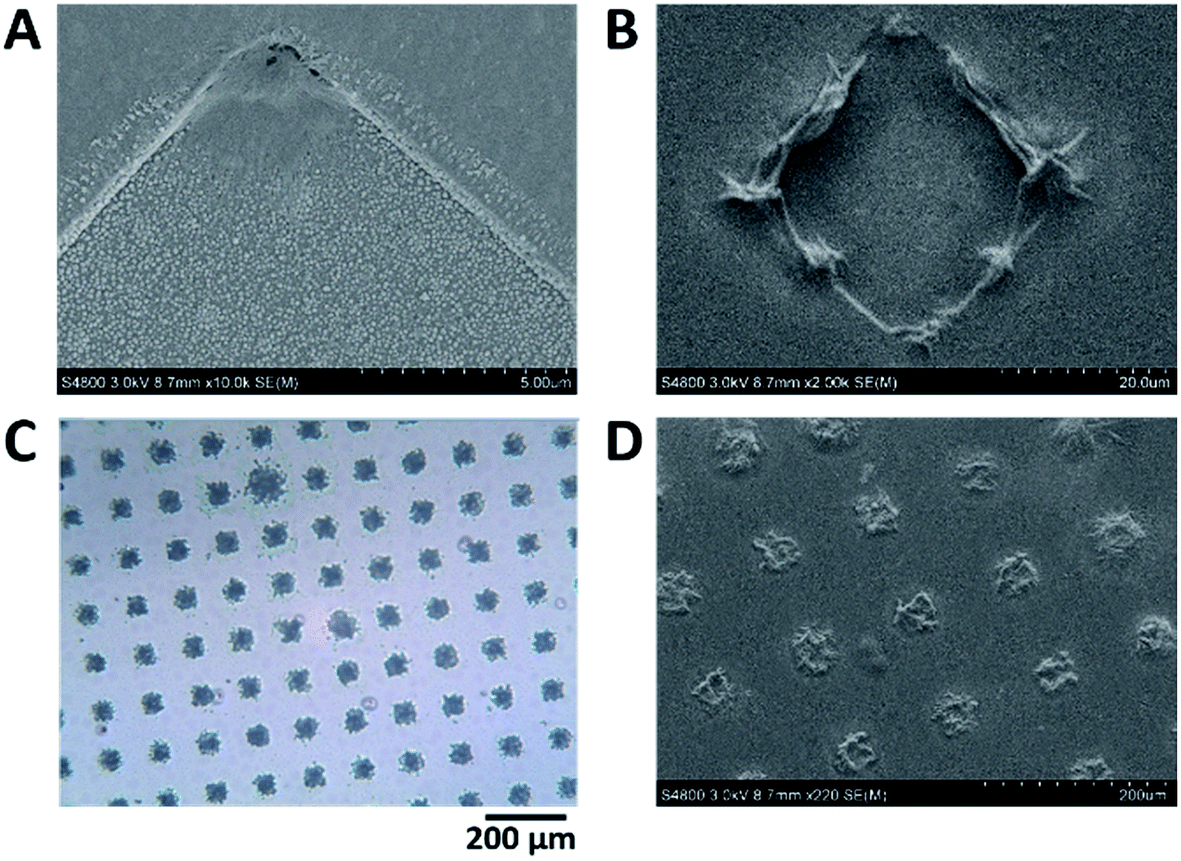 | ||
| Fig. 6 Scanning electron microscopy (SEM) images of the MNEE array after (A) 5 seconds and (B) 10 seconds growth at 50 μA. A close up of the electrode in (A) can be found in Fig. S3† showing that gel is growing across the entire electrode but enhanced growth is clearly occurring in the corners. (C) and (D) are light microscopy and SEM images of a collapsed (dehydrated) hydrogel, respectively, after 20 s, which show that hydrogel has completely filled each cavity in the array. | ||
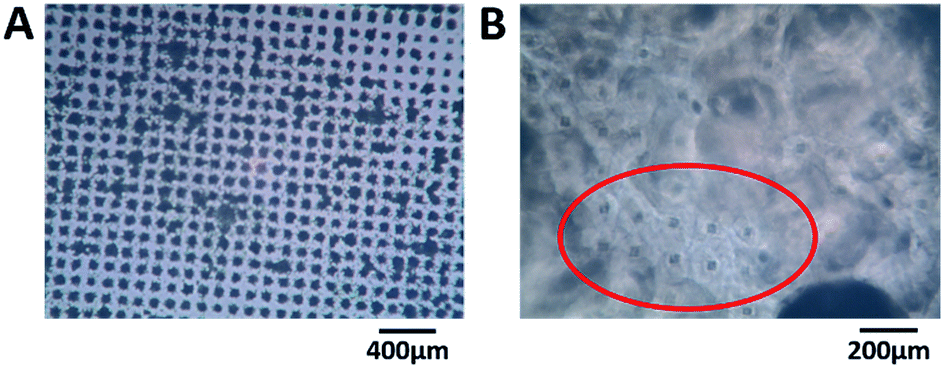 | ||
| Fig. 7 Light microscope images of (A) dehydrated hydrogel after 30 s growth and (B) hydrated hydrogel after 15 min growth. Note that after 30 seconds there is the start of neighboring hydrogel coalescence. The gel has obscured the majority of the array but thinner patches of gel exist where array elements, and the hemispherical shaped hydrogel surrounding them, are observable. Note the black spot in the bottom right is due to a void in the hydrogel arising from growth around a gas bubble (for similar voids, see Fig. 2). | ||
Further prolonged hydrogel growth leads to progressive fusion of all neighbouring hydrogel elements, and the establishment of a hydrogel structure which covers the entire electrode area. This is consistent with the expected elemental diffusion field overlap and the establishment of planar diffusion across the array. Light microscopy of the hydrated hydrogel (Fig. 6b) indicates this hydrogel has a relatively open micron-scale structure in comparison to the denser, hemispherical structure imaged at and around each cavity due to the earlier stages of hydrogel formation.
These structural data provide a clear rationale for each of the limiting cases of the global equivalent circuit used to analyse the impedance data (Fig. 2). Initially, prior to hydrogel formation, as expected the data fits the established clean MNEE array circuit,8 with no Warburg impedance (Y0 → ∞). After initial hydrogel growth, there is a growing contribution from W, which we attribute to the diffusion of redox species within the hydrogel. Finally, on array overlap and continued hydrogel film growth across the entire MNEE array, a further semicircular feature is observed which we attribute to an additional series circuit element of a capacitor and resistor in parallel due to charge transfer into this film (Fig. S1 and Table S1†). It is satisfying that throughout these different stages of growth the values for Rs, Rct and Cdl remain constant, and Rnl also remains essentially unchanged. This is consistent with the formation of a spatially heterogeneous hydrogel, whose local structure is determined by the local diffusional characteristics at hydrogel formation and then retained.
Global control of the hydrogel structure
In addition to the controlled spatial hydrogel heterogeneity induced by the MNEE diffusion fields, Fig. 7 shows that the current at which the gel is grown also determines the density of the organic scaffold and hence the porosity of the gel formed. Fig. 8 shows a comparison of the EIS spectra of hydrogels grown for 15 seconds at 50 and 100 μA respectively (which should give similar diffusion fields and hydrogel volumes due to the fixed time). It is clear that the impedance values for the reaction and diffusion of ferri/ferrocyanide through the hydrogels formed at the lower current are markedly higher, and that the fit parameters (Table S1†) show a statistically significant and marked decrease in Y0 and a corresponding increase in Rnl, attributable to a decrease in the mean diffusion coefficient D of the order of a factor of 4 for ferri/ferrocyanide (from around 2 × 10⁻⁷ cm2 s−1 at 100 μA to between 4–8 × 10⁻⁸ cm2 s−1 at 50 μA), indicating the formation of a denser, less porous hydrogel compared to that formed at the higher current. There is also a small decrease in Cdl, which would be consistent with an increase in the density of the organic scaffold of the nanodimensional hydrogel at the electrode surface. Such an increase in density at lower current would be consistent with an increase in the local concentration of gelator species due to a reduction in the importance of mass transfer.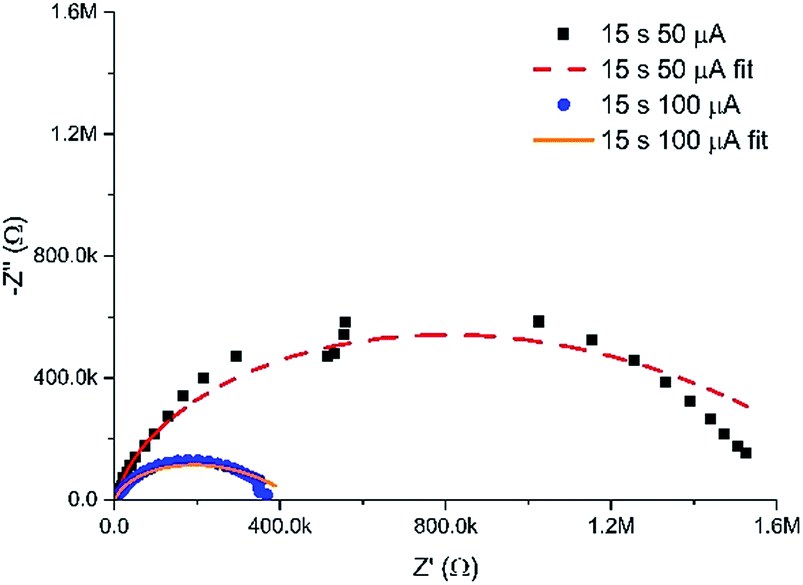 | ||
| Fig. 8 Nyquist plots in redox buffer of hydrogels grown for 15 seconds at 50 and 100 μA, along with their associated fits to the equivalent circuit (with fit parameters given in Table S1†). | ||
Feasibility of biosensing through a hydrogel on a MNEE array
The ability to vary the overall density and hence porosity of the gel, combined with the established controlled and reproducible spatial variation in hydrogel structure, could be of value in the tuning of molecular filtration properties of these hydrogels. One potential application would be the production of a surface layer which inhibits or prevents electrode sensor biofouling.11 Biofouling, especially of the nanointerface of nanoelectrodes, is an area of great interest as moves are made towards implantable diagnostic devices.23,24 All point-of-care diagnostics would benefit from being able to detect analytes in complex media without the need for pre-treatment, which can be expensive and time consuming.4,23 One potential use of electrochemically produced hydrogels would be if they could be grown over established electrochemical sensing/detection systems, thereby conferring surface anti-biofouling, without compromising target detection. The feasibility of this approach was therefore tested, by using the model system of an established biomolecular sensing film readily formed through creating a self-assembled monolayer on an electrode.25 The previously established and clinically relevant DNA sensing protocol for the detection of the MRSA mecA cassette was chosen to determine the ability of the electrode to retain its function as a working biosensor following electrochemical hydrogel formation. The protocol involved forming a self-assembled monolayer (SAM) using a peptide nucleic acid (PNA) probe with a sequence homologous to the MRSA mecA cassette. A spacer molecule (6-mercaptohexan-1-ol, MCH) was also present in the solution (and film) in a 15:1 ratio with the PNA to optimize surface coverage.25 The carbazole–alanine hydrogel matrix was then grown through and over this film for 10 seconds at 50 μA as above before being incubated with a 15-mer target DNA (100 μM) for 30 minutes. The electrode was then placed in the redox buffer and hybridization measured as above using EIS. This sensing protocol has previously been shown to not exhibit non-specific binding to mismatched DNA target sequences.25
Fig. 9a shows the Nyquist plots obtained using this protocol, which show the expected increases in the impedance, first on going from a clean MNEE nanoelectrode array to an array with a blocking PNA SAM probe film, then with an additional layer of hydrogel electrochemically grown on the surface, and finally, when target passed through the hydrogel and bound to the PNA probe. Detailed analysis revealed the expected increase in Rct when going from a clean electrode to one that has a SAM film on the surface, whilst Rnl stayed constant, which confirms that there was no effect on D (mass transfer to the electrode). Growing the hydrogel over the SAM was then seen to increase Rnl significantly, as expected, such that the two near semicircular features are no longer distinguishable by eye. This confirms the growth of the hydrogel matrix, within which there is the corresponding expected decrease in diffusional rate. It is interesting that is also a significant increase in Rct, since it has been established that this charge transfer response is largely determined by redox reaction through pinhole defects in the SAM layer formed on multicrystalline electrode surfaces.26–28 This suggests that the local enhanced pH change and hydrogel growth increases the observed charge transfer resistance through constricting the size, and/or blocking at least some, of these pinholes as a result of the creation of hydrogel anchor points to the underlying electrode, which is consistent with the previously observed adherence of the hydrogel. The final sensing step again resulted in the expected significant increase in Rct (without a change in Rnl), due to the formation of the more blocking PNA–DNA duplex SAM film at the electrode surface. It is satisfactory that this relative increase in Rct on target binding is comparable to that observed previously for this biosensor system,25 which confirms that the biosensing function is not significantly affected, even after the growth of the surface hydrogel.
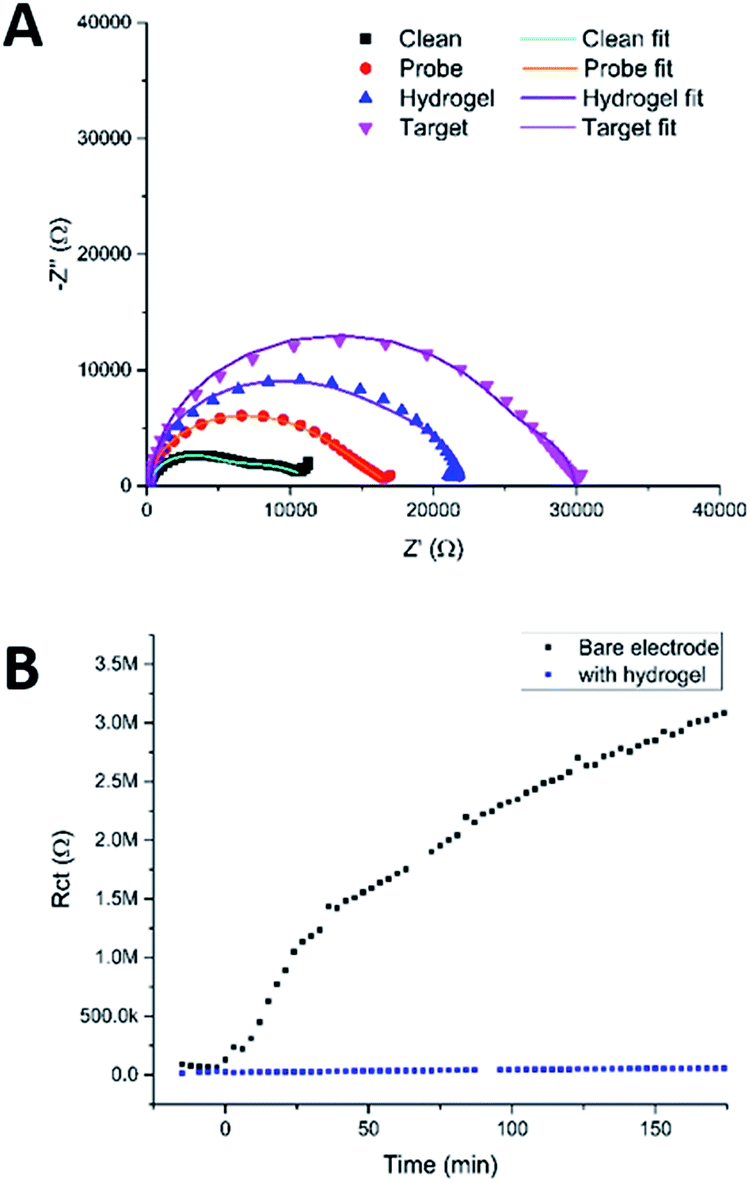 | ||
| Fig. 9 (A) Nyquist plots of a clean MNEE array, an array with a PNA probe SAM layer, with a hydrogel grown over and around the SAM film and after binding of target DNA that has penetrated the hydrogel and bound to the probe. Circuit fits can be found in Table S2.† (B) Fitted values of Rct obtained by taking consecutive measurements of an electrode in redox buffer containing 100 μM BSA with and without hydrogel on the electrode surface. The points below 0 min were repeat measurements taken on a clean electrode, prior to exposure to BSA, as a control. | ||
To test the ability of this carbazole–alanine hydrogel to prevent biofouling, a clean MNEE was placed in redox buffer containing 1 μM bovine serum albumin (BSA). It has previously been reported that BSA is a ∼66.5 kDa protein, stable in its wildtype form at the redox buffer pH of 4.3, that has been shown to readily foul a clean electrode surface.17,29Fig. 8b shows the resulting values of Rct obtained from successive EIS measurements as a function of time. These demonstrate the expected and progressive significant increase in Rct due to surface nanoelectrode biofouling. In contrast, after surface hydrogel growth at 100 μA for 20 s the values of Rct were seen to remain low and invariant with time. This stark contrast between the two signals clearly demonstrates the ability of the hydrogel, with its increasingly dense structure from bulk solution to electrode, to prevent BSA biofouling of the underlying nanoelectrode array.
Conclusions
This work has established that spatially structured hydrogels can be electrochemically grown reproducibly and controllably on the surface of MNEE arrays, and that this growth does not compromise the sensing activity of a biosensing SAM nanointerfacial layer. It also demonstrates that the hydrogel can be used to prevent the non-specific binding of the biologically relevant 66 kDa BSA protein. These are the essential proofs of principle required to demonstrate the feasibility of electrochemical target detection from complex media, which contain biologically relevant proteins, by using SAM probe-target binding at nanoelectrodes capped with hydrogel. Further work required to develop this system includes the exploitation of the tuning of gelation and the resulting hydrogel structure (as demonstrated by control of the hydrogel current) to enable optimization of protein-target selectivity for the variety of proteins found in such media.It is also interesting that experiments attempting to measure target DNA binding through the hydrogel in a solution containing BSA produced no measurable change in Rct. This can be explained by the non-specific binding of the BSA to these target DNA oligonucleotides; whilst Barton et al. have shown that BSA does not bind to DNA at biologically relevant neutral pHs,30 these experiments were run at pH 4.3 so as to not destabilise the hydrogel structure. As the isoelectric point of BSA is pH 4.7,31 under these conditions the positively charged BSA is likely to bind electrostatically to negatively charged DNA target in the system, thereby preventing its detection. Thus, although this hydrogel is likely to be able to enable target biosensing in acidic biological media, such as the stomach, this highlights the desirability of developing hydrogels that can be both electrochemically manufactured and stable at neutral pH in order to enable the detection of analytes in a wider range of biological media.
Finally, to address the added value of these nanoelectrodes and their resulting functionalisation to form nanointerfaces, it is worth considering the degree and homogeneity of spatial control of hydrogel formation that could also be achieved when employing established micron scale electrode systems such as a microdisc or microsquare electrode. Although both of their overall steady-state, mass transport limited electrochemical responses can be categorised essentially in terms of hemispherical diffusion to the electrode surface, non-uniform fluxes are seen across these electrode surfaces with markedly enhanced solution mass transfer rates to the electrode edge regions of both (and, like the corners of square nanocavity, Fig. 5b, particularly to the corners of the microsquare) when compared to the rest (the inner surface region) of each electrode.15 In these edge regions we expect that similar electrochemical conditions to the nanoband electrodes may well be able to be generated, which could result in a similarly nanostructured surface hydrogel with comparable edge sensing enhancement to these nanoelectrodes. In contrast, reflecting the markedly reduced mass transport, a more open surface hydrogel structure would be expected in the inner region. Given this inner region constitutes the vast majority of the electrode area and that the overall response of the microelectrode will be the combination of inner and edge region responses, the advantage of nanoband electrodes over microelectrodes is therefore likely to be the increased signal-to-noise, sensitivity and resistance to biofouling that results from the effective removal of this inner region and the exclusive production of a nanointerface.
Availability of data
Data used within this publication can be accessed at: http://dx.doi.org/10.7488/ds/2402.Conflicts of interest
There are no conflicts to declare.Acknowledgements
A. P. would like to thank the University of Edinburgh Schools of Chemistry and Engineering for funding his PhD studentship. D. J. A. thanks the EPSRC for a Fellowship (EP/L021978/1). The authors would like to acknowledge Dr A. Bunting and Prof. A. Walton from the Scottish Microelectronics Centre for their advice regarding the fabrication of the MNEE devices.References
- G. Liu, C. Sun, D. Li, S. Song, B. Mao, C. Fan and Z. Tian, Gating of redox currents at gold nanoelectrodes via DNA hybridization, Adv. Mater., 2010, 22(19), 2148–2150 CrossRef PubMed.
- M. Silvestrini, L. Fruk and P. Ugo, Functionalized ensembles of nanoelectrodes as affinity biosensors for DNA hybridization detection, Biosens. Bioelectron., 2013, 40(1), 265–270 CrossRef PubMed.
- A. Guiseppi-Elie, Electroconductive hydrogels: Synthesis, characterization and biomedical applications, Biomaterials, 2010, 31(10), 2701–2716 CrossRef PubMed.
- W. Yang, H. Xue, L. R. Carr, J. Wang and S. Jiang, Zwitterionic poly(carboxybetaine) hydrogels for glucose biosensors in complex media, Biosens. Bioelectron., 2011, 26(5), 2454–2459 CrossRef PubMed.
- M. V. Pishko, A. C. Michael and A. Heller, Amperometric glucose microelectrodes prepared through immobilization of glucose-oxidase in redox hydrogels, Anal. Chem., 1991, 63(20), 2268–2272 CrossRef PubMed.
- J. A. Rowley, G. Madlambayan and D. J. Mooney, Alginate hydrogels as synthetic extracellular matrix materials, Biomaterials, 1999, 20(1), 45–53 CrossRef PubMed.
- M. M. Dominguez, M. Wathier, M. W. Grinstaff and S. E. Schaus, Immobilized hydrogels for screening of molecular interactions, Anal. Chem., 2007, 79(3), 1064–1066 CrossRef PubMed.
- K. Sirkar and M. V. Pishko, Amperometric biosensors based on oxidoreductases immobilized in photopolymerized poly(ethylene glycol) redox polymer hydrogels, Anal. Chem., 1998, 70(14), 2888–2894 CrossRef.
- S. E. Salamifar and R. Y. Lai, Fabrication of electrochemical DNA sensors on gold-modified recessed platinum nanoelectrodes, Anal. Chem., 2014, 86(6), 2849–2852 CrossRef PubMed.
- M. Wallace, D. J. Adams and J. A. Iggo, Analysis of the mesh size in a supramolecular hydrogel by PFG-NMR spectroscopy, Soft Matter, 2013, 9(22), 5483–5491 RSC.
- N. Wisniewski and M. Reichert, Methods for reducing biosensor membrane biofouling, Colloids Surf., B, 2000, 18(3–4), 197–219 CrossRef PubMed.
- J. G. Terry, I. Schmueser, I. Underwood, D. K. Corrigan, N. J. Freeman, A. S. Bunting, A. R. Mount and A. J. Walton, Nanoscale electrode arrays produced with microscale lithographic techniques for use in biomedical sensing applications, IET Nanobiotechnol., 2013, 7(4), 125–134 CrossRef PubMed.
- I. Schmueser, A. J. Walton, J. G. Terry, H. L. Woodvine, N. J. Freeman and A. R. Mount, A systematic study of the influence of nanoelectrode dimensions on electrode performance and the implications for electroanalysis and sensing, Faraday Discuss., 2013, 164, 295–314 RSC.
- Y. H. Lanyon, G. De Marzi, Y. E. Watson, A. J. Quinn, J. P. Gleeson, G. Redmond and D. W. M. Arrigan, Fabrication of nanopore array electrodes by focused ion beam milling, Anal. Chem., 2007, 79(8), 3048–3055 CrossRef PubMed.
- H. L. Woodvine, J. G. Terry, A. J. Walton and A. R. Mount, The development and characterisation of square microfabricated electrode systems, Analyst, 2010, 135(5), 1058–1065 RSC.
- J. Raeburn, B. Alston, J. Kroeger, T. O. McDonald, J. R. Howse, P. J. Cameron and D. J. Adams, Electrochemically-triggered spatially and temporally resolved multi-component gels, Mater. Horiz., 2014, 1(2), 241–246 RSC; P. S. Kubiak, S. Awhida, C. Hotchen, W. Deng, B. Alston, T. O. McDonald, D. J. Adams and P. J. Cameron, Polymerization of low molecular weight hydrogelators to form electrochromic polymers, Chem. Commun., 2015, 51, 10427–10430 RSC.
- A. Michnik, K. Michalik and Z. Drzazga, Stability of bovine serum albumin at different pH, J. Therm. Anal. Calorim., 2005, 80(2), 399–406 CrossRef.
- X. Ji, C. E. Banks, D. S. Silvester, A. J. Wain and R. G. Compton, Electrode kinetic studies of the hydroquinone–benzoquinone system and the reaction between hydroquinone and ammonia in propylene carbonate: Application to the indirect electroanalytical sensing of ammonia, J. Phys. Chem. C, 2007, 111(3), 1496–1504 CrossRef.
- W. J. Albery and A. R. Mount, Ring-disc electrodes 22. theory of the measurement of proton fluxes at the disk, J. Chem. Soc., Faraday Trans. 1, 1989, 85, 1181–1188 RSC.
- W. J. Albery and A. R. Mount, Ring-disc electrodes 23. studies of proton fluxes at a thionine-coated electrode, J. Chem. Soc., Faraday Trans. 1, 1989, 85, 1189–1198 RSC.
- A. J. Bard and L. R. Faulkner, Electrochemical Methods: Fundamentals and Applications, Wiley, New York, Chichester, 1980, p xviii, p. 718 Search PubMed.
- K. Ngamchuea, S. Eloul, K. Tschulik and R. G. Compton, Planar diffusion to macro disc electrodes-what electrode size is required for the Cottrell and Randles–Sevcik equations to apply quantitatively?, J. Solid State Electrochem., 2014, 18(12), 3251–3257 CrossRef.
- N. Wisniewski, F. Moussy and W. M. Reichert, Characterization of implantable biosensor membrane biofouling, Fresenius’ J. Anal. Chem., 2000, 366(6–7), 611–621 CrossRef PubMed.
- B. Yu, C. Wang, Y. M. Ju, L. West, J. Harmon, Y. Moussy and F. Moussy, Use of hydrogel coating to improve the performance of implanted glucose sensors, Biosens. Bioelectron., 2008, 23(8), 1278–1284 CrossRef PubMed.
- D. K. Corrigan, H. Schulze, G. Henihan, A. Hardie, I. Ciani, G. Giraud, J. G. Terry, A. J. Walton, R. Pethig, P. Ghazal, J. Crain, C. J. Campbell, K. E. Templeton, A. R. Mount and T. T. Bachmann, Development of a PCR-free electrochemical point of care test for clinical detection of methicillin resistant Staphylococcus aureus (MRSA), Analyst, 2013, 138(22), 6997–7005 RSC.
- C. M. A. Brett, S. Kresak, T. Hianik and A. M. O. Brett, Studies on self-assembled alkanethiol monolayers formed at applied potential on polycrystalline gold electrodes, Electroanalysis, 2003, 15(5–6), 557–565 CrossRef.
- P. M. Kosaka, S. Gonzalez, C. M. Dominguez, A. Cebollada, A. San Paulo, M. Calleja and J. Tamayo, Atomic force microscopy reveals two phases in single stranded DNA self-assembled monolayers, Nanoscale, 2013, 5(16), 7425–7432 RSC.
- Z. Novakova, R. Orinakova, A. S. Fedorkova and A. Orinak, Electrochemical study of self-assembled monolayer adsorption, J. Solid State Electrochem., 2014, 18(8), 2289–2295 CrossRef.
- T. Goda, E. Yamada, Y. Katayama, M. Tabata, A. Matsumoto and Y. Miyahara, Potentiometric responses of ion-selective microelectrode with bovine serum albumin adsorption, Biosens. Bioelectron., 2016, 77, 208–214 CrossRef PubMed.
- E. M. Boon, J. E. Salas and J. K. Barton, An electrical probe of protein–DNA interactions on DNA-modified surfaces, Nat. Biotechnol., 2002, 20(3), 282–286 CrossRef PubMed.
- K. Hirayama, S. Akashi, M. Furuya and K. Fukuhara, Rapid confirmation and revision of the primary structure of bovine serum-albumin by ESIMS and FRIT-FAB LC MS, Biochem. Biophys. Res. Commun., 1990, 173(2), 639–646 CrossRef PubMed.
Footnotes |
| † Electronic supplementary information (ESI) available. See DOI: 10.1039/c8fd00063h |
| ‡ School of Chemistry, University of Glasgow, Glasgow, G12 8QQ, UK. |
| This journal is © The Royal Society of Chemistry 2018 |