 Open Access Article
Creative Commons Attribution 3.0 Unported Licence
Determination of amphetamine-type stimulants (ATSs) and synthetic cathinones in urine using solid phase micro-extraction fibre tips and gas chromatography-mass spectrometry
Khalid A.
Alsenedi
 *a and
Calum
Morrison
 *b
*b
aForensic Medicine and Science, School of Medicine, Dentistry and Nursing, College of Medical, Veterinary and Life Sciences, University of Glasgow, Glasgow, G12 8QQ, UK. E-mail: khalidsenedi@gmail.com
bForensic Medicine and Science, School of Medicine, Dentistry and Nursing, College of Medical, Veterinary and Life Sciences, University of Glasgow, Glasgow, G12 8QQ, UK. E-mail: calum.morrison@glasgow.ac.uk
First published on 6th March 2018
Abstract
In recent years, an increasing number of stimulant drugs and new psychoactive substances (NPSs) have caused concern in scientific communities and therefore innovative methods to extract compounds from complex biological samples are required. This work is aimed at developing and validating a clean, convenient and straightforward extraction procedure with microliter amounts of organic solvent using Solid Phase Micro-Extraction tips (SPME tips) and analysis using Gas Chromatography-Mass Spectrometry (GC-MS) in human urine samples. Another aim is to evaluate three different types of SPME fibre tips C18, C18-SCX (mixed mode) and PDMS-DVB. The quantification method examined the different classes of stimulant compounds included Amphetamine-Type Stimulants (ATSs) (amphetamine, methamphetamine, para-methoxyamphetamine (PMA), and (±)-3,4-methylenedioxymethamphetamine (MDMA)) and synthetic cathinones (mephedrone, buphedrine (buphedrone ephedrine metabolite), 4-methylephedrine (mephedrone metabolite), and pentylone). The method was developed with respect to several areas of the experimental design including pH, ionic strength, addition of salts, vial dimensions, analytes and derivatisation, type of solvents, solvent volume, extraction and desorption time, agitation speeds in the extraction and desorption steps and matrix volume. The optimised method was validated for eight compounds using the SPME PDMS/DVB fibre tips with satisfactory linearity and selectivity ranging between 50 and 2000 ng mL−1, and limits of detection (LODs) and low limits of quantification (LLOQs) ranging between (5–25) and (25–100) ng mL−1 respectively. Within-run and between-run accuracy and precision were <15%. The method was applied to real human urine samples indicating its suitability for common stimulant drugs and provided clean chromatograms with no interfering peaks. The assessment of green analytical chemistry for the method used was discussed and compared with Solid Phase Extraction (SPE). According to the results obtained we recommend the method for use in routine laboratories carrying out drug/forensic analysis for confirmation tests of the studied compounds.
Introduction
Over the past few years, approximately one compound has entered the recreational drug market on a weekly basis within the category of new psychoactive substances (NPSs). These are synthesised to bypass regulations and laws, and to have similar or stronger effects than existing drugs. Throughout the world, amphetamine-type stimulants (ATSs) are the second most commonly used drugs and often exceed heroin and cocaine use.1–3Synthetic cathinones covered approximately 23% of the global trends of individual NPSs reported in the Early Warning Advisory (EWA) from 2008 to 2015.3 Cathinone is found in the plant Catha edulis (khat) and synthesized derivatives have a varied range of β-ketoamphetamines and have been sold as alternatives to ATSs. Fatalities and toxicity related to the abuse of stimulant drugs and synthetic cathinones are of international concern with several deaths reported.4–11
Consequently, the proof of identity of ATSs and synthetic cathinones in biological specimens is vital in the clinical, forensic and toxicology fields since most of the NPSs are not fully detected using routine immunoassay screening methods. This may be a result of cost-ineffectiveness or unavailability of reagents. Moreover, the confirmation of positive results in chromatographic and mass spectrometric techniques is required for accurate molecule identification and to distinguish between isomers and structures.
Biological samples contain various components with urine and blood which are not compatible with complex instrumentation. This can be solved by using a sample preparation technique which eliminates some components in biological samples and keeps the analytes of interest. Therefore, the requirement for a fast, clean and convenient procedure to reduce instrument contamination plays an essential role in any laboratory.
Solid Phase Micro-Extraction (SPME) was used for the first time in 1989 by Pawliszyn and his colleagues.12 It was carried out to minimise the time taken for the sample preparation and reduce the amount of both solvents and samples on the micro-liter scale.12 SPME is easy to employ, allows rapid screening with minimum contact with toxic solvents, and can be both manual or automated. It is a sensitive, efficient technique and reduces the time required and cost. It is highly efficient for screening purposes due to its speed and ease of use. The problem of sample loss, contamination and dilution can be avoided by the use of this technique.13
GC-MS is the most common technique in clinical toxicology and forensic laboratories and is more economical than LC-MS-MS, and therefore methods developed using GC-MS have an extensive range of applicability in forensic toxicology laboratories.
The aims of this work were:
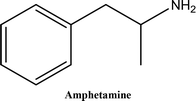
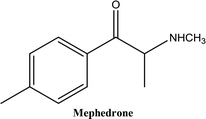
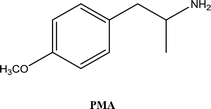
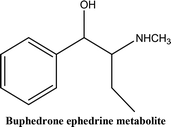
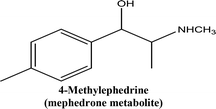
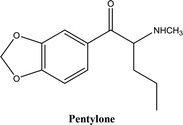
• To develop and validate a clean and convenient method on a microliter scale using SPME tips and GC-MS for the analysis of 8 stimulant drugs including ATSs and synthetic cathinones in urine, and the compounds studied are shown in Table 1.
• To evaluate the new biocompatible SPME LC tips containing fibres of C18, C18/SCX and PDMS/DVB.
• To reduce the environmental and health impacts compared to traditional sample preparation methods such as solid phase extraction (SPE).
• To address the need for green analytical chemistry.
• To evaluate this method when it is applied for real human urine samples.
Materials and methods
Materials
The reference standards of amphetamine, methamphetamine, PMA, MDMA, cathinone, mephedrone, buphedrine, 4-methylephedrine, and pentylone, three internal standards (ISDs) – amphetamine-d11 (1 μg mL−1), cathinone d5 (0.1 μg mL−1) and pentylone-d3 (0.1 μg mL−1) as hydrochloride salts, pentafluoro-propionic anhydride (PFPA), formic acid (FA), three types of SPME fiber tips: PDMS-DVB, C18 and C18-SCX silica, vial kits of two sizes, 0.3 mL and 1.2 mL, natural PTFE/silicone septa (with slit), and thread 9 mm were purchased from Sigma-Aldrich, Gillingham, UK. The SPME fibre tips with stationary phase C18-SCX were kindly donated by Sigma Aldrich.Methanol (MeOH), acetonitrile, ethyl acetate (EtOAc), acetone, 2-propanol, ammonium hydroxide (NH4OH), sodium phosphate dibasic, sodium chloride, sodium phosphate monobasic, dichloromethane (DCM), isopropanol (IPA), hydrogen chloride (HCl), acetic acid, sodium hydroxide (NaOH), sodium chloride (NaCl) and microcentrifuge Eppendorf tubes 1.5 mL were obtained from VWR International, East Grinstead, UK.
Phosphate buffer and sodium phosphate were purchased from Fisher Scientific, Loughborough, UK. 200 μg solid phase extraction (SPE) clean screen extraction columns, United Chemical Technologies (UCT), part number ZSDAU20, were purchased from Chromatography Direct, Runcorn, UK.
Deionised water was generated from an ultrapure water purification system (Merck Direct QR 3UV water deionizer).
Ethics statement
Written informed consent was obtained from all subjects. The protocol was reviewed and approved by the MVLS College Ethics Committee, University of Glasgow (200160055) and the Research Committee at Security Forces Hospital, Riyadh, Saudi Arabia (16-190-24).Drug-Free Urine (DFU) specimens were collected from volunteers and confirmed negative for the target analytes. The protocol was reviewed and approved by the MVLS College Ethics Committee, University of Glasgow (200160020).
Methods
Preparation of standards
Stock solutions (100 μg mL−1) of the eight drugs, listed in Table 1, were prepared by the dilution of purchased standards via 1![[thin space (1/6-em)]](https://www.rsc.org/images/entities/char_2009.gif) :
:![[thin space (1/6-em)]](https://www.rsc.org/images/entities/char_2009.gif) 10 dilution in methanol. A mixture of the working solution of each standard was prepared by the dilution of the 100 μg mL−1 stock solutions via 1
10 dilution in methanol. A mixture of the working solution of each standard was prepared by the dilution of the 100 μg mL−1 stock solutions via 1![[thin space (1/6-em)]](https://www.rsc.org/images/entities/char_2009.gif) :
:![[thin space (1/6-em)]](https://www.rsc.org/images/entities/char_2009.gif) 50 dilution in Drug-Free Urine (DFU) to reach a concentration of 2 μg mL−1.
50 dilution in Drug-Free Urine (DFU) to reach a concentration of 2 μg mL−1.
Working internal standards (ISDs) of the deuterated standards were prepared by the dilution of purchased internal standards via 1![[thin space (1/6-em)]](https://www.rsc.org/images/entities/char_2009.gif) :
:![[thin space (1/6-em)]](https://www.rsc.org/images/entities/char_2009.gif) 10 dilution in methanol to reach 10 μg mL−1. The mixture of the 8 drugs in urine and ISDs were stored at −20 °C until use.
10 dilution in methanol to reach 10 μg mL−1. The mixture of the 8 drugs in urine and ISDs were stored at −20 °C until use.
Optimised procedure
The optimised procedure was applied to assess the parameters of the method validation work.Initially, the SPME tips (PDMS-DVB fibre) were conditioned between 10 and 20 minutes in MeOH![[thin space (1/6-em)]](https://www.rsc.org/images/entities/char_2009.gif) :
:![[thin space (1/6-em)]](https://www.rsc.org/images/entities/char_2009.gif) distilled water (50
distilled water (50![[thin space (1/6-em)]](https://www.rsc.org/images/entities/char_2009.gif) :
:![[thin space (1/6-em)]](https://www.rsc.org/images/entities/char_2009.gif) 50).
50).
1 mL of the drug mixture in urine (for example 2 μg mL−1) and 100 μL of ISDs of amphetamine d11 and pentylone d5 (1 μg mL−1) with 0.5 g NaCl and 100 μL of 10% NaOH (pH 12.6) were added to 1.5 mL microcentrifuge Eppendorf tubes. The Eppendorf tubes were pierced before inserting the SPME tips.
The samples including tips were placed in a shaker (IKA VIBRAX VXR) for agitation at a speed of 2000 rpm. They were left for at least 1 hour so that equilibrium between the analytes and stationary phase was reached.
The SPME tips were transferred to 0.3 mL vials with the addition of 65 μL of MeOH and left for 10 minutes at an agitation speed of 2000 rpm. 10 μL of acidified methanol (1![[thin space (1/6-em)]](https://www.rsc.org/images/entities/char_2009.gif) :
:![[thin space (1/6-em)]](https://www.rsc.org/images/entities/char_2009.gif) 9) was added, and the vials were evaporated under a stream of nitrogen at room temperature (RT) until fully dry.
9) was added, and the vials were evaporated under a stream of nitrogen at room temperature (RT) until fully dry.
The vials were then derivatised by adding 50 μL PFPA and EtOAc (2![[thin space (1/6-em)]](https://www.rsc.org/images/entities/char_2009.gif) :
:![[thin space (1/6-em)]](https://www.rsc.org/images/entities/char_2009.gif) 1). The samples were capped and vortexed immediately for 3–5 seconds and then incubated for 10–15 minutes at 60 °C. The samples were evaporated under a stream of nitrogen at RT. The time required until fully dried in the evaporation steps was 2–5 minutes only. The samples were reconstituted in 50 μL of ethyl acetate before 1 μL was injected into the GCMS for analysis (see Fig. 1).
1). The samples were capped and vortexed immediately for 3–5 seconds and then incubated for 10–15 minutes at 60 °C. The samples were evaporated under a stream of nitrogen at RT. The time required until fully dried in the evaporation steps was 2–5 minutes only. The samples were reconstituted in 50 μL of ethyl acetate before 1 μL was injected into the GCMS for analysis (see Fig. 1).
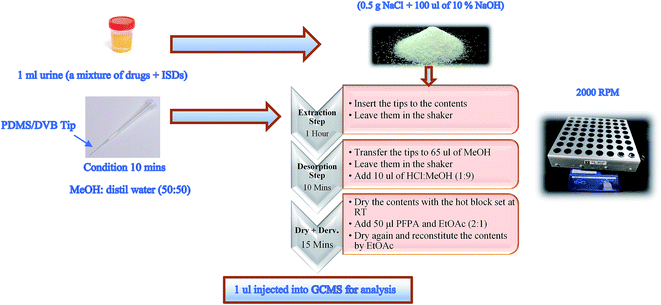 | ||
| Fig. 1 Illustration of the optimum condition procedure applied to SPME PDMS/DVB fibre tips in the mixture of drugs in urine samples. | ||
Method development preparation
The method development of SPME tips was assessed based on the following criteria: the pH of buffer, ionic strength, addition of salts, size of vials, analyte and derivatisation, type of solvents, solvent volume, extraction time, agitation speed in the extraction step, desorption time, agitation speed in the desorption step and matrix volume. Each criterion was evaluated as a single factor keeping the other factors constant.The parameters were assessed based on the absolute recovery14 by adding 1 mL urine containing the mixture of the 8 drugs (1 μg mL−1). A 50 μL ISD (0.5 μg mL−1) of amphetamine d11 was added prior to the evaporation step.
100 μL of a duplicate unextracted mixture of the 8 drug samples (1 μg mL−1) and a 50 μL ISD of amphetamine d11 (0.5 μg mL−1) were added on each evaluation day.
The response of extracted (response of extracted analyte − response of ISD)/response of unextracted (response of unextracted analyte − response of ISD) ratio (%) is calculated as the recovery rate on each day of the method development process.
The pH buffering of urine was evaluated on the three fibres and adjusted to pH 3, 5, 7, 9 and 11 by adding small drops of formic acid, HCl for acidity products, 25% NaOH for alkaline products and phosphate buffer for pH 7.
The ionic strength and the additive of NaOH and KOH salts (5%, 10% and 25% (w/v)) with and without NaCl (0.1, 0.25, 0.5, 0.75 and 1 g; 5%, 10% and 25% (w/v)) were examined in duplicate samples. The experiments were repeated three times on three different days for NaOH (5%, 10% and 25%) with NaCl (0.1, 0.25, 0.5, 0.75 and 1 g) to confirm the results.
The evaluation of the sample volume was performed in triplicate vials at volumes of 1000, 500 and 100 μL at a concentration of 1 μg mL−1.
The derivatisation agent was evaluated by the application of the duplicate samples of PFPA derivatives added pre-, during and post-extraction and after the first evaporation step.
The solvents MeOH, acetonitrile, EtOAc, (NH4OH![[thin space (1/6-em)]](https://www.rsc.org/images/entities/char_2009.gif) :
:![[thin space (1/6-em)]](https://www.rsc.org/images/entities/char_2009.gif) MeOH; 2
MeOH; 2![[thin space (1/6-em)]](https://www.rsc.org/images/entities/char_2009.gif) :
:![[thin space (1/6-em)]](https://www.rsc.org/images/entities/char_2009.gif) 98), (NH4OH
98), (NH4OH![[thin space (1/6-em)]](https://www.rsc.org/images/entities/char_2009.gif) :
:![[thin space (1/6-em)]](https://www.rsc.org/images/entities/char_2009.gif) MeOH; 0.5
MeOH; 0.5![[thin space (1/6-em)]](https://www.rsc.org/images/entities/char_2009.gif) :
:![[thin space (1/6-em)]](https://www.rsc.org/images/entities/char_2009.gif) 99.5), (DCM
99.5), (DCM![[thin space (1/6-em)]](https://www.rsc.org/images/entities/char_2009.gif) :
:![[thin space (1/6-em)]](https://www.rsc.org/images/entities/char_2009.gif) IPA
IPA![[thin space (1/6-em)]](https://www.rsc.org/images/entities/char_2009.gif) :
:![[thin space (1/6-em)]](https://www.rsc.org/images/entities/char_2009.gif) NaOH4; 78
NaOH4; 78![[thin space (1/6-em)]](https://www.rsc.org/images/entities/char_2009.gif) :
:![[thin space (1/6-em)]](https://www.rsc.org/images/entities/char_2009.gif) 20
20![[thin space (1/6-em)]](https://www.rsc.org/images/entities/char_2009.gif) :
:![[thin space (1/6-em)]](https://www.rsc.org/images/entities/char_2009.gif) 2), IPA and (acetone
2), IPA and (acetone![[thin space (1/6-em)]](https://www.rsc.org/images/entities/char_2009.gif) :
:![[thin space (1/6-em)]](https://www.rsc.org/images/entities/char_2009.gif) water; 20
water; 20![[thin space (1/6-em)]](https://www.rsc.org/images/entities/char_2009.gif) :
:![[thin space (1/6-em)]](https://www.rsc.org/images/entities/char_2009.gif) 80) were evaluated in triplicate samples on two days.
80) were evaluated in triplicate samples on two days.
The triplicate samples at extraction times of 15, 30, 45, 60, 90 and 120 min with agitation speeds of 500, 1000, 1500 and 2000 rpm were evaluated on two days.
The triplicate samples in the desorption step at times of 15, 30, 45, 60 and 90 min with agitation speeds of 500, 1000, 1500 and 2000 rpm were assessed. The triplicate samples in the desorption step were evaluated again at times of 20, 30, 40 and 50 min with agitation speeds of 1500 and 2000 rpm. The triplicate samples in the desorption step were evaluated once more at times of 1, 5, 10 and 20 min at an agitation speed of 2000 rpm.
The evaluation of two types of vials, Eppendorf vials (1.5 mL) and kit vials (1.2 mL), was performed by applying the optimum procedure in duplicate samples. They were examined once more to evaluate the linearity at concentrations of 50, 100, 250, 500, 750, 1000, and 2000 ng mL−1 (duplicate samples at each point). All the developed method parameters were tested in the spiked urine containing the 8 stimulant drugs at a concentration of 1 μg mL−1.
Method validation
The method was validated through evaluating the method validation parameters based on the Scientific Working Group for Forensic Toxicology (SWGTOX, 2012) guidelines: linearity, limit of detection (LOD), lower limit of quantitation (LLOQ), accuracy, precision, selectivity, interference and carryover.The linearity study was performed for each substance by spiking 1 mL of drug-free urine (DFU) with the mixture of standards to obtain the concentrations of 50, 100, 250, 500, 750, 1000, and 2000 ng mL−1. Calibration curves for the mixtures in urine were plotted by the linearity method to calculate the linear regression (R2) of the area ratio of each compound with the ISDs versus the concentration of the analyte. It was assessed by analysing 20 separate calibration curves on five consecutive days. The accuracy of each point was calculated in the linearity study and should not exceed 20%.
The limit of detection (LOD) and the lower limit of quantitation (LLOQ) were defined as a signal-to-noise (S/N) ratio exceeding three and ten respectively which were assessed for at least three ions of each substance. The assessment of the mixtures of the urine samples was repeated for each concentration ten times at concentrations of 200, 100, 50, 25, 10, 5, and 1 ng mL−1. The LLOQ parameter was assessed once more by calculating the lowest concentration at which the analyte could be quantified (relative standard deviation (RSD) and bias ≤ 20%).
The accuracy and precision of the method were determined by the analysis of four replicate samples at three quality controls (QC): QC1 = 250, QC2 = 850 and QC3 = 1500 ng mL−1 on the same days of the linearity study. Within-run and between-run accuracy and precision were determined for each analyte with the maximum of RSD and bias values not exceeding 15%.
The interference study was performed by analysing ten different individual blank urine samples for verifying the absence of the peaks interfering with the analytes of interest via SIM mode.
The selectivity of the method was assessed by running triplicate mixture samples of 22 similar drugs cathinone, methcathinone, flephedrone, 4-methyl-N-ethyl-norephedrine (4-MEC metabolite), bupherone, N-ethylecathinone, para-methoxyamphetamine (PMA), pentedrone, methedrone, methylone, butylone, ethylone, pyrovalerone, 3,4-methylenedioxyamphetamine (MDA), para-methoxy-N-methylamphetamine (PMMA), 4-ethylmethylcathinone (4-EMC), methedrone, (±)-N-ethyl-3,4-methylenedioxyamphetamine (MDEA), α-pyrrolidinovalerophenone (α-PVP), 3′,4′-methylenedioxy-α-pyrrolidinopropiophenone (MDPPP), naphyrone, and methylenedioxypyrovalerone (MDPV) at a concentration of 2 μg mL−1 spiked with DFU.
Carryover effects were checked by analysing blank urine specimens after the injection of the highest point of the calibrator.
All method validation parameters were obtained by applying the optimised procedure mentioned above (see the Optimised procedure section; Fig. 1).
Application to real urine samples
The method was applied to three urine samples collected from Saudi Arabia that were confirmed positive for cathinone when previously analysed with a valid solid phase extraction method (SPE). The SPE method was validated in our laboratory for the determination of 20 stimulant drugs based on GC-mass spectrometry.Fragmentation criteria
The criteria for the identification of the mixture compounds were the retention time (tR) with the presence of at least three fragmentation ions and their relative ion intensities%. For the identification of an analyte, tR should not vary more than ±1%; relative ion intensities should not exceed more than ±10% for ions with relative intensities > 50%.GC-MS methodology
The method was carried out with Gas Chromatography-Mass Spectrometry (GC-MS) using a 7890A GC/5975C MSD, a split/splitless inlet and a DB-5ms (5% phenyl/95% methylpolysiloxane; 30 m × 0.25 mm, 0.25 μm film thickness) separation column (all from Agilent Technologies, Waldbronn, Germany). Helium was used as a carrier gas (99.99% purity). Splitless injection at 225 °C was employed. The column temperature programme was initially started at 70 °C and then raised to 200 °C at a rate of 11 °C min−1 (held for 4 minutes), and 200 °C to 280 °C at a rate of 10 °C min−1 (held for 1 minute). The total time was 25 minutes. The MS transfer line temperature was kept at 250 °C. The MS was operated in the electron impact ionisation mode (70 eV). The ion source was maintained at 200 °C. MS data acquisition was initiated at 7 minutes and was performed in the selected ion monitoring (SIM) mode. The method was developed to provide an excellent separation and response. All data acquisition and processing steps were performed using GC/MSD ChemStation Software Version 6.5.Results and discussion
SPME tip extraction and GC-MS methods
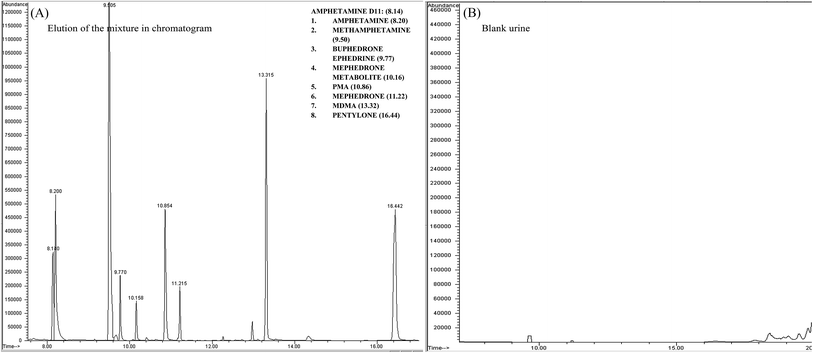
GC MS was initially developed until the desired responses were achieved along with separation and detection by applying the mixture of the 8 stimulant drugs. Each standard of the mixture compounds was prepared alone by running unextracted samples with PFPA derivatives. The separation, tR and fragmentation patterns with the ion intensity ratio% were considered and recorded. The random procedure of SPME tips was initially applied to the optimised conditions of the GC MS. The responses of the SMPE tips were compared with unextracted sample responses (ISD was involved in the calculation). This process showed an initial successful separation and detection in the chromatogram through the procedure of SPME tips (see Fig. 2 and Table 2).| Target compounds | t R | m/z | Ratio (%) | Target compounds | t R | m/z | Ratio (%) |
|---|---|---|---|---|---|---|---|
| Amphetamine d11 | 8.422 | 194 | 100 | 4-Methylephedrine (mephedrone metabolite) | 10.158 | 204 | 100 |
| 128 | 72 | 119 | 13 | ||||
| 98 | 33 | 160 | 20 | ||||
| 308 | 3 | ||||||
| Amphetamine | 8.486 | 190 | 100 | PMA | 10.854 | 121 | 100 |
| 118 | 79 | 148 | 42 | ||||
| 91 | 36 | 190 | 5 | ||||
| 65 | 9 | 311 | 7 | ||||
| Methamphetamine | 9.505 | 204 | 100 | Mephedrone | 11.215 | 119 | 100 |
| 160 | 31 | 204 | 25 | ||||
| 118 | 24 | 91 | 20 | ||||
| 91 | 14 | 160 | 14 | ||||
| Pentylone d5 | 16.339 | 193 | 100 | MDMA | 13.315 | 204 | 100 |
| 235 | 86 | 162 | 73 | ||||
| 148 | 380 | 135 | 43 | ||||
| 339 | 12 | ||||||
| Buphedrine (buphedrone metabolite) | 9.770 | 218 | 100 | Pentylone | 16.442 | 149 | 100 |
| 119 | 12 | 190 | 22 | ||||
| 308 | 3 | 232 | 19 | ||||
| 160 | 18 | 381 | 5 |
Method development
The presence of an efficient, convenient, clean and reliable method for the sample preparation of stimulant drugs such as ATSs and synthetic cathinones and other related compounds of NPSs is important in forensic toxicology laboratories, specifically for confirmation tests. The final products of the method development processes enabled the detection of ATSs and cathinones to provide excellent repeatability and reproducibility using only microliter quantities of organic solvent (50 μL of MeOH). The advantage of using SPME PDMS/DVB fibre tips is that the equilibrium between the analyte and the stationary phase occurs in only one step. This provides safety and less handling of the operators. Furthermore, it benefits the environment and economy with less consumption of vials, solvents and chemicals making this procedure favourable.Two types of vials were used in the procedure, the first one (1.5 mL Eppendorf vial) was used for the sample preparation and extraction steps. The second vial (0.3 mL kit vial) was used in the following stages: the desorption, evaporation, derivatisation and GC-MS stages. The extraction proficiency proved the validity of the method to extract and quantify the target analytes even at low sample volumes and concentrations. The total time required for the sample preparation process until running the samples was 2–3 hours (as an average of preparing 20–30 samples). The conditions of gas chromatography were adjusted to provide an excellent peak shape and responses which allow the separation of the 8 stimulant substances in 25 minutes by using PFPA derivatives. In addition, the conditions of chromatography also permitted the separation of two metabolites in urine (buphedrone ephedrine metabolite and mephedrone metabolite).
GC MS is commonly used in the majority of laboratories and is attractive in terms of financial sustainability.
The method was applied to the collected urine samples to demonstrate the validity of the technique for application as a confirmation method in forensic toxicology analysis.
The main aims of the method development were:
◦ To reach the highest equilibrium between the analyte and stationary phase in SPME tips.
◦ To obtain the highest recovery%.
◦ To assess the three different fibre tips.
◦ To validate the SPME tips for the quantification of the 8 compounds in urine using GC MS.
The extraction products can be optimised by altering the sample conditions.15 Therefore, several parameters of experimental design were considered in the process of the method development (the pH of buffer, ionic strength, addition of salts, size of vials, analyte and derivatisation, type of solvent, solvent volume, extraction time, agitation speed in the extraction step, desorption time, agitation speed in the desorption step and matrix volume). The work was carried out to study three different fibre tips (C18, C18-SCX and PDMS/DVB) via method development processes. The stationary phase of PDMS/DVB fibre tips provided the maximum recovery (2–80%) compared to C18 (0.1–10%) and C18-SCX (0.1–10%). The recovery was calculated through all the method development parameter processes.
The results of the developed method are summarised in Table 3. In summary, the PDMS/DVB fibre tips proved to reach the maximum equilibrium in the reaction for all stimulant drugs tested. An example of pH buffering results and addition of salts is shown in Fig. 3.
| Parameters versus fiber type | PDMS/DVB | C18 | Mixed mode |
|---|---|---|---|
| Salts | NaOH + NaCl | Formic acid | Formic acid + HCL |
| Ionic strength (v/w) | 10% NaOH + 0.5 g NaCl (pH 12.6) | 100 μL formic acid | 100 μL pH 3 FA + 100 μL 0.1 HCL |
| pH | ≥11, the greatest recovery results were at pH 12.6 | pH 2.8 | pH 3.3 |
| Sample volume | 1 mL | Invalid | Invalid |
| Derivatisation agent (PFPA) | When the PFPA was added after the evaporation step | After the evaporation step | After the evaporation step |
| Extraction time | ≥1 hour | Invalid | Invalid |
| Extraction speed | 2000 rpm | Invalid | Invalid |
| Desorption type | MeOH, acetonitrile and DCM: ISO: NaOH4 | Invalid | Invalid |
| Desorption time | 10 min | Invalid | Invalid |
| Desorption speed | 2000 rpm | Invalid | Invalid |
| Linearity | 0.992–999 | Invalid | Invalid |
| Recovery | 2–80% | 0.1–10% | 0.1–10% |
| Vial type | Both Eppendorf vials and kit vials were valid | Invalid | Invalid |
Green analytical chemistry
The assessment of green analytical chemistry is complex and has several criteria and variations that need to be checked. In many cases it is difficult to meet the ideal green analytical methodology in the procedure, because method validation is difficult to achieve without the use of hazardous substances. In our procedure, we minimise the use of solvents, chemicals and reagents to meet the lowest effects or hazards with the consideration of the criteria of assessment and method validation.The five criteria for the evaluation of green analytical chemistry are health, safety, environment, energy and waste. Based on the above criteria, we compared the SPME tip procedure with the SPE method16 in the stage of sample preparation only, i.e. when they were applied for ATSs and synthetic cathinone compounds. Both extraction methods have similar compounds that meet the requirements of method validation.17–19 The tool of assessment was recently discussed in a paper by Płotka-Wasylka.20 For the results and overall discussion see Table 4.
| Method & criteria | Chemicals used/sample | Energy ratea (kW h) | Waste rateb | Health ratec | Safety rated | Environmental ratee | |||
|---|---|---|---|---|---|---|---|---|---|
| Chemicals amount/sample | NFBA health rating | NFBA flammability rating | NFBA reactivity rating | ||||||
| a Energy rating: 1 = wet chemistry and very little solvent in the evaporation step; 2 = GC and moderate solvent used in the evaporation step. 3 = GC-MS and high volume of solvent used in the evaporation step. b Waste rating: 1 = full waste per sample ≤50 g. 2 = full waste ≤250 and >50 g. 3 = full waste >250 g. c Health rating: NFPA (National Fire Protection Association) score is 0 or 1 = slightly toxic and irritant; NFPA 2 or 3 = moderately toxic and temporary incapacitation; NFPA = 4 serious injury and exposure. d Safety rating: NFPA score 0 or 1 = instability score, no special hazards, flammable; 2 or 3 = instability score, a special hazard is used, flammable; 4 = instability score, flammable. e Environmental rating: 1 = <50 g; 2 = ≥50 g and ≤250 g; 3 = >250 g. *Flammable. | |||||||||
| SPME tips procedure used in this paper | • 100 μL of 10% NaOH | 3 | 0 | 0 | 3 | 1 | 3 | 0 (F*) | 1 |
| • 0.5 g NaCl | 1 | 0 | 0 | • The time required for evaporation was roughly 5 min and the volume was 75 μL per sample. • Agitation speed was 2000 rpm and total time was 70 min. • GC-MS | The volume of waste per sample was 1.6 mL (urine and chemicals) | ||||
| • 65 μL of MeOH | 1 | 3 | 0 | ||||||
• 10 μL of acidified methanol (1![[thin space (1/6-em)]](https://www.rsc.org/images/entities/char_2009.gif) : :![[thin space (1/6-em)]](https://www.rsc.org/images/entities/char_2009.gif) 9) 9) |
3 | 0 | 0 | ||||||
• 50 μL of PFPA and EtOAc (2![[thin space (1/6-em)]](https://www.rsc.org/images/entities/char_2009.gif) : :![[thin space (1/6-em)]](https://www.rsc.org/images/entities/char_2009.gif) 1) 1) |
3![[thin space (1/6-em)]](https://www.rsc.org/images/entities/char_2009.gif) : :![[thin space (1/6-em)]](https://www.rsc.org/images/entities/char_2009.gif) 2 2 |
0![[thin space (1/6-em)]](https://www.rsc.org/images/entities/char_2009.gif) : :![[thin space (1/6-em)]](https://www.rsc.org/images/entities/char_2009.gif) 3 3 |
0![[thin space (1/6-em)]](https://www.rsc.org/images/entities/char_2009.gif) : :![[thin space (1/6-em)]](https://www.rsc.org/images/entities/char_2009.gif) 0 0 |
||||||
| Total score | 13 | 6 | 0 | ||||||
| Total amount of chemicals used = 725 μL per sample | |||||||||
| SPE procedure 16 | • 4 mL of 0.10 M phosphate buffer – pH 6 | 1 | 0 | 0 | 3 | 1 | 3 | 0 (F) | 1 |
| • 1 mL of 100 mM acetic acid | 3 | 2 | 0 | • The time required for evaporation was (30–40 min) and the volume was 2.6 mL per sample. • SPE vacuum was used for 5 min. • Centrifuged for 10 min at 3000 rpm. • GC-MS | The volume of waste per sample was 18 mL (urine and chemicals) | ||||
| • 5 mL of MeOH | 1 | 3 | 0 | ||||||
• 3 mL of DCM![[thin space (1/6-em)]](https://www.rsc.org/images/entities/char_2009.gif) : :![[thin space (1/6-em)]](https://www.rsc.org/images/entities/char_2009.gif) IPA IPA![[thin space (1/6-em)]](https://www.rsc.org/images/entities/char_2009.gif) : :![[thin space (1/6-em)]](https://www.rsc.org/images/entities/char_2009.gif) NH4OH (78 NH4OH (78![[thin space (1/6-em)]](https://www.rsc.org/images/entities/char_2009.gif) : :![[thin space (1/6-em)]](https://www.rsc.org/images/entities/char_2009.gif) 20 20![[thin space (1/6-em)]](https://www.rsc.org/images/entities/char_2009.gif) : :![[thin space (1/6-em)]](https://www.rsc.org/images/entities/char_2009.gif) 2) 2) |
2![[thin space (1/6-em)]](https://www.rsc.org/images/entities/char_2009.gif) : :![[thin space (1/6-em)]](https://www.rsc.org/images/entities/char_2009.gif) 2 2![[thin space (1/6-em)]](https://www.rsc.org/images/entities/char_2009.gif) : :![[thin space (1/6-em)]](https://www.rsc.org/images/entities/char_2009.gif) 3 3 |
1![[thin space (1/6-em)]](https://www.rsc.org/images/entities/char_2009.gif) : :![[thin space (1/6-em)]](https://www.rsc.org/images/entities/char_2009.gif) 3 3![[thin space (1/6-em)]](https://www.rsc.org/images/entities/char_2009.gif) : :![[thin space (1/6-em)]](https://www.rsc.org/images/entities/char_2009.gif) 0 0 |
0![[thin space (1/6-em)]](https://www.rsc.org/images/entities/char_2009.gif) : :![[thin space (1/6-em)]](https://www.rsc.org/images/entities/char_2009.gif) 0 0![[thin space (1/6-em)]](https://www.rsc.org/images/entities/char_2009.gif) : :![[thin space (1/6-em)]](https://www.rsc.org/images/entities/char_2009.gif) 0 0 |
||||||
• 10 μL of acidified methanol (1![[thin space (1/6-em)]](https://www.rsc.org/images/entities/char_2009.gif) : :![[thin space (1/6-em)]](https://www.rsc.org/images/entities/char_2009.gif) 9) 9) |
3 | 0 | 0 | ||||||
• 50 μL of PFPA and EtOAc (2![[thin space (1/6-em)]](https://www.rsc.org/images/entities/char_2009.gif) : :![[thin space (1/6-em)]](https://www.rsc.org/images/entities/char_2009.gif) 1) 1) |
3![[thin space (1/6-em)]](https://www.rsc.org/images/entities/char_2009.gif) : :![[thin space (1/6-em)]](https://www.rsc.org/images/entities/char_2009.gif) 2 2 |
0![[thin space (1/6-em)]](https://www.rsc.org/images/entities/char_2009.gif) : :![[thin space (1/6-em)]](https://www.rsc.org/images/entities/char_2009.gif) 3 3 |
0![[thin space (1/6-em)]](https://www.rsc.org/images/entities/char_2009.gif) : :![[thin space (1/6-em)]](https://www.rsc.org/images/entities/char_2009.gif) 0 0 |
||||||
| Total score | 20 | 12 | 0 | ||||||
| Total amount of chemicals used = 13.6 mL per sample | |||||||||
| Overall | The total amount of chemicals consumed per sample using the SPME tip procedure decreased by approximately 95% compared to the total amount of chemicals consumed by SPE per sample | The variation and uncertainty values may be very high | SPME tip procedure decreased the waste by 91% compared to the SPE procedure per sample | The method of SPME tips decreased the harm by 35% compared to the harm that might be caused by using the SPE procedure | The method of SPME tips decreased the flammability compared to SPE by 50% | The above data obtained should be considered as estimation only | |||
Method validation
The results for all obtained validation parameters were successful for the observed analytes.The method was linear demonstrated by R2 which was always higher than 0.992 in the range of the LLOQ (at least ≥100 ng mL−1) for all compounds of interest.
The LODs ranged from 5 to 25 ng mL−1 for all the drugs investigated.
The LLOQ ranged from 25 to 100 ng mL−1 for all the substances tested.
Both the within and between run precision and accuracy were satisfactory with results in an acceptable range giving values lower than 15%.
No carryover was recognised for any of the stimulant analytes. No peak was observed from endogenous urine compounds in the blank for the interference study or from the 20 drugs tested in the selectivity study that affected the interpretation results in SIM mode. The outcome data to evaluate the method validation parameters are presented in Table 5.
| Compound name | (R2) | LOD S/N | LLOQ S/N | Conc. of the analyte | Within-run | Between-run | Compound name | (R2) | LOD S/N | LLOQ S/N | Conc. of the analyte | Within-run | Between-run | ||||
|---|---|---|---|---|---|---|---|---|---|---|---|---|---|---|---|---|---|
| RSD% | Bias% | RSD% | Bias% | RSD% | Bias% | RSD% | Bias% | ||||||||||
| Amphetamine | 0.999 | 5 | 25 | 250 | 3.78% | 1.17% | 2.34% | 1.33% | PMA | 0.997 | 5 | 25 | 250 | 13% | −0.34% | 4.28% | 0.03% |
| 750 | 6.3% | 0.91% | 2.20% | −0.93% | 750 | 9.8% | 3.04% | 1.65% | 1.24% | ||||||||
| 1500 | 2.61% | −0.66% | 1.97% | −0.70% | 1500 | 8.3% | −1.56% | 3.52% | −1.49% | ||||||||
| Methamphetamine | 0.997 | 5 | 25 | 250 | 7.9% | −0.08% | 3.40% | 0.87% | Mephedrone | 0.994 | 25 | 100 | 250 | 11% | 6.6% | 6.1% | 5.8% |
| 750 | 10% | 2.77% | 3.48% | 1.34% | 750 | 13% | −3.72% | 2.62% | −2.03% | ||||||||
| 1500 | 8.7% | −0.30% | 4.16% | −0.30% | 1500 | 15% | −6.9% | 2.73% | −4.11% | ||||||||
| Buphedrine (buphedrone metabolite) | 0.994 | 5 | 25 | 250 | 13% | 6.2% | 5.7% | 6.5% | MDMA | 0.995 | 10 | 50 | 250 | 12% | −2.15% | 6.3% | −0.57% |
| 750 | 7.9% | −1.82% | 4.30% | −2.21% | 750 | 12% | −1.10% | 4.30% | −2.59% | ||||||||
| 1500 | 9.7% | −2.30% | 5.8% | −1.61% | 1500 | 9.4% | −0.25% | 5.6% | −0.01% | ||||||||
| 4-Methylephedrine (mephedrone metabolite) | 0.992 | 10 | 100 | 250 | 13% | 2.95% | 11% | 2.17% | Pentylone | 0.999 | 5 | 25 | 250 | 5.8% | 2.78% | 5.5% | 3.59% |
| 750 | 9.9% | −4.16% | 3.56% | −5.6% | 750 | 7.4% | −0.24% | 2.20% | −2.34% | ||||||||
| 1500 | 12% | −5.4% | 7.0% | −4.45% | 1500 | 2.70% | −0.99% | 1.35% | −1.30% | ||||||||
The SPME PDMS/DVB fiber tip method was applied to real human samples (three cases) to confirm three positives of cathinone. The confirmation results of SPME tips were compared with the confirmation results of the validated SPE method. The positive results obtained from the case samples prove the ability of the method for the quantification and qualification of similar drugs such as cathinone compounds. The repeatability and reproducibility of the method with excellent selectivity and sensitivity were successfully demonstrated in the detection of the specimens. See Table 6 for the results.
| Serial & extraction method type | The average conc. for the validated method of SPE with ±SD | The average conc. for the new trends of SPME PDMS/DVB fibre tips with ±SD |
|---|---|---|
| Sample number 1 | 802 ± 32 | 806 ± 76 |
| Sample number 2 | 1209 ± 47 | 1201 ± 98 |
| Sample number 3 | 227 ± 30 | 285 ± 51 |
Conclusion
A clean, expedient, reliable and less costly procedure was developed and validated using urine samples for the determination of ATSs and cathinone groups. The method used minimum solvent to meet the requirements of green analytical chemistry with the evaluation of two procedures in the sample preparation stage. The final method included SPME fibre tips (PDMS/DVB) with a PFPA derivative providing an efficient extraction procedure followed by GC-MS analysis. The SPME fibre tip (PDMS/DVB) method can be used for the confirmation of eight substances with excellent repeatability and reproducibility. The sensitivity and selectivity of the technique were established for the determination and detection of the compounds concerned. The limits of quantitation were sufficient to quantify the positive of amphetamine, methamphetamine, PMA, MDMA, mephedrone, buphedrine, 4-methylephedrine and pentylone. The developed procedure delivers only one system to confirm the eight stimulant compounds including ATSs and designer cathinones in human urine specimens. Real urine case samples were applied for the confirmation test only. The specimens demonstrated the validity and the suitability of the method for routine analysis of toxicology forensic samples for the drugs mentioned and for the confirmation test only. The applicability of GC-MS in many laboratories worldwide enables this method to have the potential for widespread use.Conflicts of interest
There are no conflicts to declare.Acknowledgements
This work was gratefully supported by Forensic Medicine and Science, University of Glasgow, UK, and the Ministry of High Education of Saudi Arabia (I946). The authors would like to thank Dr Craig Aurand and Dr Denise Wallworth of Sigma Aldrich for the samples of SPME fibre tips.References
- EMCDDA, EU Drug Markets Report: In-depth Analysis, 2016 cited 2017, 21 November, http://www.emcdda.europa.eu/system/files/publications/2373/TD0216072ENN.PDF.
- UNODC, World Drug Report, 2016, https://www.unodc.org/documents/scientific/WORLD_DRUG_REPORT_2016_web.pdf.
- UNODC, global smart update, 2016 cited 2017, 15 December, https://www.unodc.org/documents/scientific/Global-SMARTUpdate-2016-vol-16.pdf.
- H. Torrance and G. Cooper, The detection of mephedrone (4-methylmethcathinone) in 4 fatalities in Scotland, Forensic Sci. Int., 2010, 202(1), e62–e63 CrossRef CAS PubMed.
- P. D. Maskell, et al., Mephedrone (4-methylmethcathinone)-related deaths, J. Anal. Toxicol., 2011, 35(3), 188–191 CrossRef CAS PubMed.
- K. J. Lusthof, et al., A case of extreme agitation and death after the use of mephedrone in The Netherlands, Forensic Sci. Int., 2011, 206(1), e93–e95 CrossRef PubMed.
- B. K. Logan, et al., Recommendations for toxicological investigation of drug-impaired driving and motor vehicle fatalities, J. Anal. Toxicol., 2013, bkt059 Search PubMed.
- K. Liveri, et al., A fatal intoxication related to MDPV and pentedrone combined with antipsychotic and antidepressant substances in Cyprus, Forensic Sci. Int., 2016, 265, 160–165 CrossRef CAS PubMed.
- P. Kriikku, et al., New designer drug of abuse: 3,4-methylenedioxypyrovalerone (MDPV). Findings from apprehended drivers in Finland, Forensic Sci. Int., 2011, 210(1), 195–200 CrossRef CAS PubMed.
- M. Wikström, et al., Two fatal intoxications with the new designer drug methedrone (4-methoxymethcathinone), J. Anal. Toxicol., 2010, 34(9), 594–598 CrossRef.
- M. Sykutera, M. Cychowska and E. Bloch-Boguslawska, A fatal case of pentedrone and α-pyrrolidinovalerophenone poisoning, J. Anal. Toxicol., 2015, 39(4), 324–329 CrossRef CAS PubMed.
- R. P. Belardi and J. B. Pawliszyn, The application of chemically modified fused silica fibers in the extraction of organics from water matrix samples and their rapid transfer to capillary columns, Water Qual. Res. J. Can., 1989, 24(1), 179–191 CAS.
- H. Kataoka, Recent developments and applications of microextraction techniques in drug analysis, Anal. Bioanal. Chem., 2010, 396(1), 339–364 CrossRef CAS PubMed.
- W. Figg and H. L. McLeod, Handbook of Anticancer Pharmacokinetics and Pharmacodynamics, Springer Science & Business Media, 2004 Search PubMed.
- G. Theodoridis, E. d. Koster and G. De Jong, Solid-phase microextraction for the analysis of biological samples, J. Chromatogr. B: Biomed. Sci. Appl., 2000, 745(1), 49–82 CrossRef CAS.
- K. A. Alsenedi and C. Morrison, Comparison of six derivatizing agents for the determination of nine synthetic cathinones using gas chromatography-mass spectrometry, Anal. Methods, 2017, 9(18), 2732–2743 RSC.
- A. Gałuszka, et al., Analytical Eco-Scale for assessing the greenness of analytical procedures, TrAC, Trends Anal. Chem., 2012, 37, 61–72 CrossRef.
- D. Raynie and J. L. Driver, Green assessment of Chemical Methods. In 13th Green Chem Conf., USA, 2009 Search PubMed.
- P. J. Dunn, The importance of green chemistry in process research and development, Chem. Soc. Rev., 2012, 41(4), 1452–1461 RSC.
- J. Płotka-Wasylka, A new tool for the evaluation of the analytical procedure: Green Analytical Procedure Index, Talanta, 2018, 181, 204–209 CrossRef PubMed.
| This journal is © The Royal Society of Chemistry 2018 |

