Application of a quantum cascade laser aperture scanning near-field optical microscope to the study of a cancer cell
Caroline I.
Smith
a,
Michele R. F.
Siggel-King
abc,
James
Ingham
a,
Paul
Harrison
a,
David S.
Martin
a,
Andrea
Varro
d,
D. Mark
Pritchard
d,
Mark
Surman
bc,
Steve
Barrett
 a and
Peter
Weightman
 *a
*a
aDepartment of Physics, Oliver Lodge Laboratory, University of Liverpool, Liverpool, L69 7ZE, UK. E-mail: peterw@liverpool.ac.uk
bCockcroft institute, Sci-Tech Daresbury, Warrington, WA4 4AD, UK
cAccelerator Science and Technology Centre (ASTeC), STFC Daresbury Laboratory, Sci-Tech Daresbury, Warrington, WA4 4AD, UK
dDepartment of Cellular and Molecular Physiology, Institute of Translational Medicine, University of Liverpool, Liverpool, L69 3GE, UK
First published on 31st August 2018
Abstract
This work reports the first images obtained by combining an infrared aperture scanning near-field optical microscope (SNOM) with a quantum cascade laser (QCL). The future potential of this set-up is demonstrated by a preliminary study on an OE33 human oesophageal adenocarcinoma cell in which the cell is imaged at 1751 cm−1, 1651 cm−1, 1539 cm−1 and 1242 cm−1. In addition to the 1651 cm−1 image, three other images were acquired within the Amide I band (1689 cm−1, 1675 cm−1 and 1626 cm−1) chosen to correspond to secondary structures of proteins. The four images obtained within the Amide I band show distinct differences demonstrating the potential of this approach to reveal subtle changes in the chemical composition of a cell.
Introduction
Oesophageal adenocarcinoma (OAC) has one of the fastest rising incidences in the western world1 and its precursor stages are frequently asymptomatic. By the time patients develop symptoms it is often too late for effective treatment2 hence there is a need to develop more accurate diagnostics. In the UK the crude incidence and mortality rates of oesophageal cancer were found to be 14 and 12.6 per 100![[thin space (1/6-em)]](https://www.rsc.org/images/entities/char_2009.gif) 000 population respectively by the GLOBOCAN 2012 project.3 The prevalence of Barrett's oesophagus, a condition which often progresses to OAC in the general population is difficult to quantify, but is estimated to be higher than 376 per 100
000 population respectively by the GLOBOCAN 2012 project.3 The prevalence of Barrett's oesophagus, a condition which often progresses to OAC in the general population is difficult to quantify, but is estimated to be higher than 376 per 100![[thin space (1/6-em)]](https://www.rsc.org/images/entities/char_2009.gif) 000.4 Patients with Barrett's oesophagus are 30–40 times more likely to develop OAC than the general public5 with around 0.5% of people with Barrett's oesophagus developing OAC per year.4 Consequently screening tissue from endoscopies with Barrett's oesophagus is a major focus of research into the development of improved diagnostics.
000.4 Patients with Barrett's oesophagus are 30–40 times more likely to develop OAC than the general public5 with around 0.5% of people with Barrett's oesophagus developing OAC per year.4 Consequently screening tissue from endoscopies with Barrett's oesophagus is a major focus of research into the development of improved diagnostics.
The gold standard for diagnosis is the analysis of specimens after a Haematoxylin and Eosin (H&E) stain, which highlights the deoxyribonucleic acid (DNA) and protein components of the tissue. The stained tissue is examined under an optical microscope by a trained histopathologists who must gauge the features of the tissue based on a loose collection of guidelines. This evaluation of dysplasia within Barrett's oesophagus is highly subjective and qualitative and as such is prone to inter- and intra-observer variability.6 Montgomery et al.2 found that for 138 patients, a group of 12 histopathologists reached a majority conclusion in only 99 cases (72%). The difficulty in reaching a reliable diagnosis is particularly problematic given the serious implications of misdiagnosis: a false positive leads to unnecessary and potentially dangerous surgery, while a false negative can lead to significant delays in treatment.
The standard diagnostic technique, described above, uses visible light. The use of infrared (IR) spectroscopy to study biological samples is well established and has the advantage over visible light that particular molecules and structures have characteristic fingerprints in the IR region enabling their identification. The established techniques of Fourier transform IR imaging (FTIR) and Raman spectroscopy have long been applied in the study of a number of cancers including breast cancer,7 colon cancer,8 prostate cancer,9 melanoma,10 brain tumours11 and many others. The wealth of information provided by IR spectroscopic techniques such as FTIR and Raman spectroscopy has made them a staple of biomedical research. The use of IR spectroscopy in the clinical environment has been the subject of recent reviews.12–15 However both these techniques have limited spatial resolution: FTIR is limited by diffraction12 and while Raman techniques can yield images with submicron spatial resolution this requires high intensity beams that can damage the specimen.16
Recently a number of scanning near-field techniques (often referred to as SNOM) have been developed to yield IR images with high spatial resolution though time constraints mean that images can only be obtained over a small number of wavelengths. The principal SNOM techniques are (i) photothermal imaging, which uses a sharp tip to record changes in the local thermal expansion of a specimen under IR illumination,17,18 (ii) scattering scanning near-field optical microscopy (s-SNOM), which employs a detector phase locked to an oscillating sharp tip16,19 and (iii) aperture SNOM,20–26 which collects and detects the light directly under an aperture tip. The latter is the only technique that has been shown to have the potential to reveal information on the three dimensional variation of the chemical composition within a specimen.26
Recent applications of the aperture SNOM technique to the study of cancer employed an accelerator based IR free electron laser (FEL),23–26 which is an intense source that is continuously tuneable over a range of wavelengths. In this work the IR-FEL has been replaced by a quantum cascade laser (QCL). QCLs have previously been used in s-SNOM16,19 and far-field IR studies of cancer.27 The QCL used in this work has a narrower IR bandwidth than the IR-FEL employed previously. This has made it possible to obtain images with high spatial resolution of an OE33 oesophageal adenocarcinoma cell at a number of closely spaced wavelengths over the Amide I band (∼1650 cm−1) in order to assess the potential of this approach to reveal detailed information on the chemical structure of a cell.
Experimental
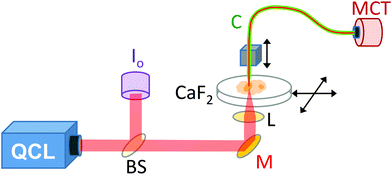
A demonstration model Block Engineering Inc. LaserTune™ QCL, provided by Ash Scientific Ltd, was used for these studies. The QCL covered the wavelength range of approximately 1852 to 770 cm−1 (5.4 to 13.0 μm) and was used without additional cooling. The QCL was run in pulse mode at a repetition rate of 100 kHz. The intensity was controlled by altering the pulse duration, which was set to 30 ns for 1751–1650 cm−1, 50 ns for 1626–1539 cm−1 and 100 ns for 1242 cm−1. The wavelength calibration of the QCL was checked using a polystyrene calibration film from National Institute of Standards and Technology (NIST) by scanning the QCL wavelength whilst recording the transmitted signal. For SNOM imaging (Fig. 1) the IR light was split by a CaF2 beam-splitter so that approximately 80% went to the SNOM and 20% was used as a reference signal (Io). The Io signal was mechanically chopped at a rate of ∼40 Hz, before being monitored with a pyroelectric power meter (Gentec-EO, Oregon, USA). The output of the power meter was fed into a lock-in amplifier (Stanford Research Systems, Sunnyvale, USA), phase referenced to the chopper, to provide a voltage level proportional to the QCL output. A mirror deflected the main SNOM light upwards to a small 10 mm diameter IR polished bi-convex zinc selenide lens (Crystran Ltd, Poole, UK) of focal length 10 mm at 7 μm wavelength. The lens was mounted on a xyz translator and its position was optimised for each wavelength setting by maximising the light detected through the SNOM fibre.The SNOM apparatus used in this and previous work24,26 comprised an aperture IR-SNOM mounted onto an Olympus inverted optical microscope, which was used to locate the specific areas of interest on the sample and to position them within the SNOM scan area.24,26 The slide containing the sample was mounted on the x–y (horizontal) piezo scanning stage of the SNOM. The IR-transmitting fibre used was a 6 μm core diameter chalcogenide fibre (CorActive, Quebec, Canada), with an apertured tip (etched and gold-coated28), mounted onto the vertical z-piezo stage. The sample was then rastered under the tip (using shear-force feedback to keep the tip-to-sample distance constant) at a rate of 20 pixels per second. The signal was collected by the aperture fibre in the near-field region above the specimen. A liquid nitrogen cooled mercury–cadmium–telluride (MCT) detector was used to detect the IR-light that was transmitted through the fibre at each pixel. The repetition rate of the QCL was limited to 100 kHz to allow full recovery of the MCT and its pre-amplifier following each pulse. A lock-in amplifier (Signal Recovery, Oak Ridge, USA) phase referenced to the QCL pulse, was used to detect the signal. The data acquisition sampled the output of the lock-in amplifier before advancing the SNOM tip. Good signal-to-noise was achieved with a lock-in time constant of 10 ms, enabling accurate tracking of the signal given the SNOM tip step period of 50 ms. The topography (height of the sample) and the Io signals were collected concomitantly with the SNOM light signal.
The IR-SNOM images were pre-processed to reduce noise, interference effects and correct for non-linearity of the piezoelectric drives before proceeding to image analysis as described previously.26 The images were firstly processed using Gwyddion.29 For some images, Fourier filtering30 was used to reduce noise levels (without reducing image quality). Other image processing techniques such as line-levelling and x–y tilt were also applied as appropriate. The images were then co-registered using the topography and cropped to a common area (120 μm × 83 μm). Finally the images were corrected for the non-linearity of the x–y stage of the piezoelectric drives.
While the QCL aperture SNOM technique is not expected to be sensitive to the mechanical interactions between the specimen and the tip, that are known to influence the s-SNOM technique,31 it is sensitive to a number of factors which have been described in detail for the visible region by Hecht et al.32 The observed noise in the images of 5% has two main contributions: detector noise and scanning tip noise both of which are estimated at ∼3%. Other sources of noise such as the pulse-to-pulse stability of the QCL are negligible by comparison.
The cell chosen for imaging was selected from a culture of OE33 human Caucasian oesophageal adenocarcinoma cells obtained from HPA Culture Collections (Sigma, Dorset, UK). The cells were maintained as previously described26 and removed from the culture, rinsed and air-dried prior to imaging.
Results and discussion
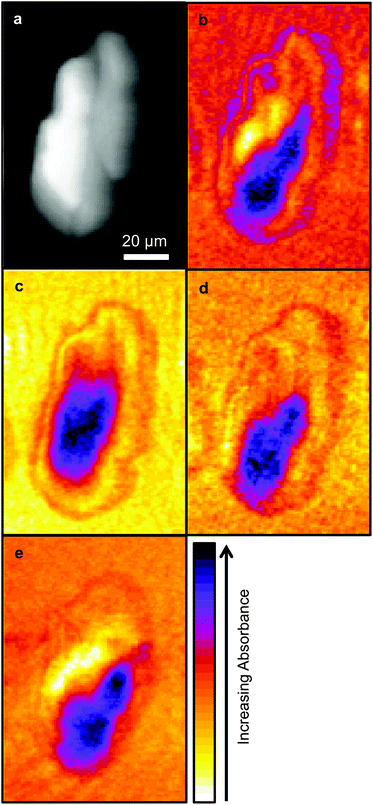
Due to time limitations images are usually only collected at a limited number of wavelengths with SNOM techniques, hence the choice of wavelengths are important. In this work images were collected at the wavelengths chosen in previous studies: 1751 cm−1, considered to be characteristic of lipids, the Amide I and Amide II bands centred on 1651 cm−1 and 1539 cm−1 respectively, and 1242 cm−1 which is associated with nucleic acids. These images are shown in Fig. 2.As in the previous SNOM study of a different OE33 cell27 the images obtained at 1751 cm−1, 1651 cm−1, 1539 cm−1 and 1242 cm−1 were compared with the topographic image (Fig. 2) using a pixel cross-correlation procedure. This involved comparing pixel values, for all pixels in the images, at equivalent coordinates between pairs of images to quantify the degree of similarity, or lack of similarity, of the images. This required each image to be co-registered, which was achieved using the near-identical topography images acquired at each wavelength. Each pair-wise comparison of images produces a correlation coefficient equal to +1 for two perfectly correlated (identical) images, −1 for two anticorrelated images (where the pixel values of one are the inverse of the other) and zero for two images for which the pixel values have no relation to each other. This study confirmed the previous finding that the topography makes only a small contribution to the SNOM images, which are essentially determined by the chemical structure of the cell.26
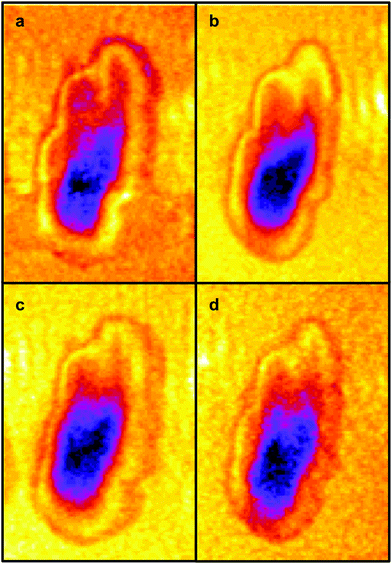
It is generally agreed that the major contributions to the Amide I band at ∼1650 cm−1 arise from the secondary structure of proteins and that this has overlapping contributions from parallel and anti-parallel β-sheets, the α-helices and disordered structures (sometimes referred to as random coils), the relative contributions of which vary significantly with the protein.33,35Fig. 3 is derived from the results of Susi and Byler33,34 which represents the Amide I contribution as the envelope of four Gaussians (Fig. 3) associated, from left to right in Fig. 3, with anti-parallel β-sheets, disordered structures, α-helices and parallel β-sheets. The narrow bandwidth of the QCL, 2 cm−1 compared to 20 cm−1 of the IR-FEL, made it possible to obtain images at four wavelengths across the Amide I band, 1689 cm−1, 1675 cm−1, 1651 cm−1 and 1626 cm−1 as indicated by the dashed lines in Fig. 3. These images are shown in Fig. 4.
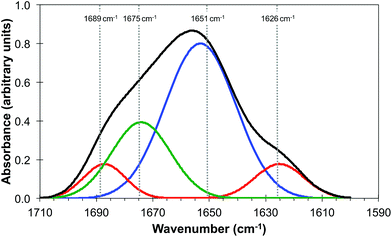 | ||
| Fig. 3 Amide I band of protein (black line) showing the individual contributions of parallel and anti-parallel β-sheets (red line), α-helices (blue line) and disordered structures (green line). Adapted from http://jenalib.leibniz-fli.de/ImgLibDoc/ftir/IMAGE_FTIR.html.35 | ||
It should be noted that Fig. 3 is only used to demonstrate the potential of this technique to reveal information on the chemical structure of cells with high spatial resolution. In reality IR images of cells and tissue in the Amide I region will also include contributions from lipids, nucleic acids and other biomolecules. The QCL aperture SNOM technique, in combination with the pixel cross-correlation analysis, has the potential to characterise such contributions to the chemical structure of cells and tissue by detailed comparisons of images obtained at a wider range of wavelengths.
The four images all have the same gross features – some absorbance around the edge of the cell and a maximum absorbance in a region close to the geometric centre of the cell (offset from the maximum height of the cell seen in the topography images). As a consequence, the values found for the correlation coefficients for each of the six pair-wise comparisons between the four images were all in the narrow range of ∼0.8–0.9. To give better discrimination between the images, and so highlight similarities and differences, the pixel cross-correlations were calculated over a restricted range of pixels close to the absorption maxima. Fig. 5 shows this range for each image as a black rectangle, and the colours used to denote the absorption variation in the images have been adjusted to make the absorption differences between the images easier to see. The six correlation coefficients calculated over these areas now cover the range ∼0.25–0.75 and thus provide much better discrimination. To verify that these coefficients are meaningful, and not a consequence of random differences between the images, correlation coefficients were calculated between pairs of images acquired during the forward scans (shown in Fig. 4) and the backward scans (not shown) of the SNOM tip. For each of the four pairs, the correlation coefficient was found to be 0.94 ± 0.02. The difference between these values and unity indicates that random or systematic noise between images can be expected to be ∼0.06. Hence, correlation coefficients in the range 0.25–0.75 are significantly less than unity and are interpreted as indicating real differences between the images. The smallest correlation coefficients shown in Table 1 are found between the image acquired at 1651 cm−1 (α-helices) and the other images. The largest correlation coefficients are found between the image acquired at 1675 cm−1 (disordered structures) and the other images. The significance of these results is that they demonstrate that by exploiting the narrow bandwidth of the QCL it is possible to obtain SNOM images that reveal detailed information on the secondary structure of the proteins and potentially other contributions to the chemical structure of a cell.
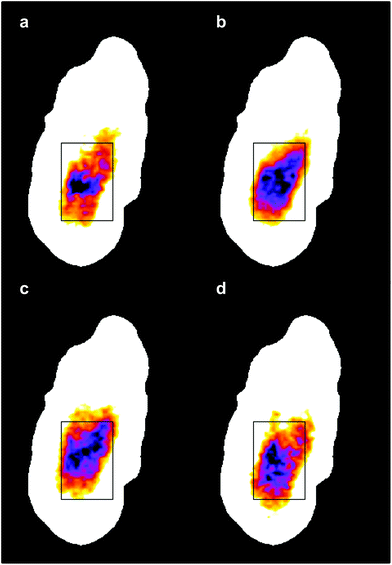 | ||
| Fig. 5 The same IR-SNOM images as shown in Fig. 4, but with the colour lookup table adjusted to make the absorption differences in the central region of the cell easier to see. The black rectangles show the region used to calculate pixel cross-correlation coefficients (see text). | ||
| 1689 cm−1 | 1675 cm−1 | 1651 cm−1 | 1626 cm−1 | |
|---|---|---|---|---|
| 1689 cm−1 | 1.00 | 0.76 | 0.47 | 0.64 |
| 1675 cm−1 | 0.76 | 1.00 | 0.59 | 0.68 |
| 1651 cm−1 | 0.47 | 0.59 | 1.00 | 0.23 |
| 1626 cm−1 | 0.64 | 0.68 | 0.23 | 1.00 |
The capability to obtain images in the IR with both high spatial and high spectral resolution makes it possible to study changes in the physical and chemical structure of cells and tissue that give rise to disease. In particular it will be possible to study the abnormalities in chromosomes that play a fundamental role in many human diseases36 including cancer.37,38 The technique also has the spectral and spatial resolution needed to reveal the presence and chemical structure of the microvesicle in cancer cells that play a role in the metastatic spread of cancer,39 are a pathway for the suppression of the immune system40 and offer new therapeutic opportunities.41
Conclusions
This work reports the first use of a QCL coupled to an aperture IR-SNOM. This instrument has the capability of yielding images with a spatial resolution significantly better than the diffraction limit, with the advantage of using a convenient and cost effective benchtop source and benefits from the narrower spectral bandwidth of the QCL. The potential of the instrument to yield insight into human disease is demonstrated by the observation of differences in the chemical composition of an OE33 cell from the analysis of images obtained at several wavelengths within the Amide I band.Conflicts of interest
There are no conflicts to declare.Acknowledgements
This work was supported by the UK Engineering and Physical Sciences Research Council (UK EPSRC: Grant No. EP/K023349/1). JI acknowledges support from an EPSRC PhD studentship. We acknowledge the support of Antonio Cricenti and Marco Luce (Istituto di Struttura della Materia, CNR, Rome, Italy) for their experimental guidance and help in developing and maintaining the SNOM instrument. We also acknowledge the support of Harish Sinha, of Ash Scientific Ltd who as a co-investigator on an MRC Proximity to Discovery Award made the QCL laser available for this research.References
- D. Forman, Aliment. Pharmacol. Ther., 2004, 20, 55 CrossRef PubMed.
- E. Montgomery, J. R. Goldblum, J. K. Greenson, M. M. Haber, L. W. Lamps, G. Y. Lauwers, A. J. Lazenby, D. N. Lewin, M. E. Robert, K. Washington, M. L. Zahurak and J. Hart, Hum. Pathol., 2001, 32, 379 CrossRef PubMed.
- GLOBOCAN 2012 v1.0 – Cancer Incidence and Mortality Worldwide: IARC Cancer – Base No. 11, available viahttp://globocan.iarc.fr/Default.aspx, accessed on 22-10-2016.
- P. Sharma and E. I. Sidorenko, Gut, 2005, 54, i27 CrossRef PubMed.
- V. Conteduca, D. Sansonno, G. Ingravallo, S. Marangi, S. Russi, G. Lauletta and F. Dammacco, Int. J. Oncol., 2012, 41, 414 CrossRef PubMed.
- R. D. Odze, J. Clin. Pathol., 2006, 59, 1029 CrossRef PubMed.
- M. Meurens, J. Wallon, J. Tong, H. Noel and J. Haot, Vib. Spectrosc., 1996, 10, 341 CrossRef.
- R. K. Sahu, S. Argov, S. Walsch, E. Bogomolny, R. Moreh and S. Mordechai, Analyst, 2010, 135, 538 RSC.
- M. J. Baker, E. Gazi, M. D. Brown, J. H. Shanks, P. Gardner and N. W. Clarke, Br. J. Cancer, 2008, 99, 1859 CrossRef PubMed.
- Z. Hammody, S. Argov, R. K. Sahu, E. Cagnano, R. Moreh and S. Mordechai, Analyst, 2008, 133, 372 RSC.
- K. Gajjar, L. D. Heppenstall, W. Pang, K. M. Ashton, J. Trevisan, I. I. Patel, V. Llabjani, H. F. Stringfellow, P. L. Martin-Hirsch, T. Dawson and F. L. Martin, Anal. Methods, 2012, 5, 89 RSC.
- M. Pilling and P. Gardner, Chem. Soc. Rev., 2016, 45, 1935 RSC.
- M. J. Baker, H. J. Byrne, J. Chalmers, P. Gardner, R. Goodacre, A. Henderson, S. G. Kazarian, F. L. Martin, J. Moger, N. Stone and J. Sulé-Suso, Analyst, 2018, 143, 1735 RSC.
- S. De Bruyne, M. M. Speeckert and J. R. Delanghe, Crit. Rev. Clin. Lab. Sci., 2018, 55, 1 CrossRef PubMed.
- T. P. Wrobel and R. Bhargava, Anal. Chem., 2018, 90, 1444 CrossRef PubMed.
- H. Amrania, L. Drummond, R. C. Coombes, S. Shousha, L. Woodley-Barker, K. Weir, W. Hart, I. Cartera and C. C. Phillips, Faraday Discuss., 2016, 187, 539 RSC.
- A. Dazzi, R. Prazeres, F. Glotin and J. M. Ortega, Opt. Lett., 2005, 30, 2388 CrossRef PubMed.
- P. M. Donaldson, C. S. Kelly, M. D. Frogley, J. Filik, K. Wehbe and G. Cinque, Opt. Express, 2016, 24, 1852 CrossRef PubMed.
- E. Yoxall, M. Navarro-Cia, M. Rahmani, S. A. Maier and C. C. Phillips, Appl. Phys. Lett., 2013, 103, 213110 CrossRef.
- B. Hecht, B. Sick, U. P. Wild, V. Deckert, R. Zenobi, O. J. F. Martin and D. W. Pohl, J. Chem. Phys., 2000, 112, 7761 CrossRef.
- A. Cricenti, R. Generosi, M. Luce, P. Perfetti, G. Margaritondo, D. Talley, J. S. Sanghera, I. D. Aggarwal and N. H. Tolk, Phys. Chem. Chem. Phys., 2002, 4, 2738 RSC.
- A. Cricenti, R. Generosi, M. Luce, P. Perfetti, G. Margaritondo, D. Talley, J. S. Sanghera, I. D. Aggarwal, N. H. Tolk, A. Congo-Castellano, M. A. Rizzo and D. W. Piston, Biophys. J., 2003, 85, 2705 CrossRef PubMed.
- A. D. Smith, M. R. F. Siggel-King, G. M. Holder, A. Cricenti, M. Luce, P. Harrison, D. S. Martin, M. Surman, T. Craig, S. D. Barrett, A. Wolski, D. J. Dunning, N. R. Thompson, Y. Saveliev, D. M. Pritchard, A. Varro, S. Chattopadhyay and P. Weightman, Appl. Phys. Lett., 2013, 102, 053701 CrossRef.
- D. E. Halliwell, C. L. M. Morais, K. M. G. Lima, J. Trevisan, M. R. F. Siggel-King, T. Craig, J. Ingham, D. S. Martin, K. A. Heys, M. Kyrgiou, A. Mitra, E. Paraskevaidis, G. Theophilou, P. L. Martin-Hirsch, A. Cricenti, M. Luce, P. Weightman and F. L. Martin, Sci. Rep., 2016, 6, 29494 CrossRef PubMed.
- T. Craig, A. D. Smith, G. M. Holder, J. Ingham, C. I. Smith, A. Varro, D. M. Pritchard, S. Barrett, D. S. Martin, P. Harrison, A. Wolski, A. Cricenti, M. Luce, M. Surman, S. Chattopadhyay, P. Weightman and M. R. F. Siggel-King, Phys. Status Solidi B, 2018, 255, 1700518 CrossRef.
- J. Ingham, M. J. Pilling, T. Craig, M. R. F. Siggel-King, C. I. Smith, P. Gardner, A. Varro, D. M. Pritchard, S. D. Barrett, D. S. Martin, P. Harrison, P. Unsworth, J. D. Kumar, A. Wolski, A. Cricenti, M. Luce, M. Surman, Y. M. Saveliev and P. Weightman, Biomed. Phys. Eng. Express, 2018, 4, 025011 CrossRef.
- M. J. Pilling, A. Henderson, B. Bird, M. D. Brown, N. W. Clarke and P. Gardner, Faraday Discuss., 2016, 187, 135 RSC.
- M. A. Unger, D. A. Kossakovski, R. Kongovi, J. L. Beauchamp, J. D. Baldeschwieler and D. V. Palaanker, Rev. Sci. Instrum., 1998, 69, 2988 CrossRef.
- D. Necas and P. Klapetek, Cent. Eur. J. Phys., 2012, 10, 181 Search PubMed http://gwyddion.net .
- R. Heilbronner and S. Barrett, Image Analysis in Earth Sciences: Microstructures and Textures of Earth Materials (Lecture Notes in Earth Sciences), Springer, Berlin, 2014 Search PubMed.
- S. Kenkel, A. Mittal, S. Mittal and R. Bhargava, Anal. Chem., 2018, 90, 8845 CrossRef PubMed.
- B. Hecht, B. Sick, U. P. Wild, V. Deckert, R. Zenobi, O. J. F. Martin and D. W. Pohl, J. Chem. Phys., 2000, 112, 7761 CrossRef.
- D. M. Byler and H. Susi, Biopolymers, 1986, 25, 469 CrossRef PubMed.
- H. Susi and D. M. Byler, Methods Enzymol., 1986, 130, 290 Search PubMed.
- http://jenalib.leibniz-fli.de/ImgLibDoc/ftir/IMAGE_FTIR.html , accessed on 05-06-2018.
- A. Theisen and L. G. Shaffer, Appl. Clin. Genet., 2010, 3, 159 Search PubMed.
- J. D. Rowley, Cancer Genet. Cytogenet., 1980, 2, 175 CrossRef.
- S. Fröhling and H. Döhner, N. Engl. J. Med., 2008, 359, 722 CrossRef PubMed.
- A. S. Asfar, B. Bao and F. H. Sarkar, Cancer Metastasis Rev., 2013, 32, 623 CrossRef PubMed.
- H. G. Zhang and W. E. Grizzel, Clin. Cancer Res., 2011, 17, 959 CrossRef PubMed.
- S. E. L. Andaloussi, I. Mäger, X. O. Breakefield and M. J. A. Wood, Nat. Rev. Drug Discovery, 2013, 12, 347 CrossRef PubMed.
| This journal is © The Royal Society of Chemistry 2018 |

