 Open Access Article
Creative Commons Attribution 3.0 Unported Licence
Bond breakage under pressure in a metal organic framework†
Zhi
Su‡
ab,
Yu-Run
Miao‡
a,
Guanghui
Zhang
 c,
Jeffrey T.
Miller
 c and
Kenneth S.
Suslick
 *a
*a
aDepartment of Chemistry, University of Illinois at Urbana-Champaign, Urbana, Illinois 61801, USA. E-mail: ksuslick@illinois.edu
bSchool of Chemistry and Materials Science, Nanjing Normal University, Nanjing, Jiangsu 210023, P. R. China
cDavidson School of Chemical Engineering, Purdue University, West Lafayette, Indiana 47907, USA
First published on 9th October 2017
Abstract
The internal free volume of porous materials diminishes upon mechanical compression, and such volume collapse can have chemical consequences. We report here the endothermic bond breakage in a metal-organic framework (MOF) during compression-induced collapse. Upon bulk compression at 1.9 GPa, the effective number for Zr–O bonds between Zr(IV) ions and carboxylate groups in UiO-66 decreased from 4.0 to 1.9, as determined by EXAFS, and the internal free volume was synchronously collapsed. Consistent with the EXAFS data, IR spectra confirmed conversion of syn–syn bridging carboxylates to monodentate ligation, thus establishing mechanochemical reactions induced by external compression of MOFs. Substantial mechanical energy (∼4 kJ g−1) was absorbed by UiO-66 nanocrystals during compression, as demonstrated from nanocompression of single crystals (600 nm) in situ during scanning electron microscopy, which establishes the potential application of MOFs as mechanical energy absorbers for hydrostatic and shock compression.
Introduction
The internal free volume of porous materials diminishes upon exposure to mechanical compression, with potential chemical consequences.1,2 Compared to traditional inorganic porous materials (e.g., zeolites), metal organic frameworks (MOFs) can have much larger pore sizes and surface areas.3,4 The effects of pressure, compressional collapse, and the mechanochemistry5–10 of MOFs, however, have been little studied,11–17 whereas their promising applications in gas storage, separation and catalysis18–20 have been extensively explored over the past decade. When MOFs are subjected to strong compression, large negative ΔV and positive ΔS are expected due to the collapse of its internal free volume and the loss of crystallinity.13–15,21 Thus, one may speculate14,22,23 that MOFs might function as lightweight protective materials to absorb mechanical energy from shockwaves by their collapse and by endothermic bond breakage during their collapse.In a prior study of a relatively compact framework solid (the Zn-imidazolate system called ZIF-8), we found that ZIF-8 lost porosity and long range order upon compression at ∼2 GPa, while its local structure around the bridging Zn ion (ZnN4) was maintained.13 In contrast to ZIF-8, we have now discovered with the more expansive structure of UiO-66,24 the first compression-induced endothermic bond breakage in MOF systems. Specifically, upon bulk compression of UiO-66 (Fig. 1) at 1.9 GPa, the effective number for Zr–O coordination bonds between Zr(IV) ions and carboxylate groups decreased by half and substantial mechanical energy was absorbed in the amorphization process.
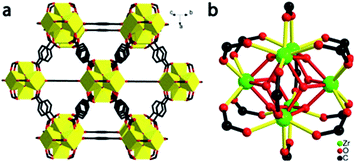 | ||
| Fig. 1 Structure of UiO-66. (a) Extended 3D structure, showing the bridging terephthalates ligated to zirconia clusters. (b) Coordination geometry around the Zr6O4(OH)4(O2CR)12 clusters. | ||
Materials and methods
Synthesis of UiO-66 nanocrystals
UiO-66 nanocrystals were prepared using a previously reported method with some modifications.25 ZrCl4 (93 mg, 0.4 mmol) and terephthalic acid (67 mg, 0.04 mmol) were separately dissolved into 10 mL DMF. Acetic acid (2.8 mL, 50 mmol) was first added to the DMF solution of terephthalic acid with stirring, and the mixture was then poured into the DMF solution containing ZrCl4. The final mixture was transferred to a 100 mL Pyrex bottle and heated in oven at 120 °C for 24 h. The solid product was collected through centrifugation and washed twice with DMF and methanol, respectively. The product was immersed in methanol overnight to exchange remaining guest DMF solvates with methanol. After centrifugation, the product was heated to 200 °C under vacuum for 10 hours to fully remove all guest solvates. Desolvated UiO-66 was placed in a desiccator over CaSO4 until used; samples were shipped also over CaSO4 to prevent water sorption. TGA confirmed complete desolvation and the absence of sorbed methanol or water (ESI, Fig. S1†).Sample preparation and piston compression measurements
50 mg desolvated UiO-66 nanocrystals were placed in a 13 mm diameter die and vertically compressed by a hydraulic piston pelletizer (up to 25 ton load, i.e., 1.9 GPa). After compression, UiO-66 crystals became pressed pellets. After releasing the pressure, the pellets were characterized by FT-IR, PXRD, XAS and BET analysis.Flat punch nanocompression experiment
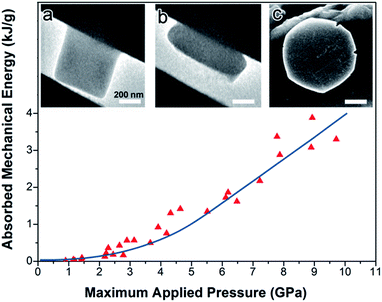
For the in situ TEM nanocompression experiments, an individual desolvated UiO-66 nanocrystal was placed on the silicon wedge holder with a ∼1.0 μm flat face. The UiO-66 nanocrystal was positioned on the 111 facet (i.e., diamond shaped projection). The punch (a flat square surface with a 2 μm edge length) compressed the crystal at 1 nm s−1 under displacement control mode. The morphological change was filmed by video TEM and correlated to the displacement of the piston. The applied force and the displacement of the piston were recorded by the transducer. Each data point in Fig. 6 represents a single experiment on a single nanocrystal; some of the scatter derives from the minor differences in size and contact surface among the nanocrystals; the smooth line is meant only as a guide to the eye.Instrumentation
Scanning electron microscopy (SEM) was performed using a Hitachi S-4800 field emission microscope at an accelerating voltage of 10 kV. The samples were prepared on Si wafers, then sputtered with a very thin layer of Au/Pd. BET surface area measurements were performed with a Nova 2200e, Quantachrome Instruments. FT-IR was performed on a Perkin-Elmer SpectrumBX instrument fitted a SensIR Technologies DuraSampleIR II ATR unit. Transmission electron microscopy (TEM) was performed on a 200 kV JEOL LaB6 TEM. The in situ video was captured using a Hysitron PI95 TEM Picoindenter accessory, Hysitron Corporation, Minneapolis, MN.XANES and EXAFS data collection and analysis
X-ray absorption measurements were acquired on the bending magnet beam line of the Materials Research Collaborative Access Team (MRCAT, sector 10) at the Advanced Photon Source, Argonne National Laboratory. Photon energies were selected using a water-cooled, double-crystal Si(111) monochromator, which was detuned by approximately 50% to reduce harmonic reflections. Measurements were made in transmission mode using 25 vol% argon with 75 vol% nitrogen in the incident ionization chamber (10% absorption at 18![[thin space (1/6-em)]](https://www.rsc.org/images/entities/char_2009.gif) 300 eV) and a mixture of ca. 95 vol% argon with 5 vol% nitrogen in the transmission ionization chamber (30% absorption at 18
300 eV) and a mixture of ca. 95 vol% argon with 5 vol% nitrogen in the transmission ionization chamber (30% absorption at 18![[thin space (1/6-em)]](https://www.rsc.org/images/entities/char_2009.gif) 300 eV). Data points were acquired in six separate regions (energies relative to the elemental Zr K-edge 17
300 eV). Data points were acquired in six separate regions (energies relative to the elemental Zr K-edge 17![[thin space (1/6-em)]](https://www.rsc.org/images/entities/char_2009.gif) 998 eV): a pre-edge region (−250 to −50 eV, step size = 10 eV, dwell time = 0.1 s), a second pre-edge region (−50 to −20 eV, step size = 2 eV, dwell time = 0.1 s), the XANES region (−20 to +30 eV, step size = 0.3 eV, dwell time = 0.3 s), an initial EXAFS region (+30 eV (2.80 Å−1) to 6 Å−1, step size = 0.07 Å−1, dwell time = 0.5 s), a second EXAFS region (6 Å−1 to 9 Å−1, step size = 0.07 k, dwell time = 1.0 s) and the final EXAFS region (9 Å−1 to 13 Å−1, step size = 0.07 k, dwell time = 1.5 s). The detector settling time was 0.1 s prior to each measurement with a beam size of 1.5 mm × 0.5 mm. Each sample (5.0 mg) was mixed with SiO2 (25 mg), and then the mixture was grinded well with mortar and pestle. 30 mg of the mixture was pressed into a cylindrical sample holder consisting of six wells with a radius of 2.0 mm, forming a self-supporting wafer. The sample holder was placed in a quartz tube (1-in. OD, 10-in. length) sealed with Kapton windows by two Ultra-Torr fittings and then used for transmission mode measurement. The edge energy of the X-ray absorption near edge structure (XANES) spectrum was determined from the inflection point in the edge, i.e., the maximum in the first derivative of the XANES spectrum. Background removal and normalization procedures were carried out using the Demeter software package 0.9.24 using standard methods of Athena. Standard procedures based on Artemis software were used to extract the extended X-ray absorption fine structure (EXAFS) data. The crystal structure (CCDC 733458) of UiO-66 was used as the fitting model, and the amplitude reduction factor was obtained by fixing the coordination number of the uncompressed UiO-66. The same amplitude reduction factor was then used to fit the compressed samples. The coordination parameters were obtained by a least square fit in R-space of the nearest neighbor, k2-weighted Fourier transform data. The data fit equally well with either k1 or k3 weightings.
998 eV): a pre-edge region (−250 to −50 eV, step size = 10 eV, dwell time = 0.1 s), a second pre-edge region (−50 to −20 eV, step size = 2 eV, dwell time = 0.1 s), the XANES region (−20 to +30 eV, step size = 0.3 eV, dwell time = 0.3 s), an initial EXAFS region (+30 eV (2.80 Å−1) to 6 Å−1, step size = 0.07 Å−1, dwell time = 0.5 s), a second EXAFS region (6 Å−1 to 9 Å−1, step size = 0.07 k, dwell time = 1.0 s) and the final EXAFS region (9 Å−1 to 13 Å−1, step size = 0.07 k, dwell time = 1.5 s). The detector settling time was 0.1 s prior to each measurement with a beam size of 1.5 mm × 0.5 mm. Each sample (5.0 mg) was mixed with SiO2 (25 mg), and then the mixture was grinded well with mortar and pestle. 30 mg of the mixture was pressed into a cylindrical sample holder consisting of six wells with a radius of 2.0 mm, forming a self-supporting wafer. The sample holder was placed in a quartz tube (1-in. OD, 10-in. length) sealed with Kapton windows by two Ultra-Torr fittings and then used for transmission mode measurement. The edge energy of the X-ray absorption near edge structure (XANES) spectrum was determined from the inflection point in the edge, i.e., the maximum in the first derivative of the XANES spectrum. Background removal and normalization procedures were carried out using the Demeter software package 0.9.24 using standard methods of Athena. Standard procedures based on Artemis software were used to extract the extended X-ray absorption fine structure (EXAFS) data. The crystal structure (CCDC 733458) of UiO-66 was used as the fitting model, and the amplitude reduction factor was obtained by fixing the coordination number of the uncompressed UiO-66. The same amplitude reduction factor was then used to fit the compressed samples. The coordination parameters were obtained by a least square fit in R-space of the nearest neighbor, k2-weighted Fourier transform data. The data fit equally well with either k1 or k3 weightings.
Results and discussion
Crystal structure and preparation of UiO-66
The structure of UiO-66 (Fig. 1) has octahedral Zr6O4(OH)4 clusters that are syn–syn bridged by 12 carboxylate groups from bridging terephthalates.24 The Zr6-octahedra are capped alternatively by μ3-O or μ3-OH groups, which connect each Zr(IV) to four other Zr(IV), with a Zr⋯Zr distance of 3.513(1) Å. There are two types of Zr–O bonds in UiO-66: the Zr–carboxylate (Zr–OCOO, 2.232(2) Å) and the Zr-bridging O/OH (Zr–Oμ3-O, 2.108(3) Å).UiO-66 nanocrystals were synthesized by a solvothermal method and desolvated, as per prior literature with minor modification.25 The UiO-66 nanocrystals have a well-defined octahedral morphology with an average size of 600 nm (ESI, Fig. S2†). Desolvated UiO-66 (50 mg) was placed in a 13 mm diameter stainless steel die and axially compressed by a hydraulic piston pelletizer at applied pressures up to 1.9 GPa; after release of the applied load, irreversible changes in morphology and substantial amorphization were observed (Fig. 2 and S3†). The UiO-66 nanocrystals underwent deformation and agglomeration with increasing applied pressure, converting from an initially well-defined octahedral morphology to irregular flattened agglomerates (Fig. 2).
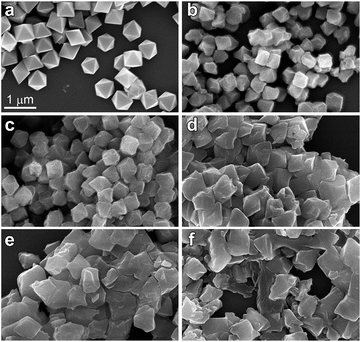 | ||
| Fig. 2 SEM images of UiO-66 nanocrystals (a) as prepared, and after applied compressive pressures of (b) 0.4 GPa, (c) 0.8 GPa, (d) 1.1 GPa, (e) 1.5 GPa, and (f) 1.9 GPa. | ||
Characterization of UiO-66 after compression and release
The BET surface area of the UiO-66 dramatically decreased upon compression, from 1050 m2 g−1 for the initial nanocrystal to 76 m2 g−1 after compression at 1.9 GPa (Table 1), similar to our observations with ZIF-8.13 The powder X-ray diffraction (PXRD) pattern of the sample after compression under applied pressures ≤0.4 GPa was consistent with uncompressed UiO-66 (Fig. S3†); after compression above 0.4 GPa, however, the PXRD patterns were weak, consistent with substantial and irreversible amorphization upon pore collapse.| Sample | BET Surface area (m2 g−1) | Pore volume (cm3 g−1) | ||
|---|---|---|---|---|
| ZIF-8 | UiO-66 | ZIF-8 | UiO-66 | |
| As prepared | 1340 | 1050 | 0.66 | 0.54 |
| After 0.4 GPa | 1110 | 800 | 0.54 | 0.38 |
| After 0.8 GPa | 850 | 490 | 0.40 | 0.23 |
| After 1.1 GPa | 510 | 210 | 0.24 | 0.09 |
| After 1.5 GPa | 440 | 130 | 0.19 | 0.05 |
| After 1.9 GPa | 250 | 76 | 0.10 | 0.03 |
To understand better the effects of compression on the solid state structure, we examined the FT-IR spectra of the UiO-66 samples as a function of applied pressure. The spectrum of uncompressed UiO-66 (Fig. 3 and S4†) is consistent with previous reports:24 the strong sharp bands at 1578 cm−1 and 1390 cm−1 are assigned to the asymmetric and symmetric stretch of the carboxylate groups from the terephthalate, respectively, consistent with the syn–syn bridging mode of the carboxylate group in other complexes (Scheme 1).26
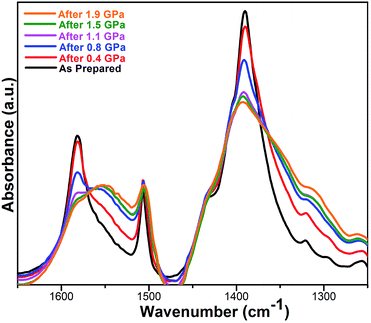 | ||
| Fig. 3 FT-IR spectra of UiO-66 over the range of 1650–1250 cm−1 after compression and release. All absorbances were normalized to the peak at 1019 cm−1 (cf. ESI Fig. S4†). | ||
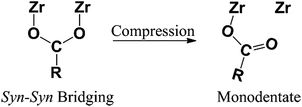 | ||
| Scheme 1 Change in coordination mode of the bridging carboxylate within each Zr–O cluster in the UiO-66 upon compression. | ||
After compression at 0.4 GPa, most absorption bands in the FT-IR spectrum remained unchanged (Fig. S4†) except for bands from the carboxylate group (Fig. 3). The carboxylate stretch at 1578 cm−1 broadened and a shoulder band at 1550 cm−1 appeared, which is a characteristic asymmetric stretch for monodentate coordinated carboxylates (Scheme 1).26 This change indicates that the coordination mode of carboxylate group in UiO-66 has partially transitioned from the syn–syn bridging to a monodentate coordination mode, and the bond between the carboxylate and Zr(IV) (Zr–OCOO) has been substantially broken. Combining these results with PXRD after compression at 0.4 GPa, the long range order of UiO-66 has been maintained, but the local coordination environment around Zr(IV) has been partially changed.
As the pressure of the compression was increased, the shoulder band at 1550 cm−1 became enhanced and the band at 1390 cm−1 greatly broadened. The other major bands remained the same although slight broadening was observed (Fig. S4†). After compression at 1.9 GPa, the shoulder band intensity at 1550 cm−1 becomes comparable to the stretching band at 1578 cm−1, indicating more Zr–OCOO bonds between carboxylate and Zr(IV) have been broken with increasing applied pressure.
X-ray absorption spectra of the UiO-66 after compression and release
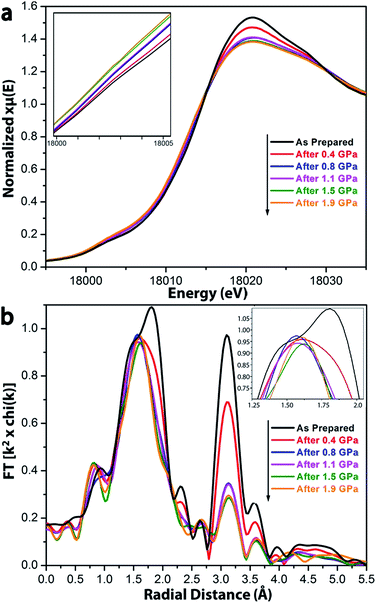
To understand quantitatively the bond breakage in UiO-66 after compression, X-ray absorption spectroscopy (XAS) was employed to probe the local coordination environment around Zr(IV) ions (Fig. 4).27 The oxidation state and coordination geometry were obtained from the X-ray absorption near edge structure (XANES), and information regarding the coordination numbers can be extracted from the extended X-ray absorption fine structure (EXAFS).28,29As suggested by the XANES spectra (Fig. 4a), the oxidation state of Zr remains +IV after compression at 0.4 through 1.9 GPa. The systematic increase of the feature at 18![[thin space (1/6-em)]](https://www.rsc.org/images/entities/char_2009.gif) 003 eV and decrease at 18
003 eV and decrease at 18![[thin space (1/6-em)]](https://www.rsc.org/images/entities/char_2009.gif) 020 eV as a function of extent of compression indicate a decrease in the local symmetry around Zr(IV) ions.27 The feature at 18
020 eV as a function of extent of compression indicate a decrease in the local symmetry around Zr(IV) ions.27 The feature at 18![[thin space (1/6-em)]](https://www.rsc.org/images/entities/char_2009.gif) 003 eV may be assigned as the dipole-forbidden 1s–4d transition. In the uncompressed UIO-66, the Zr ions are in a relatively symmetric Zr6-octahedra, which has a little d–p mixing, so the 1s–4d transition shows a very small peak. After compression, the geometry around Zr is not preserved, and greater local asymmetry gives more 4d–5p mixing and leads to an increase in intensity of the transition. The feature at 18
003 eV may be assigned as the dipole-forbidden 1s–4d transition. In the uncompressed UIO-66, the Zr ions are in a relatively symmetric Zr6-octahedra, which has a little d–p mixing, so the 1s–4d transition shows a very small peak. After compression, the geometry around Zr is not preserved, and greater local asymmetry gives more 4d–5p mixing and leads to an increase in intensity of the transition. The feature at 18![[thin space (1/6-em)]](https://www.rsc.org/images/entities/char_2009.gif) 020 eV may be assigned to the dipole-allowed 1s–5p transition; the observed decrease of this feature after compression is also consistent with increased 4d–5p mixing.
020 eV may be assigned to the dipole-allowed 1s–5p transition; the observed decrease of this feature after compression is also consistent with increased 4d–5p mixing.
In the EXAFS spectrum for the uncompressed UiO-66 (Fig. 4b), two major peaks were observed. The first corresponds to the nearest neighbors of the Zr(IV) ion, i.e., the Zr–O shell; overlapping features at 1.5 Å and 1.8 Å (phase uncorrected distances) correspond to the Zr–Oμ3-O and Zr–OCOO bonds, respectively, which have different bond lengths (Zr–Oμ3-O < Zr–OCOO). The second intense peak at 3.1 Å is ascribed to the next–nearest neighbors, i.e., the Zr⋯Zr shell.
After compression, EXAFS spectra show changes in the coordination environment around Zr(IV) in UiO-66 (Fig. 4). The peaks at 1.8 Å and 3.1 Å dramatically decrease with increasing compression, which indicates the loss of Zr–OCOO bonds and Zr⋯Zr contacts, consistent with the observations from the FT-IR spectra (Fig. 3). In contrast, the peak intensity at 1.5 Å (from the Zr–Oμ3-O bonds) stays the same regardless of the extent of compression, which implies that the inner Zr–Oμ3-O bonds were not affected by compression.
The extent of bond breakage of Zr–O coordination that occurs during compression has been measured from our EXAFS results. Fitting the R-space EXAFS spectra permitted a quantitative modeling of the bond breakage that occurs during pressurization (Fig. S5–S8†), and the results are summarized in Table 2. For UiO-66 before compression, the fitting results are fully consistent with the XRD single-crystal structure: each Zr(IV) has 4 Zr–OCOO bonds, 4 Zr–Oμ3-O bonds, and 4 Zr⋯Zr next nearest neighbor contacts. For UiO-66 after pressure treatment at 0.4 GPa, the effective number of Zr–OCOO bonds and Zr⋯Zr scatterers decreased to 3.0 and 2.5 per Zr(IV) ion, respectively. As compression is increased to 1.9 GPa, the effective number of Zr–OCOO bonds and Zr⋯Zr scatterers monotonically decreases to 1.9 and 2.1 per Zr(IV) ion, respectively (Fig. 5). This change coincides with the loss in pore volume (Table 1). The EXAFS spectra indicate that upon pressure-induced amorphization and pore collapse, roughly half of the initial Zr–OCOO bonds appear to have been broken: the total coordination number of the Zr(IV) ions goes from 8 to roughly 6 (i.e., 4 unchanged Zr–Oμ3-O bonds with the number of Zr–OCOO bond decreased from 4 to 1.9, as seen in Table 2).
| Pressure (GPa) | Bond types | Coordination numbersb | Bond lengthb (Å) |
|---|---|---|---|
| a FT range: 3.5–12.5 Å−1; fitting range: 1.25–3.48 Å. b Estimated errors in coordination numbers are approximately ±5% relative and ±10% absolute; errors in bond lengths are ±0.02 Å. c In both XANES and EXAFS spectra, UiO-66 samples after compression at 0.8 and 1.1 GPa are very similar, as are the spectra after compression at 1.5 and 1.9 GPa. | |||
| UiO-66, as-prepared | Zr–OCOO | 4.0 | 2.27 |
| Zr–Oμ3-O | 4.0 | 2.12 | |
| Zr⋯Zr | 4.0 | 3.53 | |
| 0.4 | Zr–OCOO | 3.0 | 2.29 |
| Zr–Oμ3-O | 4.0 | 2.14 | |
| Zr⋯Zr | 2.5 | 3.54 | |
| 0.8/1.1c | Zr–OCOO | 2.2 | 2.30 |
| Zr–Oμ3-O | 4.0 | 2.14 | |
| Zr⋯Zr | 2.4 | 3.54 | |
| 1.5/1.9c | Zr–OCOO | 1.9 | 2.33 |
| Zr–Oμ3-O | 4.0 | 2.16 | |
| Zr⋯Zr | 2.1 | 3.54 | |
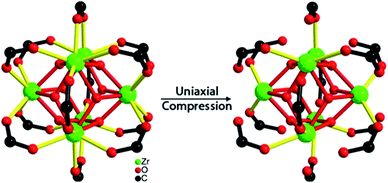 | ||
| Fig. 5 After compression, the effective number of Zr–carboxylate oxygen (Zr–OCOO) bonds (shown in yellow) for each Zr(IV) ion decreased from 4 to ≈2. | ||
The FT-IR data are consistent with the EXAFS observations of bond breakage. The observation of well-defined isosbestic points in the FT-IR spectra after compression (Fig. 3 and S4†) suggests the presence of only two species: the initial eight-coordinate Zr ions with bridging carboxylates and the putative six-coordinate monodentate carboxylate–Zr species formed during amorphization.
The bond length measured from the EXAFS spectra were generally consistent with similar structures determined by single-crystal XRD. The fitted bond lengths of Zr–OCOO, Zr–Oμ3-O and Zr⋯Zr were 2.27 Å, 2.12 Å and 3.53 Å, respectively, in agreement with those from the XRD single-crystal structure24 of UiO-66 (Table 2). The average fitting bond length of the existed Zr–OCOO bond increases as the applied pressure is increased and as the transition from syn–syn bridging to monodentate ligation occurs. After application of 1.9 GPa during compression, the average fitting bond length of Zr–OCOO bond increased slightly from 2.27 Å to 2.33 Å.
Prior literature on structural consequences of pressure-induced amorphization of MOFs is limited. Theoretical modeling of MOFs have very recently predicted substantial structural rearrangement after compression,23,30 but this is the first time that compression-induced bond breakage in MOFs has been directly observed. In ball-milling of crystalline UiO-66 sample, there is a similar phenomenon reported.31 The Zr6O4(OH)4 clusters appear to remain intact, but ∼6.8% of the total Zr–OCOO bond were broken during ball-milling, as attributed to a new feature in the solid state 13C NMR of the amorphized UiO-66. Given the difficulties in estimating effective pressures during ball-milling and the random orientation of collision of crystals with the balls, a more detailed comparison is not possible.
Flat punch nanocompression experiment
To explore the energetics of the compression of UiO-66 nanocrystals, flat punch nanocompression experiments were carried out inside an electron microscope (Fig. 6; ESI Fig. S9–S11†).13,15Fig. 6 presents the absorbed mechanical energy by UiO-66 single nanocrystals under uniaxial compression. The details of the calculation of absorbed mechanical energy are presented in ESI Fig. S9 and S10.† Briefly, the in situ TEM images during the nanocompression experiments are used to calculate the mass of the individual nanocrystals, their area of contact against the compressing punch and anvil, and (combined with the measured applied force from the nanocompressor device) the effective compression pressure. The absorbed mechanical energy per gram is derived from integration of the load–displacement curves during the loading and unloading process.At lower applied pressure (Fig. 6, <2 GPa), only a modest amount of mechanical energy (∼0.1 kJ g−1) was absorbed by individual UiO-66 nanocrystals during essentially elastic compression (which is comparable to the energy consumed by the reversible elastic deformation of another MOF, MIL-53 (ref. 32)).
As the pressure applied to UiO-66 nanocrystals was increased (to as high as ∼10 GPa), the total absorbed mechanical energy increases substantially (Fig. 6). The energy absorbed by UiO-66 is as large as ∼4 kJ g−1. For calibration and context, the energy density of explosives is several kJ g−1: e.g., TNT (2,4,6-trinitrotoluene) generates ∼4.2 kJ g−1 during explosion.33 Thus, on a gram for gram basis, the endothermic chemical reactions associated with the collapse of this MOF are comparable in magnitude to the exothermicity of a typical explosive. In both cases, the release or absorption of energy is essentially irreversible. We do not mean to imply at this time that MOFs will be capable of energy absorption from shock waves; such a conclusion will have to await ongoing studies of the effects of shock impact on MOFs.
The apparent applied pressure used during piston compression of bulk UiO-66 samples may not be directly comparable to the applied pressure used in the well-defined uniaxial compression of single nanocrystals because of possible effects of nanocrystal–nanocrystal interactions (e.g., shear stress, non-uniform contacts, non-uniaxial effects, etc.) during compression of the bulk sample. These interparticle interactions make the effects of the apparent applied pressure during bulk compression much greater than the equivalent applied pressure in the single crystal nanocompression experiments.
Absorption of mechanical energy
Compression-induced bond breakage provides a potential application of MOFs as mechanical energy absorbers for hydrostatic and shock compression. In the complex of Zr4O2(CHF2COO)12, the bridging carboxylate groups are in the same syn–syn coordination mode to Zr(IV) ions as in UiO-66, and the Zr–OCOO bond between the carboxylate group and Zr(IV) ions has a bond length of 2.23 Å,34 which is very close to the Zr–OCOO bonds in UiO-66. According to a DFT calculation,35 the binding energies for CHF2COO− to the Zr4-cluster is −143 kcal mol−1, i.e., the bond enthalpy for each Zr–OCOO bond is approximately half, i.e., 72 kcal mol−1, which should be comparable to the Zr–OCOO bond energy in UiO-66.As discussed earlier, after compression of bulk UiO-66 to 1.9 GPa, the EXAFS data for UiO-66 show that two Zr–OCOO bond per Zr(IV) ion have been broken. Each UiO-66 unit cell has six Zr(IV) ions (Zr6O4(OH)4(BDC)12 where BDC = terephthalate and a unit cell molecular weight of 1662 g mol−1). Let us assume a simple model in which all six Zr(IV) ions, which were initially each eight-coordinate (four Zr–OCOO and Zr–Oμ3-O bonds), are converted to six-coordinate Zr(IV) (two Zr–OCOO and four Zr–Oμ3-O bonds). Bond breakage is endothermic, and in this case, an estimate of the absorbed energies per gram from the endothermic bond breakage of UiO-66 after compression at 1.9 GPa can be approximated as
Thus, if two Zr–OCOO coordination bonds per Zr ion are broken (consistent with the EXAFS data), each gram of UiO-66 after the pressurization to 1.9 GPa would have converted ∼2.1 kJ mechanical energy to chemical energy (assuming no compensating increase in other bonding in the amorphized structure). This predicted conversion of mechanical energy (∼2.1 kJ g−1) is about 70 times the experimentally observed energy absorbed by reversible elastic deformation of MOF MIL-53 (maximum ∼0.033 kJ g−1), and more than 200 times the energy absorbed during intrusion experiments on mesoporous silica (∼4 to 12 × 10−3 kJ g−1).32,36,37 One may conclude that Zr–OCOO bond breakage is the primary component of the large energy absorbed during compressional collapse of UiO-66.
Comparison to other MOFs
Not all MOFs will necessarily break bonds during compression and void collapse. In a prior study, we found that another framework solid, ZIF-8 (zeolitic imidazolate framework-8), also lost porosity and long range order upon static compression up to ∼2 GPa; in contrast, however, ZIF-8 maintained its local structure around the bridging Zn ion (ZnN4).13 We suggest that this is probably due to the relative compactness of the 2-methylimidazole ligand and the relatively dense structure of ZIF-8 compared to UiO frameworks. Indeed, our choice of UiO-66 for this study was predicated on its longer bridging ligand (terephthalate) and larger pore size, in addition to the extremely high chemical and thermal stability of the UiO frameworks.38,39 Moreover, unlike the free rotation between the 2-methylimidazole to Zn(II) ions under compression, the orientation between the ligand terephthalate and Zr6O4(OH)4 clusters was fixed by the bidentate syn–syn bridging of the carboxylates, again leading one to expect greater rigidity in UiO-66 compared to ZIF-8.31,39,40Our preliminary study on the mechanical property of isoreticular UiO MOFs under the compression has shown that the plasticity and endothermicity during the deformation of UiO MOFs displayed a surprising potential for absorption and dissipation of mechanical shock.14 The absorbed mechanical energy was calculated from individual UiO nanocrystals during one cycle of loading and unloading, as also used in this study, for a range of different bridging dicarboxylate bridges. The work here for the high pressure treatment of bulk UiO-66 samples further confirmed the capacity of the absorption and dissipation of mechanical energy.
The mechanical property of UiO MOFs also depends on the defects in the structure.41 Defects in UiO-66 solids are due primarily to vacancies in the coordination of the bridging terephthalates to the Zr6O4(OH)4 clusters when water molecules or added “modulators” (as HCOOH or CH3COOH, which aid in crystallization) replace terephthalate during crystal growth.42,43 Adsorption and thermal–mechanical property can be tuned by the density of defects in the structure.41,44 As discussed elsewhere,15 we were able to quantify such defects in UiO-66 by digesting desolvated UiO-66 in H2SO4/DMSO-d6 solution and analyzing the relative amount of dicarboxylate ligand and monocarboxylate modulators by 1H-NMR (the measured contamination15 of acetic acid to terephthalic acid in these UiO-66 samples is 5%). Indeed, the mechanical stiffness of UiO-66 depends very strongly on the defect concentration in the solid.15
The Zr–OCOO bonds in UiO-66 break as the collapse of the internal porosity occurs at relative low applied pressure (0.4 GPa). This mechanical behavior is rather different than that of another porous MOF, MIL-53.32 The structure of MIL-53 is built from trans corner sharing octahedra MO4(H2O)2 (M = Al(III) or Cr(III)) chains linked to each other by terephthalates.45,46 Upon compression up to 1.0 GPa, MIL-53 underwent a reversible structure transition, from a large pore phase to narrow pore phase, where the coordination bonds were maintained.32 It may be that MIL-53 at higher compressive pressures would also undergo irreversible bond breakage.
There are three responses that porous materials can have to compression from applied pressure: (1) in flexible or soft porous materials, the internal free volume collapses and densification occurs, generally with local structure maintained;22,32,36 for example, ZIF-8 (ref. 13) or MIL-53;32 in hard materials, (2) more substantial structural change may be associated with pressure-induced phase transitions;47 and as we have seen here, in rigid porous materials, (3) bond breakage at rigid sites in the structure may occur. The orientation of the terephthalate ligands in UiO-66 is fixed by the Zr6-linker, and therefore the Zr–O bonds between the carboxylate groups and Zr(IV) are vulnerable to breaking. In all three mechanisms, porous materials store the mechanical energy into the framework during compression, but endothermic bond breakage is likely to be a far larger energy contribution. The first two responses may or may not be reversible upon pressure release, but the third may be generally expected to be irreversible.
Conclusions
In this work, we have explored the subtle relationship between the mechanical properties and structures of metal-organic framework solids and discovered mechanochemical5–8 reactions in MOFs during pressure-induced amorphization. We find compression-induced bond breaking in a MOF as demonstrated through EXAFS and confirmed by IR spectra. The bond breakage is a consequence of changes forced upon the extended structure of MOFs as pore collapse occurs. Collapse of the pores in UiO-66 forced the breakage of Zr–O bonds between the bridging terephthalates to the Zr6O4(OH)4 clusters. We have quantitatively investigated the nature of bond breakage as a function of the compressional pressure and provided structural information about the transition during compression. The mechanochemistry of MOFs is strongly endothermic and by direct observation of morphological changes of single crystals of UiO-66 by SEM during nanocompression experiments, we found that substantial energy was irreversibly absorbed in the solids during collapse, comparable in magnitude to the energy released by typical explosives.Conflicts of interest
The authors declare no competing financial interests.Acknowledgements
We acknowledge funding through the U.S. Navy (MURI N000141210828) and the use of the Frederick Seitz Materials Research Laboratory Central Facilities, UIUC. APS use was supported by the U.S. DOE BES, Contract No. DE-AC02-06CH11357; MRCAT operations are supported by the DOE and the MRCAT member institutions. Z. S. thanks the financial support from NSF China (No. 21601088) and NSF of Jiangsu Province of China (No. BK20171472).Notes and references
- R. J. Green, Int. J. Mech. Sci., 1972, 14, 215–224 CrossRef.
- K. Vafai, Handbook of Porous Media, Taylor & Francis Group, Boca Raton, Florida, 3rd edn, 2015 Search PubMed.
- H.-X. Deng, S. Grunder, K. E. Cordova, C. Valente, H. Furukawa, M. Hmadeh, F. Gándara, A. C. Whalley, Z. Liu and S. Asahina, Science, 2012, 336, 1018–1023 CrossRef CAS PubMed.
- O. K. Farha, I. Eryazici, N. C. Jeong, B. G. Hauser, C. E. Wilmer, A. A. Sarjeant, R. Q. Snurr, S. T. Nguyen, A. O. Yazaydın and J. T. Hupp, J. Am. Chem. Soc., 2012, 134, 15016–15021 CrossRef CAS PubMed.
- K. S. Suslick, Faraday Discuss., 2014, 170, 411–422 RSC.
- T. Friscic, S. L. James, E. V. Boldyreva, C. Bolm, W. Jones, J. Mack, J. W. Steed and K. S. Suslick, Chem. Commun., 2015, 51, 6248–6256 RSC.
- M. K. Beyer and H. Clausen-Schaumann, Chem. Rev., 2005, 105, 2921–2948 CrossRef CAS PubMed.
- J. Ribas-Arino and D. Marx, Chem. Rev., 2012, 112, 5412–5487 CrossRef CAS PubMed.
- Z. Akimbekov, A. D. Katsenis, G. P. Nagabhushana, G. Ayoub, M. Arhangelskis, A. J. Morris, T. Friščić and A. Navrotsky, J. Am. Chem. Soc., 2017, 139, 7952–7957 CrossRef CAS PubMed.
- A. D. Katsenis, A. Puškarić, V. Štrukil, C. Mottillo, P. A. Julien, K. Užarević, M.-H. Pham, T.-O. Do, S. A. J. Kimber, P. Lazić, O. Magdysyuk, R. E. Dinnebier, I. Halasz and T. Friščić, Nat. Commun., 2015, 6, 6662 CrossRef CAS PubMed.
- J. C. Tan and A. K. Cheetham, Chem. Soc. Rev., 2011, 40, 1059–1080 RSC.
- K. W. Chapman, G. J. Halder and P. J. Chupas, J. Am. Chem. Soc., 2009, 131, 17546–17547 CrossRef CAS PubMed.
- Z. Su, Y.-R. Miao, S.-M. Mao, G.-H. Zhang, S. Dillon, J. T. Miller and K. S. Suslick, J. Am. Chem. Soc., 2015, 137, 1750–1753 CrossRef CAS PubMed.
- Z. Su, W. L. Shaw, Y. R. Miao, S. You, D. D. Dlott and K. S. Suslick, J. Am. Chem. Soc., 2017, 139, 4619–4622 CrossRef CAS PubMed.
- Y. R. Miao, Z. Su and K. S. Suslick, J. Am. Chem. Soc., 2017, 139, 4667–4670 CrossRef CAS PubMed.
- F.-X. Coudert, Chem. Mater., 2015, 27, 1905–1916 CrossRef CAS.
- F.-X. Coudert, A. Boutin, A. H. Fuchs and A. V. Neimark, J. Phys. Chem. Lett., 2013, 4, 3198–3205 CrossRef CAS.
- S. Kitagawa, Chem. Soc. Rev., 2014, 43, 5415–5418 RSC.
- K. J. Hartlieb, J. M. Holcroft, P. Z. Moghadam, N. A. Vermeulen, M. M. Algaradah, M. S. Nassar, Y. Y. Botros, R. Q. Snurr and J. F. Stoddart, J. Am. Chem. Soc., 2016, 138, 2292–2301 CrossRef CAS PubMed.
- H. Furukawa, K. E. Cordova, M. O'Keeffe and O. M. Yaghi, Science, 2013, 341, 1230444 CrossRef PubMed.
- S. A. Moggach, T. D. Bennett and A. K. Cheetham, Angew. Chem., Int. Ed., 2009, 121, 7221–7223 CrossRef.
- P. G. Yot, Z. Boudene, J. Macia, D. Granier, L. Vanduyfhuys, T. Verstraelen, V. Van Speybroeck, T. Devic, C. Serre and G. Férey, Chem. Commun., 2014, 50, 9462–9464 RSC.
- K. Banlusan and A. Strachan, J. Phys. Chem. C, 2016, 120, 12463–12471 CAS.
- J. H. Cavka, S. Jakobsen, U. Olsbye, N. Guillou, C. Lamberti, S. Bordiga and K. P. Lillerud, J. Am. Chem. Soc., 2008, 130, 13850–13851 CrossRef PubMed.
- A. Schaate, P. Roy, A. Godt, J. Lippke, F. Waltz, M. Wiebcke and P. Behrens, Chem.–Eur. J., 2011, 17, 6643–6651 CrossRef CAS PubMed.
- V. Zeleňák, Z. Vargová and K. Györyová, Spectrochim. Acta, Part A, 2007, 66, 262–272 CrossRef PubMed.
- P. Li, I.-W. Chen and J. E. Penner-Hahn, Phys. Rev. B: Condens. Matter Mater. Phys., 1993, 48, 10063 CrossRef CAS.
- G.-H. Zhang, H. Yi, G.-T. Zhang, Y. Deng, R.-P. Bai, H. Zhang, J. T. Miller, A. J. Kropf, E. E. Bunel and A.-W. Lei, J. Am. Chem. Soc., 2014, 136, 924–926 CrossRef CAS PubMed.
- C. He, G.-H. Zhang, J. Ke, H. Zhang, J. T. Miller, A. J. Kropf and A.-W. Lei, J. Am. Chem. Soc., 2012, 135, 488–493 CrossRef PubMed.
- K. Yang, G. Zhou and Q. Xu, RSC Adv., 2016, 6, 37506–37514 RSC.
- T. D. Bennett, T. K. Todorova, E. F. Baxter, D. G. Reid, C. Gervais, B. Bueken, B. Van de Voorde, D. De Vos, D. A. Keen and C. Mellot-Draznieks, Phys. Chem. Chem. Phys., 2016, 18, 2192–2201 RSC.
- I. Beurroies, M. Boulhout, P. L. Llewellyn, B. Kuchta, G. Férey, C. Serre and R. Denoyel, Angew. Chem., Int. Ed., 2010, 49, 7526–7529 CrossRef CAS PubMed.
- V. Babrauskas, Ignition Handbook, Fire Science Publisher, Issaquah, WA, 2004 Search PubMed.
- G. Trimmel, S. Gross, G. Kickelbick and U. Schubert, Appl. Organomet. Chem., 2001, 15, 401–406 CrossRef CAS.
- J. Kreutzer, P. Blaha and U. Schubert, Comput. Theor. Chem., 2016, 1084, 162–168 CrossRef CAS.
- J. Rodriguez, I. Beurroies, T. Loiseau, R. Denoyel and P. L. Llewellyn, Angew. Chem., Int. Ed., 2015, 54, 4626–4630 CrossRef CAS PubMed.
- P. G. Yot, Q. Ma, J. Haines, Q. Yang, A. Ghoufi, T. Devic, C. Serre, V. Dmitriev, G. Férey and C. Zhong, Chem. Sci., 2012, 3, 1100–1104 RSC.
- Q. Zhao, W. Yuan, J. Liang and J. Li, Int. J. Hydrogen Energy, 2013, 38, 13104–13109 CrossRef CAS.
- S. M. Chavan, G. C. Shearer, S. Svelle, U. Olsbye, F. Bonino, J. Ethiraj, K. P. Lillerud and S. Bordiga, Inorg. Chem., 2014, 53, 9509–9515 CrossRef CAS PubMed.
- C. L. Hobday, R. J. Marshall, C. F. Murphie, J. Sotelo, T. Richards, D. R. Allan, T. Düren, F.-X. Coudert, R. S. Forgan, C. A. Morrison, S. A. Moggach and T. D. Bennett, Angew. Chem., Int. Ed., 2016, 55, 2401–2405 CrossRef CAS PubMed.
- C. A. Trickett, K. J. Gagnon, S. Lee, F. Gándara, H.-B. Bürgi and O. M. Yaghi, Angew. Chem., Int. Ed., 2015, 54, 11162–11167 CrossRef CAS PubMed.
- M. J. Cliffe, W. Wan, X. Zou, P. A. Chater, A. K. Kleppe, M. G. Tucker, H. Wilhelm, N. P. Funnell, F.-X. Coudert and A. L. Goodwin, Nat. Commun., 2014, 5, 4176 CAS.
- H. Wu, Y. S. Chua, V. Krungleviciute, M. Tyagi, P. Chen, T. Yildirim and W. Zhou, J. Am. Chem. Soc., 2013, 135, 10525–10532 CrossRef CAS PubMed.
- P. Ghosh, Y. J. Colon and R. Q. Snurr, Chem. Commun., 2014, 50, 11329–11331 RSC.
- F. Millange, C. Serre and G. Ferey, Chem. Commun., 2002, 822–823, 10.1039/b201381a.
- G. Ferey, M. Latroche, C. Serre, F. Millange, T. Loiseau and A. Percheron-Guegan, Chem. Commun., 2003, 2976–2977, 10.1039/b308903g.
- M. Zhou, K. Wang, Z.-W. Men, C.-L. Sun, Z.-L. Li, B.-B. Liu, G.-T. Zou and B. Zou, CrystEngComm, 2014, 16, 4084–4087 RSC.
Footnotes |
| † Electronic supplementary information (ESI) available: PXRD, SEM, FT-IR, fitting results of R-space EXAFS of UiO-66 nanocrystals. See DOI: 10.1039/c7sc03786d |
| ‡ These authors contributed equally. |
| This journal is © The Royal Society of Chemistry 2017 |

