Effects of pH and dissolved oxygen on the photodegradation of 17α-ethynylestradiol in dissolved humic acid solution†
Received
5th October 2015
, Accepted 10th November 2015
First published on 10th November 2015
Abstract
To probe the mechanisms responsible for pH and dissolved oxygen (DO) affecting the photodegradation of 17α-ethynylestradiol (EE2) in dissolved humic acid (HA) solution, EE2 aqueous solutions with pH values ranging from 3.0 to 11.0 and different DO conditions were irradiated by using a 300 W mercury lamp equipped with 290 nm light cutoff filters. In 5.0 mg L−1 HA solutions (pH 8.0), EE2 was degraded at a rate of 0.0739 h−1 which was about 4-fold faster than that in Milli-Q water. The degradation of EE2 was mainly caused by the oxidation of photogenerated reactive species (RS), and the contribution of direct photodegradation to EE2 degradation was always lower than 27%. Both the direct and indirect photodegradation of EE2 were closely dependent on the EE2 initial concentration, pH value and DO concentration. The photodegradation rate of EE2 decreased with increased initial concentration of EE2 due to the limitation of photon flux. With pH and DO increasing, the degradation rate of EE2 increased significantly due to the increase in the yields of excited EE2 and RS. Among the photogenerated RS, HO˙ and 3HA* were determined to be the key contributors, and their global contribution to EE2 photodegradation was about 50%. Although HA could generate more 1O2 than HO˙, the contribution of 1O2 to EE2 degradation was lower than 13% due to its low reactivity towards EE2. This study could enlarge our knowledge on the photochemical behaviors of steroid estrogens in natural sunlit waters.
Environmental impact
17α-ethynylestradiol (EE2) has become a growing concern due to its wide detection in natural waters and high estrogenic potency. However, knowledge on the photochemical behavior of EE2 is still limited, especially that induced by humic acid (HA). In aqueous solutions, HA always affects the fate of organic pollutants by acting as a sunscreen, a reactive oxygen species source, and a photosensitizer, and these roles usually vary with aquatic characteristics. This study assessed the performance of HA in inducing the photodegradation of EE2 and the mechanisms responsible for pH and dissolved oxygen (DO) affecting EE2 photodegradation in HA solution. HA showed a distinctive potential and a close relationship with pH and DO in promoting EE2 photodegradation. Information obtained in this study is useful for assessing the photochemical behaviors and environmental risk assessment of EE2.
|
1. Introduction
17α-ethynylestradiol (EE2) has been widely used as an active component in oral contraceptive pills and discharged into aquatic systems by the effluent of wastewater treatment plants.1,2 EE2 accumulated in waters may lead to some serious hazards to the ecosystem and human endocrine system due to its strongest estrogenic potency among the steroid estrogens.3–6 Thus, the fate and behaviors of EE2 in natural aquatic systems have attracted global concern.7,8 Among the various fates of environmental estrogens, photodegradation was identified as one of the predominant removal approaches from natural waters.9 The photodegradation half-life of EE2 was documented as less than 2 days in lake water,10,11 whereas EE2 was reported to be resistant to biodegradation with a half-life of 108 days under aerobic conditions,9,12 and a longer lag stage could be expected under anaerobic conditions.13,14
The rapid photodegradation of EE2 in natural waters was always attributed to the acceleration effects of a number of organic and inorganic chromophores, such as the colored dissolved organic matter (CDOM), Fe(III)–organic complexes, nitrate and nitrite ions.9 The ubiquitous CDOM in aquatic systems is a heterogeneous mixture of aromatic and aliphatic organic compounds, mainly humic substances. Humic acid (HA), a main ingredient of humic substances, has been found to be of distinctive potential in accelerating the photodegradation of pollutants,15 and the acceleration function of HA has been attributed to the photogenerated reactive species (RS).16,17 HA can typically absorb the photons in the range of 300–500 nm solar spectrum forming short-lived RS (1HA*) by the unsaturated conjugated structures and free electron pairs on heteroatoms.18 The 1HA* may fragment into smaller molecules, go back to the ground state by losing energy or interacting with quenching reagents, and undergo an inter-system crossing process forming a triplet-excited photosensitizer (3HA*).19 Furthermore, the formed 3HA* can react with molecular oxygen and other chemicals to generate secondary reactive oxygen species (ROS), including hydroxyl radicals (HO˙), singlet oxygen (1O2), hydrogen peroxide (H2O2) and superoxide anions (O2˙−).16,20,21
Previous studies reported that the photodegradation of steroid estrogens was significantly enhanced by HA acting as a photosensitizer,9–11,22 and this role always varied across waters due to the special components and aquatic characteristics. Among the extensive aquatic characteristics, dissolved oxygen (DO) and pH were two important parameters since they could participate in the process of ROS formation9 and change the speciation of EE2 and HA.10,18 It was also documented that the photooxidation rate of DOM would be increased in acidified streams relative to that in neutral pH.23 However, the pathways and mechanisms responsible for DO and pH affecting the direct photodegradation of EE2 and the photodegradation of EE2 mediated by HA remain unclear. Furthermore, to the best of our knowledge, the information on the photogenerated RS affecting EE2 degradation is still very limited, including the formation pathways of RS, individual contribution of RS to EE2 degradation and the reaction potency of the main RS towards EE2.
This study is devoted to quantifying the contribution of direct photodegradation and RS produced by a local HA to the degradation of EE2, and to explore the mechanisms responsible for water characteristics, DO and pH, affecting the photogeneration of RS and the photodegradation of EE2 in Milli-Q water and HA aqueous solutions. This study can further our knowledge on the photochemical behaviors of steroidal estrogens in natural waters and provide information on the feasibility of incorporating the photodegradation technology into wastewater treatment plants in the near future.
2. Materials and methods
2.1. Chemicals
EE2, i-PrOH (IPA), furfuryl alcohol (FFA), terephthalic acid (TPA), 2-hydroxyl terephthalic acid (2-hTPA), catalase (CAT), sorbic acid (SA), rose bengal (RB) and benzoic acid (BZA) were purchased from Sigma Aldrich (USA). Selected physicochemical properties of EE2 are shown in Table 1. H2O2, FeSO4·7H2O and H2SO4 of analytical grade were purchased from Sinopharm Chemical Reagent Co., Ltd., China. Milli-Q water (electric resistivity > 18 MΩ cm) was used throughout this study. The used HA was extracted from the sediment collected from Dianchi Lake (centered around 24°48′2′′ N, 102°40′17′′ E) by a previously reported method16 with some modifications. The sediment collection information and HA extraction procedures are shown in text S1 of ESI.†
Table 1 Selected physicochemical properties of 17α-ethynylestradiol
| Estrogen |
Molecular weight (g mol−1) |
Water solubility14 (20 °C, mg L−1) |
lg![[thin space (1/6-em)]](https://www.rsc.org/images/entities/char_2009.gif) Kow24 Kow24 |
lg![[thin space (1/6-em)]](https://www.rsc.org/images/entities/char_2009.gif) Koc25 Koc25 |
pKa25 |
| EE2 (C20H24O2) |
296.40 |
4.80 |
3.67 |
2.99 |
10.5 |
2.2. Solution preparation
EE2 working solution was prepared freshly every week. 5.00 mg EE2 was added into 1 L Milli-Q water followed by continuous stirring for 24 h at room temperature to ensure a maximum dissolution, and then the supernatant was collected by passing it through 0.45 μm glass fiber filters (GF/F, Millipore Corp., USA) which were prebaked for 4 h at 450 °C. Prepared working solutions were stored at 4 °C in brown glass bottles wrapped with aluminum foil to avoid photodegradation.
HA stock solution was obtained by dissolving 500 mg HA powder in about 500 mL NaOH solution (0.05 M). After being stirred for 24 h at room temperature, the solution was centrifuged at 2327g for 15 min and filtered by prebaked GF/F to remove insoluble particles. The prepared HA stock solution was stored in a polyethylene container and kept at 4 °C under dark conditions for use within 3 weeks.
2.3. Photodegradation experiments
Batch photochemical experiments were performed on an XPA-7 merry-go round photochemical reaction apparatus as shown in Fig. S1a.† All cylindrical quartz reactors (with a volume of 50 mL and a diameter of 15 mm) were stirred by using a magnetic stirrer and illuminated by using a 300 W medium pressure mercury lamp equipped with 290 nm light cutoff filters. The emission spectrum of the light source is displayed in Fig. S1b† and the light intensity was determined to be 3.71 mW m−2 at 365 nm and 21.6 mW m−2 for λ > 420 nm, respectively. These light intensities were measured by using an ultraviolet and a visible light irradiation detector (Photoelectric Instrument Factory of Beijing Normal University, China) at the surface of the reactors away from the light source (5.5 cm).
EE2 degradations (40 mL, 1.24 mg L−1) were performed at 23 ± 0.5 °C which was controlled by using a recirculating cooling water bath. Before being irradiated, all the solutions were adjusted to the desired pH values by adding 1.0 M NaOH and 1.0 M H2SO4, and then equilibrated in the dark for 1 h. Change in the pH value for all degradations was measured by using a UB-7 pH meter at the end of each irradiation period, which indicated that the extent of the changes was always lower than 0.1. In order to explore the roles of pH and DO acting in EE2 photodegradation, batch experiments were performed as follows: (1) the stability of EE2 was tested in Milli-Q water, 0.05 M NaHCO3 and HA aqueous solutions under dark and irradiation conditions, respectively; (2) HA-dependent photodegradation of EE2 was tested in a HA concentration range of 0–20 mg L−1, and pH-dependent photodegradation of EE2 was performed within a pH range of 3.0–11.0; (3) DO-dependent photodegradation of EE2 was performed in N2 or O2 purging systems, and the photodegradation of EE2 in the systems exposed to air was taken as the reference; (4) RS scavenging experiments were performed by adjusting the solutions containing 2% (v/v) IPA, 0.2 mM FFA, 0.5 mM SA and 0.015 mg mL−1 CAT to trap HO˙, 1O2, 3HA* and H2O2, respectively;26–29 (5) steady-state concentration of HO˙ and 1O2 was measured by TPA and FFA (text S2, Fig. S2 and S3†), respectively; (6) reaction rate constant between HO˙ and EE2, and that between 1O2 and EE2 were detected by the competition kinetics method,30 by taking H2O2/Fe2+ and rose bengal as the source of HO˙ and 1O2, respectively (text S3, Tables S1 and S2, Fig. S4 and S5†). All photochemical experiments were conducted in duplicate.
2.4. Sample analysis
Aliquots of 500 μL samples were withdrawn from irradiated solutions at different time intervals and quantified EE2 residual on a high performance liquid chromatograph (HPLC, Agilent Technologies 1260) by the method shown in Table S3.† The detection limit of EE2 was determined to be 0.02 mg L−1, and the relative standard deviation for all samples was within 5%. Quantifications for BZA, FFA, and 2-hTPA were also performed on the HPLC which was equipped with a CORTECS™ C18 column (2.7 μm, 4.6 mm × 100 mm) and a UV-fluorescence dual detector. Detailed information on the detection methods is also depicted in Table S3.†
HA was characterized for fluorescence, elemental compositions, and light absorption properties by using a fluorescence spectrophotometer (Perkin Elmer, LS55), an elemental analyzer (Elementar, MicroCube), and a UV-vis spectrometer (SHIMADZU, 2600), respectively. The detected results and calculated indices of HA are shown in Fig. S1c and S1d, and Table S4.† The concentration of HA in all aqueous solutions was quantified by using a TOC analyzer (Elementar, Vario TOC APSA-370).
3. Results and discussion
3.1. Direct photodegradation of EE2
3.1.1 Stability of EE2 in solution.
Dark controls in Milli-Q water and 0.05 M NaHCO3 were performed to identify the stability of EE2. As shown in Fig. 1, EE2 was quantitatively recovered (>95%) in dark controls, which indicated that hydrolysis, volatilization, and sorption onto the walls of quartz tubes were not the significant contributors to EE2 loss when it was photodegraded.
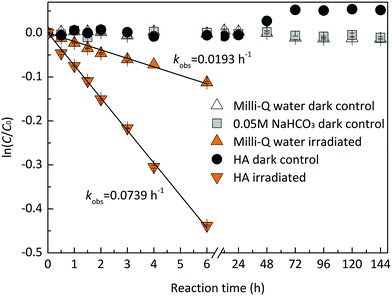 |
| | Fig. 1 Stability of EE2 in the dark and under the irradiation of the simulated sunlight. | |
EE2 can be degraded slowly in Milli-Q water at pH 8.0 ± 0.1 under the irradiation of the simulated sunlight source (Fig. 1), which is due to its weak light absorption in the wavelength of 290–320 nm. The plot of ln(C/C0) versus irradiation time t displays a linear relationship with an adjusted correlation coefficient (radj2) of 0.9929 calculated by eqn (1) and (2), which indicates that the direct photodegradation of EE2 follows pseudo-first-order kinetics.
| | | radj2 = 1 − [(1 − r2)(m − 1)/(m − b − 1)] | (2) |
where
C and
C0 are the concentrations of EE2 at photoreaction time
t and time zero in h, respectively;
kobs is the observed pseudo-first-order rate constant in h
−1;
r2 is the regression coefficient of the linear fitting;
m and
b in
eqn (2) are the number of experimental data points and parameters, respectively.
To assess the direct photodegradation efficiency of EE2 in the wavelength range of 290–320 nm, phenol was selected as a chemical actinometer because it shares similar light absorption characteristics with EE2 (Fig. S1d†). The quantum yield of EE2 (ϕEE2290−320) was calculated by the reported methods31,32 and eqn (3) with a step of 0.5 nm which was built on the observed pseudo-first order rate constant of EE2 and phenol as eqn (4) and (5). According to the observed photodegradation rate of EE2 0.0193 ± 0.0003 h−1, the quantum yield was calculated as 0.0102 ± 0.0002 mol einstein−1. Compared to the photodegradation of most fluoroquinolone antibiotics (varied from 0.0047 mol einstein−1 for enrofloxacin to 0.0697 mol einstein−1 for gatifloxacin),17 estrone (0.0246 mol einstein−1)34 and 17β-estradiol (0.07 mol einstein−1)32 in pure water, EE2 is a relative photo-recalcitrant chemical. Therefore, EE2 may accumulate in aquatic systems and exhibit hazards to humans and wildlife due to its longer half-life (about 36 h, calculated by dividing ln![[thin space (1/6-em)]](https://www.rsc.org/images/entities/char_2009.gif) 2 by the rate constant) and higher estrogenic potency than other pharmaceuticals, estrogens and personal care products.3,6
2 by the rate constant) and higher estrogenic potency than other pharmaceuticals, estrogens and personal care products.3,6
| |  | (3) |
| |  | (4) |
| |  | (5) |
where
ϕEE2290–320 (mol einstein
−1) is the quantum yield of EE2 in the wavelength range of 290–320 nm;
ϕphenol290–320 is the quantum yield of phenol, which was reported to be 0.03 mol einstein
−1 with
λ > 290 nm;
33kEE2obs and
kphenolobs are the observed photodegradation rate constants of EE2 and phenol in h
−1, respectively;
Iλ (einstein L
−1 s
−1) is the photon flux rate at the wavelength
λ;
ελ (M
−1 cm
−1) is the molar absorption coefficient of EE2 or phenol.
3.1.2 Effects of EE2 initial concentration.
The effect of EE2 initial concentration on the direct photodegradation was tested at pH 8.0 ± 0.1 in a concentration range of 0.1–3.0 mg L−1. As shown in Fig. 2, all the photodegradations followed pseudo-first-order kinetics, and radj2 for all linear regressions was higher than 0.95. The direct photodegradation of EE2 was significantly inhibited by the increased initial concentration (about a 51% reduction in rate constant for an 8-fold increase in initial concentration), and the half-life of EE2 ranged from 18.5 to 37.6 h within the concentration range of 0.1–0.8 mg L−1. EE2 in natural waters was usually detected at the nM or pM level,2 which indicated that EE2 would have a far shorter half-life in natural waters than that discussed here. The photodegradation of EE2 in Milli-Q water tended to be stable when its concentration was higher than 0.8 mg L−1. Similar results were also reported in the photodegradation of estrone and estriol.34,35 The decrease in the direct photodegradation rate of EE2 might be related to the limitation of incident photons and the light screening effect. To assess this, the measured rate constants of EE2 at higher concentrations were corrected by the light screening effect according to the reported methods21 and eqn (6) and (7). The corrected rate constant of EE2 (kcor) ranged from 0.0374 to 0.0369 h−1, which was compatible with that at 0.1 mg L−1 (0.0375 h−1). Therefore, the decrease in the photodegradation rate of EE2 was indeed caused by the light screening effect.| |  | (6) |
| | | (Ia/I0)EE2/EE2′ = (Ia/I0)EE2′ × (AEE2/AEE2′) | (7) |
where (Ia/I0)EE2/EE2′ is the fraction of light absorbed by EE2 at a concentration of 0.1 mg L−1 and at 292 nm; (Ia/I0)EE2′ is the fraction of light absorbed by EE2 at a concentration higher than 0.1 mg L−1 and at 292 nm; AEE2 and AEE2′ are the absorbance of 0.1 mg L−1 EE2 and higher at 292 nm, respectively; kEE2 is the photodegradation rate constant of EE2 at 0.1 mg L−1 in h−1.
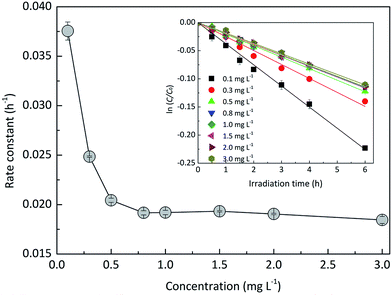 |
| | Fig. 2 Dependence of the direct photodegradation of EE2 on the initial concentration. | |
3.1.3 Effects of pH on the direct photodegradation of EE2.
Experiments were performed at different pH values of 3.0, 5.0, 7.0, 8.0, 9.0 and 11.0 to determine the influence of pH on the direct photodegradation of EE2. The photodegradation kinetics and quantum yield of EE2 were closely dependent on pH conditions and reached the lowest value at pH 7.0 (Fig. 3). After 6 h irradiation, 25%, 10% and 90% of EE2 were degraded in the solution at pH 3, 7 and 11, respectively. Higher photodegradation rate of EE2 in strong alkaline solution could be explained by taking the dissociation of EE2 and the changes in UV-vis absorption characteristics of EE2 into consideration (Fig. 4). A significant fraction of EE2 was deprotonated at pH 11.0 because the pKa value was reported to be 10.5 for EE2.24 Furthermore, the deprotonated organic chemicals were always reported to be more sensitive to light,36 whereas the protonated chemicals were less.37,38 Thus, the photodegradation rate at pH 11.0 was much higher than that at lower pH value. It is noteworthy that a higher degradation rate of EE2 in strong acidic aqueous solution could also be expected compared to that in the neutral, weak acidic, and weak basic solution. This result was in line with the influence of pH on direct photodegradation of 17β-estradiol and estrone aqueous solution irradiated by using a UV-vis light source.39
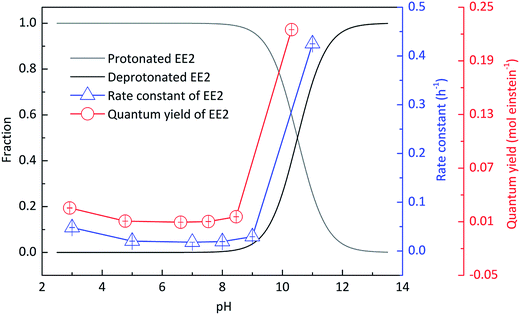 |
| | Fig. 3 Influence of pH on the speciation and the direct photodegradation of EE2. | |
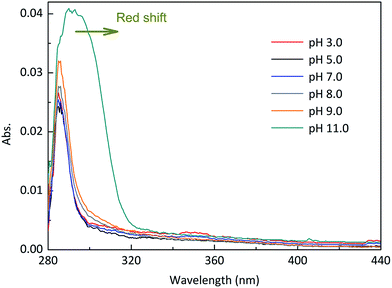 |
| | Fig. 4 Absorption characteristics of EE2 aqueous solution (3.0 mg L−1) under different pH conditions. | |
3.2. Photodegradation of EE2 in the presence of HA
3.2.1 The photodegradation of EE2 induced by HA.
HA is ubiquitous in natural waters, and it is a major RS source,40 an incident light screen,41 and a RS scavenger.30 To investigate the effect of HA on EE2 photodegradation, EE2 degradations (1.24 mg L−1) were performed in the solutions containing 5.0 mg L−1 HA. As shown in Fig. 1, HA could effectively induce EE2 photodegradation at a rate about 4-fold faster than that in Milli-Q water, which was in line with previous reported results.11,22 HA could always act dual roles in the photodegradation of organic pollutants, i.e., a promoter and an inhibitor.42 Thus, the influence of HA concentration on EE2 photodegradation was studied with HA ranging from 0 to 20 mg L−1 (Table 2). The photodegradation rate of EE2 in HA containing solutions was dramatically enhanced compared to that in Milli-Q water. However, HA could inhibit the degradation of EE2 when it exceeded the critical concentration of 10 mg L−1. A similar phenomenon was also found in the study of HA inducing 17β-estradiol photodegradation.43 The inhibition effect of HA on the photodegradation of organic pollutants was always attributed to its competing incident light and scavenging RS functions.17,26,30 To explore the mechanisms responsible for the inhibition effect of HA on the photodegradation of EE2, degradation rate constants were corrected by the light screening effect of HA as eqn (6) with minor modifications. As listed in Table 2, the corrected rates were always lower than 0.0193 h−1 and decreased steadily with increased concentration of HA, which indicated that both light screening and RS scavenging mechanisms were involved in the photodegradation of EE2 in HA solutions.
Table 2 Observed and corrected degradation rate constants and half-lives of EE2 at different concentrations of HA
| HA concentration (mg L−1) |
k
obs (h−1) |
k
cor (h−1) |
Contribution of HA (%) |
t
1/2 (h) |
| 0 |
0.0193 ± 0.0003 |
— |
— |
35.9 |
| 2 |
0.0547 ± 0.0006 |
0.0191 |
65 |
12.7 |
| 5 |
0.0739 ± 0.0004 |
0.0183 |
75 |
9.4 |
| 10 |
0.0731 ± 0.0003 |
0.0179 |
76 |
9.5 |
| 15 |
0.0674 ± 0.0005 |
0.0172 |
74 |
10.3 |
| 20 |
0.0665 ± 0.0002 |
0.0164 |
75 |
10.4 |
3.2.2 Influence of pH on the photodegradation of EE2 induced by HA.
In order to explore the influence of pH on the photodegradation of EE2 induced by HA, EE2 was irradiated in the solutions containing 5.0 mg L−1 HA with pH values ranging from 3.0 to 11.0. As shown in Fig. 5, the pH-dependent photodegradation rate of EE2 decreased to the minimum value of 0.0587 h−1 at pH 5.0, while the lowest degradation rate of EE2 in Milli-Q water was found at pH 7.0. HA was reported to be a heterogeneous mixture and a weak acidic polyelectrolyte.44 Therefore, HA might be in the ionized state when pH exceeded 5.0, and the deprotonated HA could absorb more incident light (Fig. S6†) and produce more RS.23 As a result, the photodegradation rate of EE2 increased with pH increased from 5.0 to 11.0. The degradation rate of EE2 at pH 3.0 was found to be higher than that at pH 5.0, which was also related to the influence of the hydrogen ion on the RS formation.23 In general, the effect of pH on the photodegradation of EE2 in HA solution was minor than that in Milli-Q water.
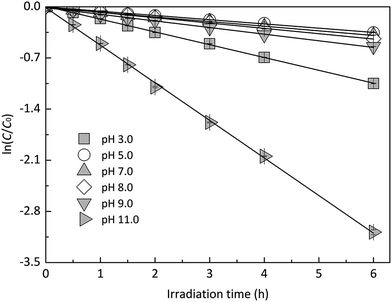 |
| | Fig. 5 Photodegradation of EE2 in 5.0 mg L−1 HA solutions at different pH values. | |
3.3. Role of DO in EE2 photodegradation
In order to explore the influence of DO on the photodegradation of EE2 in the presence and absence of HA, nitrogen and oxygen were bubbled into solutions for providing a DO condition of 0.4 mg L−1 and 7.1 mg L−1, respectively. The concentration of DO in the solutions exposed to air was measured to be 3.8 mg L−1, and the photodegradation of EE2 in those systems was taken as the reference. A quantitative comparison of EE2 photodegradation kinetics in the presence and absence of DO is shown in Fig. 6. The photodegradation rate of EE2 was slightly inhibited in the Milli-Q/N2 system (0.0178 h−1) compared to that in the Milli-Q/Air system (0.0193 h−1), whereas the degradation of EE2 in the HA/N2 system (0.0539 h−1) was inhibited by 27% compared to that in the HA/air system (0.0739 h−1). The degradation of EE2 in oxygen enriched systems, however, could be dramatically enhanced, and the rates increased to 0.0477 and 0.1674 h−1 for the Milli-Q/O2 and HA/O2 system, respectively. The pathways of DO promoting the photodegradation of organic pollutants could be typically summarized as follows: (i) promoting the further oxidation of the photochemical intermediates and products,36 (ii) reacting with photosensitizers producing 1O2, HO˙ and H2O2,16,20 and these ROS were identified as the key contributors to the degradation of organic pollutants.45,46 Thus, the pathways for DO enhancing EE2 photodegradation could be proposed as eqn (8)–(14).| |  | (8) |
| | | 3HA* + O2 → O2˙− + HA+ | (11) |
| | | 2O2˙− + 2H+ → H2O2 + O2 | (12) |
| | | 3HA*/1O2/HO˙ + EE2 → products | (14) |
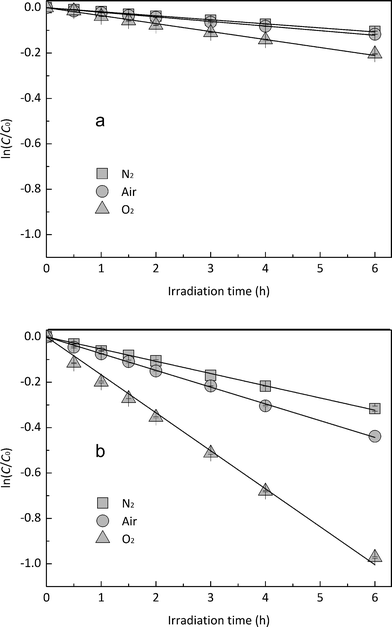 |
| | Fig. 6 Effects of DO on the photodegradation of EE2 (a) in Milli-Q water and (b) in HA aqueous solution. | |
3.4. Contributions of the key RS to EE2 degradation
To qualitatively identify the photogenerated RS and quantitatively assess their contributions to EE2 degradation in the HA contained systems, molecular probes were added into solutions under different experimental conditions to analyze the changes in the photodegradation kinetics of EE2 (Fig. S7†). HO˙ and 3HA* were identified as the primary RS dominating EE2 degradation in HA solutions, and the contribution of 3HA* to EE2 degradation in the oxygen poor system could be enlarged (Table 3). The photodegradation rate of EE2 in the Milli-Q system was also inhibited upon addition of IPA, which could be attributed to the self-sensitized oxidation of EE2 alike the proceedings in the direct photodegradation of fluoroquinolone antibiotics.17 The phenolic structure was reported as one of the light sensitive groups producing RS,47 and this mechanism was also involved in the photodegradation of EE2 demonstrated by adding phenol into pure aqueous EE2 as a positive control (Fig. S7†). Therefore, the self-sensitized oxidation of EE2 was depicted as eqn (15)–(19). H2O2 scavenging experiments indicated that HO˙ was not only produced from the photolysis of H2O2 but also from other processes, including hydrogen abstracting from H2O by the triplet chromophoric dissolved organic matter and quinone-type substances.26,48,49 The steady-state concentration of HO˙ and 1O2 in the HA/air system was determined to be 4.83 × 10⁻¹⁵ M and 2.04 × 10⁻¹³ M by taking TPA and FFA as selective traps20,50 (Fig. S2 and S3†), respectively. The concentration of 1O2 in natural waters and HA containing solutions was typically found to be 2 to 5 orders of magnitude higher than that of HO˙.40,51 The different capacity of HA producing 1O2 and HO˙ could be explained by its special structure and composition. The contribution of 1O2 to EE2 degradation was always less than 13%, whereas the contribution of 3HA* and HO˙ was about 22% and 28%, respectively. This result could be attributed to their different reactivities towards EE2 which was measured by a competition kinetics method (text S3)30 and is shown in Fig. S4 and S5.† The second-order reaction rate constant between EE2 and HO˙ was measured to be 1.09 × 10¹⁰ M−1 s−1 and was 3 orders of magnitude higher than that between EE2 and 1O2 (9.71 × 10⁷ M−1 s−1). Note that the steady-state concentration of 3HA* was not estimated in this study because the structure of HA used here might be different from that produced by the international humic substance society.27| |  | (15) |
| |  | (16) |
| | | 2O2− + 2H+ → H2O2 + O2 | (18) |
| |  | (19) |
Table 3 Degradation rate of EE2 in different irradiated solutionsa
|
|
Milli-Q in air |
HA in air |
Milli-Q pH 8.0 |
HA pH 8.0 |
| pH 8.0 |
pH 11.0 |
pH 8.0 |
pH 11.0 |
N2 |
O2 |
N2 |
O2 |
|
± error represents at the 0.95 confidence level.
|
| No-SCA |
0.0193 |
0.4250 |
0.0739 |
0.5174 |
0.0178 |
0.0351 |
0.0539 |
0.1674 |
| (±0.0005) |
(±0.0005) |
(±0.0006) |
(±0.0055) |
(±0.0006) |
(±0.0007) |
(±0.0018) |
(±0.0012) |
| IPA |
0.0175 |
0.3316 |
0.0533 |
0.3543 |
0.0177 |
0.0316 |
0.0461 |
0.1125 |
| (±0.0007) |
(±0.0052) |
(±0.0006) |
(±0.0032) |
(±0.0004) |
(±0.0028) |
(±0.0011) |
(±0.0008) |
| FFA |
0.0201 |
0.4311 |
0.0649 |
0.5032 |
0.0182 |
0.0345 |
0.0494 |
0.1564 |
| (±0.0005) |
(±0.0021) |
(±0.0004) |
(±0.0075) |
(±0.0015) |
(±0.0006) |
(±0.0009) |
(±0.0013) |
| SA |
0.0168 |
0.3435 |
0.0577 |
0.4568 |
0.0164 |
0.0337 |
0.0398 |
0.1538 |
| (±0.0008) |
(±0.0032) |
(±0.0005) |
(±0.0086) |
(±0.0009) |
(±0.0005) |
(±0.0008) |
(±0.0016) |
| CAT |
0.0210 |
0.4568 |
0.0647 |
0.4946 |
0.0187 |
0.0359 |
0.0526 |
0.1584 |
| (±0.0004) |
(±0.0009) |
(±0.0011) |
(±0.0061) |
(±0.0007) |
(±0.0008) |
(±0.0012) |
(±0.0007) |
3.5. Mechanism for RS formation and EE2 degradation
It was reported that the direct photodegradation of chemicals depends on the light absorption ability of chemicals, intensity of incident light, and quantum yield of excited compounds.38 Apart from the maximum absorption of EE2 at 292 nm within the emitted light spectrum (pH 8.0), EE2 has an extended light absorption band from 290 to 320 nm as shown in Fig. 4. The direct photodegradation thus occurred due to the absorption of the photons emitted from this band. The high pH value could effectively enhance the light absorption potency and broaden the absorption wavelength range of EE2 (Fig. 4), as a result, more EE2* was formed and degraded.
HO˙, 3HA* and 1O2 were identified as the key RS dominating the photodegradation of EE2 in the solutions containing HA (Table 3), and the formation pathways of these RS are depicted as eqn (9)–(14). H2O2 was determined as one of the main sources of HO˙ but not the sole. Eqn (12) shows that the formation of H2O2 would be increased with decreasing pH if the concentration of superoxide anions remains constant. However, the formation of superoxide anions could be inhibited by the decreased pH value because protonated HA presents lower sensitivity to light.23 Abundant hydrogen ions at pH 3.0 might contribute to the formation of H2O2. Thus, the photodegradation rate of EE2 in the HA containing solutions reached the lowest value at pH 5.0. In oxygen rich systems, the photodegradation of EE2 could be promoted by DO reacting with excited EE2 and HA. Based on the experimental results, the photodegradation pathways of EE2 and the formation mechanisms of RS in HA solutions regarding the influence of DO and pH are summarized in Fig. 7.
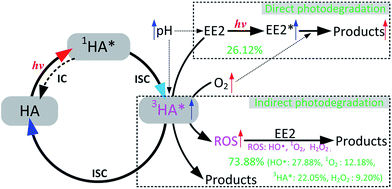 |
| | Fig. 7 Mechanism for EE2 photodegradation and RS formation in HA aqueous solution. | |
4. Conclusions
EE2 was removed by both direct (<27%) and indirect photodegradation (>73%) pathways in HA aqueous solutions. The photodegradation rate of EE2 in Milli-Q water decreased with increased pH in the range of 3.0–7.0, increased initial concentration of EE2 within 0.8 mg L−1 and decreased DO concentration. The deprotonated EE2 could be photodegraded much faster than the protonated one, and the influence of pH on EE2 photodegradation induced by HA was minor than that on the direct photodegradation of EE2. The direct photodegradation of EE2 could be enhanced by DO reacting with excited EE2, while the indirect photodegradation of EE2 was promoted by DO reacting with excited HA forming ROS, mainly HO˙ and 1O2. The concentration of HO˙ and 1O2 in 5 mg L−1 HA solutions was measured to be 4.83 × 10⁻¹⁵ and 2.04 × 10⁻¹³ M, and the second-order reaction rate constant of HO˙ and 1O2 towards EE2 was measured to be 1.09 × 10¹⁰ and 9.71 × 10⁷ M−1 s−1, respectively. This could perfectly explain why 1O2 contributed less to the photodegradation of EE2 (always <13%), while HO˙ and 3HA* were the key contributors. Photogenerated H2O2 was identified as one of the sources of HO˙ but not the unique. Finally, mechanisms responsible for EE2 degradation and RS formation in HA aqueous solutions involving the effect of DO and pH were summarized.
Acknowledgements
This project was sponsored by the National Natural Science Foundation of China (Grant No. 41401558), Application Fundamental Research Foundation of Yunnan Province, China (Grant No. 2013FA011), Education Department Science Research Foundation of Yunnan Province, China (Grant No. 2014J022), and China Postdoctoral Science Foundation (Grant No. 2014T70887).
References
- Z. H. Liu, G. N. Lu, H. Yin, Z. Dang and B. Rittmann, Environ. Sci. Technol., 2015, 49, 5288–5300 CrossRef CAS PubMed.
- B. Huang, B. Wang, D. Ren, W. Jin, J. Liu, J. Peng and X. Pan, Environ. Int., 2013, 59, 262–273 CrossRef CAS PubMed.
- O. Lee, A. Takesono, M. Tada, C. R. Tyler and T. Kudoh, Environ. Health Perspect., 2012, 120, 990–996 CrossRef CAS PubMed.
- J. Liu, R. Wang, B. Huang, C. Lin, J. Zhou and X. Pan, Environ. Pollut., 2012, 162, 325–331 CrossRef CAS PubMed.
- S. Jobling, R. Williams, A. Johnson, A. Taylor, M. Gross-Sorokin, M. Nolan, C. R. Tyler, R. Aerle, E. Santos and G. Brighty, Environ. Health Perspect., 2006, 114, 32–39 CrossRef PubMed.
- A. Pillon, N. Servant, F. Vignon, P. Balaguer and J.-C. Nicolas, Anal. Biochem., 2005, 340, 295–302 CrossRef CAS PubMed.
- A. Z. Aris, A. S. Shamsuddin and S. M. Praveena, Environ. Int., 2014, 69, 104–119 CrossRef CAS PubMed.
- H. Hamid and C. Eskicioglu, Water Res., 2012, 46, 5813–5833 CrossRef CAS PubMed.
- Y. Zuo, K. Zhang and Y. Deng, Chemosphere, 2006, 63, 1583–1590 CrossRef CAS PubMed.
- Y. Zuo, K. Zhang and S. Zhou, Environ. Sci.: Processes Impacts, 2013, 15, 1529–1535 CAS.
- D. Wang, Y. Li, G. Li, C. Wang, W. Zhang and Q. Wang, J. Hazard. Mater., 2013, 254, 64–71 CrossRef PubMed.
- M. D. Jürgens, K. I. Holthaus, A. C. Johnson, J. J. Smith, M. Hetheridge and R. J. Williams, Environ. Toxicol. Chem., 2002, 21, 480–488 CrossRef.
- A. K. Sarmah, G. L. Northcott and F. F. Scherr, Environ. Int., 2008, 34, 749–755 CrossRef CAS PubMed.
- G. G. Ying, R. S. Kookana and P. Dillon, Water Res., 2003, 37, 3785–3791 CrossRef CAS PubMed.
- M. P. Makunina, I. P. Pozdnyakov, Y. Chen, V. P. Grivin, N. M. Bazhin and V. F. Plyusnin, Chemosphere, 2015, 119, 1406–1410 CrossRef CAS PubMed.
- J. Porras, J. J. Fernandez, R. A. Torres-Palma and C. Richard, Environ. Sci. Technol., 2014, 48, 2218–2225 CrossRef CAS PubMed.
- L. Ge, J. Chen, X. Wei, S. Zhang, X. Qiao, X. Cai and Q. Xie, Environ. Sci. Technol., 2010, 44, 2400–2405 CrossRef CAS PubMed.
- E. de Laurentiis, S. Buoso, V. Maurino, C. Minero and D. Vione, Environ. Sci. Technol., 2013, 47, 14089–14098 CrossRef CAS PubMed.
-
N. J. Turro, V. Ramamurthy and J. C. Scaiano, Modern molecular photochemistry of organic molecules, Wiley Online Library, 2012 Search PubMed.
- W. Song, S. Yan, W. J. Cooper, D. D. Dionysiou and K. E. O'Shea, Environ. Sci. Technol., 2012, 46, 12608–12615 CrossRef CAS PubMed.
- E. Caupos, P. Mazellier and J. P. Croue, Water Res., 2011, 45, 3341–3350 CrossRef CAS PubMed.
- W. Grzybowski and J. Szydłowski, Chemosphere, 2014, 111, 13–17 CrossRef CAS PubMed.
- L. A. Molot, J. J. Hudson, P. J. Dillon and S. A. Miller, Aquat. Sci., 2005, 67, 189–195 CrossRef CAS.
- P. Westerhoff, Y. Yoon, S. Snyder and E. Wert, Environ. Sci. Technol., 2005, 39, 6649–6663 CrossRef CAS PubMed.
- L. S. Lee, T. J. Strock, A. K. Sarmah and P. S. C. Rao, Environ. Sci. Technol., 2003, 37, 4098–4105 CrossRef CAS PubMed.
- S. E. Page, W. A. Arnold and K. McNeill, Environ. Sci. Technol., 2011, 45, 2818–2825 CrossRef CAS PubMed.
- J. E. Grebel, J. J. Pignatello and W. A. Mitch, Water Res., 2011, 45, 6535–6544 CrossRef CAS PubMed.
- G. V. Buxton, C. L. Greenstock, W. P. Helman and A. B. Ross, J. Phys. Chem. Ref. Data, 1988, 17, 513–886 CrossRef CAS.
- W. R. Haag, E. Gassman and A. Braun, Chemosphere, 1984, 13, 631–640 CrossRef CAS.
- J. Wenk, U. von Gunten and S. Canonica, Environ. Sci. Technol., 2011, 45, 1334–1340 CrossRef CAS PubMed.
-
A. Leifer, The kinetics of environmental aquatic photochemistry: Theory and practice, American Chemical Society, 1988 Search PubMed.
- P. Mazellier, L. Méité and J. D. Laat, Chemosphere, 2008, 73, 1216–1223 CrossRef CAS PubMed.
- G. Grabner, G. Köhler, J. Zechner and N. Getoff, Photochem. Photobiol., 1977, 26, 449–458 CrossRef CAS.
- R. R. Chowdhury, P. Charpentier and M. B. Ray, Ind. Eng. Chem. Res., 2010, 49, 6923–6930 CrossRef CAS.
- Y. Chen, K. Zhang and Y. Zuo, Sci. Total Environ., 2013, 463, 802–809 CrossRef PubMed.
- M. Barakat, H. Schaeffer, G. Hayes and S. Ismat-Shah, Appl. Catal., B, 2005, 57, 23–30 CrossRef CAS.
- K. Aguilar, A. Garvin, E. Azuara and A. Ibarz, Food Res. Int., 2015, 71, 165–173 CrossRef CAS.
- M. Czaplicka, J. Hazard. Mater., 2006, 134, 45–59 CrossRef CAS PubMed.
- B. Liu and X. Liu, Sci. Total Environ., 2004, 320, 269–274 CrossRef CAS PubMed.
- D. Zhang, S. Yan and W. Song, Environ. Sci. Technol., 2014, 48, 12645–12653 CrossRef CAS PubMed.
- R. B. Young, D. E. Latch, D. B. Mawhinney, T.-H. Nguyen, J. C. Davis and T. Borch, Environ. Sci. Technol., 2013, 47, 8416–8424 CAS.
- E. M. L. Janssen, P. R. Erickson and K. McNeill, Environ. Sci. Technol., 2014, 48, 4916–4924 CrossRef CAS PubMed.
- D. M. Leech, M. T. Snyder and R. G. Wetzel, Sci. Total Environ., 2009, 407, 2087–2092 CrossRef CAS PubMed.
- J. A. Marinsky and J. Ephraim, Environ. Sci. Technol., 1986, 20, 349–354 CrossRef CAS PubMed.
- A. Rubio-Clemente, R. A. Torres-Palma and G. A. Peñuela, Sci. Total Environ., 2014, 478, 201–225 CrossRef CAS PubMed.
- L. Chen, C. Shen, M. Zhou, X. Tang and Y. Chen, Environ. Sci. Pollut. Res., 2013, 20, 1842–1848 CrossRef CAS PubMed.
- S. P. Wu, J. Schwab, B. Y. Yang and C. S. Yuan, J. Photochem. Photobiol., A, 2015, 309, 55–64 CrossRef CAS.
- M. M. Dong and F. L. Rosario-Ortiz, Environ. Sci. Technol., 2012, 46, 3788–3794 CrossRef CAS PubMed.
- A. Pochon, P. P. Vaughan, D. Gan, P. Vath, N. V. Blough and D. E. Falvey, J. Phys. Chem. A, 2002, 106, 2889–2894 CrossRef CAS.
- S. E. Page, W. A. Arnold and K. McNeill, J. Environ. Monit., 2010, 12, 1658–1665 RSC.
- F. Al Housari, D. Vione, S. Chiron and S. Barbati, Photochem. Photobiol. Sci., 2010, 9, 78–86 CAS.
Footnote |
| † Electronic supplementary information (ESI) available: Three texts, four tables, and seven figures with further information on materials, experimental procedures, calculations and additional data were included. See DOI: 10.1039/c5em00502g |
|
| This journal is © The Royal Society of Chemistry 2016 |
![[thin space (1/6-em)]](https://www.rsc.org/images/entities/char_2009.gif) 2 by the rate constant) and higher estrogenic potency than other pharmaceuticals, estrogens and personal care products.3,6
2 by the rate constant) and higher estrogenic potency than other pharmaceuticals, estrogens and personal care products.3,6


