 Open Access Article
Active phase distribution changes within a catalyst particle during Fischer–Tropsch synthesis as revealed by multi-scale microscopy†
K. H.
Cats
a,
J. C.
Andrews
b,
O.
Stéphan
c,
K.
March
c,
C.
Karunakaran
d,
F.
Meirer
a,
F. M. F.
de Groot
a and
B. M.
Weckhuysen
*a
aInorganic Chemistry and Catalysis, Debye Institute for Nanomaterials Science, Utrecht University, Universiteitsweg 99, 3584 CG Utrecht, The Netherlands. E-mail: b.m.weckhuysen@uu.nl
bStanford Synchrotron Light Source, SLAC National Accelerator Laboratory, Menlo Park, CA 94025, California, USA
cLaboratoire de Physique des Solides, Université Paris Sud, 91405 Orsay, France
dCanadian Light Source, 44 Innovation Boulevard, Saskatoon, SK S7N 2V3, Canada
First published on 16th February 2016
Abstract
The Fischer–Tropsch synthesis (FTS) reaction is one of the most promising processes to convert alternative energy sources, such as natural gas, coal or biomass, into liquid fuels and other high-value products. Despite its commercial implementation, we still lack fundamental insights into the various deactivation processes taking place during FTS. In this work, a combination of three methods for studying single catalyst particles at different length scales has been developed and applied to study the deactivation of Co/TiO2 Fischer–Tropsch synthesis (FTS) catalysts. By combining transmission X-ray microscopy (TXM), scanning transmission X-ray microscopy (STXM) and scanning transmission electron microscopy-electron energy loss spectroscopy (STEM-EELS) we visualized changes in the structure, aggregate size and distribution of supported Co nanoparticles that occur during FTS. At the microscale, Co nanoparticle aggregates are transported over several μm leading to a more homogeneous Co distribution, while at the nanoscale Co forms a thin layer of ∼1–2 nm around the TiO2 support. The formation of the Co layer is the opposite case to the “classical” strong metal–support interaction (SMSI) in which TiO2 surrounds the Co, and is possibly related to the surface oxidation of Co metal nanoparticles in combination with coke formation. In other words, the observed migration and formation of a thin CoOx layer are similar to a previously discussed reaction-induced spreading of metal oxides across a TiO2 surface.
Introduction
The Fischer–Tropsch synthesis (FTS) process is a way to make synthetic transportation fuels from fossil (i.e., natural gas and coal) and renewable resources (i.e., biomass).1–13 This catalytic process converts synthesis gas (i.e., syngas, a mixture of carbon monoxide (CO) and hydrogen (H2)) into a range of long-chain hydrocarbons, including waxes, from which S-free diesel and other hydrocarbons can be produced. Industrially, the FTS process is typically performed with either a Co- or a Fe-based catalyst. Of these two elements, Co is more often used for methane-based syngas conversion.14 Various Co-based catalysts on different support oxides, including Al2O3, SiO2 and TiO2, have been made in the past.15,16 Despite being very active and selective towards liquid hydrocarbons (C5+), the deactivation of Co-based FTS catalysts has consequences for their industrial application.The literature on deactivation of Co-based FTS catalysts was recently reviewed by Tsakoumis and co-workers.17 Several different deactivation mechanisms are discussed.18 Some of the mechanisms, such as poisoning by sulfur in the syngas feed, can be prevented by carefully removing the poison from the feed. Others are expected to play only a minor role during typical FTS conditions. Examples are bulk oxidation, metal–support solid state reactions and leaching of the active phase. The most important deactivation mechanisms are metal sintering and coke formation.
Sintering is the growth of Co nanoparticles in the catalyst into larger (nano-) particles, resulting in a reduction of catalytically active surface area. The thermodynamic driving force for sintering is the lower surface energy of larger particles. There are two different mechanisms of sintering, namely Ostwald ripening and coalescence.18 In Ostwald ripening, large crystals grow at the expense of the smaller crystals. The smaller crystals evaporate more atoms that are transported to larger crystals. This is explained by the Kelvin equation for vapor pressure across the curved surface of the nanoparticle. Coalescence involves the migration of intact nanoparticles across the surface of the support. At a certain point, two metal particles meet each other and they coalesce into a single, larger nanoparticle.
Coke formation is the deposition of carbonaceous species onto either the Co particles or the support. The formation of long-chain hydrocarbons is the purpose of the FTS process; however, the formation of hydrogen-poor graphitic or amorphous carbon species can permanently deactivate the catalyst. The deactivation can be caused either by poisoning of the catalyst or by physically blocking access to catalyst active sites. Furthermore, it is possible that coke blocks the pores of the support material, preventing diffusion of reactants and reaction products. This will also cause a reduction in reaction rate. Coke formation can lead to deactivation even in the absence of other deactivation mechanisms.19
Since Tsakoumis' review, many methods have been used to study the deactivation of FTS catalysts. Recently, Thüne et al. used electron microscopy on planar silica wafers to study the effects of realistic operating conditions on the deactivation of Co FTS catalysts.20 A recent development is high-throughput and automated screening of different catalysts for stability.21 Advances in synchrotron-based in situ characterization of catalyst materials have resulted in detailed studies of the evolution of alumina-supported Co FTS catalysts under reaction conditions.22 The behavior of Re-promoted Co/(Zr/SiO2) FTS catalysts23 and Mn-promoted Co/TiO2 catalysts24,25 under reduction conditions has also been investigated. Jacobs et al. have studied the reduction behavior of a range of FTS catalysts using temperature programmed reduction–X-ray absorption near-edge structures spectroscopy (TPR-XANES).26 A similar methodology has been used to study the thermal activation of silica-supported Co FTS catalysts.27 Rochet and co-workers used synchrotron radiation to study an alumina-supported Co FTS catalyst under working conditions, finding a slight further reduction of Co during the first hours of FTS.28 More recently, Tsakoumis et al. explicitly tried to study the deactivation of a Re-promoted, alumina-supported Co catalyst.29
Limitations of commonly used characterization techniques are at least partly responsible for the current lack of understanding of catalyst deactivation. For example, transmission electron microscopy (TEM) suffers from a lack of contrast between Co and the support oxide. This makes quantification of cobalt particle sizes difficult. Furthermore, TEM usually only gives 2-dimensional information and it is thought that the 3-dimensional distribution of Co over the support particles can play a large role in the deactivation. Furthermore, almost all synchrotron radiation studies so far have used bulk techniques, as opposed to spatially resolved techniques. An important drawback of bulk characterization studies is that changes at the single particle level cannot be observed. Finally, in situ synchrotron radiation studies are limited because the time on stream that can be practically followed during a few days of synchrotron beam time is too short to investigate the long-term deactivation of catalytic solids.22–29
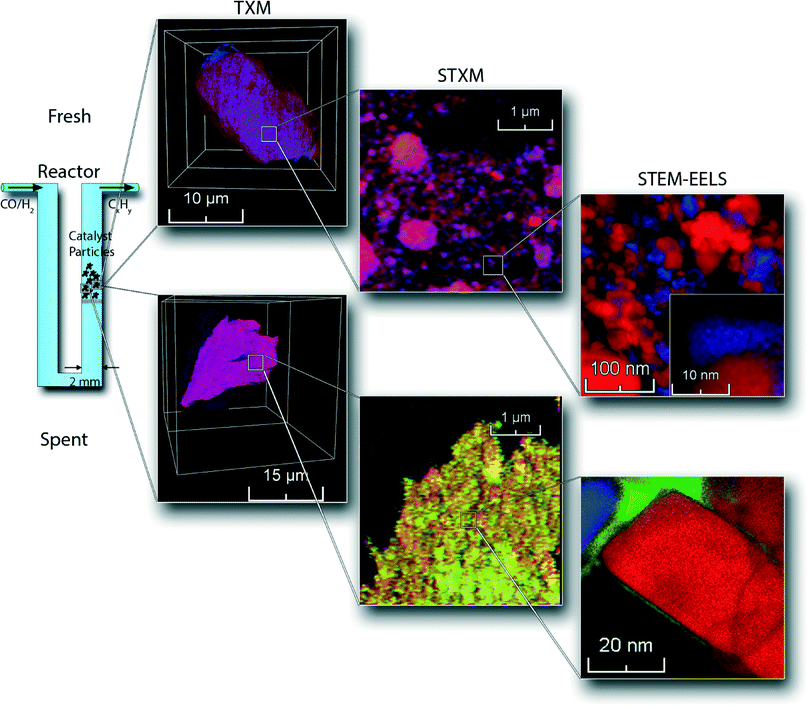
Here we present a unique combination of three micro-spectroscopy methods bridging four orders of magnitude in length scales – i.e., spanning the 50 μm–0.5 nm range, for studying the physicochemical processes taking place within a single catalyst particle. This multi-length scale chemical imaging approach, in principle applicable to a wide variety of catalyst systems, has been used to investigate the deactivation of an industrially relevant Co/TiO2 FTS catalyst. An overview of the combination of chemical imaging techniques used is illustrated in Fig. 1. First, we used nano-tomographic transmission X-ray microscopy (TXM)30,31 to give 3D insight in the structure, aggregate size and distribution of cobalt nanoparticles within a 30 μm-sized catalyst particle in a non-invasive manner. Second, we applied scanning transmission X-ray microscopy (STXM)32,33 to obtain chemical information about the supported Co nanoparticles with 30 nm spatial resolution. For this purpose, thin slices were prepared using an ultra-microtome to study the internal structure of the catalyst. Finally, we acquired high-resolution elemental data from scanning transmission X-ray microscopy-electron energy loss spectroscopy (STEM-EELS), where we created 0.5 nm spatial resolution maps with elemental sensitivity. We illustrate this multiple-technique characterization approach for both fresh and deactivated 15 wt% Co/TiO2 catalysts. We will use this new approach to show that there is seemingly another, different mechanism operative that may play a role in the deactivation of Co/TiO2 FTS catalysts, which is related to the previously reported reaction-induced spreading of metal oxides on a TiO2 surface.34
Experimental
Fresh catalyst samples were prepared by impregnating about 2 g of vacuum dried TiO2 (P25) powder with a saturated Co(NO3)2 solution (Sigma-Aldrich, >99%) until the pores of the support were filled. The powder was then dried at 60 °C and calcined at 350 °C. This process was repeated to reach a final loading of 15 wt%.35 XRD analysis (Fig. S1†) shows that the catalyst consists of Co3O4 crystallites of about 18 nm. The catalytic activity of the catalyst was tested in a fixed-bed reactor. About 20 mg of catalyst was diluted with about 80 mg of SiC and loaded into a U-shaped reactor. The catalyst was first reduced using 20 mL min−1 of H2 (Linde, >99.999%) for 2 h at 350 °C (heating ramp of 5 °C min−1), completely reducing the catalyst to metallic Co.35 The catalyst was then exposed to 4 mL min−1 of H2 and 2 mL min−1 of CO (Linde, >99%) at atmospheric pressure and 250 °C. The product stream was analyzed every hour by on-line gas chromatography (Varian 430 GC, CP sil-5). The test was stopped after 200 h. The catalyst was then put under argon atmosphere and cooled down. Finally, the catalyst was slowly exposed to air, by opening the reactor and letting air diffuse into the reactor. This sample is denoted as the spent catalyst. XRD analysis (Fig. S1†) shows metallic Co nanoparticles of about 10 nm. This size estimation does not take into account the passivation layer around the Co nanoparticles upon exposure to air. The presence of other, amorphous Co species cannot be ruled out using this method.Hard X-ray TXM was carried out at beamline 6-2c of the Stanford Synchrotron Radiation Lightsource (SSRL).36 Monochromatic X-rays were focused by a condenser lens onto the sample, which was mounted in a capillary on an x, y, z, θ stage. The transmitted image was formed by a Fresnel zone plate onto a CCD camera. The recorded 2D images cover a field of view of ∼25 × 25 μm at ∼30 nm 2D spatial resolution.31 Tomographic data were obtained by rotating the sample and recording the transmission image at different angles.30 This was done below and above the Co K-edge (7709 eV). Data pre-processing and tomographic reconstruction were performed with the TXM-Wizard software package.37 Data visualization was done using the FEI Avizo software. 3D elemental maps were formed by subtracting the reconstructed data below the edge from the data above the edge.
In situ TXM experiments were conducted using a specially designed reactor.10,35 The spent catalyst was crushed using a mortar and pestle and loaded into a quartz capillary. The capillary was glued to the in situ holder using high-temperature epoxy. The sample was first characterized under He atmosphere at room temperature. Next, the catalyst was reduced using H2 at 350 °C for about 2 h. TXM XANES spectra were measured during the reduction treatment. Then, the catalyst was cooled down to 250 °C, for about 20 min. The gas flows were then switched to 2![[thin space (1/6-em)]](https://www.rsc.org/images/entities/char_2009.gif) :
:![[thin space (1/6-em)]](https://www.rsc.org/images/entities/char_2009.gif) 1 H2 and CO, at a pressure of 10 bar. Continuous XANES scans were carried out for about 9 h.
1 H2 and CO, at a pressure of 10 bar. Continuous XANES scans were carried out for about 9 h.
Soft X-ray STXM experiments were performed at beamline 10 ID-1 of the Canadian Light Source (CLS). 100 nm slices of the catalyst samples were obtained by ultramicrotomy.38 The slices were introduced into the STXM chamber, which was then evacuated to about 0.1 mbar and backfilled to about 0.15 bar with He. The monochromatic X-ray beam was focused on the sample by a Fresnel zone plate to a spot size of about 30 nm. Spectral image sequences (stacks) were obtained by recording images at different photon energies around the Ti L2,3 edges (460 eV) and Co L2,3 edges (780 eV). Data analysis was performed with the aXis2000 software. After aligning the image sequence, elemental maps were constructed by comparing images below and above the X-ray absorption edge. X-ray absorption spectra (XAS) were extracted from the image sequences. Single pixel spectra were fitted using reference spectra obtained from high-purity Co3O4, CoO and metallic Co.
High-resolution characterization of the samples was performed using STEM-EELS in a NION USTEM 200 (probe corrected) microscope. The samples were sonicated in ethanol and a small droplet was deposited on a copper TEM grid with an amorphous carbon layer. The samples were introduced into the microscope after evaporating the ethanol. An operating voltage of 60 kV was used during the experiments. EELS data were acquired in the Spectrum Imaging mode so that a full spectrum was acquired at each position of a 2D scan. To minimize beam damage, the sample area was only measured once. Data analysis was performed using custom plugins for the Gatan DigitalMicrograph software. Elemental maps were created by selecting three windows in the EELS spectra; two were placed before the edge of the element of interest for background correction. The other one was placed over the edge. The elemental map was then obtained as the difference between the edge and the background. Where necessary, the signal-to-noise ratio was improved by principal component analysis using the Hyperspy software (http://www.hyperspy.org).
X-ray photoelectron spectroscopy (XPS) measurements were carried out on an Axis NOVA DlD spectrometer from Kratos Analytical Ltd. Spectra were acquired using monochromatic Al-Kα radiation (photon energy of 1486.6 eV). The X-ray source was operated at 150 W (15 kV, 10 mA). The analysis area was about 0.3 × 0.7 mm. The analyzer was used in FOV1 mode with a pass energy of 40 or 80 eV for the narrow scans (spectra of only Co 2p, O 1s, Ti 2p and C 1s peaks) and 160 eV for the survey scan (complete spectrum). A charge neutralizer was used to prevent the sample from charging. The pressure in the analysis chamber was in the low 10−9 mbar range during measurement. Spectra were analyzed using the CasaXPS software (version 2.3.17). Peak areas were determined after Shirley-type background subtraction. Relative concentrations were calculated using the determined peak areas.
Results and discussion
Fig. 2 summarizes the catalytic activity of the Co/TiO2 catalyst, tested over an extended period of 200 h of FTS at 250 °C with a 2![[thin space (1/6-em)]](https://www.rsc.org/images/entities/char_2009.gif) :
:![[thin space (1/6-em)]](https://www.rsc.org/images/entities/char_2009.gif) 1 H2 to CO ratio.35 The catalytic activity decreased markedly within this testing period. The methane (C1) and C5+ selectivities were mostly stable around 40% and 30%, respectively.39
1 H2 to CO ratio.35 The catalytic activity decreased markedly within this testing period. The methane (C1) and C5+ selectivities were mostly stable around 40% and 30%, respectively.39
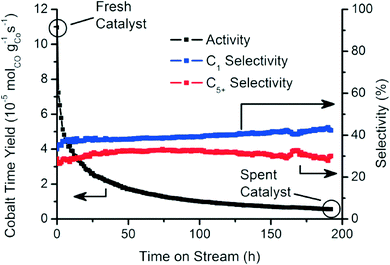 | ||
| Fig. 2 Catalytic activity and selectivity towards methane (C1) and liquid hydrocarbons (C5+) during the first 200 h of FTS reaction (250 °C, 1 bar, H2/CO = 2). | ||
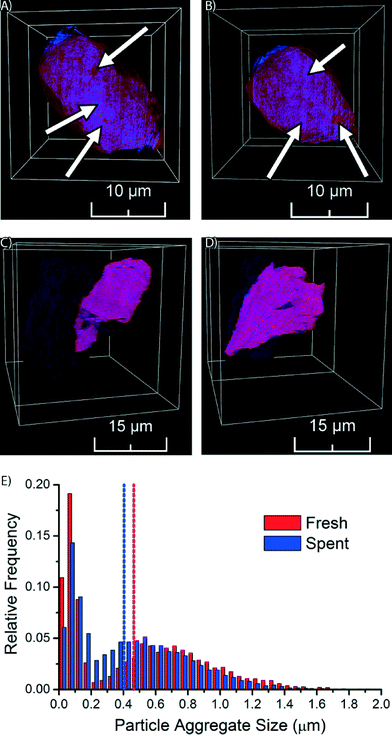
The fresh Co/TiO2 catalyst, as imaged by TXM tomography, is shown in Fig. 3, as well as in Movie S1.† Here, the TiO2 support is visualized in red, while Co is in blue. In the case of the fresh catalyst, we observe that the Co nanoparticles were not homogeneously distributed, but were clustered in catalyst particle regions (blue spots indicated by arrows in Fig. 3A and B and visible in Movie S1†). Red spots are also visible in Fig. 3A and B, which indicate areas with a lower Co concentration.
The formation of nanoparticle aggregates has previously been shown for Co/Al2O3 and Co/SiO2 FTS catalysts.38,40,41 We demonstrate here that aggregates of Co nanoparticles are also formed using TiO2 as support. The formation of aggregates of nanoparticles is most probably related to the drying temperature of the catalyst. It was recently shown for Co/SiO2 FTS catalysts that drying at 60 °C, as used in the preparation of the catalyst under study, results in pronounced aggregate formation.38 More recently, the formation of aggregates of nanoparticles on a TiO2 support has been shown to depend on drying conditions (in static air vs. a flow of air) and preparation method (IWI vs. homogeneous deposition precipitation).42
We performed similar TXM tomography experiments on the spent Co/TiO2 catalyst (after FTS at atmospheric pressure). These results are shown in Fig. 3C and D, as well as in Movie S2.† Interestingly, the distribution of Co now appears to be more homogeneous, as the imaged slices are more evenly colored purple. This demonstrates that the aggregates of Co nanoparticles have dispersed during FTS. The distribution of Co appears to be almost homogeneous at the present spatial resolution, which can only be explained by the existence of small Co nanoparticles, or even isolated Co atoms. It is remarkable to see that the redistribution of Co nanoparticles during FTS at atmospheric pressure took place over a length scale of multiple micrometers.
In order to obtain statistical insight into the changes in the distribution of Co nanoparticle aggregates during FTS we performed a detailed size analysis of the nanoparticle aggregates from the TXM data of both the fresh and spent Co/TiO2 catalyst particles. First, separation of background and nanoparticle aggregates was performed by top-hat segmentation. Next, overlapping aggregates were separated with a watershed separation on a distance map, where each Co-containing voxel was assigned a value based on the shortest distance to the background. The total volume of each aggregate was determined by counting the number of voxels of each aggregate and multiplying it with the voxel volume. The volume was finally converted into the equivalent diameter (i.e. the diameter of a sphere with the same volume). For the fresh catalyst 7144 aggregates were identified, while in the spent catalyst 14![[thin space (1/6-em)]](https://www.rsc.org/images/entities/char_2009.gif) 238 nanoparticle aggregates were identified.
238 nanoparticle aggregates were identified.
The resulting histogram of the distribution of aggregate sizes (Fig. 3E) shows that the Co aggregates in the spent catalyst have a more homogeneous size distribution than in the fresh catalyst. The median aggregate size decreased during FTS from 0.46 μm for the fresh catalyst to 0.40 μm for the spent catalyst. Furthermore, we see in the histograms that there are two maxima, the separation between the peaks being more pronounced in the fresh catalyst. The peaks at small aggregate sizes in both catalysts are most likely caused by single Co nanoparticles and/or small aggregates of nanoparticles (less than ∼200 nm). We are not able to accurately determine the size distribution of these particles or aggregates, because of limits in sensitivity (i.e., small, isolated particles are only weakly absorbing and might stay undetected) and spatial resolution (i.e., we cannot determine sizes that are close to the spatial resolution) inherent to the used technique. However, the presence of this peak does indicate that there are many particles with sizes less than ∼200 nm, which is in line with the crystallite sizes determined by XRD that were found to be about 18 nm for the fresh catalyst and 10 nm for the spent catalyst. The main broad peak in the histogram at larger aggregate size clearly suggests nanoparticle aggregate formation with aggregate sizes that are much larger than those of individual crystallite sizes. To account for this bi-modal distribution in the histogram we used the median to compare aggregate sizes of the two catalysts.
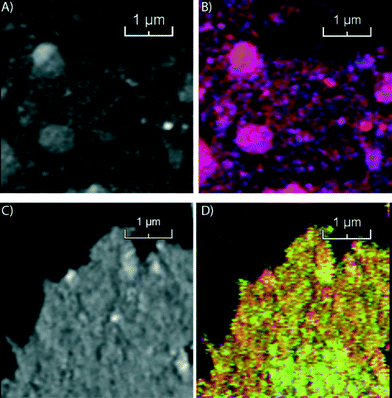
In the second step of our multi-scale catalyst particle investigation we performed STXM on the micro-tomed fresh and spent Co/TiO2 catalysts. The results of this STXM investigation are summarized in Fig. 4. The thickness of the fresh sample is nearly constant over the imaged area because of the ultramicrotomy, as can be seen in Fig. 4A. However, the fit results, summarized in Fig. 4B, show that the elemental distribution of Co is not homogeneous, as seen at this higher spatial resolution. The blue spots indicate areas of high Co concentration. There are also red-colored regions where there is little Co. The chemical phase of Co is Co3O4, as expected for a calcined Co/TiO2 catalyst.24,35
On the other hand, the results for the spent sample (Fig. 4C and D) indicate that the Co distribution is much more homogeneous, in agreement with the TXM results. Finally, the averaged spectrum shows that Co is in a Co2+ phase, as either CoO or CoTiO3. It is not possible to distinguish these two phases based on soft X-ray absorption spectra because the spectra are very similar (Fig. S2†).
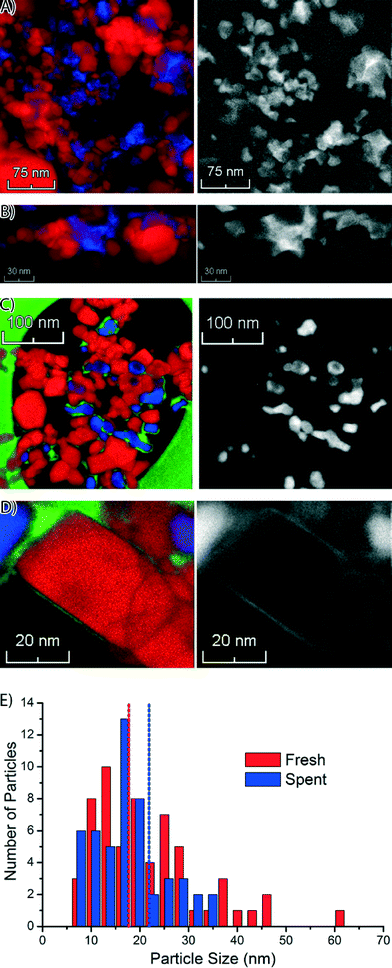
Next, we used STEM-EELS to study the catalyst materials with the highest spatial resolution. An overview of STEM-EELS images of the fresh Co/TiO2 catalyst is shown in Fig. 5. In the elemental maps it can be seen that the Co is present in aggregates of nanoparticles (Fig. 5A). The aggregates have sizes up to ∼100 nm, but the individual nanoparticles are much smaller. Similarly, in the high-magnification STEM-EELS images (Fig. 5B) we note Co nanoparticles formed in the crevices of the TiO2 particles. There are also Ti-rich regions without any Co visible in the left and right parts of the color-coded elemental maps in Fig. 5A and B. This suggests that the Co nanoparticles have grown into the pore network around the TiO2 particles, similar to what has been reported for Co/Al2O3 and Co/SiO2 FTS catalysts.38,43
Similar STEM-EELS experiments were performed on the spent Co/TiO2 catalyst. An overview image (Fig. 5C) shows that the Co nanoparticles are much better separated, and no longer in between the TiO2 particles. A layer of Co has formed around the TiO2 particles, even far away from any Co nanoparticle. This is also visible in the Co elemental map (right column of Fig. 5C). Finally, we recognize that carbon deposits have formed around and in between the Co nanoparticles, and some of the TiO2 particles. A thin layer of Co around the TiO2 particle is clearly visible in the high-magnification elemental map, and particularly in the Co map on the right (Fig. 5D). The thickness of the layer was estimated to be 1–2 nm. Remarkably, the formation of a Co layer is the opposite of the “classical” strong metal–support interaction (SMSI) effect, where a layer of TiO2 is formed around the Co nanoparticles.44 It is also notable that carbon (green) is also present near the Co (blue).
The size distribution of the Co nanoparticles from the STEM-EELS images is shown in Fig. 5E. The Co (oxide) nanoparticles have about the same size in both samples, but the size distribution of the fresh catalyst has a longer tail on the large particle side. The size of the particles (∼18 nm) is in broad agreement with the XRD results (Fig. S1†). From the STEM-EELS results, we can conclude that there is also a nanoscale redistribution of Co (formation of a thin Co layer), in addition to the microscale redistribution we observed with TXM and STXM.
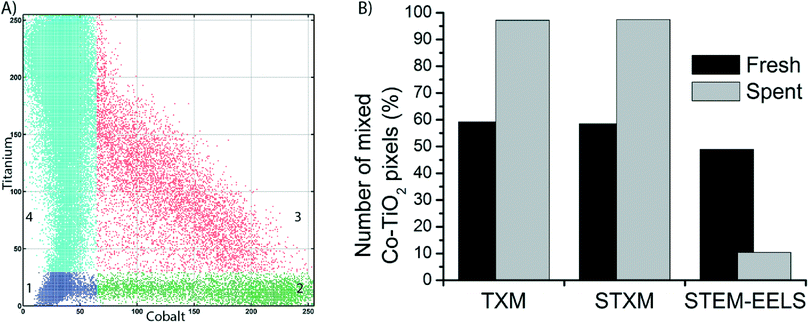
To get a more quantitative understanding of the redistribution of Co at both the micro- and the nanoscale we performed a statistical analysis of the data from the three microscopy techniques, as described in Fig. S4–S12.† First, correlation plots of the data were made by plotting each pixel according to its intensities in the Co and Ti elemental maps, on a scale of 0–255. The plots were manually segmented into 4 quadrants, numbered 1–4. An example of the clustering into 4 quadrants is given in Fig. 6A. Quadrant 1 (blue) is low in contributions from both Co and Ti, hence it represents the background of the image. Quadrant 2 (green) is high Co but low in Ti. Pixels in this quadrant have a relatively high Co concentration. Quadrant 3 (red) represents pixels that belong to a mixed Co/Ti phase. Finally, quadrant 4 (cyan) is almost purely Ti. All clustered correlation plots and histograms of the distributions of pixels over quadrants 2–4, as well as clustered images are given in the ESI.†
In the clustered images of the fresh catalysts from both X-ray imaging techniques (Fig. S8A and S11A†), there are regions that contain the mixed phase (quadrant 3, red) and regions that contain only Ti (quadrant 4, cyan). This is a confirmation of the aggregation of the Co nanoparticles, as there are pixels that contain no Co. Hence, there is a heterogeneous distribution of Co over the TiO2. In the images of the spent catalyst (Fig. S8B and S11B†), a large majority of the pixels is clustered in quadrant 3, the mixed phase. There is a strong correlation between pixels that contain Co and those that contain Ti. In other words, the distribution of Co over the TiO2 support is more homogeneous. These observations have been quantified in the comparison of the percentage of pixels present in quadrant 3 (Fig. 6B). For both TXM and STXM this is much higher in the spent catalyst (∼95% of the pixels) than in the fresh catalyst (∼60%).
On the other hand, in the STEM-EELS data the percentage of pixels in the mixed phase (quadrant 3) is lower in the spent catalyst than in the fresh catalyst. This is because the spatial resolution is higher than for the X-ray microscopy techniques, so the individual Co nanoparticles become visible. In the fresh catalyst a good portion of pixels (∼50%) are high in both Co and Ti. These are Co nanoparticles that are (partially) overlapping with TiO2 particles because the Co particles are present in the pores of the support. In the spent catalyst, the Co nanoparticles are better separated and more discrete, hence the fraction of pixels in quadrant 3 is less than in the fresh catalyst (∼10%).
To get an idea about the rate at which Co redistribution takes place, we have performed 2D in situ TXM experiments on the spent catalyst (the complete data set is shown in Fig. S13–S15†). The above-discussed statistical analysis was also applied to these TXM data, as well as to the in situ TXM data of the fresh catalyst that were published earlier.35 The results are summarized in Fig. S16.† Although we performed these measurements in 2D, averaging the contribution of Co and Ti for each pixel over the full depth of the particle, we still find a difference between the fresh and the spent catalysts. Importantly, the number of pixels in quadrant 3 stays more or less constant during the in situ experiment. This is an indication that the redistribution of Co takes place on a longer time scale than the ∼10 h of in situ TXM beam time, which is already a long acquisition time at a synchrotron beamtime. Thus, we conclude that the microscale redistribution of Co is a relatively slow process.
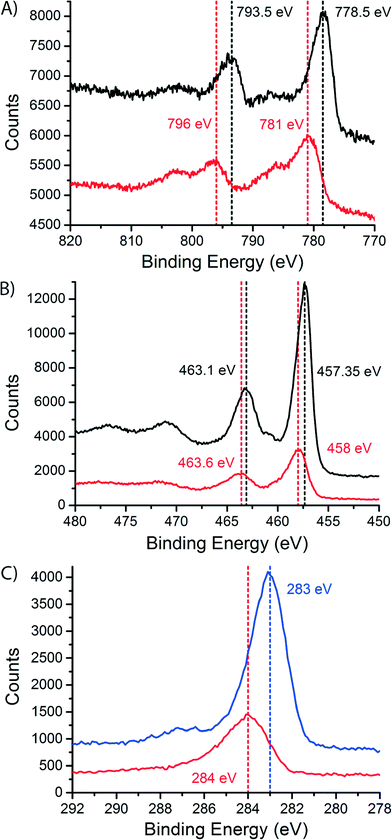
To study the dispersion of Co over the support on a bulk (non-microscopic) level, we performed X-ray photoelectron spectroscopy (XPS) on the fresh and the spent catalysts, after exposure to air. The spectra are shown in Fig. 7. In the cobalt spectra (Fig. 7A) we can see a shift to higher binding energies in the peaks when we compare the fresh and the spent samples. The peak at low binding energy shifts from 778.5 eV for the fresh catalyst to 781 eV for the spent catalyst. The peak at higher binding energy shifts from 793.5 eV for the fresh catalyst to 796 eV for the spent catalyst. Both peaks shift 2.5 eV. This is caused by the change in oxidation state between the fresh catalyst (Co3O4) and the spent catalyst (CoO or CoTiO3).45 The shoulder in the spectrum of the spent catalyst is a charge transfer satellite peak. The XPS spectra for CoO and CoTiO3 are equivalent, like the XAS spectra.46
On the other hand, the titanium spectra (Fig. 7B) are similar for the fresh and the spent catalyst, with only a small change in peak position. The peaks shift only ∼0.5 eV. This makes sense because a change in oxidation state is not expected for TiO2. However, we do see that the intensity of the TiO2 peaks is much lower in the spectra of the spent catalyst. This difference was quantified by integrating the peak areas. In the fresh catalyst, a surface Co/Ti atomic ratio of 0.268 ± 0.022 was found. In the spent catalyst the atomic ratio was determined to be 0.78 ± 0.03. The increase in the atomic ratio at the surface of the catalyst samples during FTS is explained by the spreading of Co over the TiO2 surface and indicates that the TiO2 particles are to a large extent covered with a thin Co layer. This provides a non-microscopic confirmation of the obtained STEM-EELS results. Finally, we note that there is no peak belonging to Ti3+ (a shoulder at lower binding energy47,48), which would point to the traditional SMSI effect, usually thought to be caused by partially reduced Ti species.44,49
In the C 1s XPS spectra of the spent Co/TiO2 catalyst (red curve in Fig. 7C) there is a peak at 284 eV. This peak is commonly associated with amorphous and polyaromatic carbon species.50 This is a confirmation of the layer of carbon that was seen with STEM-EELS. This result also shows that the carbon most probably consists of graphitic, and/or coke-like species. After a calcination treatment at 300 °C in stagnant air for 4 h, the blue XPS spectrum in Fig. 7C is obtained, showing a peak at about 283 eV. This peak can be associated with carbidic carbon at the surface of the cobalt nanoparticles.51,52 The formation of this surface Co2C has been observed earlier in Co foils after exposure to CO and H2,52 spent Co/Al2O3 catalysts50 and catalysts supported on activated carbon.53 In the latter report, bulk Co2C was also found in the spent catalysts using XRD. However, we cannot exclude that the carbide is formed during the calcination treatment, although this is not very likely.
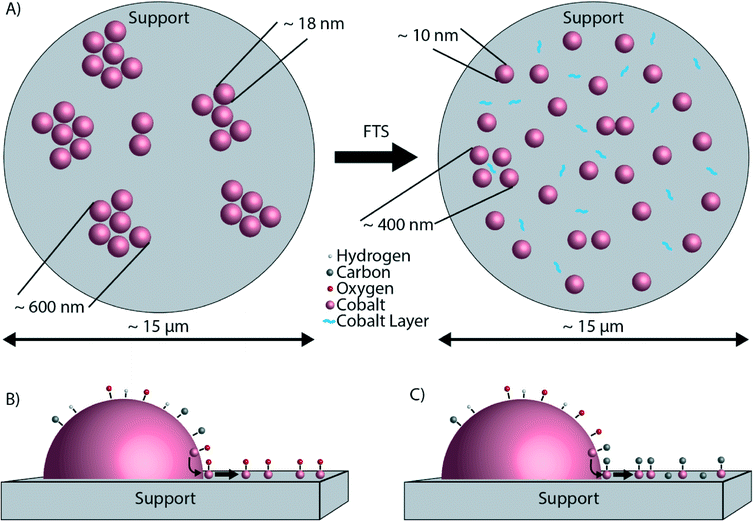
The findings as reported so far are illustrated in Fig. 8. Fig. 8A shows the microscale redistribution of Co over the TiO2 particles. The formation of a layer of Co is also shown (Fig. 8B and C). We can now propose a hypothesis for the nanoscale redistribution. The spectral resolution of the EELS spectra was not sufficient to determine the valence state of the Co. However, the XPS data indicate that the Co layer is oxidic, but this is most likely caused by the passivation layer upon exposure to air. Several studies did not find evidence for Co oxidation under FTS conditions, making bulk Co oxidation rather unlikely.29,35,54,55 However, in these studies any possible oxidation effects at the surface of otherwise metallic Co nanoparticles were not investigated. On the other hand, it was recently thermodynamically calculated that oxidation of the surface of Co is possible, and even likely under typical FTS.56 According to these calculations, a significant fraction of Co surface atoms can be partially oxidized under reaction conditions. Surface oxidation of Co FTS catalysts has also been suggested as a deactivation mechanism.57,58 More recently, surface oxidation has been directly observed experimentally.59 Of importance is to mention here the recent work of Kliewer and co-workers, in which a re-oxidation model has been proposed on the basis of environmental TEM data for a Pt-supported TiO2 catalyst, leading to sintering due to the wetting of the formed oxide.60 Assuming that the partially oxidized CoOx species is indeed mobile,61 Co atoms can diffuse from the Co nanoparticle onto TiO2, exposing fresh, reduced Co atoms at the surface of the nanoparticle. The result is a net flux of Co atoms from the surface of the Co nanoparticles to the TiO2 particles, where a thin Co layer is formed. The consequence of this process is a loss of Co metallic surface area, hence a lower catalytic activity. Furthermore, it is well known that Co nanoparticles smaller than 6–8 nm are less active in FTS than larger Co nanoparticles,62 and therefore it is likely that the ∼1–2 nm Co layer is also less active. This possible deactivation mechanism is illustrated in Fig. 8B. The formation of a surface layer of oxidic material was previously described as “reaction-induced spreading”.34 It was shown that different oxidic materials can spread over TiO2 surfaces under the influence of reaction products. Simple alcohols, such as methanol or ethanol, promote the effect. Also water, the main by-product of FTS may induce the spreading of an oxidic material on a TiO2 surface. The driving force for reaction-induced spreading is a decrease in overall surface free energy or a concentration gradient of the metal oxide, similar to the driving force of thermal spreading.34 However, we can exclude thermal spreading of CoO because the Tammann temperature (the temperature above which thermal processes take place, generally taken as half the melting point in K (ref. 34)) of CoO is 779 °C,63i.e. much higher than the 250 °C where our catalytic tests were performed.
Another, and most probably one of the most intriguing observations of this characterization study is the formation of a layer of Co embedded in carbon deposits, most likely coke and/or residual waxes. The XPS experiments suggest that coke is the most likely form of carbon in the spent catalyst. The carbon deposits could also point to coke formation as a possible deactivation mechanism. The presence of carbon in the Co layer makes bulk Co oxidation even less likely because carbon species in general cause a reducing environment. We can speculate about two possible explanations for the correlation of C and Co. The first is that coke is formed on the Co nanoparticles and then grows along the TiO2 particles, while transporting some Co along with it. The coke forms a layer of carbon with atoms of Co embedded in the coke. The nucleation of carbon deposits combined with growth along catalyst support particles was recently reported for Co/Al2O3 FTS catalysts.64 Second, it is possible that not the surface oxide, but surface carbide is the mobile species. The likely formation of surface carbide species in relation with coke formation has been investigated experimentally50 as well as theoretically.65 The XPS experiments on the spent Co/TiO2 catalyst after calcination suggest that surface carbide can be formed during FTS. The formation of a mobile cobalt carbide phase is illustrated in Fig. 8C. Recently, it was shown that Co/Al2O3 catalysts undergo more rapid sintering when exposed to both H2O and CO.66 This was explained by Ostwald ripening with cobalt sub-carbonyls moving across a hydrated alumina surface. However, much lower H2O and CO partial pressures were used during our FTS experiments as they are performed at atmospheric pressures. As a result, it is not possible (yet) to extrapolate our current findings to those encountered under more realistic FTS conditions (i.e., high partial pressures of H2O and CO). Finally, it is also possible that the Co layer forms first, and the layer is a very good catalyst for coke formation, which grows around the Co layer. Of course, a combination of these mechanisms is also conceivable.
Conclusions
Making use of a powerful multi-scale microscopy approach we have found significant differences in the Co nanoparticle distribution over a TiO2 support before and after FTS reaction as conducted at atmospheric pressures. Based on our observations, we conclude the following:• In the fresh Co/TiO2 catalyst, Co is present in aggregates of nanoparticles that are much larger than the nanoparticles themselves. On the other hand, in the spent Co/TiO2 catalyst, Co is distributed more homogeneously, meaning that the nanoparticles are better separated and no longer form aggregates. Hence, there is a redistribution of Co nanoparticles occurring over multiple micrometers during FTS.
• There is also nanoscale redistribution of cobalt forming a ∼1–2 nm Co layer around the TiO2 particles. This thin layer is probably formed by atomic transport of Co and interestingly C is also present in this layer. The formation of the thin layer of Co is the opposite of the “classical” SMSI effect, where a layer of TiOx forms around the Co nanoparticles.
• A plausible hypothesis for the formation of this Co layer is related to the surface oxidation or surface carbide formation of Co, resulting in a partial monolayer of CoOx or Co2C, respectively. This mobile species then gradually spreads over the surface of the TiO2 support during the FTS process. Future experiments under more realistic FTS conditions (i.e., high CO conversion, hence high partial pressures of steam) have to validate the generality of these intriguing findings occurring at different length scales.
Acknowledgements
M. de Ridder from Shell is acknowledged for performing the XPS experiments. J. den Breejen and S. van Bavel, both from Shell, are thanked for fruitful discussions. O. Attila, H. van der Bij, D. Cicmil, S. Kalirai, R. Oord, C. van Oversteeg, P. Paalanen, Z. Ristanovic, M. Al Samarai and M. Velthoen, all from Utrecht University, are kindly thanked for their help during data acquisition. We are grateful to P. Munnik from Utrecht University for performing the ultra-microtomy. We appreciate financial support from Shell Global Solutions, NRSC-C and NWO-CW VICI. Part of this research was carried out at the Stanford Synchrotron Radiation Lightsource, a Directorate of SLAC National Accelerator Laboratory and an Office of Science User Facility operated by the U.S. Department of Energy Office of Science by Stanford University. Other parts of the research described in this paper were performed at the Canadian Light Source, which is funded by the Canada Foundation for Innovation, the Natural Sciences and Engineering Research Council of Canada, the National Research Council Canada, the Canadian Institutes of Health Research, the Government of Saskatchewan, Western Economic Diversification Canada, and the University of Saskatchewan. The research leading to these results has received funding from the European Union Seventh Framework Programme [FP7/2007–2013] under Grant Agreement No. 312483 (ESTEEM2).Notes and references
- A. Y. Khodakov, W. Chu and P. Fongarland, Chem. Rev., 2007, 107, 1692–1744 CrossRef CAS PubMed.
- E. de Smit and B. M. Weckhuysen, Chem. Soc. Rev., 2008, 37, 2758–2781 RSC.
- N. Fischer, B. Clapham, T. Feltes, E. van Steen and M. Claeys, Angew. Chem., Int. Ed., 2014, 53, 1342–1345 CrossRef CAS PubMed.
- V. R. Calderone, N. R. Shiju, D. Curulla-Ferré, S. Chambrey, A. Khodakov, A. Rose, J. Thiessen, A. Jess and G. Rothenberg, Angew. Chem., Int. Ed., 2013, 52, 4397–4401 CrossRef CAS PubMed.
- A. J. Markvoort, R. A. van Santen, P. A. J. Hilbers and E. J. M. Hensen, Angew. Chem., Int. Ed., 2012, 51, 9015–9019 CrossRef CAS PubMed.
- N. G. Hamilton, I. P. Silverwood, R. Warringham, J. Kapitán, L. Hecht, P. B. Webb, R. P. Tooze, S. F. Parker and D. Lennon, Angew. Chem., Int. Ed., 2013, 52, 5608–5611 CrossRef CAS PubMed.
- D. D. Hibbitts, B. T. Loveless, M. Neurock and E. Iglesia, Angew. Chem., Int. Ed., 2013, 52, 12273–12278 CrossRef CAS PubMed.
- A. Voronov, N. E. Tsakoumis, N. Hammer, W. van Beek, H. Emerich and M. Rønning, Catal. Today, 2014, 229, 23–33 CrossRef CAS.
- N. E. Tsakoumis, R. Dehghan-Niri, M. Rønning, J. C. Walmsley, Ø. Borg, E. Rytter and A. Holmen, Appl. Catal., A, 2014, 479, 59–69 CrossRef CAS.
- I. D. Gonzalez-Jimenez, K. Cats, T. Davidian, M. Ruitenbeek, F. Meirer, Y. Liu, J. Nelson, J. C. Andrews, P. Pianetta, F. M. F. de Groot and B. M. Weckhuysen, Angew. Chem., Int. Ed., 2012, 51, 11986–11990 CrossRef CAS PubMed.
- O. O. James, B. Chowdhury, M. A. Mesubi and S. Maity, RSC Adv., 2012, 2, 7347 RSC.
- Q. Zhang, W. Deng and Y. Wang, J. Energy Chem., 2013, 22, 27–38 CrossRef CAS.
- M. E. Dry, in Handbook of Heterogeneous Catalysis, ed. G. Ertl, H. Knozinger, F. Schuth and J. Weitkamp, Wiley-VCH, Weinheim, 2008, pp. 2965–2994 Search PubMed.
- E. Iglesia, Appl. Catal., A, 1997, 161, 59–78 CrossRef CAS.
- A. Y. Khodakov, Catal. Today, 2009, 144, 251–257 CrossRef CAS.
- F. G. Botes, J. W. Niemantsverdriet and J. van de Loosdrecht, Catal. Today, 2013, 215, 112–120 CrossRef CAS.
- N. E. Tsakoumis, M. Rønning, Ø. Borg, E. Rytter and A. Holmen, Catal. Today, 2010, 154, 162–182 CrossRef CAS.
- (a) M. Argyle and C. Bartholomew, Catalysts, 2015, 5, 145–269 CrossRef CAS; (b) C. H. Bartholomew, Appl. Catal., A, 2001, 212, 17–60 CrossRef CAS; (c) D. Kistamurthy, A. M. Saib, D. J. Moodley, J. W. Niemantsverdriet and C. J. Westrate, J. Catal., 2015, 328, 123–129 CrossRef CAS.
- K. Keyvanloo, M. J. Fisher, W. C. Hecker, R. J. Lancee, G. Jacobs and C. H. Bartholomew, J. Catal., 2015, 327, 33–47 CrossRef CAS.
- P. C. Thüne, C. J. Weststrate, P. Moodley, A. M. Saib, J. van de Loosdrecht, J. T. Miller and J. W. Niemantsverdriet, Catal. Sci. Technol., 2011, 1, 689–697 Search PubMed.
- P. Boldrin, J. R. Gallagher, G. B. Combes, D. I. Enache, D. James, P. R. Ellis, G. Kelly, J. B. Claridge and M. J. Rosseinsky, Chem. Sci., 2015, 6, 935–944 RSC.
- H. Karaca, J. Hong, P. Fongarland, P. Roussel, A. Griboval-Constant, M. Lacroix, K. Hortmann, O. V. Safonova and A. Y. Khodakov, Chem. Comm., 2010, 46, 788–790 RSC.
- N. Kumar, E. A. Payzant, K. Jothimurugesan and J. J. Spivey, Phys. Chem. Chem. Phys., 2011, 13, 14735–14741 RSC.
- F. Morales, F. M. F. de Groot, P. Glatzel, E. Kleimenov, H. Bluhm, M. Hävecker, A. Knop-Gericke and B. M. Weckhuysen, J. Phys. Chem. B, 2004, 108, 16201–16207 CrossRef CAS.
- F. Morales, D. Grandjean, A. Mens, F. M. F. de Groot and B. M. Weckhuysen, J. Phys. Chem. B, 2006, 110, 8626–8639 CrossRef CAS PubMed.
- G. Jacobs, Y. Ji, B. H. Davis, D. Cronauer, A. J. Kropf and C. L. Marshall, Appl. Catal., A, 2007, 333, 177–191 CrossRef CAS.
- J. Hong, E. Marceau, A. Y. Khodakov, A. Griboval-Constant, C. La Fontaine and V. Briois, Chem. – Eur. J., 2012, 18, 2802–2805 CrossRef CAS PubMed.
- A. Rochet, V. Moizan, C. Pichon, F. Diehl, A. Berliet and V. Briois, Catal. Today, 2011, 171, 186–191 CrossRef CAS.
- N. E. Tsakoumis, A. Voronov, M. Rønning, W. van Beek, Ø. Borg, E. Rytter and A. Holmen, J. Catal., 2012, 291, 138–148 CrossRef CAS.
- Y. Liu, F. Meirer, J. Wang, G. Requena, P. Williams, J. Nelson, A. Mehta, J. C. Andrews and P. Pianetta, Anal. Bioanal. Chem., 2012, 404, 1297–1301 CrossRef CAS PubMed.
- J. C. Andrews and B. M. Weckhuysen, ChemPhysChem, 2013, 14, 3655–3666 CrossRef CAS PubMed.
- F. M. F. de Groot, E. de Smit, M. M. van Schooneveld, L. R. Aramburo and B. M. Weckhuysen, ChemPhysChem, 2010, 11, 951–962 CrossRef CAS PubMed.
- (a) E. de Smit, I. Swart, J. F. Creemer, C. Karunakaran, D. Bertwistle, H. W. Zandbergen, F. M. F. de Groot and B. M. Weckhuysen, Angew. Chem., Int. Ed., 2009, 48, 3632–3636 CrossRef CAS PubMed; (b) E. de Smit, I. Swart, J. F. Cremer, G. H. Hoveling, M. K. Gilles, T. Tyliszczak, P. J. Kooyman, H. W. Zandbergen, C. Morin, B. M. Weckhuysen and F. M. F. de Groot, Nature, 2008, 456, 222–225 CrossRef CAS PubMed.
- C.-B. Wang, Y. Cai and I. E. Wachs, Langmuir, 1999, 15, 1223–1235 CrossRef CAS.
- K. H. Cats, I. D. Gonzalez-Jimenez, Y. Liu, J. Nelson, D. van Campen, F. Meirer, A. M. J. van der Eerden, F. M. F. de Groot, J. C. Andrews and B. M. Weckhuysen, Chem. Commun., 2013, 49, 4622–4624 RSC.
- F. Meirer, J. Cabana, Y. Liu, A. Mehta, J. C. Andrews and P. Pianetta, J. Synchrotron Radiat., 2011, 18, 773–781 CAS.
- Y. Liu, F. Meirer, P. A. Williams, J. Wang, J. C. Andrews and P. Pianetta, J. Synchrotron Radiat., 2012, 19, 281–287 CrossRef CAS PubMed.
- P. Munnik, P. E. de Jongh and K. P. de Jong, J. Am. Chem. Soc., 2014, 136, 7333–7340 CrossRef CAS PubMed.
- G. Henrici-Olivé and S. Olivé, Angew. Chem., Int. Ed. Engl., 1976, 15, 136–141 CrossRef.
- Ø. Borg, J. C. Walmsley, R. Dehghan, B. S. Tanem, E. A. Blekkan, S. Eri, E. Rytter and A. Holmen, Catal. Lett., 2008, 126, 224–230 CrossRef.
- D. G. Castner, P. R. Watson and I. Y. Chan, J. Phys. Chem., 1989, 93, 3188–3194 CrossRef CAS.
- T. O. Eschemann and K. P. de Jong, ACS Catal., 2015, 5, 3181–3188 CrossRef CAS.
- I. Arslan, J. C. Walmsley, E. Rytter, E. Bergene and P. A. Midgley, J. Am. Chem. Soc., 2008, 130, 5716–5719 CrossRef CAS PubMed.
- V. A. de la Peña O'Shea, M. C. Álvarez Galván, A. E. Platero Prats, J. M. Campos-Martin and J. L. G. Fierro, Chem. Comm., 2011, 47, 7131–7133 RSC.
- M. C. Biesinger, B. P. Payne, A. P. Grosvenor, L. W. M. Lau, A. R. Gerson and R. S. C. Smart, Appl. Surf. Sci., 2011, 257, 2717–2730 CrossRef CAS.
- K. Okada and A. Kotani, J. Phys. Soc. Jpn., 1992, 61, 449–453 CrossRef CAS.
- F. Guillemot, M. Porté, C. Labrugère and C. Baquey, J. Colloid Interface Sci., 2002, 255, 75–78 CrossRef CAS PubMed.
- U. Diebold, Surf. Sci. Rep., 2003, 48, 53–229 CrossRef CAS.
- S. J. Tauster, S. C. Fung and R. L. Garten, J. Am. Chem. Soc., 1978, 100, 170–175 CrossRef CAS.
- K. Fei Tan, J. Xu, J. Chang, A. Borgna and M. Saeys, J. Catal., 2010, 274, 121–129 CrossRef CAS.
- G. A. Beitel, A. Laskov, H. Oosterbeek and E. W. Kuipers, J. Phys. Chem., 1996, 100, 12494–12502 CrossRef CAS.
- D. A. Wesner, G. Linden and H. P. Bonzel, Appl. Surf. Sci., 1986, 26, 335–356 CrossRef CAS.
- J. Xiong, Y. Ding, T. Wang, L. Yan, W. Chen, H. Zhu and Y. Lu, Catal. Lett., 2005, 102, 265–269 CrossRef CAS.
- G. L. Bezemer, T. J. Remans, A. P. van Bavel and A. I. Dugulan, J. Am. Chem. Soc., 2010, 132, 8540–8541 CrossRef CAS PubMed.
- M. Rønning, N. E. Tsakoumis, A. Voronov, R. E. Johnsen, P. Norby, W. van Beek, Ø. Borg, E. Rytter and A. Holmen, Catal. Today, 2010, 155, 289–295 CrossRef.
- M. Sadeqzadeh, S. Chambrey, J. Hong, P. Fongarland, F. Luck, D. Curulla-Ferré, D. Schweich, J. Bousquet and A. Y. Khodakov, Ind. Eng. Chem. Res., 2014, 53, 6913–6922 CrossRef CAS.
- D. Schanke, A. M. Hilmen, E. Bergene, K. Kinnari, E. Rytter, E. Ådnaness and A. Holmen, Catal. Lett., 1995, 34, 269–284 CrossRef CAS.
- D. Schanke, A. M. Hilmen, E. Bergene, K. Kinnari, E. Rytter, E. Ådnanes and A. Holmen, Energy Fuels, 1996, 10, 867–872 CrossRef CAS.
- C. Lancelot, V. Ordomsky, O. Stephan, M. Sadeqzadeh, H. Karaca, M. Lacroix, D. Curulla-Ferre, F. Luck, P. Fongarland, A. Griboval-Constant and A. Y. Khodakov, ACS Catal., 2014, 4, 4510–4515 CrossRef CAS.
- C. E. Kliewer, S. Miseo, J. E. Baumgartner, E. Stach and D. Zakharov, Microsc. Microanal., 2009, 15, 1066–1067 CrossRef.
- M. Sadeqzadeh, J. Hong, P. Fongarland, D. Curulla-Ferré, F. Luck, J. Bousquet, D. Schweich and A. Y. Khodakov, Ind. Eng. Chem. Res., 2012, 51, 11955–11964 CrossRef CAS.
- G. L. Bezemer, J. H. Bitter, H. P. C. E. Kuipers, H. Oosterbeek, J. E. Holewijn, X. Xu, F. Kapteijn, A. J. van Dillen and K. P. de Jong, J. Am. Chem. Soc., 2006, 128, 3956–3964 CrossRef CAS PubMed.
- W. M. Haynes, CRC Handbook of Chemistry and Physics, CRC Press, Boca Raton, 95th edn, 2014 Search PubMed.
- D. Peña, A. Griboval-Constant, C. Lancelot, M. Quijada, N. Visez, O. Stéphan, V. Lecocq, F. Diehl and A. Y. Khodakov, Catal. Today, 2014, 228, 65–76 CrossRef.
- A. Nandula, Q. T. Trinh, M. Saeys and A. N. Alexandrova, Angew. Chem., Int. Ed., 2015, 54, 5312–5316 CrossRef CAS PubMed.
- M. Claeys, M. E. Dry, E. van Steen, P. J. van Berge, S. Booyens, R. Crous, P. van Helden, J. Labuschagne, D. J. Moodley and A. M. Saib, ACS Catal., 2015, 5, 841–852 CrossRef CAS.
Footnote |
| † Electronic supplementary information (ESI) available: Tomographic movies of the fresh and the spent catalysts, X-ray diffractograms of the fresh and the spent catalysts, soft X-ray absorption spectra of CoO and CoTiO3, complete STEM-EELS data of the fresh and the spent catalyst, statistical analysis of the data from all three microscopy techniques and the in situ TXM data. See DOI: 10.1039/c5cy01524c |
| This journal is © The Royal Society of Chemistry 2016 |

