 Open Access Article
Circular dichroism spectroscopy of membrane proteins
A. J.
Miles
and
B. A.
Wallace
*
Institute of Structural and Molecular Biology, Birkbeck College, University of London, Malet Street, London, WC1E 7HX, UK. E-mail: b.wallace@mail.cryst.bbk.ac.uk
First published on 27th June 2016
Abstract
Circular dichroism (CD) spectroscopy is a well-established technique for studying the secondary structures, dynamics, folding pathways, and interactions of soluble proteins, and is complementary to the high resolution but generally static structures produced by X-ray crystallography, NMR spectroscopy, and cryo electron microscopy. CD spectroscopy has special relevance for the study of membrane proteins, which are difficult to crystallise and largely ignored in structural genomics projects. However, the requirement for membrane proteins to be embedded in amphipathic environments such as membranes, lipid vesicles, detergent micelles, bicelles, oriented bilayers, or nanodiscs, in order for them to be soluble or dispersed in solution whilst maintaining their structure and function, necessitates the use of different experimental and analytical approaches than those employed for soluble proteins. This review discusses specialised methods for collecting and analysing membrane protein CD data, highlighting where protocols for soluble and membrane proteins diverge.
Key learning points1. Uses of circular dichroism (CD) spectroscopy for studying the structure of membrane proteins.2. Important additional considerations when using circular CD for studying membrane proteins, such as solvent shift effects, light scattering, and differential absorption flattening. 3. The consequences of these effects on membrane protein CD spectra and means for mitigating them. 4. Specialised methods such as thermal unfolding studies and oriented CD of anisotropic membrane samples. 5. Procedures for data collection, processing and analyses of membrane protein spectra. |
1. Introduction
1.1 Membrane proteins
Membrane proteins play essential roles in a wide variety of physiological functions, such as ionic regulation, molecular recognition, energy transduction and cell adhesion. It has been estimated that approximately 30% of all open reading frames in the human genome are membrane proteins and that they represent more than 60% of current drug targets.1Structural data are important for understanding how proteins achieve their functions, and therefore can provide insight into the nature of related diseased states, potentially leading to rational drug design; however the challenge of obtaining such data for membrane proteins is revealed by a quick review of the literature: at the time of writing this review, over 100![[thin space (1/6-em)]](https://www.rsc.org/images/entities/char_2009.gif) 000 protein structures have been deposited in the Protein Data Bank (PDB)2 of which fewer than 2000 are membrane proteins.3 These figures are reflective of the many obstacles to studies of membrane proteins, including the difficulties in purifying membrane protein/detergent complexes in high yields and the challenges of maintaining functional viability and of coaxing amphipathic proteins into crystalline organisations. Consequently most structural genomics programmes have automatically excluded membrane proteins and consequently the proportion of known membrane protein structures relative to those of soluble proteins is decreasing. Hence the availability of other structural methods for characterising membrane protein structures and their interactions with ligands, lipids and other proteins is paramount. Circular dichroism (CD) spectroscopy is such a method, and has, to date, been utilised in more than 10
000 protein structures have been deposited in the Protein Data Bank (PDB)2 of which fewer than 2000 are membrane proteins.3 These figures are reflective of the many obstacles to studies of membrane proteins, including the difficulties in purifying membrane protein/detergent complexes in high yields and the challenges of maintaining functional viability and of coaxing amphipathic proteins into crystalline organisations. Consequently most structural genomics programmes have automatically excluded membrane proteins and consequently the proportion of known membrane protein structures relative to those of soluble proteins is decreasing. Hence the availability of other structural methods for characterising membrane protein structures and their interactions with ligands, lipids and other proteins is paramount. Circular dichroism (CD) spectroscopy is such a method, and has, to date, been utilised in more than 10![[thin space (1/6-em)]](https://www.rsc.org/images/entities/char_2009.gif) 000 publications on membrane proteins and peptides. This review discusses specific considerations that are essential for undertaking CD studies of membrane proteins, including the underlying issues that distinguish CD spectroscopic characterisations of soluble and membrane proteins, as well as special protocols for data collection and analyses when using CD spectroscopy to characterise membrane proteins.
000 publications on membrane proteins and peptides. This review discusses specific considerations that are essential for undertaking CD studies of membrane proteins, including the underlying issues that distinguish CD spectroscopic characterisations of soluble and membrane proteins, as well as special protocols for data collection and analyses when using CD spectroscopy to characterise membrane proteins.
1.2 Circular dichroism spectroscopy
CD spectroscopy is a well-established biophysical tool for the structural characterisation of biopolymers such as proteins and nucleic acids. The physical basis for the technique is the differential absorption of left- and right-handed circularly polarised light by molecules which either contain a chiral centre, or have a three dimensional structure that provides a chiral environment. Although the structural information obtained from CD is limited compared to that obtained by X-ray crystallography, NMR spectroscopy, or cryo electron microscopy, it is a valuable adjunct to these techniques and offers a number of advantages. These advantages include the ability to explore a wide range of solution conditions and temperatures, rapid data collection, and the consumption of relatively small amounts of sample material.Protein secondary structural information can be derived from CD signals in the far ultraviolet (UV) wavelength region between ∼240 and 190 nm due to the amide chromophores of the peptide bonds. There are two types of electron transitions responsible for the CD signals in this wavelength region, an n → π* transition at around 222 nm, and π → π* transitions (both parallel and perpendicular orientations) at ∼208 and 190 nm. Far UV CD spectroscopy can not only be used to determine the secondary structure content of proteins but also to provide information on ligand–protein interactions and to monitor protein folding and unfolding. In addition, qualitative tertiary structural information can be obtained from the environmental-dependent CD spectra of protein aromatic residues in the near UV (250 nm to 300 nm) wavelength range.
Both the techniques and applications of CD and its enhanced version, synchrotron radiation circular dichroism (SRCD) spectroscopy [see Section 4.4], for the study of soluble proteins have been reviewed in recent years.4–9 This review concentrates on specific uses of the technique for studies of membrane proteins, the unique experimental and analytical considerations (especially potential artifacts) that arise due to the particulate and hydrophobic nature of membrane protein samples, and how to minimise or mitigate these either experimentally or during analyses.
2. Differences between CD spectroscopy of soluble and membrane proteins
2.1 Effects of fold characteristics of membrane proteins on spectral properties
Integral membrane proteins tend to fall into two major classes, alpha helical up-down bundles or beta-barrels (Fig. 1). The individual helices or beta strands tend to be longer than those found in typical soluble proteins, since they span the membrane, which is generally around 30–50 nm thick. This requires around 7.5 turns or more of an alpha helix (∼25–30 residues), whereas the helices in soluble proteins tend to be on the order of ∼10–12 residues or less. Likewise the beta sheets in membrane-spanning beta-barrel structures tend to be significantly longer than the average beta sheet lengths in soluble proteins. It had been predicted that longer helices would produce hyperchromic effects in protein spectra;10 however, later studies indicated that this effect is not very significant in peptides with secondary structural elements longer than 10 residues,11 so on the whole, this is unlikely to be a significant issue when analysing secondary structures from CD spectra of membrane proteins. The influence of this effect on the empirically-determined secondary structures of membrane proteins based on CD data can be further minimised if the reference dataset used in the analysis includes a large variety of proteins with wide ranging examples of different secondary structural elements, as is commonly the case for modern bioinformatics-defined reference datasets.12,13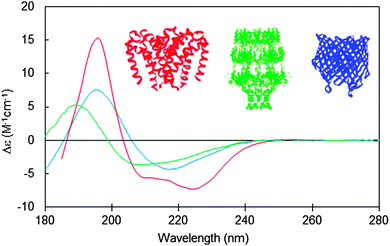 | ||
| Fig. 1 Circular dichroism spectra typical of membrane proteins composed of different secondary structural types: predominantly antiparallel alpha-helical bundle (red: a sodium channel pore48); predominantly beta-barrel (blue: BTUB outer membrane cobalamin transporter23), mixed helical, beta sheet and unordered structure (green: WZA translocon for capsular polysaccharides23). The CD spectra correspond to PCDDB47 IDs CD0004012000, CD0000102000, CD0000128000, respectively. Inset are the crystal structures (PDB IDs 4F4L, 1NQE, and 2J58, respectively) of these proteins depicted in the same colour scheme. | ||
2.2 Effects of environmental and physical characteristics of membrane proteins on spectral properties
CD spectroscopy has been widely used for the study of soluble proteins; however CD studies of membrane proteins have been more limited in their utility. A major reason for this has been that whereas soluble proteins form uniform isotropic solutions in aqueous environments, membrane proteins are sequestered into large hydrophobic, anisotropic particles such as liposomes or membrane fragments,14 detergent micelles, small unilamellar vesicles,15 and, more recently, nanodiscs,16 amphipols, and oriented lipid bilayers.17 These types of objects can give rise to spectral artifacts which present problems during data collection, analysis, and interpretation. Three major types of effects need to be considered: solvent-induced wavelength shifts, differential light scattering, and absorption flattening.6 The physical phenomena producing these effects, the effects they have on CD spectra and calculated secondary structures derived from CD data, and the means of mitigating these effects in membrane protein CD spectra are discussed in this section.2.2.1.1 The phenomenon. Membrane and detergent environments tend to be hydrophobic and/or amphipathic, so they have different physical properties than aqueous solutions, producing different spectral characteristics for proteins embedded in them. Because secondary structure analyses usually entail empirical methods based on reference datasets of spectra derived from soluble proteins of known structures, they often do not take into account the different characteristics present in membrane protein spectra. Most of the publically-available datasets only contain spectra of soluble proteins18 and any analysis of membrane protein spectra using them can be subject to large errors, due to the different “solvent” properties of the low dielectric medium of the bilayer.
The dielectric constant (∼1–2) of the hydrophobic core of a detergent micelle or phospholipid bilayer in which a membrane protein is embedded is considerably lower than that of water (∼80). This can cause both bathochromic and hypsochromic shifts in the CD spectrum of proteins measured in these environments compared to the spectra of proteins comprised of similar secondary structures but present in aqueous solution.19,20 The extent and nature of the shift depends on which electronic transition in the peptide is examined, and on the relative location of the peptide bond with respect to the membrane environment. The direction and magnitudes of the shifts are ultimately related to the changes in the energy gap between the ground and excited states of the transitions, and the peak positions can vary substantially between the same type of secondary structure in aqueous solution and in membranes.21 As the n → π* and π → π* transitions are differentially affected (Fig. 2), the wavelength dependence on solvent dielectric is non-linear and hence cannot be corrected simply by shifting the entire spectrum. Such shifts in peak positions can have significant effects on secondary structure analyses, and tend to produce inaccurate results when using standard deconvolution methods with the commonly-used reference datasets derived from soluble proteins.21
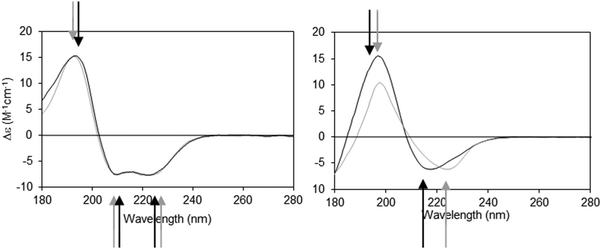 | ||
| Fig. 2 Demonstration of spectral shifts observed for each of the different electronic transitions in membrane protein spectra relative to those in soluble protein spectra. Membrane proteins (black spectra) and soluble proteins (grey spectra) were selected to have matching secondary structures in each case.21 Left: Predominantly helical proteins. Right: Predominantly beta sheet proteins. In both examples the arrows indicate the peak positions (in black and grey, respectively) for the membrane and soluble proteins. It is notable that not all of the peaks shift in the same direction, nor to the same extent. | ||
2.2.1.2 Solutions/corrections for the phenomenon. Although an early study attempted to deal with this issue by deconvoluting and separately shifting the individual transitions,22 this procedure was both computationally costly and difficult to enact due to the presence of both soluble and transmembrane domains in most membrane proteins. A more effective and simple solution was the creation of a reference dataset containing the spectra of membrane proteins. The SMP180 reference dataset [standing for soluble and membrane proteins including data down to 180 nm – and hence usable also for SRCD data]23 is comprised of 98 soluble protein spectra and 30 membrane protein spectra. It is available on the DichroWeb server24 (http://dichroweb.cryst.bbk.ac.uk) for use with a wide range of deconvolution algorithms. Because it contains both soluble and membrane proteins, this reference dataset is also suitable for polytopic proteins that contain both membrane-embedded and water-soluble (extramembranous) subunits or domains.
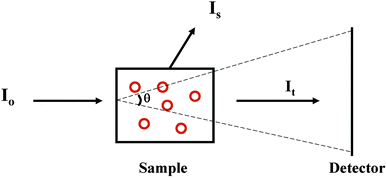
2.2.2.1 The phenomenon. Suspended particles with dimensions that are large relative to the wavelength of the incident light will scatter a proportion of the incident light away from the forward direction thereby reducing the transmitted light reaching the detector in a spectrophotometer, thus increasing the apparent absorbance due to the sample14 (Fig. 3). The extent of scattering is dependent upon both the size and the shape of the particle, as well as the refractive indices of the scattering object and the solvent. Light scattering is also wavelength-dependent and affects the low wavelength (high energy) data more drastically than the higher wavelength data. In a UV (unpolarised) spectrum this manifests itself as apparent absorbance in the wavelength regions where there is no chromophore absorption, and tends to produce a continuous spectrum with a sixth order wavelength dependence. This is commonly seen in UV spectra of membrane proteins which are measured in order to quantitate the amount of protein present from the A280 peak [see Section 3.2.1]. It also has the effect of decreasing the signal-to-noise ratio of the data in the UV region and raising the low wavelength cutoff of the data [lowest wavelength at which the data can be measured with statistically-significant accuracy]. The effects of light scattering are more serious in CD spectra than unpolarised UV spectra, as the refractive indices of an optically active sample are different for left- and right-circularly polarised light, leading to differential light scattering, which can change both the magnitudes and ratios of the different peaks, thereby distorting the shape of the spectrum15 (Fig. 4).
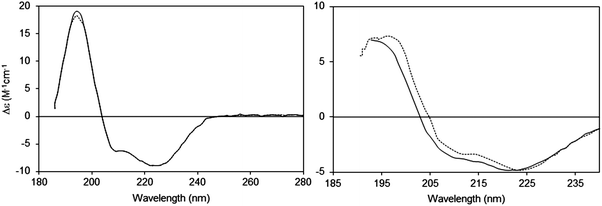 | ||
| Fig. 4 Light scattering effects in CD spectra:14,15 effects of changing the detector acceptance angle (θ). Left: Sample (bacteriorhodopsin in octyl glucoside micelles) that does not exhibit scattering, measured at two different values of θ (2 degrees: dashed line and 90 degrees: solid line). It can be seen that the spectra are essentially identical. Right: Sample (bacteriorhodopsin in purple membranes) that exhibits scattering (2 degrees: dashed line and 90 degrees: solid line). In this case the spectra are very different, both in magnitudes and peak positions of the wavelength maxima/minima. | ||
2.2.2.2 Solutions/corrections for the phenomenon. For (unpolarised) absorbance, the scattering component can be dealt with as follows: in the region above 310 nm (where there is no peptide bond chromophore absorption) the apparent absorption due to scattering As(λ) at wavelength λ, can be expressed as a single power dependence: As(λ) = kλ−n. A plot of log
![[thin space (1/6-em)]](https://www.rsc.org/images/entities/char_2009.gif) As(λ) versus log
As(λ) versus log![[thin space (1/6-em)]](https://www.rsc.org/images/entities/char_2009.gif) (λ) extrapolated into the far UV will give values for the constants n and k to provide a correction factor.14 However, this is not useful for CD measurements, because of the different extinction coefficients for the left- and right-circularly polarised absorbances. So direct physical changes to the sample or experimental setup are required to minimise or eliminate the problem.
(λ) extrapolated into the far UV will give values for the constants n and k to provide a correction factor.14 However, this is not useful for CD measurements, because of the different extinction coefficients for the left- and right-circularly polarised absorbances. So direct physical changes to the sample or experimental setup are required to minimise or eliminate the problem.
The simplest methods involve reducing the size of the particles so they are much smaller (∼1/10) than the wavelengths of the UV light used in the investigation.14 Most detergent micelles are too small to exhibit substantial scattering in the far UV region of the spectrum. However, there may be some concern about the conformation of a protein in a micellar environment being different from that in a membrane due to the packing constraints imposed by the relative size, shape and charge of the detergent head groups and the length and composition of the hydrophobic tail groups.25 Hence whilst the dimensions of micelles may be ideal for eliminating scattering, their physical characteristics such as their geometry may have deleterious effect on the protein structure. Furthermore, the functions of many types of membrane proteins (e.g. ion channels) cannot be assessed in micelles so there is no way to ensure their structure is not perturbed.
Small unilamellar vesicles (SUVs)14,15,26 (∼25 nm diameter) also tend to produce little scattering in the far UV region, and provide another solution. Such samples can be produced by mechanical means such as sonication or extrusion, but in very small vesicles the protein structure may be distorted by the process of producing the vesicles or by the curvature of the membranes. Alternatively the protein can be examined in bicelles, or nanodiscs, which can also have small dimensions relative to the wavelength of light used for CD studies. Again, however, there may be issues associated with protein integrity in such environments, and because the intra- and extra-cellular surfaces are not in separate compartments, some proteins such as channels also cannot be functionally assayed in these types of samples.
Alternatively, it has been suggested that scattering effects may not preclude all measurements in large lipid unilamellar vesicles (LUVs), a conclusion largely based on comparisons of a soluble protein in the presence and absence of lipid vesicles.27 However, in the test samples,27 the scattering particles (LUVs) were not themselves chiral, nor were the chiral objects (proteins) scatterers, meaning that the scattering would be non-chiral, and would naturally not influence the shape of the CD spectrum.15 Hence this may not have been an entirely suitable test for a chiral membrane protein in a scattering lipid vesicle. Nevertheless, their conclusions27 that protein CD spectra obtained in the presence of LUVs could be used if the data were limited to wavelengths above 200 (or 215 nm, depending on the size of the LUVs) may provide another option for avoiding the effects of light scattering. However, it is noteworthy that virtually all secondary structure analysis algorithms require the availability of data down to at least 190 nm (due to the number of eigenvectors of information present)28,29 so quantitative analyses in LUVs would not be accurate, but may be useful for the qualitative examination of large differences in more native-like environments.
A simple physical solution to the scattering problem is to locate the sample as close to the instrument detector as possible so that the light scattered at relatively large angles can be captured, eliminating the apparent effect on the spectrum. The detector acceptance angle (θ) geometry is defined in Fig. 3. Different commercial CD instruments have different default θ angles, but most can be modified to enable large values of θ by moving the sample (or detector) so that the sample cell is adjacent to the detector face. Most SRCD beamlines have this type of geometry as their default. The effectiveness of this procedure depends on the geometry of the scattering object, with empty and filled spheres, filaments, and discs producing very different 3-dimensional scattering profiles. However for “empty spheres” such as lipid vesicles, the scattering is generally within 90 degrees of the forward direction,14 an angle that can usually be achieved by the appropriate positioning of the cell and detector.
A practical consideration issue when moving the detector to obviate the scattering measured from the sample is the sample cell geometry. All of the scattered light from a particular angle θ must reach the detector and not be subtended by the side edges of the sample cell. This thus requires the use of circular rather than rectangular cells, as the sides of the latter would intersect some of the scattered light in the forward directions.
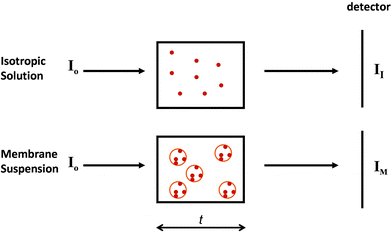
2.2.3.1 The phenomenon. Spectroscopic characterisations of solutions assume a uniform distribution of chromophores within the sample (Fig. 5, top). Hence for every slice (thickness element, or t) of the sample in the direction perpendicular to the light beam, the same number, on average, of proteins will be encountered. However, in membrane samples, proteins are usually not uniformly dispersed in the sample; rather they are localised to discrete regions of membrane, where the chromophores are concentrated, while the rest of the solution is depleted of proteins (Fig. 5, bottom). This means that even though the proteins may be uniformly distributed in the membrane particles, and the membrane particles uniformly distributed throughout the solution, the local protein concentrations within the sample are not uniformly distributed, leading to a breakdown of the Beer–Lambert law. As a consequence, the absorbance (or in the case of CD, the CD signal) will be diminished or “flattened” relative to the signal for a corresponding amount of protein in a dispersed solution14,30 (Fig. 6).
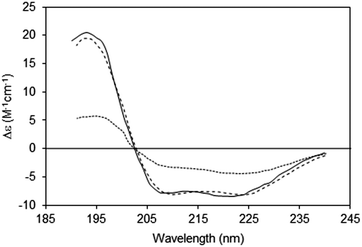 | ||
| Fig. 6 Spectra depicting the effects of absorption flattening on the spectra of a membrane protein, bacteriorhodopsin, which has a primarily helical secondary structure.14 Purple membrane fragments (large particles with low lipid-to-protein ratios, dotted line) where flattening is large, and small unilamellar vesicles (SUVs) (with high lipid-to-protein ratios, solid line) where flattening is negligible. These are compared with the spectrum calculated from the protein crystal structure (dashed line), which would correspond to an “unflattened” spectrum. It clearly matches the SUVs spectrum, but not the spectrum of the membrane fragments. | ||
The amount of flattening is proportional to the extent of the sample non-uniformity. This would be less problematic if the effect were uniform across the wavelength range of the spectrum, as it could simply be compensated for by a scaling factor. However, this is not the case because absorption (and thus flattening) is a function of the extinction coefficient of the sample at a given wavelength. Hence, the spectrum will not be uniformly flattened at all wavelengths. In an optically active sample the extinction coefficients at a given wavelength are different for left circular polarised light (CPL) and right CPL. As a consequence, the CD peaks are not only depressed with respect to samples at lower concentrations, but further distorted by this differential effect. Differential flattening will be more apparent for CD peaks with higher extinction coefficients (in most cases, this is the electron transition at ∼190 nm). Put simply, the higher the absorbance, the more the flattening, thus not only is the overall spectral magnitude reduced, but also the magnitude of different peaks are reduced by different amounts, thereby distorting the shape of the spectrum. The extent of the flattening will also depend on the relative concentration of the proteins in the particles, with higher concentrations producing more flattening, and also on the geometry of the particles.31
An extreme example is the purple membrane containing the membrane protein bacteriorhodopsin,10,30,31 in which the proteins are close-packed into two-dimensional crystals. Relative to a solution of isolated bacteriorhodopsin molecules, the spectrum of bacteriorhodopsin in purple membranes is not only much smaller, but the more intense peaks at ∼190 and 208 nm are significantly depressed relative to the less intensely absorbing peak at ∼222 nm. When compared with a dispersed sample of the protein in SUVs, or the back-calculated spectrum from the crystal structure, the spectrum of the highly concentrated protein patches is very different14 (Fig. 6).
The extent of the flattening (q) at any wavelength can be expressed as the ratio of the absorbance (or ellipticity in the case of CD) of the spectrum of the protein in the membrane particle (AM) divided by absorbance (or ellipticity) of the spectrum of the same protein in a completely dispersed form (AI).
2.2.3.2 Solutions/corrections for the phenomenon. Obviously the simplest means of correcting for this phenomenon would be to completely disperse the protein in a form where there was one protein per particle. If the protein can be incorporated into particles (detergent micelles, lipid vesicles, bicelles, amphipols, nanodiscs, or membrane fragments) containing a single protein then the dispersed condition can be met.30,31 However, that condition is challenging to meet, even for SUVs. It cannot be achieved simply by sonication of larger particles, as decreasing the particle size whilst maintaining the lipid-to-protein ratio will not significantly affect the distribution of absorbing proteins. The complete elimination of flattening in SUVs requires lipid-to-protein molar ratios of around 2000 [see Section 2.3]. However the CD signal from a sample with such a high lipid-to-proteins ratio will generally be compromised by the absorption of the phospholipid carboxyl groups which absorb strongly in the wavelengths of interest. So for membrane proteins there is often a trade-off of concerns for detergent effects versus spectral distortions produced by the particulate nature of lipid membranes.
2.3 Effects of lipid-to-protein molar ratios
There will inevitably be a compromise between the requirement to reduce solvent flattening by using high lipid-to-protein ratios, and the need to generate a measurable CD signal without overly raising the sample absorption due to high concentrations of lipid. Although lipids generally do not produce significant CD signals in the UV wavelength range used to study proteins, they do contribute to the overall (non-chiral) absorbance, and hence lead to less light reaching the detector after passing through the sample, and thus noisier spectra. Using conventional CD instruments, lipid/peptide molar ratios are often used at 50![[thin space (1/6-em)]](https://www.rsc.org/images/entities/char_2009.gif) :
:![[thin space (1/6-em)]](https://www.rsc.org/images/entities/char_2009.gif) 1 (or even lower) depending on the molecular weight of the protein or peptide under study, so that data may be collected down to 190 nm. However, such high protein (low lipid) concentrations may not be representative of those found in biological membranes, and may also encourage the aggregation of proteins within the bilayers, or may (especially in the case of surfactant peptides and proteins) result in membrane lysis.32
1 (or even lower) depending on the molecular weight of the protein or peptide under study, so that data may be collected down to 190 nm. However, such high protein (low lipid) concentrations may not be representative of those found in biological membranes, and may also encourage the aggregation of proteins within the bilayers, or may (especially in the case of surfactant peptides and proteins) result in membrane lysis.32
However, the high light flux of SRCD beamlines [see Section 4.4] (which enables light penetration through relatively opaque samples) can mitigate against these problems by enabling the measurement of SUVs which have lipid-to-protein ratios of 250![[thin space (1/6-em)]](https://www.rsc.org/images/entities/char_2009.gif) :
:![[thin space (1/6-em)]](https://www.rsc.org/images/entities/char_2009.gif) 1 or even as high as 2000
1 or even as high as 2000![[thin space (1/6-em)]](https://www.rsc.org/images/entities/char_2009.gif) :
:![[thin space (1/6-em)]](https://www.rsc.org/images/entities/char_2009.gif) 1.6
1.6
3. Preparations and protocols for measuring CD spectra of membrane proteins
3.1 Sample preparations
The ability to accurately measure and quantify membrane protein samples clearly depends on removing or diminishing the optical artifacts noted in Section 2. However, there are other important considerations when producing samples suitable for CD measurements. These include the spectral contributions of the non-protein components in the solution, and the protocols by which spectra are collected.The use of detergents during isolation and purification has been comprehensively reviewed25 and will not be repeated here, except to note that detergents which are good for isolating and maintaining protein integrity are not always suitable for spectroscopic studies. Often mild (non-ionic) detergents are used for solubilising membrane proteins since they tend not to be denaturing. These include sugar-based molecules such as n-dodecyl-α-D-maltopyranoside (DDM) and n-octyl glucoside (OG). Alternatively, zwitterionic detergents such as lauryl dimethylamine oxide (LDAO) or anionic detergents such as sodium cholate are suitable spectroscopically. However, these detergents are often not efficient for solubilising membranes, and hence for CD studies the protein may need to be exchanged into other more suitable detergents during the purification procedures. A number of popular detergents used for characterisation or crystallisation of membrane proteins, such as HEGA10, and the Triton series, need to be avoided however, as their structures contain chromophores that absorb in the far UV region. Sodium dodecyl sulphate (SDS), whilst a harsh detergent that usually denatures proteins [see Section 4.1.1], is suitable spectroscopically; however, it is unlikely to produce results that are biologically-relevant. Ultimately, the suitability of using any detergent should be assessed in advance of solubilising the protein, by measurements of protein-free detergent micelles on their own, and it is often useful to keep a list of suitable detergents that have been tested.
Chlorine anions are also problematic as they absorb strongly below 200 nm; even 100 mM sodium chloride in a 0.01 cm optical pathlength cell may increase the low wavelength cutoff to above 190 nm, especially when combined with other absorbing compounds. NaF can be a useful substitute for NaCl (unless this interferes with the protein structure or function), as it exhibits very low absorbance in the far UV range. However, even higher salt concentrations are often needed in order to stabilise membrane proteins in solution. In all cases the buffer absorbance problem increases with optical pathlength, so carefully choosing a combination of concentration, pathlength and buffer/salt/detergent environment is essential for achieving low wavelength data with membrane proteins.
3.2 Spectral conditions: concentration and pathlength
Protein concentration and optical cell pathlength are two (interdependent) parameters that need careful consideration whenever a CD experiment is performed. With shorter optical pathlengths there is less sample (and hence less buffer) in the light path, with a consequent reduction in buffer absorbance that can allow the collection of data to lower wavelengths. This is one of the simplest means of enabling data collection in the presence of high(er) salt and buffers. Commercially available standard Suprasil quartz cuvettes usually range from 1 cm pathlengths down to pathlengths of 0.1 cm. Demountable cells rather than sealed cuvettes of pathlengths down to 0.001 cm are available, and fortunately for the scattering issues described above, circular rather than rectangular geometries are available. This means the amount of buffer/detergent/salt in the light pathway will be 103 times lower than in the sealed rectangular cuvettes, so the absorbance of the baseline buffer will drop accordingly. However there will also be less protein present, and hence a smaller CD signal unless there is a compensatory increase in the required protein concentration.The optimum concentration for soluble proteins in a transparent buffer such as sodium phosphate is in the range of ∼1–2 mg ml−1 in a 0.005 cm cell (Table 1).9 Since integral membrane proteins usually give rise to relatively large CD signals compared to the average soluble protein, a helical transmembrane protein at a concentration as low as 0.3 mg ml−1 may generate an acceptable signal in the same 0.005 cm cell, and will, under most circumstances, allow the resolution of the 190 nm peak. The spectral magnitudes of transmembrane beta sheet proteins are generally two to three times smaller and given a similar concentration, useful data would only be obtained with a 0.01 cm cell.
| Pathlength (cm) | 0.001 | 0.002 | 0.005 | 0.01 |
|---|---|---|---|---|
| Concentration (mg ml−1) for mainly helical proteins | 2–10 | 1–5 | 0.3–2 | 0.2–1 |
| Concentration (mg ml−1) for β-barrel proteins | 4–10 | 2–5 | 0.6–2 | 0.4–1 |
The volumes required for 0.1 cm cuvettes can be as high as 200 μl, whereas the volumes for the shortest demountable cells may be on the order of 15–20 μl. These can still require prohibitive amounts of protein; however, specialty calcium fluoride cells with very short pathlengths designed originally for use in SRCD spectroscopy, have the advantage of requiring only 3–5 μl of solution for pathlengths of 0.004 or less.32 With concentrations as low as 2 mg ml−1 needed, these are amounts of membrane proteins that are often achievable.
If the only option is to use the shorter pathlength cells but a high protein concentration cannot be produced without causing precipitation or aggregation, the small noisy CD signal can be enhanced by lengthening the averaging time or increasing the number of repeat scans, bearing in mind that the signal-to-noise ratio is proportional to the square root of the data collection time. However a spectrum with an overall magnitude of only a few millidegrees cannot be entirely rescued.
However, the absorbance of aromatic amino acids at 280 nm (A280) is a useful method that can be performed on aliquots of the same sample that is used for the CD measurements, when one of the currently available devices using very small volumes such as the Nanodrop are used. The calculated extinction coefficient can be obtained from the protein amino acid composition using the Expasy website (http://web.expasy.org/protparam/) and used to determine the protein concentration. However caution must be taken in the measurements of lipid-containing samples: rather than simply measuring simple the A280, a far-UV spectrum (310–270 nm) must be obtained, as frequency-dependent light scattering from the lipids will increase the A280, and hence the apparent absorption of the protein. This can be remedied by the addition of 10% sodium dodecyl sulphate (SDS) to the liposomes, which will enable the measurement of A280 signal, but will also render the treated sample unusable for parallel CD measurements, as this detergent will denature the protein.
Before measuring the protein concentration (or indeed, the CD spectrum), samples should be micro-centrifuged to separate undissolved particles and precipitated protein, but not at such high g values as to cause a concentration gradient in the sample tube. In addition, if sample solutions are sent by airfreight, it is also advisable to de-gas the samples prior to measurements, as changes in air pressure can enable the dissolution of gases from the atmosphere, which later can slowly escape during data collection.
When measuring soluble proteins under optimal conditions, the peptide absorbance at around 190 nm produces a wide peak in the HT signal and if this exceeds the cutoff point, the CD peaks in this region will be depressed; this can be rectified by lowering the sample concentration or optical cell pathlength (see above). If those changes are not possible, then the CD spectrum reported should be truncated at the HT cutoff point determined for the instrument. This point can be ascertained experimentally by measuring the same sample in two (or more) different pathlength cells. After scaling to each other based on the pathlength, if the low wavelength peak(s) are diminished relative to the higher wavelength peaks, then it can be ascertained where the cutoff value lies (Fig. 7).
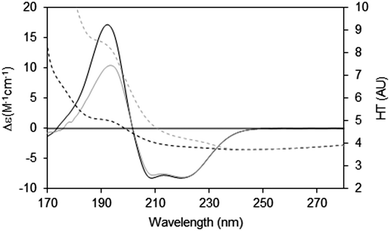 | ||
| Fig. 7 Depiction of the spectral effects for a sample in which the HT values are too high.9 The SRCD spectrum (solid line) for the sample in a long pathlength cell (0.0020 cm) at 15 mg ml−1 and its corresponding HT curve (dashed line) are plotted in grey. The SRCD and HT spectra for the same sample concentration but in a shorter pathlength cell (0.0006 cm) are in black. The short pathlength spectrum is well below the cutoff limit at all wavelengths, whereas for the long pathlength cell the HT limit has been exceeded at wavelengths below ∼210 nm (HT > 5). The black CD spectrum has been scaled to the grey CD spectrum at 224 nm, so that the relative depression in the CD signal for the high HT (∼190 nm) peak can be seen. The cutoff effect on the CD spectrum for the long pathlength sample produces a significant overall distortion, with both smaller and narrower low wavelength peaks (corresponding to the high HT values). | ||
For membrane protein samples, the absorbance of the lipids or detergents may mask the peptide absorbance at 190 nm and the HT signal will have a smoothly rising profile showing a rapid increase to the saturation value at low wavelengths. A useful rule of thumb is that any CD peaks situated at wavelengths less than 5 nm above the HT cutoff point should be suspect.
In addition, because membrane protein samples can tend to aggregate, precipitate or settle with time, or even be light-sensitive, it is important to monitor the CD and HT values at the lowest wavelength obtained during data collection. If either of these values varies during repeat scans of the same sample, then they may reflect changes to the nature of the sample, and should be a cause for concern with respect to integrity of the protein/lipid/detergent complexes, and a reason to identify new conditions for data collection. Indeed, good practice suggests that when repeat scans are made with the intention of averaging multiple spectra to improve the signal-to-noise levels, saving individual spectra during data collection rather than just the average spectrum, will allow monitoring of any changes that occur during data collection.
3.3 Data collection and processing/analysis of membrane protein spectra
When collecting CD data it important to measure (and separately save) at least three replicate scans of both the sample and baseline. As well as enabling detection of sample changes as described above, the separate files can be used to monitor the presence of instrumental artifacts which may arise in a single scan and to calculate error bars associated with the instrumental measurements. The latter will be especially important in studies comparing two samples/conditions to determine if any differences seen are statistically significant. It is also important to ensure the sample and baseline are obtained relatively closely temporally, so if there is any instrumentation variation over time, it does not affect the net spectrum.The next consideration is that the baseline should overlay the sample spectrum in the wavelength region between ∼250 and 273 nm, where there is normally no detectable CD signal due to protein. If the spectra in this region are not co-incident, this indicates the presence of a difference where none should be present. Such differences can arise if the orientation of the sample cell is not the same for both the sample and baseline. Obviously using the same cell for both the sample and baseline is important because there is always some inherent dichroism signal due to the cell windows, however small; so it must be present to the same extent in both sample and baseline spectra, in order for it to be removed from the net spectrum by the processing step of subtraction. Other experimental features that can lead to non-matching samples and baselines are when the two plates of demountable cells are not assembled in the same relative orientations or aligned in the same way with respect to the light beam. A useful suggestion can be to put small fiducial marks on both plates of a demountable cell (outside the light pathway) and ascertain they are lined up for each usage. For demountable cells, which are particularly useful for the small samples usually available for membrane proteins, it is recommended that a list of the fill volumes (and identity) of each cell be kept so that these can be accurately reproduced each time (since the fill volume can sometime influence the effective pathlength).
Measurement parameters, which depend on the type of instrument and the nature of the experiment, and good practice considerations have been the subject of a number of reviews.4,7,9 The wavelength range will optimally include a high wavelength of around 280 nm (to include the baseline matching region), to just below the lowest wavelength where HT saturation occurs.
Spectra can be processed using the software provided with the CD instrument, using commercial spreadsheets, or with specialised CD processing and analysis software such as CDTool.35 Guidelines for processing described in the CDtools manual available online (http://cdtools.cryst.bbk.ac.uk/manual.pdf) can be useful whatever software is used.
Empirical secondary structural analyses are reviewed in detail in ref. 18. Least squares methods, principal component analyses or machine learning techniques are used in combination with a reference dataset of protein spectra to calculate a spectrum that best matches the experimental spectrum. The secondary structures of the reference proteins, derived from their crystal structures, are then used to produce the secondary structure content of the query protein. A goodness-of-fit parameter, such as the normalised root mean squared deviation (NRMSD), is calculated as a measure of the correspondence between the experimental spectrum and the calculated best fit spectrum. A low NRMSD18,26 value (<0.1) is a necessary but not sufficient condition for identifying an “accurate” answer. In general, the most accurate secondary structure determinations are obtained when the reference dataset used contains protein spectra similar to the spectrum under scrutiny; hence reference datasets containing membrane proteins tend to be most appropriate for analyzing membrane protein spectra for the reasons described in Section 2.2.1. There are a number of online servers or downloadable programs that enable secondary structure analyses, but at present only DichroWeb24 and CDPro36 have reference datasets that include membrane proteins (30 out of 128 proteins in the case of the SMP180 reference dataset in DichroWeb, and 13 out of 56 proteins in the SMP56 dataset in CDPro).
4. Specialist methods for studying membrane proteins using CD spectroscopy
4.1 Drug/ligand binding, protein folding, and mutational studies
CD spectroscopy can be used to monitor ligand binding if the binding results in a change in the secondary structure of the protein. Frequently, however, ligand binding does not have a significant effect on the secondary structure of the protein. However, ligand binding does often stabilise the structure of a protein, and this can be monitored using either chemical or physical denaturation methods.Likewise CD can be used to make comparisons of wild-type and designed mutant membrane proteins (often created to test theories of ligand binding sites or functional roles of certain residues). Mutants often exhibit either no significant differences in their CD spectra from the wildtype protein (if the mutation affects a very local environment around the side chains without any major effects to the polypeptide backbone conformation) or else they result in significant unfolding of the native conformation. In the former case, the CD spectrum alone will not provide useful information on the nature of the interactions, but as in ligand binding, mutations can often shift the equilibrium between conformations and stabilise or destabilise the protein fold. Several types of folding/unfolding studies (see below) can be used to detect such interactions. In the latter case where mutations shift the CD spectrum to that of a partially or fully unfolded protein, CD can be a useful diagnostic for determining the suitability of the mutant for structure/function studies.
Other methods for studying drug and ligand binding of membrane proteins by CD spectroscopy include using the near UV region of the spectra where signals due to the aromatic residues can be monitored to identify either changes in tertiary structure, or local changes around specific residues. Such types of studies have recently been reviewed.38
If the unfolding transition is fully reversible, such studies have greater value as they can be used to determine thermodynamic parameters associated with the protein stability.37 However, denaturants are not universally effective for all integral membrane proteins, and thus conditions must be determined experimentally for each protein.
Another concern for such studies on membrane proteins is that in order to completely unfold a protein, denaturants such as urea (and especially guanidine) may need to be used at concentrations that produce too high an absorbance to enable measurements below 210 nm, making them unsuitable for detailed studies using CD spectroscopy. Nevertheless, they can often be effectively used for monitoring changes to the helical content using the peak at 224 nm. An alternative, described in detail below, is to monitor the thermal stability of the membrane protein to detect changes associated with ligand binding and/or mutations.
4.2 Thermal unfolding (stability) studies
Often ligand binding produces little change in the peak magnitudes at room temperature, and thus cannot be used to assess whether or not the compound has bound. However, ligand binding often acts to stabilise the protein (and can discriminate between mutations that do and do not affect the binding interactions). This stabilisation can be assessed by thermal denaturation studies.39 Although in many cases the end result of thermal denaturation is irreversible aggregation, the relative stabilities of proteins can be compared in the system under scrutiny can still be determined.Thermal denaturation studies have the advantage over chemical denaturation studies of leaving other environmental conditions such as ionic strength and pH intact (assuming the pH of the buffer itself is not temperature dependent!).
There are two general methods of conducting and analysing thermal assays: in the first, a single spectral peak is chosen and its CD value monitored with increasing temperature. In this type of study it is important to ascertain in advance that the wavelength position of the peak in question does not shift during the course of heating/unfolding the protein. The instrument software may even provide an option for monitoring a number of peaks simultaneously. An advantage of this method is that it is relatively rapid, and thus quite small temperature increments can be monitored. The second method is to measure the entire spectrum at each temperature (Fig. 8). Time constraints usually impose a minimum limit on the size of the temperature steps; however a set of analysable CD spectra are obtained complete with associated HT signals providing much more information including differences in secondary structure content at each temperature. In addition, the presence of problems arising due to bubble formation during heating or precipitation that would not be obvious from a single wavelength scan can be revealed in the HT trace as described below. Obtaining three repeat scans at each temperature also provides evidence that the sample has equilibrated at each temperature since the replicate spectra should overlay. Another major advantage of measuring entire spectra is revealed by Fig. 8. Here the protein becomes increasingly disordered with temperature and monitoring the peak near 224 nm would not be ideal because the peak wavelength is temperature dependent. Neither of the other peaks is a good candidate: the one at ∼208 nm is both shifted and not clearly defined at higher temperatures and the 190 nm peak may be compromised by high absorption. However the entire set of spectra can be analysed using singular value decomposition,45 a mathematical method which reduces the data to a small number of orthogonal basis curves which, in various proportions, make up each spectrum.35 The advantage of this is that it can be determined if the unfolding of the different types of secondary structures are concerted, or sequential in nature.
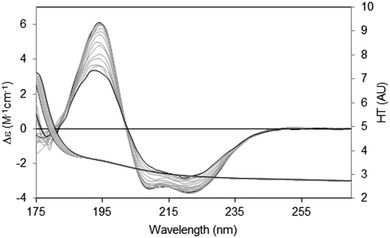 | ||
| Fig. 8 Thermal unfolding experiment49 for a membrane protein (Na,K-ATPase). Spectra were measured from 20 °C to 80 °C in 5 °C steps. The largest CD spectrum (black) corresponds to the lowest temperature, and the smallest CD spectrum (also black) to the highest temperature. Intermediate temperatures are in grey. The CD peaks shift position as the protein changes conformation with increasing temperature. The HT curves corresponding to the CD curves progress from left to right with increasing temperature (i.e. the HT signals at the low wavelengths increase with temperature), thereby changing the cutoff values (in this case occurring at a value of ∼5) to higher wavelengths (∼185 nm). In order to maximise the wavelength range measurable, the data was collected by SRCD spectroscopy with the concentration of the protein 4.01 mg ml−1, and using a 0.0015 cm pathlength cell. | ||
When using the method of monitoring single wavelengths, it is helpful to first measure the complete spectra at the lowest and highest temperatures in order to determine the trajectory of the various peaks, if there is enough sample. The concentration and pathlength can then be optimised to maximise the magnitude of the wavelengths to be monitored during the temperature ramp, and to determine if the peak positions shift as a function of temperature/unfolding. In the latter situation, single wavelength monitoring will not be an effective technique for data collection. As the peaks at 208 and 222 nm tend to decrease as the protein denatures with increasing temperature, a starting spectral magnitude of >10 mdeg at the peaks is advisable. It is often not possible to monitor the 190 nm peak throughout a melt experiment since the HT cutoff tends to increase by around 6 nm when the temperature increases from 20 °C to 85 °C, and, even if the 190 nm peak is resolvable in the first spectrum, it may become compromised by absorption flattening at higher temperatures. The lowest temperature is normally the ambient temperature, but can be lower, and the maximum temperature can be as high as ∼90 °C, depending on the instrument. Data can best be fitted to a sigmoidal function if there are plateaux at both the beginning and end of the melt, bearing in mind that data is normally far from this ideal. Single wavelength experiments are relatively rapid, and hence, fairly narrow temperature steps can be used to accurately define where the transition is. After the highest temperature has been measured, and before cooling the sample, a full wavelength scan should be made so that the high and low temperature spectra can be compared, secondary structural analysis performed, and any anomalies in the HT signal of the high temperature spectrum taken into consideration. For thermodynamic analyses, the process should then be repeated in reverse, or at least the spectrum of the protein collected after the sample has been cooled to the initial temperature, to determine the extent of reversibility in the unfolding process. Comparisons of the HT spectra at the beginning and end of the experiment are useful indicators of whether the sample has aggregated or precipitated.
For experiments in which complete spectra are obtained at each temperature, measuring three replicate scans at each temperature will not only enhance the data but also provide evidence of whether equilibration has been reached at each temperature (i.e. first and last spectrum at each temperature increment are identical). The disadvantage of this method is the time required for data collection, so larger step sizes (5 °C or 10 °C is standard) are typically used.
4.3 Oriented CD spectroscopy (oCD)
In an alpha helix, exciton splitting of the n → π* transition centered around 200 nm results in vector components parallel and perpendicular to the helix axis, giving rise to a negative 208 nm peak and a positive 190 nm peak. Isotropic solutions, where the protein can adopt all orientations with respect to the light beam, produce the typical alpha helical spectra with the 190 nm peak being roughly twice the magnitude of the 208 peak (if there are no significant amounts of other types of secondary structure present). In an anisotropic sample with helices oriented in specific directions with respect to the incoming light, the differently oriented transitions are either reinforced or diminished (Fig. 9). As the relative magnitude of a transition vector depends upon its orientation with respect to the electric field of the incident beam, it is greatest when the transition is parallel to the electric field and zero when the vector is perpendicular to the electric field. The signal is therefore dependent on the relative orientation of the vector components and the direction of the electric field of the incident beam.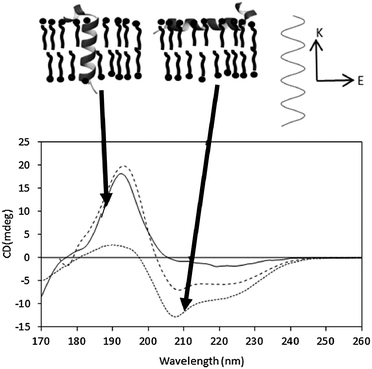 | ||
| Fig. 9 Oriented SRCD spectra, showing the effect of different helix orientations. The spectra41 are the synthetic peptides KALP (transmembrane orientation, solid line) and LAH4 (orientation in the plane of the membrane, dotted line), and of an isotropic, unoriented solution (dashed line). The orientations of the peptides are depicted in the diagram above the spectra. The relative magnitudes of the n → π* and π → π* peaks are modulated due to the direction of the beam relative to the orientation of the electric field (top diagram, right). | ||
This is the underlying basis of the method of oriented CD spectroscopy of helical peptides in lipid bilayers,40 an increasingly popular method that can be used to define the orientation of a helical (or sheet) component in an oriented stack of bilayers containing membrane proteins or peptides. This method is the subject of an excellent recent review17 and so will not be discussed in detail here.
In general the sample preparation usually involves spreading a thin film of a concentrated sample on a quartz or calcium fluoride plate, drying it and then rehydrating it by controlling the humidity of the environment. Generally, the phospholipids form stacks of bilayers parallel to the plate surface, with the peptides or proteins either aligned parallel or perpendicular to the membrane stacks41 (Fig. 9), and the relative magnitudes of the peaks can be used to define the orientation and/or tilt with respect to the membrane. Transmembrane helices are oriented perpendicular to the electric field of the incident light and therefore the 208 nm transition, also perpendicular, has a low magnitude relative to the parallel transition. If the helices interact with the lipid bilayer such that they lie parallel to the magnetic field, then the opposite occurs. The average angle of the helix axis with respect to the membrane normal can be calculated from the ratios of the peaks.40,42 This has proven to be a very valuable method for examining antimicrobial and other surfactant peptides.17
After the initial spectrum is measured, the cell holder is turned on its central axis by 45 degrees and another spectrum obtained. This is repeated by turning the cell holder successively by 45° increments. This will both provide an indication of the film uniformity, and a comparison of the spectra at all angles can be used to determine if the sample exhibits any linear dichroism (which would contribute to and distort the circular dichroism spectra). Many SRCD beamlines have automatically rotating cell holders, which can also be made as accessories for conventional CD instruments, although such rotations can be simply made manually, as long as the cell holder contains fiduciary marks to monitor the rotation positions. Ideally the baseline should be a hydrated film of lipid without protein; however it is important to note that baseline samples consisting of the lipid alone can sometimes behave differently on the plate surface from the lipid/peptide complex; in this case, a baseline of the plate alone (rotated as before) may be adequate as, in principle, the lipid should not contribute to the dichroism absorbance.
4.4 Synchrotron radiation circular dichroism spectroscopic studies of membrane proteins
Over the past 15 years circular dichroism beamlines have been developed at storage ring facilities in the US, Europe and Asia, with a number of additional beamlines currently in the development/planning phase.43 Using synchrotron radiation as a light source greatly enhances the quality and quantity of data that can be obtained from an experiment. Applications of SRCD spectroscopy for the study of soluble proteins have been the subject of a previous tutorial review.5 However, CD spectroscopy using synchrotron radiation light sources has also been especially valuable for the study of membrane proteins, and its early advantages for membrane proteins were reviewed previously.6In particular, the high light flux in the far and vacuum ultraviolet wavelength ranges enables measurements to lower wavelengths and drastically improves the signal-to-noise levels, which means that for membrane proteins which are often hard to purify in large quantities, small amounts of sample can be used, and the influence of other absorbing components (detergents, lipids) is less severe. The higher signal-to-noise levels that are attainable also mean that more subtle differences, for example in ligand binding studies, can be detected with confidence. As indicated in Section 2.3, the high penetration of the intense light also means that higher lipid-to-protein ratios can be examined, which has important consequences not only for diminishing absorption flattening effects, but also enabling proteins to be examined under conditions more comparable to those found in native membranes.
A number of novel types of membrane protein structural studies that would not have been possible with conventional CD spectroscopy, have been enabled by the use of SRCD spectroscopy: determination of the complete residue-by-residue structure of the C-terminal domain of a sodium channel44 (Fig. 10), dissection of the stabilities of transmembrane and extramembranous domains for an integral membrane protein,45 and the novel use of SRCD as a molecular ruler for a membrane–protein substrate.46 In addition, SRCD studies of oriented samples (o-SRCD) provide much more accurate measurements of tilt angles of helices in membranes.42 These suggest a strong potential for using SRCD to push the boundaries of the types of membrane samples that can be examined, and the types of questions that can be addressed with the technique.
 | ||
| Fig. 10 Illustration of a novel application possible only using SRCD spectroscopy.44 Spectra of the wildtype NaChBac sodium channel (solid line) and a mutant that was truncated by 21 residues (out of 274 residues total) (dotted line), showing the sensitivity of the method to small differences in structure. The error bars (1 s.d.) from three repeats show the precision/reproducibility of the measurements. Although the differences in the spectra are small they are detectable, and interpretable on a molecular level. The right panel is a magnified view of the 193 nm peak, which clearly shows the differences. These can be translated into secondary structural types of the missing residues. | ||
It is particularly noteworthy that a large number of the high quality spectra of membrane proteins deposited and publically available in the Protein Circular Dichroism Data Bank (PCDDB)47 have been obtained using SRCD spectroscopy, a further indication of the utility and potential of this enhanced CD instrumentation for the study of membrane proteins.
5. Conclusions
Circular dichroism and synchrotron radiation circular dichroism spectroscopies can provide valuable information on the structure, function, and dynamics of membrane proteins in micelles, liposomes, nanodiscs, amphipols, bicelles and oriented bilayers. However, careful attention must be paid to the experimental conditions and consideration of potential artifacts (such as scattering, absorption flattening, and spectral shifts) that can arise due to the physical nature of the samples.Acknowledgements
We thank Dr Robert W. Janes (RWJ) (Queen Mary University of London) and members of the Wallace lab group (Birkbeck College), past and present, for helpful discussions. We thank the following for their help and advice at the SRCD beamlines: Dr Soren Vronning Hoffman and Dr Nykola Jones (ISA, Aarhus, Denmark), Dr John Sutherland and John Trunk (NSLS, Brookhaven, USA), Dr David Clarke and Alan Brown (SRS Daresbury, UK), Dr Frank Wien (Soleil, France), Dr Jochen Buerk and Sigmar Roth (ANKA, Karlsruhe, Germany), and Dr Ye Tao (BSRF, Beijing, China), and Jack Aviv (Aviv Biomedical) for modifying our lab-based CD instruments and software to enable some of the measurements described in this review. Our SRCD and CD studies have been supported over the years by grants from the U.K. Biotechnology and Biological Sciences Research Council (BBSRC) to BAW, and currently by BBSRC grant J019135 (to BAW and RWJ). Beamtime access to the SRS Daresbury was enabled by a Programme Mode Access grant to BAW and RWJ. Beamtime access at the ISA, Soleil, ANKA, BSRF, and NSLS synchrotrons was enabled by beamtime grants to BAW. Access to the ISA and Soleil Synchrotrons was aided by the European Community Research Infrastructure Action under the FP6 “Structuring the European Research Area” Programme; travel funding for access to the BSRF Synchrotron was supported by grants from the BBSRC and Royal Society (to BAW).References
- Y. Arinaminpathy, E. Khurana, D. M. Engelman and M. B. Gerstein, Drug Discovery Today, 2009, 14, 1130–1135 CrossRef CAS PubMed.
- H. M. Berman, J. Westbrook, Z. Feng, G. Gilliland, T. N. Bhat, H. Weissig, I. N. Shindyalov and P. E. Bourne, Nucleic Acids Res., 2000, 28, 235–242 CrossRef CAS PubMed.
- http://blanco.biomol.uci.edu/mpstruc/ .
- S. M. Kelly, T. J. Jess and N. C. Price, Biochim. Biophys. Acta, 2005, 1751, 119–135 CrossRef CAS PubMed.
- A. J. Miles and B. A. Wallace, Chem. Soc. Rev., 2006, 35, 39–51 RSC.
- B. A. Wallace, Q. Rev. Biophys., 2009, 42, 317–370 CrossRef CAS PubMed.
- Modern Techniques for Circular Dichroism and Synchrotron Radiation Circular Dichroism, ed. B. A. Wallace and R. W. Janes, IOS Press, Amsterdam, 2009 Search PubMed.
- B. Nordén, A. Rodger and T. Dafforn, Linear Dichroism and Circular Dichroism: A Textbook on Polarized-Light Spectroscopy, Royal Soc. of Chemistry Press, Cambridge, 2010 Search PubMed.
- A. J. Miles and B. A. Wallace, in Biophysical Characterization of Proteins in Developing Biopharmaceuticals, ed. D. S. Houde and B. J. Berkowitz, Elsevier, Amsterdam, 2014, pp. 109–138 Search PubMed.
- I. Tinoco, R. W. Woody and D. F. Bradley, J. Chem. Phys., 1963, 38, 1317–1325 CrossRef CAS.
- D.-H. Chin, R. W. Woody, C. A. Rohl and R. L. Baldwin, Proc. Natl. Acad. Sci. U. S. A., 2002, 99, 15416–15421 CrossRef CAS PubMed.
- J. G. Lees, A. J. Miles, F. Wien and B. A. Wallace, Bioinformatics, 2006, 22, 1955–1962 CrossRef CAS PubMed.
- R. W. Janes, Bioinformatics, 2005, 21, 4230–4239 CrossRef CAS PubMed.
- B. A. Wallace and D. Mao, Anal. Biochem., 1984, 142, 317–328 CrossRef CAS PubMed.
- D. Mao and B. A. Wallace, Biochemistry, 1984, 23, 2667–2673 CrossRef CAS PubMed.
- J. M. Dorr, M. C. Koorengevel, M. Schafer, A. V. Prokofyev, S. Scheidelaar, E. A. van der Cruijsen, T. R. Dafforn, M. Baldus and J. A. Killian, Proc. Natl. Acad. Sci. U. S. A., 2014, 111, 18607–18612 CrossRef PubMed.
- J. Buerck, P. Wadhwani, S. Fanghaenel and A. S. Ulrich, Acc. Chem. Res., 2016, 49, 184–192 CrossRef CAS PubMed.
- L. Whitmore and B. A. Wallace, Biopolymers, 2008, 89, 392–400 CrossRef CAS PubMed.
- M. Cascio and B. A. Wallace, Anal. Biochem., 1995, 227, 90–100 CrossRef CAS PubMed.
- Y. Chen and B. A. Wallace, Biophys. Chem., 1997, 65, 65–74 CrossRef CAS PubMed.
- B. A. Wallace, J. Lees, A. J. W. Orry, A. Lobley and R. W. Janes, Protein Sci., 2003, 12, 875–884 CrossRef CAS PubMed.
- M. Cascio and B. A. Wallace, Protein Pept. Lett., 1994, 1, 136–140 CAS.
- A. Abdul-Gader, A. J. Miles and B. A. Wallace, Bioinformatics, 2011, 7, 1630–1636 CrossRef PubMed.
- L. Whitmore and B. A. Wallace, Nucleic Acids Res., 2004, 32, W668–W673 CrossRef CAS PubMed.
- A. M. Seddon, P. Curnow and P. J. Booth, Biochim. Biophys. Acta, 2004, 666, 105–117 CrossRef PubMed.
- D. Mao, E. Wachter and B. A. Wallace, Biochemistry, 1982, 21, 4960–4968 CrossRef CAS PubMed.
- A. S. Ladokhin, M. Fernández-Vidal and S. H. White, J. Membr. Biol., 2010, 236, 247–253 CrossRef CAS PubMed.
- B. A. Wallace and R. W. Janes, Curr. Opin. Chem. Biol., 2001, 5, 567–571 CrossRef CAS PubMed.
- A. Toumadje, S. W. Alcorn and W. C. Johnson Jr., Anal. Biochem., 1992, 200, 321–331 CrossRef CAS PubMed.
- B. A. Wallace and C. L. Teeters, Biochemistry, 1987, 26, 65–70 CrossRef CAS PubMed.
- C. L. Teeters, J. Eccles and B. A. Wallace, Biophys. J., 1987, 51, 527–532 CrossRef CAS PubMed.
- A. M. Stanley and K. G. Fleming, Arch. Biochem. Biophys., 2008, 469, 46–66 CrossRef CAS PubMed.
- F. Wien and B. A. Wallace, Appl. Spectrosc., 2005, 59, 1109–1113 CrossRef CAS PubMed.
- A. J. Miles, F. Wien, J. G. Lees and B. A. Wallace, Spectroscopy, 2005, 19, 43–51 CrossRef CAS.
- J. G. Lees, B. R. Smith, F. Wien, A. J. Miles and B. A. Wallace, Anal. Biochem., 2004, 332, 285–289 CrossRef CAS PubMed.
- N. Sreerama and R. W. Woody, Methods Enzymol., 2004, 383, 318–351 CAS.
- N. J. Harris, H. E. Findlay, J. Simms, X. Liu and P. J. Booth, J. Mol. Biol., 2014, 426, 1812–1825 CrossRef CAS PubMed.
- G. Siligardi, R. Hussain, S. G. Patching and M. K. Phillips-Jones, Biochim. Biophys. Acta, 2014, 1838, 34–42 CrossRef CAS PubMed.
- N. J. Greenfield, Nat. Protoc., 2006, 1, 2527–2535 CrossRef CAS PubMed.
- Y. Wu, H. W. Huang and G. A. Olah, Biophys. J., 1990, 57, 797–806 CrossRef CAS PubMed.
- B. Perrone, A. J. Miles, E. S. Salnikov, B. A. Wallace and B. Bechinger, Eur. Biophys. J., 2014, 43, 499–507 CrossRef CAS PubMed.
- M. B. Ulmschneider, J. P. Ulmschneider, N. Schiller, B. A. Wallace, G. von Heijne and S. H. White, Nat. Commun., 2014, 5, 4863 CrossRef CAS PubMed.
- B. A. Wallace and J. Buerck, Synch. Rad. News, 2015, 28, 64–65 Search PubMed.
- A. M. Powl, A. O. O'Reilly, A. J. Miles and B. A. Wallace, Proc. Natl. Acad. Sci. U. S. A., 2010, 107, 14064–14069 CrossRef CAS PubMed.
- A. M. Powl, A. J. Miles and B. A. Wallace, Biochim. Biophys. Acta, 2012, 1818, 889–895 CrossRef CAS PubMed.
- G. Hagelueken, B. R. Clarke, H. Huang, A. Tuukkanen, I. Danciu, D. I. Svergun, R. Hussain, H. Liu, C. Whitfield and J. H. Naismith, Nat. Struct. Mol. Biol., 2015, 22, 50–56 CAS.
- L. Whitmore, B. Woollett, A. J. Miles, D. P. Klose, R. W. Janes and B. A. Wallace, Nucleic Acids Res., 2011, 39, D480–D486 CrossRef CAS PubMed.
- E. C. McCusker, C. Bagnéris, C. E. Naylor, A. R. Cole, N. D'Avanzo, C. G. Nichols and B. A. Wallace, Nat. Commun., 2012, 3, 1102 CrossRef PubMed.
- A. J. Miles, B. A. Wallace and M. Esmann, Biochim. Biophys. Acta, 2011, 1808, 2573–25809 CrossRef CAS PubMed.
| This journal is © The Royal Society of Chemistry 2016 |

