 Open Access Article
Creative Commons Attribution 3.0 Unported Licence
Investigations of freezing and cold storage for the analysis of peatland dissolved organic carbon (DOC) and absorbance properties
Mike
Peacock
*a,
Chris
Freeman
b,
Vincent
Gauci
a,
Inma
Lebron
c and
Chris D.
Evans
c
aDepartment of Environment Earth and Ecosystems, The Open University, Walton Hall, Milton Keynes, MK7 6AA, UK. E-mail: michael.peacock@open.ac.uk; Tel: +44 (0)1908 655129
bWolfson Carbon Capture Laboratory, School of Biological Sciences, Bangor University, Deiniol Road, LL57 2UW, UK
cCentre for Ecology and Hydrology, Environment Centre Wales, Deiniol Road, Bangor, LL57 2UW, UK
First published on 29th May 2015
Abstract
Although measured rates of biological degradation of DOC are typically low under dark conditions, it is assumed that water samples must be analysed soon after collection to provide an accurate measure of DOC concentration and UV-visible absorbance. To examine the impact of storage on DOC quality and quantity, we took water samples from an ombrotrophic peatland, and stored them in the dark at 4 °C for 138–1082 days. A median of 29% of DOC was lost during storage, but losses of absorbance at 254 nm were less. DOC loss followed a first-order exponential decay function, and was dependent on storage time. DOC half-life was calculated as 1253 days. Specific absorbance at 254 nm suggested that samples containing more aromatic DOC were more resistant to degradation, although time functioned as the primary control. Samples from two fens showed that loss of absorbance was greater at 400 nm rather than 254 nm, after 192 days storage, suggesting that non-aromatic DOC is preferentially degraded. These results suggest that samples can be stored for several months before losses of DOC become detectable, and that it is possible to back-calculate initial DOC concentrations in long-term stored samples based on known decay rates. Freeze/thaw experiments using samples from a range of peatlands suggested that DOC concentration was mostly unaffected by the process, but DOC increased 37% in one sample. Freezing had unpredictable and sometimes strong effects on absorbance, SUVA and E ratios, therefore freezing is not recommended as a method of preservation for these analyses.
Environmental impactDissolved organic carbon (DOC) concentrations are routinely monitored in the waters of organic soils, particularly peatlands. This is because DOC affects the functioning of aquatic ecosystems and water treatment costs, as well as being a component of the carbon cycle. If there is to be a delay between collecting a water sample and analysing, it is typical to preserve the sample by acidification or freezing. Here, we demonstrate that that loss of DOC in untreated filtered samples is dependent primarily on storage time, with ∼5% being lost in 3 months. Freezing samples had little effect on DOC concentration, but appeared to strongly influence the composition of DOC. We therefore do not recommend freezing as a preservation technique. |
1. Introduction
Dissolved organic carbon (DOC) is an important fluvial component of the global carbon cycle. DOC is converted to carbon dioxide (CO2) during transport through rivers, lakes and the ocean, thereby providing a source of atmospheric carbon.1 Additionally, DOC forms complexes with toxic metals2 and can affect autotrophic and heterotrophic processes in aquatic ecosystems.3,4 High DOC concentrations also result in increased water treatment costs5,6 and human health risks from potable water due to the formation of harmful trihalomethanes when chlorinated.7 Wetlands, and particularly peatlands, are a major source of DOC,8 and there is a strong relationship between peat cover and DOC concentration for both lowland and upland catchments.9 Peatland DOC dynamics are therefore well-studied in relation to various environmental factors and disturbances.Considering the large volume of research concerning peatland DOC, it is notable that there is only partial guidance concerning sampling and analysis protocols, which limits the production of standardised results. One consensus is that DOC in a water sample is defined as the organic carbon that passes through a 0.45 μm filter,10 although it should be noted that other filter sizes are sometimes used.11,12 The Disinfectant/Disinfection By-products Rule (D/DBPR) of the US Environmental Protection Agency requires that water samples for DOC analysis must be analysed within 48 hours; if not, then active steps (e.g. sample acidification) must be taken to preserve the sample11 in an attempt to limit biological, chemical, or physical degradation. It is common for peatland research projects to analyse DOC concentrations as soon as possible; e.g. within one day,13 two days,14 or one week,15 even though it is often asserted that biological degradation is minimal.16 Despite this, the stability of peatland DOC under long-term storage is not well quantified. In contrast, the stability of marine DOC during storage has been studied: Norrman17 noted no change in DOC following cold storage for eight weeks, whilst Yoshimura18 found that DOC stability in samples stored for up to four hundred days at room temperature depended somewhat upon the bottle type that the sample was stored in. Preservation techniques such as acidification have also been examined for marine DOC samples.19 It should be noted that marine DOC concentrations are typically in the range 30–80 μM (ref. 20) and are therefore small compared to peatland DOC concentrations. There are also compositional differences in DOC from marine and terrestrial environments.21
UV-visible (UV-vis) absorbance is often used as a surrogate for direct DOC measurement.22 Like DOC concentrations, the D/DBPR states that UV-vis absorbance must be measured within 48 hours,11 and it is often measured as soon as possible after sampling in peatland experiments; e.g. within one day.23 It has been shown that absorbance in water samples from an ombrotrophic peatland stored for twelve weeks in the dark at 4 °C showed no change across the UV-vis spectrum,24 suggesting that DOC concentrations might also have remained unchanged after storage. Others have examined the stability of water samples following storage to check that delayed analysis will not affect the accuracy of results. For example, Ekström et al.25 noted no significant change in DOC concentration in pore waters from a podzol following storage in the dark at 4 °C for two weeks. Similarly, Carter et al.26 recorded only a 5% change in DOC concentration in samples from a variety of surface water sources (including peatland catchments) after 50–120 days storage at 5 °C. Proctor27 states that surface water samples from an ombrotrophic bog showed a slight decrease in absorbance at 320 nm after two months of storage, but provides no raw data to consider.
Taken together, these observations suggest that DOC concentrations in samples stored in the dark at 4 °C are stable over extended periods. If true, this could have implications for sampling programmes and analysis techniques. For instance, it would negate the need for freezing or acidifying water samples that sometimes takes place,28–32 and which risk affecting DOC concentrations in marine and freshwater samples,19,33–35 as well as absorbance and fluorescence properties.36,37 Changes in pH can cause the flocculation and coagulation of DOC,38 whilst freezing can result in DOC loss through abiotic particle precipitation.35 Preservatives such as sodium azide are also sometimes used, although DOC losses can still occur when such biocides are used.34 To address this issue we used samples from UK peatlands to investigate how DOC concentrations change during storage at 4 °C and when frozen.
2. Materials and methods
2.1. Bog peat cold storage experiment
Samples of surface and pore water were taken from the Afon Ddu catchment on the Migneint blanket bog in Snowdonia National Park, Wales, UK (latitude 52.97°N, longitude 3.84°W). The site is approximately 490 m above sea level with a mean peat depth of 1.3 m (M. Peacock, unpublished data). Vegetation consists of Calluna vulgaris with Eriophorum and Sphagnum species. The site has been extensively drained by a series of ditches that run downslope. These ditches were blocked in February 2011, with four being left unblocked as controls. The samples for this experiment were collected between 16th December 2010 and 17th July 2013 as part of a project investigating the effect of ditch blocking on water chemistry. Samples were collected in 60 ml Nalgene® bottles from: (i) blocked and open ditches (20 samples), (ii) piezometers at 10 cm depth, adjacent to ditches (18 samples), and (iii) crest-stage tubes adjacent to ditches that collect overland flow (12 samples). For this experiment, samples were selected to include a range of DOC concentrations (minimum = 8.9 mg l−1, maximum = 64 mg l−1, mean = 33.9 mg l−1) and sampling months (Dec–Feb = 10 samples, March–May = 12 samples, June–Aug = 13 samples, Sept–Nov = 15 samples). The long-term nature of the project therefore ensured that samples used in this experiment were collected across a range of environmental conditions (i.e. after storms or droughts, across a range of temperatures).Electrical conductivity (EC) and pH were measured on unfiltered samples. Samples were then filtered through 0.45 μm filters and analysed for DOC (as non-purgeable organic carbon NPOC) using a Thermalox Total Carbon analyser (Analytical Sciences, Cambridge, UK). In NPOC analysis, the sample is acidified and sparged with oxygen to remove any inorganic carbon. To ensure that the 0.45 μm filters were not leaching DOC into samples, unfiltered and filtered standards and blanks were analysed; no difference was found, showing that filters were not contaminating samples. UV-vis absorbance was measured using an M2e Spectramax (Molecular Devices, Sunnyvale, USA) at wavelengths of 250 nm, 254 nm, 365 nm, 400 nm, 465 nm and 665 nm. These allowed DOC quality data to be calculated as E2![[thin space (1/6-em)]](https://www.rsc.org/images/entities/char_2009.gif) :
:![[thin space (1/6-em)]](https://www.rsc.org/images/entities/char_2009.gif) E3 ratio (250
E3 ratio (250![[thin space (1/6-em)]](https://www.rsc.org/images/entities/char_2009.gif) :
:![[thin space (1/6-em)]](https://www.rsc.org/images/entities/char_2009.gif) 365 nm), E2
365 nm), E2![[thin space (1/6-em)]](https://www.rsc.org/images/entities/char_2009.gif) :
:![[thin space (1/6-em)]](https://www.rsc.org/images/entities/char_2009.gif) E4 ratio (250
E4 ratio (250![[thin space (1/6-em)]](https://www.rsc.org/images/entities/char_2009.gif) :
:![[thin space (1/6-em)]](https://www.rsc.org/images/entities/char_2009.gif) 400 nm), E4
400 nm), E4![[thin space (1/6-em)]](https://www.rsc.org/images/entities/char_2009.gif) :
:![[thin space (1/6-em)]](https://www.rsc.org/images/entities/char_2009.gif) E6 ratio (465
E6 ratio (465![[thin space (1/6-em)]](https://www.rsc.org/images/entities/char_2009.gif) :
:![[thin space (1/6-em)]](https://www.rsc.org/images/entities/char_2009.gif) 665 nm), and specific UV absorbance (SUVA, at 254 nm). The concentration of phenolic compounds was measured in some samples using a method modified from Box;39 0.25 ml of sample was added to a microplate well, followed by 12.5 μl of Folin-Ciocalteau reagent and 37.5 μl of 200 g l−1 Na2CO3. After 1.5 hours absorbance was measured at 750 nm and phenolic concentrations calculated from a standard curve. After all analyses had been completed, samples were stored in the dark at 4 °C. Following long-term storage (range 138–1082 days, mean = 719 days) the fifty samples were reanalysed on 2nd December 2013. The range of storage times is due to the fact that samples were originally collected as part of a long-term environmental monitoring project, and thus on a range of dates prior to the reanalysis. For this study, a selection of samples was chosen for reanalysis. For the reanalysis, DOC was measured as NPOC using a TOC analyser (Shimadzu) and absorbance at 254 nm was measured using a Helios Gamma (Thermo Spectronic).
665 nm), and specific UV absorbance (SUVA, at 254 nm). The concentration of phenolic compounds was measured in some samples using a method modified from Box;39 0.25 ml of sample was added to a microplate well, followed by 12.5 μl of Folin-Ciocalteau reagent and 37.5 μl of 200 g l−1 Na2CO3. After 1.5 hours absorbance was measured at 750 nm and phenolic concentrations calculated from a standard curve. After all analyses had been completed, samples were stored in the dark at 4 °C. Following long-term storage (range 138–1082 days, mean = 719 days) the fifty samples were reanalysed on 2nd December 2013. The range of storage times is due to the fact that samples were originally collected as part of a long-term environmental monitoring project, and thus on a range of dates prior to the reanalysis. For this study, a selection of samples was chosen for reanalysis. For the reanalysis, DOC was measured as NPOC using a TOC analyser (Shimadzu) and absorbance at 254 nm was measured using a Helios Gamma (Thermo Spectronic).
2.2. Fen peat cold storage experiment
Surface water samples were taken on 18th March 2014 from two fen peatlands: Holme Fen (52.49°N, 0.23°W) and Woodwalton Fen (52.45°N, 0.19°W), both in East Anglia, UK. Holme Fen consists of deciduous woodland (dominated by Betula pendula), fen, and remnant raised bog. The area surrounding the fen has been historically drained for agricultural purposes, leading to peat subsidence. As such, Holme Fen is now 2.7 m below sea level, and maintained by active drainage of the surrounding agricultural land. Woodwalton Fen contains a mix of deciduous woodland, open water, and Phragmites reedbeds. It is 0 m ASL. At each site, five samples were collected from open water (ditches or lakes) in 60 ml Nalgene® bottles. Electrical conductivity (EC) and pH were measured on unfiltered samples. Samples were then filtered through 0.45 μm filters and analysed for DOC (as NPOC) using a TOC analyser (Shimadzu), and absorbance at 254 nm and 400 nm was measured using a Helios Gamma (Thermo Spectronic). After analysis, samples were stored in the dark at 4 °C for 192 days, before being reanalysed for DOC and absorbance.2.3. Freeze/thaw experiment
Surface water samples were taken from six different locations. These were:(1) Bog pools (both natural and those created during restoration), an upland stream, and overland flow in the Afon Ddu catchment (see Section 2.1) (n = 11).
(2) Ditches and lake at Holme Fen (see Section 2.2) (n = 5).
(3) Ditches on Woodwalton Fen (see Section 2.2) (n = 5).
(4) Walton Lake (52.03°N, 0.72°W), a small, shallow lake dominated by Phragmites australis reedbed, situated near to the Open University in Milton Keynes (n = 4).
(5) Ditches on Sedge Fen (52.31°N, 0.28°E), a relatively intact, deep peat lowland fen, and part of the wider Wicken Fen area. The fen contains Phragmites australis and Cladium mariscus reedbeds (n = 8).
(6) Ditches on Baker's Fen (52.30°N, 0.29°E), also a part of the Wicken Fen area. Baker's Fen was historically drained and converted to agricultural use. For the past two decades the fen has been undergoing restoration through hydrological management and grazing with cattle and horses (n = 8).
EC and pH were analysed on unfiltered samples, then samples were filtered at 0.45 μm. Samples were analysed for DOC and absorbance at 250, 254, 365, 400, 465 and 665 nm using the same methods as Section 2.2. This allowed E2![[thin space (1/6-em)]](https://www.rsc.org/images/entities/char_2009.gif) :
:![[thin space (1/6-em)]](https://www.rsc.org/images/entities/char_2009.gif) E3, E2
E3, E2![[thin space (1/6-em)]](https://www.rsc.org/images/entities/char_2009.gif) :
:![[thin space (1/6-em)]](https://www.rsc.org/images/entities/char_2009.gif) E4, E4
E4, E4![[thin space (1/6-em)]](https://www.rsc.org/images/entities/char_2009.gif) :
:![[thin space (1/6-em)]](https://www.rsc.org/images/entities/char_2009.gif) E6 and SUVA to be calculated as in Section 2.1. Samples were then frozen in the dark for a minimum of 48 hours. Following this, samples were transferred to a refrigerator and allowed to thaw, and DOC and UV-vis analyses were repeated.
E6 and SUVA to be calculated as in Section 2.1. Samples were then frozen in the dark for a minimum of 48 hours. Following this, samples were transferred to a refrigerator and allowed to thaw, and DOC and UV-vis analyses were repeated.
2.4. Statistical analysis
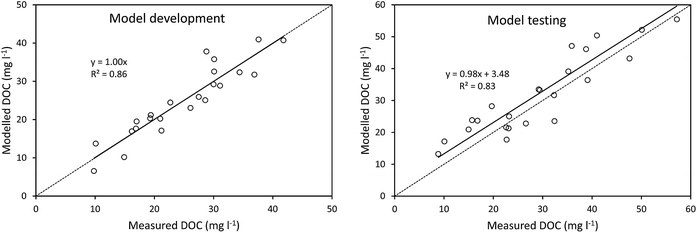
Statistical analysis was carried out using SPSS v16.0.1 (IBM Corporation). The Shapiro–Wilk test was used to check whether data were normally distributed. For the bog peat experiment, neither DOC concentration, absorbance at 254 nm, nor SUVA were normally distributed. Although it was possible to normalise DOC concentration and absorbance at 254 nm using square root transformation, SUVA data could not be normalised. For the fen peat experiment, DOC and absorbance were not normally distributed, and transformations failed to normalise the data. Because of this, the non-parametric Wilcoxon signed rank test was used to test for differences in samples before and after storage for all determinands, and for both bog, fen and freeze/thaw samples, thus providing statistical consistency throughout.Linear regression was used to search for relationships between determinands, and a model developed to predict changes in DOC during cold storage based solely on original DOC concentration and storage time. To create the model for bog samples, a random selection of 23 data points were selected. DOC concentration was predicted as:
| DOCstorage(modelled) = DOCoriginal(measured) × 0.5(storage time/t1/2) |
![[thin space (1/6-em)]](https://www.rsc.org/images/entities/char_2009.gif) :
:![[thin space (1/6-em)]](https://www.rsc.org/images/entities/char_2009.gif) 1 line between measured and modelled DOC.
1 line between measured and modelled DOC.
This model was then tested on the remaining 24 samples by rearranging the above equation so that the original DOC could be predicted from DOC measured after storage. Three samples where DOC apparently increased during storage were excluded. This may have been analytical error, or it may be that not all particulate organic carbon (POC) was removed during filtration; this POC could then have been converted to DOC through biotic processes.40 Rearranging the equation gives:
| DOCoriginal(modelled) = DOCstorage(measured) × 2(storage time/t1/2) |
where ‘DOCmeasured’ is the measured concentration of DOC before storage, ‘DOCmodelled’ is the concentration of DOC before storage predicted by the model, and ‘DOCmean’ is the mean of the DOC measurements before storage. A NS value of 1 indicates a perfect model fit, and as the NS value decreases this indicates a poorer model fit, with a value of 0 implying that the model performs no better than a simple mean of the data.
3. Results
3.1. Bog peat experiment
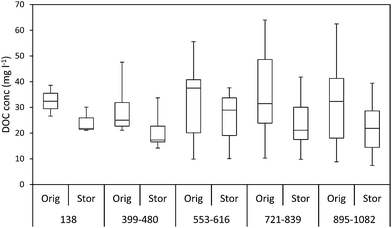
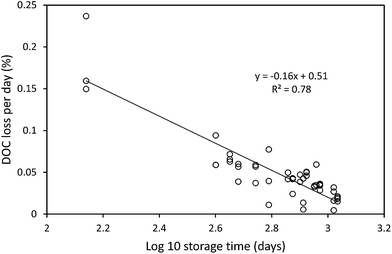
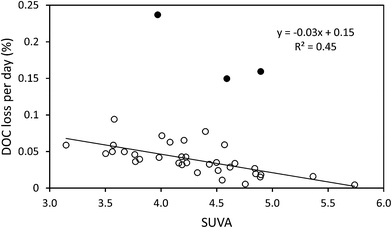
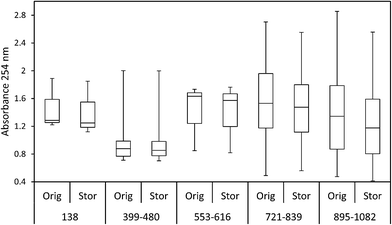
The median loss of DOC during storage for all 50 samples was 9.0 mg l−1, equating to 28.9%. The change in DOC concentration was significant (p < 0.001) (Fig. 1). Three samples showed increases in DOC concentration during storage. There was little obvious difference in pore water and surface water; median loss rates of DOC were 0.039% per day for surface water and 0.042% per day for pore water (with respective median storage times of 749 and 807 days).There was no linear relationship between the percentage loss of DOC during storage and the length of time a sample had been stored (linear regression R2 = 0.0004, n = 50). However, a significant relationship was found by normalising DOC loss by storage time (Fig. 2). This relationship suggests that DOC loss is relatively rapid to begin with, but then slows over time. A second significant relationship was determined between normalised DOC loss and SUVA (Fig. 3), if three samples that had been stored for a much shorter time compared to the other samples (138 days versus >350 days for the remainder of the dataset, see 4.1 for Discussion) were removed. If both storage time (log![[thin space (1/6-em)]](https://www.rsc.org/images/entities/char_2009.gif) 10 transformed) and SUVA were used in a multiple regression against DOC loss there was some improvement. This regression used 34 data points (UV-vis analysis was not conducted for all samples), and involved the exclusion of the three aforementioned samples. For this reduced data set, R2 between time and normalised DOC loss was 0.55 (p < 0.001) (DOC loss = (−0.11x
10 transformed) and SUVA were used in a multiple regression against DOC loss there was some improvement. This regression used 34 data points (UV-vis analysis was not conducted for all samples), and involved the exclusion of the three aforementioned samples. For this reduced data set, R2 between time and normalised DOC loss was 0.55 (p < 0.001) (DOC loss = (−0.11x![[thin space (1/6-em)]](https://www.rsc.org/images/entities/char_2009.gif) log
log![[thin space (1/6-em)]](https://www.rsc.org/images/entities/char_2009.gif) time) + 0.36). With the inclusion of SUVA R2 increased to 0.62 (time p < 0.001, SUVA p = 0.01) (DOC loss = (−0.078x
time) + 0.36). With the inclusion of SUVA R2 increased to 0.62 (time p < 0.001, SUVA p = 0.01) (DOC loss = (−0.078x![[thin space (1/6-em)]](https://www.rsc.org/images/entities/char_2009.gif) log
log![[thin space (1/6-em)]](https://www.rsc.org/images/entities/char_2009.gif) time) + (−0.013 × SUVA) + 0.32). No significant relationships were found between normalised DOC loss and the E4
time) + (−0.013 × SUVA) + 0.32). No significant relationships were found between normalised DOC loss and the E4![[thin space (1/6-em)]](https://www.rsc.org/images/entities/char_2009.gif) :
:![[thin space (1/6-em)]](https://www.rsc.org/images/entities/char_2009.gif) E6 ratio, E2
E6 ratio, E2![[thin space (1/6-em)]](https://www.rsc.org/images/entities/char_2009.gif) :
:![[thin space (1/6-em)]](https://www.rsc.org/images/entities/char_2009.gif) E3 ratio, or E2
E3 ratio, or E2![[thin space (1/6-em)]](https://www.rsc.org/images/entities/char_2009.gif) :
:![[thin space (1/6-em)]](https://www.rsc.org/images/entities/char_2009.gif) E4 ratio (n = 37). A significant negative relationship was observed between the phenolic
E4 ratio (n = 37). A significant negative relationship was observed between the phenolic![[thin space (1/6-em)]](https://www.rsc.org/images/entities/char_2009.gif) :
:![[thin space (1/6-em)]](https://www.rsc.org/images/entities/char_2009.gif) DOC ratio and normalised loss of DOC (n = 23, R2 = 0.4, p = 0.001) (DOC loss = (−0.025x phenolic
DOC ratio and normalised loss of DOC (n = 23, R2 = 0.4, p = 0.001) (DOC loss = (−0.025x phenolic![[thin space (1/6-em)]](https://www.rsc.org/images/entities/char_2009.gif) :
:![[thin space (1/6-em)]](https://www.rsc.org/images/entities/char_2009.gif) DOC) + 0.0078).
DOC) + 0.0078).
The calculated value of t1/2 was 1253 days, which was used to develop a model of DOC concentrations following storage (Fig. 4). This t1/2 value was then used to calculate DOC concentrations before storage, simply using storage time and DOC concentration after storage. This produced a strong model fit between measured and modelled DOC concentrations, as indicated by a high Nash–Sutcliffe efficiency, although there was some slight overestimation (Fig. 4).
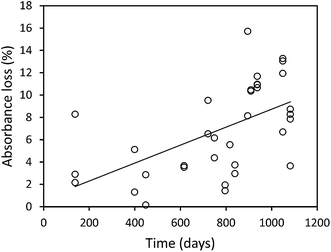
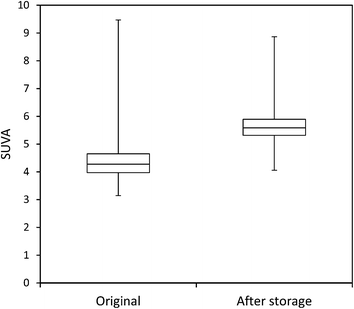
The mean loss of absorbance at 254 nm during storage was 5.6% (Fig. 5), and this was significant (p < 0.001). Only one sample showed a substantial increase in absorbance after storage. For absorbance, a simple linear relationship between the change in absorbance and the length of time a sample had been stored for was found (Fig. 6). There was also a significant difference in SUVA following long-term storage; median value before storage was 4.36, increasing to 5.61 after storage (p < 0.001) (Fig. 7).
3.2. Fen peat experiment
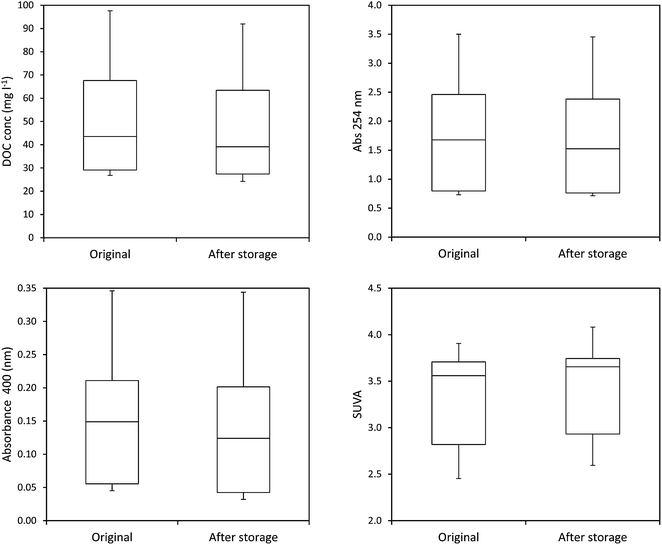
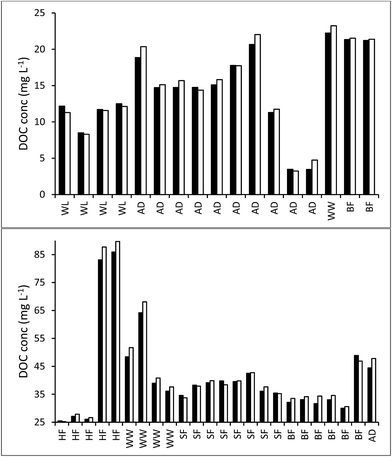
The ten samples collected for this experiment were mainly alkaline, although two from Holme Fen were slightly acidic. Following 192 days of storage all samples showed a loss of DOC, with a median loss of 7% being observed, (Fig. 8) and a loss of absorbance at 400 nm, where a median loss of 16.8% was observed (Fig. 8). Nine samples displayed decreases in absorbance at 254 nm, and one sample showed a slight increase, with a median loss of 3.5% (Fig. 8). Wilcoxon signed rank tests showed that these losses were significant (p < 0.01 for DOC, 254 nm and 400 nm). When expressed as percentages, loss of absorbance at 400 nm was significantly greater (p < 0.05) than loss of absorbance at 254 nm. Following storage, six samples displayed increases in SUVA and four displayed decreases (Fig. 8).3.3. Freeze/thaw experiment
After the freeze/thaw procedure, 13 samples showed a decrease in DOC concentration, whilst 28 showed an increase. Typically these changes were small (Fig. 9), with the median and maximum loss of DOC being 2.4% and 7.2%. The median gain of DOC was 4.4%, but one sample from the Afon Ddu increased from 3.46 mg l−1 to 4.75 mg l−1; an increase of 37%. Nevertheless, the change was significant (p < 0.05).Changes in UV-vis absorbance were evident after freeze/thaw. For 250 nm and 254 nm there was an even split, with approximately half of the samples showing increases in absorbance, and half showing decreases. From 365 nm upwards more samples displayed increases in absorbance, and this became much more pronounced in the higher wavelengths; at 465 nm and 665 nm, only 4 and 5 samples respectively showed decreases. Wilcoxon signed rank tests confirmed that these differences were significant for 465 nm and 665 nm only (p < 0.001). The magnitude of relative changes in absorbance also increased with increasing wavelength, so that the median increase in absorbance at 665 nm was 100% (Table 1).
| Wavelength (nm) | 250 | 254 | 365 | 400 | 465 | 665 |
| Median decrease (%) | 4.8 | 4.4 | 6.4 | 7.3 | 6.0 | 33.3 |
| n | 21 | 22 | 16 | 14 | 4 | 5 |
| Median increase (%) | 1.8 | 2.4 | 4.2 | 4.8 | 9.8 | 100.0 |
| n | 20 | 17 | 25 | 27 | 33 | 29 |
| No change n | 0 | 2 | 0 | 0 | 4 | 7 |
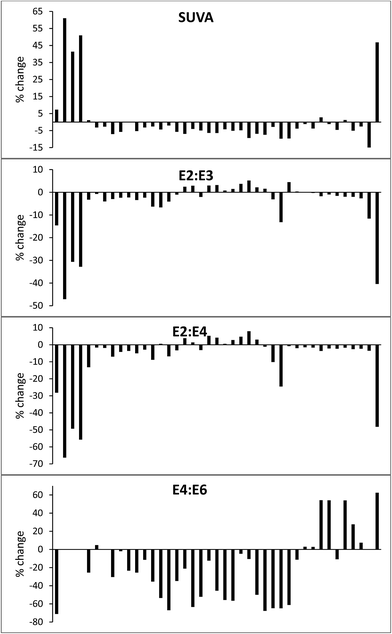
Despite the absence of a significant effect in the lower wavelengths across all samples, some drastic changes were observed. The same sample from the Afon Ddu bog that showed a 37% increase in DOC also showed large increases in absorbance at all wavelengths: 99% at 250 nm, 102% at 254 nm, 233% at 365 nm, 283% at 400 nm, 550% at 465 nm, and 300% at 665 nm. Absorbance increased considerably across all wavelengths in three samples from Walton Lake: this was 40–57% at 254 nm. The same three samples had no absorbance at 665 nm upon collection, but after freeze/thaw had absorbance values of 0.018, 0.006 and 0.012. The various changes in absorbance caused significant (p < 0.05) changes in SUVA, E2![[thin space (1/6-em)]](https://www.rsc.org/images/entities/char_2009.gif) :
:![[thin space (1/6-em)]](https://www.rsc.org/images/entities/char_2009.gif) E3, E2
E3, E2![[thin space (1/6-em)]](https://www.rsc.org/images/entities/char_2009.gif) :
:![[thin space (1/6-em)]](https://www.rsc.org/images/entities/char_2009.gif) E4 and E4
E4 and E4![[thin space (1/6-em)]](https://www.rsc.org/images/entities/char_2009.gif) :
:![[thin space (1/6-em)]](https://www.rsc.org/images/entities/char_2009.gif) E6 (Fig. 10). Taken together, these findings suggest that the processes of freezing and thawing drastically alters the composition of DOC.
E6 (Fig. 10). Taken together, these findings suggest that the processes of freezing and thawing drastically alters the composition of DOC.
4. Discussion
4.1. Changes in DOC and absorbance during cold storage
Our results clearly show that DOC concentrations in both surface water and pore water samples taken from peatlands declined during short-term and long-term storage (138–1082 days). This storage was in the dark at 4 °C, following filtration at 0.45 μm. Kothawala et al.42 (2012) stored water samples from Boreal lakes in the dark at 20 °C for three and a half years and recorded losses of DOC as 32–45%. Samples in our study that had been stored for approximately three years showed a mean loss of 20%, and so it seems likely that cold storage does reduce degradation rates.We found that DOC loss was strongly related to storage time as an exponential function; it appears that a relatively high percentage (approximately 20–30%) of DOC is lost <138 days, and that as time increases the rate of DOC loss decreases. This first-order exponential decay is dependent solely on the original concentration of DOC, and such a relationship has been noted elsewhere (e.g. in brackish UK water samples filtered at 0.7 μm (ref. 43)). This finding suggests that some DOC will be lost, regardless of the molecular properties of the DOC, in any sample stored for several months. There was no difference in loss rates between pore and surface water. It may simply be that a larger sample size would have enabled differences to be observed. For the bog samples, the strong relationship (R2 = 0.78) between storage time and DOC loss allowed the half-life of DOC to be calculated as approximately 1250 days. It should be noted that the minimum storage time of any sample was 138 days, and the lack of any samples stored for less time could introduce some error into the half-life calculation.
Despite this apparently simple relationship between DOC concentration and time, there was also evidence that DOC composition influenced stability. For instance, DOC loss was reduced as values of SUVA and phenolic![[thin space (1/6-em)]](https://www.rsc.org/images/entities/char_2009.gif) :
:![[thin space (1/6-em)]](https://www.rsc.org/images/entities/char_2009.gif) DOC increased. The exceptions to this relationship were three samples that had been stored for the minimum amount of time (138 days); presumably degradation in these samples was still being primarily being controlled by time (i.e. they were still losing the most labile DOC). It can be hypothesised that if these samples were returned to storage for more time, then once the most labile DOC was depleted then the composition of the DOC would start to have a small but important role in regulating the rate of decomposition. As such, a multiple regression using SUVA as well as storage time produced a slightly higher R2. Higher values of SUVA indicate that a larger percentage of the DOC is aromatic in nature,44 as higher SUVA values signify the presence of humic and fulvic acids.45 Phenolics are also aromatic so this result implies that samples with more aromatic DOC possess a greater degree of recalcitrance, as has been experimentally observed for arable soils.46 It is known that phenolic compounds can inhibit biological processes,3 and accordingly the less aromatic and more hydrophilic DOC compounds will be susceptible to biological decomposition.47
DOC increased. The exceptions to this relationship were three samples that had been stored for the minimum amount of time (138 days); presumably degradation in these samples was still being primarily being controlled by time (i.e. they were still losing the most labile DOC). It can be hypothesised that if these samples were returned to storage for more time, then once the most labile DOC was depleted then the composition of the DOC would start to have a small but important role in regulating the rate of decomposition. As such, a multiple regression using SUVA as well as storage time produced a slightly higher R2. Higher values of SUVA indicate that a larger percentage of the DOC is aromatic in nature,44 as higher SUVA values signify the presence of humic and fulvic acids.45 Phenolics are also aromatic so this result implies that samples with more aromatic DOC possess a greater degree of recalcitrance, as has been experimentally observed for arable soils.46 It is known that phenolic compounds can inhibit biological processes,3 and accordingly the less aromatic and more hydrophilic DOC compounds will be susceptible to biological decomposition.47
Adding further weight to this explanation is the observation that absorbance at 254 nm was considerably more stable than DOC concentration during sample storage in the long-term experiment. Absorbance at 254 nm is due to the presence of compounds with aromatic moieties and conjugated double bonds.48 There was a positive relationship between storage time and loss of absorbance at 254 nm. This implies that the degradation of the aromatic components of DOC is, to some extent, a steady process. As DOC declined considerably during storage but absorbance at 254 nm showed less of a decrease, this suggests that it must have been non-aromatic compounds that were preferentially biologically degraded. It may have been that absorbance at 400 nm would have displayed a similar decrease as DOC concentration, but this metric was not re-measured after storage in the bog peat experiment. However, both 254 nm and 400 nm were remeasured in the fen peat experiment, and it was observed that loss of absorbance was significantly greater at 400 nm. Köhler et al.16 also found that absorbance at 420 nm decreased more than absorbance at 254 nm in a dark incubation (15–20 °C) over 12 days, whilst Baldwin and Valo49 posited that bioavailable DOC may not always absorb light in the UV region.
Measurements of SUVA before and after storage also support this explanation in the bog peat experiment; on average there was a significant increase in SUVA after storage (Kothawala et al.42 also noted an increase in SUVA after dark storage at 20 °C), suggesting that the composition of the DOC changed, becoming more aromatic and possessing a higher molecular weight.44,50 However, for the fen samples there was no consistent change in SUVA, with some samples showing increases after storage, and others showing decreases. Such results should be interpreted with caution however, as Weishaar et al. show that SUVA is a poor predictor of DOC reactivity.
It is noteworthy that neither E2![[thin space (1/6-em)]](https://www.rsc.org/images/entities/char_2009.gif) :
:![[thin space (1/6-em)]](https://www.rsc.org/images/entities/char_2009.gif) E3, E2
E3, E2![[thin space (1/6-em)]](https://www.rsc.org/images/entities/char_2009.gif) :
:![[thin space (1/6-em)]](https://www.rsc.org/images/entities/char_2009.gif) E4, nor E4
E4, nor E4![[thin space (1/6-em)]](https://www.rsc.org/images/entities/char_2009.gif) :
:![[thin space (1/6-em)]](https://www.rsc.org/images/entities/char_2009.gif) E6 ratios were related to DOC loss. E2
E6 ratios were related to DOC loss. E2![[thin space (1/6-em)]](https://www.rsc.org/images/entities/char_2009.gif) :
:![[thin space (1/6-em)]](https://www.rsc.org/images/entities/char_2009.gif) E3 has been shown to correlate well with the aromaticity and molecular weight of humics,51 whilst E4
E3 has been shown to correlate well with the aromaticity and molecular weight of humics,51 whilst E4![[thin space (1/6-em)]](https://www.rsc.org/images/entities/char_2009.gif) :
:![[thin space (1/6-em)]](https://www.rsc.org/images/entities/char_2009.gif) E6 has been correlated with molecular weight,52 although it has been suggested that E4
E6 has been correlated with molecular weight,52 although it has been suggested that E4![[thin space (1/6-em)]](https://www.rsc.org/images/entities/char_2009.gif) :
:![[thin space (1/6-em)]](https://www.rsc.org/images/entities/char_2009.gif) E6 is not a useful metric to characterise freshwaters.51,53 It has been proposed that E2
E6 is not a useful metric to characterise freshwaters.51,53 It has been proposed that E2![[thin space (1/6-em)]](https://www.rsc.org/images/entities/char_2009.gif) :
:![[thin space (1/6-em)]](https://www.rsc.org/images/entities/char_2009.gif) E4 is a measure of humification.54 Despite the widespread use of E ratios to characterise DOC, it remains the case that the exact compounds responsible for absorbance at different wavelengths are unknown.55 Weishaar et al.44 stress the fact that, although two water samples may return similar results when analysed for UV-vis, the chemical composition of their DOC may be quite different. Baldwin and Valo49 also found no relationship between the E2
E4 is a measure of humification.54 Despite the widespread use of E ratios to characterise DOC, it remains the case that the exact compounds responsible for absorbance at different wavelengths are unknown.55 Weishaar et al.44 stress the fact that, although two water samples may return similar results when analysed for UV-vis, the chemical composition of their DOC may be quite different. Baldwin and Valo49 also found no relationship between the E2![[thin space (1/6-em)]](https://www.rsc.org/images/entities/char_2009.gif) :
:![[thin space (1/6-em)]](https://www.rsc.org/images/entities/char_2009.gif) E3 and E2
E3 and E2![[thin space (1/6-em)]](https://www.rsc.org/images/entities/char_2009.gif) :
:![[thin space (1/6-em)]](https://www.rsc.org/images/entities/char_2009.gif) E4 ratios, and degradation of DOC, in samples stored at 20 °C for 28 days. As such, it may be that E2
E4 ratios, and degradation of DOC, in samples stored at 20 °C for 28 days. As such, it may be that E2![[thin space (1/6-em)]](https://www.rsc.org/images/entities/char_2009.gif) :
:![[thin space (1/6-em)]](https://www.rsc.org/images/entities/char_2009.gif) E3, E2
E3, E2![[thin space (1/6-em)]](https://www.rsc.org/images/entities/char_2009.gif) :
:![[thin space (1/6-em)]](https://www.rsc.org/images/entities/char_2009.gif) E4, and E4
E4, and E4![[thin space (1/6-em)]](https://www.rsc.org/images/entities/char_2009.gif) :
:![[thin space (1/6-em)]](https://www.rsc.org/images/entities/char_2009.gif) E6 are too unrefined as metrics to predict the stability or degradation of DOC in stored samples.
E6 are too unrefined as metrics to predict the stability or degradation of DOC in stored samples.
It has been shown that peat-derived DOC is highly susceptible to photodegradation,16 with upper estimates showing that 50% of DOC can be degraded within 2–3 summer (UK) days.56 Our data, however, show that biological degradation is also significant, albeit over much longer time periods, and therefore might be important in lakes or reservoirs with large residence times, as well as in marine systems. As interest grows in the fate of peatland fluvial carbon dynamics and in situ processes40 such knowledge is needed.
4.2. Modelling DOC loss and other practical applications
Considering the above controls on DOC degradation, we constructed a simple model using storage time and DOC concentration after storage, to predict DOC concentrations before storage. The discussion in Section 4.1 suggests that a more complex model (i.e. including variables such as SUVA) might perform better, and two-pool models have been used before (featuring a slowly degradable pool of DOC, and a rapidly degradable pool57). However, a simple model may offer the greatest practical value. For instance, our model would require no analysis before a sample be placed into storage, whereas a more advanced model would require UV-vis or phenolic analysis to be performed before storage. Such requirements may be difficult to fulfil in the circumstances where such a model may be applied (i.e. for calculating DOC concentrations from samples stored during remote fieldwork campaigns). As such, a simple model proved very accurate at predicting DOC concentrations from before storage, as demonstrated by high Nash–Sutcliffe efficiencies. It is important to note that samples used in the analysis were collected through all seasons over several years, and may therefore contain DOC that varies compositionally (as suggested by a wide range of SUVA values, minimum = 3.15, maximum = 9.47). This variability in samples did not appear to compromise the effectiveness of the simple model.Data from the same site used for the long-term bog peat experiment concluded that the UV-vis spectrum was stable in water samples stored for 84 days.24 However, it seems likely that losses of DOC are actually continuous, but small. Using the half-life equation for the bog samples suggests that 1% of DOC would be lost after 18 days of storage, and 5% would be lost after 92. Considering that studies have shown that DOC analysis typically has a precision of 2–5% (ref. 58–60) it seems that losses of DOC will not become detectable for several months. Furthermore, the level of accuracy required will depend on the nature of the study in question. If the aim of an experiment is to detect differences in DOC concentrations between sites then, although concentrations will decrease during storage, the relative differences between samples should remain similar. If the aim is to quantify fluxes or long-term DOC trends, then degradation will become considerably more important.
Filters of 0.45 μm pore size are generally used when preparing water samples for DOC analysis.11 However, if it is known that samples will be stored for long periods of time before analysis, a smaller pore size may prove beneficial in reducing losses of DOC by excluding bacteria, thus limiting DOC degradation. The use of a smaller pore size does mean that approximately 10% of DOC will be lost during filtration,61 and there is evidence to suggest that some bacteria may pass through such filters anyway.62 For samples that have been filtered at 0.45 μm and stored for long time periods, additional estimates of DOC concentration may be made using absorbance at 254 nm as a proxy, as our data show this to be more stable. Additionally, a phenolic proxy may provide a useful estimate of DOC concentration.63 These methods could be preferable to freezing or acidifying water samples, which have been shown to affect both DOC quantity and quality.19,33–36
4.3. Changes in DOC and absorbance following freeze/thaw
For most samples, only small (<5%) changes in DOC concentration were observed after samples had been frozen and thawed. Such changes are in the range of typical precision for DOC analysis.58–60 The exception was one sample of overland flow from the Afon Ddu catchment, for which DOC concentration increased by 37%, along with large increases in absorbance. A second sample taken nearby which had almost identical EC and pH showed a loss of 6.8%. It is therefore unknown what caused the substantial increase in one sample. Fellman et al.35 noted a strong correlation between percentage loss of DOC during freeze/thaw and original DOC concentration, but no such trend was evident in our data. Our data are similar to that presented by Spencer et al.,36 who found no consistent change in post-freeze/thaw DOC concentration, with increases and decreases (up to ∼10%) for different samples.Freeze/thaw had a strong and inconsistent effect on the absorbance properties of the samples. At 250 and 254 nm there was an even split with half of the samples showing absorbance increases, and half decreases. It has been observed before that freeze/thaw can have contrasting results on the direction of absorbance changes.36 As for DOC, the median change at 250 and 254 nm was small (<5%), although several samples changed by ∼50%. As wavelength increased, fewer samples displayed absorbance decreases, and percentage change increased. At 665 nm, the median increase in absorbance was 100%. These changes had strong significant effects on SUVA and E ratios. For most samples, SUVA decreased after freeze/thaw and this has been noted before.35 However, SUVA increased in seven samples, sometimes by as much as 50%. The E ratios for some samples changed very little, but increases and decreases of 30–60 % were observed for others. Taken together, these results suggest that freezing might be a useful preservation method for peatland samples when only a measurement of bulk DOC is required, but that it will lead to erroneous results if UV-vis measurements are also needed.
5. Conclusions
Our data show that there is a significant loss of DOC concentration and absorbance in peatland water samples stored in the dark at 4 °C, over periods from 138 to 1082 days, and this loss appears to be predictable as a function of storage time. DOC quality had some effect on losses, but this effect was small when compared to the influence of storage time. It is known that photodegradation of peatland DOC can occur extremely rapidly, but our results additionally show that biological processes operate slowly and steadily in dark conditions. These results have important practical implications; water samples can be stored in dark and cold conditions for considerable time and still be used for DOC analysis, by correcting for storage-related losses. Consider an example where samples have to be stored for six months before analysis: the samples would be analysed after storage (six months) and then again on a monthly basis (e.g. for six more months) storage. This would allow a half-life to be calculated, and the original DOC concentration before storage could be estimated.Results from the freeze/thaw experiment suggest that, for some samples, freezing will not lead to losses of DOC. However, there remains the caveat that DOC concentration may be heavily changed in a minority of samples, and such a change will be difficult to predict using water chemistry determinands such as pH or EC. Freezing is not recommended as a method of preserving samples for UV-vis analysis, as changes in absorbance will be inconsistent (increases and decreases in absorbance) and potentially large.
Acknowledgements
We thank three anonymous reviewers for their comments that helped to improve the manuscript. We thank Trystan Edwards, Helen Buckingham and Andrew Roberts of the National Trust for sampling permissions on the Migneint, and Alan Bowley of Natural England for sampling permissions at Holme Fen and Woodwalton Fen. At Wicken Fen we thank Martin Lester and Carol Laidlaw of the National Trust. Sampling and original analysis of DOC on the Migneint was undertaken as part of a study supported by the UK Department for Environment, Food and Rural Affairs, contract SP1202. Sampling and original analysis of UV-vis on the Migneint was also supported by a Knowledge Economy Skills Scholarship (KESS) PhD awarded to Mike Peacock.References
- J. J. Cole, Y. T. Prairie, N. F. Caraco, W. H. McDowell, L. J. Tranvik, R. G. Striegl, C. M. Duarte, P. Kortelainen, J. A. Downing, J. J. Middelburg and J. Melack, Plumbing the global carbon cycle: integrating inland waters into the terrestrial carbon budget, Ecosystems, 2007, 10, 171–184 CrossRef CAS
.
- D. Vaughan, D. G. Lumsdon and D. J. Linehan, Influence of dissolved organic matter on the bio-availability and toxicity of metals in soils and aquatic systems, Chem. Ecol., 1993, 8, 185–201 CrossRef CAS PubMed
.
- C. Freeman, M. A. Lock, J. Marxsen and S. E. Jones, Inhibitory effects of high molecular weight dissolved organic matter upon metabolic processes in biofilms from contrasting rivers and streams, Freshwater Biol., 1990, 24, 159–166 CrossRef CAS PubMed
.
- T. J. Battin, S. Luyssaert, L. A. Kaplan, A. K. Aufdenkampe, A. Richter and L. J. Tranvik, The boundless carbon cycle, Nat. Geosci., 2009, 2, 598–600 CrossRef CAS PubMed
.
- A. T. McDonald, G. N. Mitchell, P. S. Naden and D. S. J. Martin, Discoloured Water Investigations, Final Report to Yorkshire Water plc, 1991, p. 432.
- J. P. Ritson, N. J. D. Graham, M. R. Templeton, J. M. Clark, R. Gough and C. Freeman, The impact of climate change on the treatability of dissolved organic matter (DOM) in upland water supplies: a UK perspective, Sci. Total Environ., 2014, 473–474, 714–730 CrossRef CAS PubMed
.
- A. T. Chow, K. K. Tanji and K. K. T. Gao, Production of dissolved organic carbon (DOC) and trihalomethane (THM) precursor from peat soils, Water Res., 2003, 37, 4475–4485 CrossRef CAS
.
- D. Hope, M. F. Billett and M. S. Cresser, A review of the export of carbon in river water: fluxes and processes, Environ. Pollut., 1994, 84, 301–324 CrossRef CAS
.
- J. A. Aitkenhead, D. Hope and M. F. Billett, The relationship between dissolved organic carbon in stream water and soil organic carbon pools at different spatial scales, Hydrol. Processes, 1999, 13, 1289–1302 CrossRef
.
- J. A. Leenheer and J.-P. Croué, Characterizing aquatic dissolved organic matter, Environ. Sci. Technol., 2003, 37, 18A–26A CrossRef CAS
.
- T. Karanfil, M. A. Schlautman and I. Erdogan, Survey of DOC and UV measurement practices with implications for SUVA determination, J. - Am. Water Works Assoc., 2002, 94, 68–80 CAS
.
- Y. Kim, S. Ullah, T. R. Moore and N. T. Roulet, Dissolved organic carbon and total dissolved nitrogen production by boreal soils and litter: the role of flooding, oxygen concentration, and temperature, Biogeochemistry, 2014, 118, 35–48 CrossRef CAS
.
- K. Piirsoo, M. Viik, T. Kõiv, K. Käiro, A. Laas, T. Nõges, P. Pall, A. Selberg, L. Toomsalu and S. Vilbaste, Characteristics of dissolved organic matter in the inflows and outflow of lake Võrtsjärv, Estonia, J. Hydrol., 2012, 475, 306–313 CrossRef CAS PubMed
.
- A. Baker, S. Cumberland and N. Hudson, Dissolved and total organic and inorganic carbon in some British rivers, Area, 2008, 40, 117–127 CrossRef PubMed
.
- A. Armstrong, J. Holden, K. Luxton and J. N. Quinton, Multi-scale relationship between peatland vegetation type and dissolved organic carbon concentration, Ecol. Eng., 2012, 47, 182–188 CrossRef PubMed
.
- S. Köhler, I. Buffam, A. Jonsson and K. Bishop, Photochemical and microbial processing of stream and soil water dissolved organic matter in a boreal forested catchment in northern Sweden, Aquat. Sci., 2002, 64, 269–281 CrossRef
.
- B. Norrman, Filtration of water samples for DOC studies, Mar. Chem., 1993, 41, 239–242 CrossRef CAS
.
- T. Yoshimura, Appropriate bottles for storing seawater samples for dissolved organic phosphorus (DOP) analysis: a step towards the development of DOP reference materials, Limnol. Oceanogr.: Methods, 2013, 11, 239–246 CrossRef CAS
.
- W. Chen and P. J. Wangersky, Rates of microbial degradation of dissolved organic carbon from phytoplankton cultures, J. Plankton Res., 1996, 18, 1521–1533 CrossRef PubMed
.
- H. Ogawa and E. Tanoue, Dissolved organic matter in oceanic waters, J. Oceanogr., 2003, 59, 129–147 CrossRef CAS
.
- P. G. Coble, Characterization of marine and terrestrial DOM in seawater using excitation-emission matrix spectroscopy, Mar. Chem., 1996, 51, 325–346 CrossRef CAS
.
- E. C. Minor, M. M. Swenson, B. M. Mattson and A. R. Oyler, Structural characterization of dissolved organic matter: a review of current techniques for isolation and analysis, Environ. Sci.: Processes Impacts, 2014, 16, 2064–2079 Search PubMed
.
- L. Wilson, J. Wilson, J. Holden, I. Johnstone, A. Armstrong and M. Morris, Ditch blocking, water chemistry and organic carbon flux: evidence that blanket bog restoration reduced erosion and fluvial carbon flux, Sci. Total Environ., 2011, 409, 2010–2018 CrossRef CAS PubMed
.
- M. Peacock, C. D. Evans, N. Fenner, C. Freeman, R. Gough, T. G. Jones and I. Lebron, UV-visible absorbance spectroscopy as a proxy for peatland dissolved organic carbon (DOC) quantity and quality: considerations on wavelength and absorbance degradation, Environ. Sci.: Processes Impacts, 2014, 16, 1445–1461 CAS
.
- S. M. Ekström, E. S. Kritzberg, D. B. Kleja, N. Larsson, P. A. Nilsson, W. Graneli and B. Bergkvist, Effect of acid deposition on quantity and quality of dissolved organic matter in soil-water, Environ. Sci. Technol., 2011, 45, 4733–4739 CrossRef PubMed
.
- H. T. Carter, E. Tipping, J.-F. Koprivnjak, M. P. Miller, B. Cookson and J. Hamilton-Taylor, Freshwater DOM quantity and quality from a two-component model of UV absorbance, Water Res., 2012, 46, 4532–4542 CrossRef CAS PubMed
.
- M. C. F. Proctor, Changes in the chemical composition of mire-water samples during storage, Journal of Vegetation Science, 1993, 4, 661–666 CrossRef
.
- A. R. Hill, K. J. Devito, S. Campagnolo and K. Sanmugadas, Subsurface denitrification in a forest riparian zone: interactions between hydrology and supplies of nitrate and organic carbon, Biogeochemistry, 2000, 51, 193–223 CrossRef
.
- A. Baker and R. G. M. Spencer, Characterization of dissolved organic matter from source to sea using fluorescence and absorbance spectroscopy, Sci. Total Environ., 2004, 333, 217–232 CrossRef CAS PubMed
.
- P. McEachern, E. E. Prepas and D. S. Chanasyk, Landscape control of water chemistry in northern boreal streams of Alberta, J. Hydrol., 2006, 323, 303–324 CrossRef PubMed
.
- A. Ågren, I. Buffam, M. Berggren, K. Bishop, M. Jansson and H. Laudon, Dissolved organic carbon characteristics in boreal streams in a forest-wetland gradient during the transition between winter and summer, J. Geophys. Res., 2008, 113 DOI:10.1029/2007jg000674
.
- S. Moore, V. Gauci, C. D. Evans and S. E. Page, Fluvial organic carbon losses from a Bornean blackwater river, Biogeosciences, 2011, 8, 901–909 CrossRef CAS
.
- Y. Sugimura and Y. Suzuki, A high-temperature catalytic oxidation method for the determination of non-volatile dissolved organic carbon in seawater by direct injection of a liquid sample, Mar. Chem., 1988, 24, 105–131 CrossRef CAS
.
- L. A. Kaplan, A field and laboratory procedure to collect, process, and preserve freshwater samples for dissolved organic carbon analysis, Limnol. Oceanogr., 1994, 39, 1470–1476 CrossRef CAS
.
- J. B. Fellman, D. V. D'Amore and E. Hood, An evaluation of freezing as a preservation technique for analysing dissolved organic C, N and P in surface water samples, Sci. Total Environ., 2008, 392, 305–312 CrossRef CAS PubMed
.
- R. G. M. Spencer, L. Bolton and A. Baker, Freeze/thaw and pH effects on freshwater dissolved organic matter fluorescence and absorbance properties from a number of UK locations, Water Res., 2007, 41, 2941–2950 CrossRef CAS PubMed
.
- M. M. Tfaily, D. C. Podgorski, J. E. Corbett, J. P. Chanton and W. T. Cooper, Influence
of acidification on the optical properties and molecular composition of dissolved organic matter, Anal. Chim. Acta, 2011, 706, 261–267 CrossRef CAS PubMed
.
- F. Worrall, T. P. Burt and J. Adamson, The rate of and control upon DOC loss in a peat catchment, J. Hydrol., 2006, 321, 311–325 CrossRef PubMed
.
- J. D. Box, Investigation of the Folin-Ciocalteau phenol reagent for the determination of polyphenolic substances in natural waters, Water Res., 1983, 17, 511–525 CrossRef CAS
.
- C. D. Evans, T. Allott, M. Billett, A. Burden, P. Chapman, K. Dinsmore, M. Evans, C. Freeman, C. Goulsbra, J. Holden, D. Jones, T. Jones, C. Moody, S. Palmer and F. Worrall, Greenhouse gas emissions associated with non gaseous losses of carbon from peatlands – fate of particulate and dissolved organic carbon, Final Report to the Department for Environment, Food, and Rural Affairs, Project SP1205, Centre for Ecology and Hydrology, Bangor, 2013.
- J. E. Nash and J. V. Sutcliffe, River flow forecasting through conceptual models part I – a discussion of principles, J. Hydrol., 1970, 10, 282–290 CrossRef
.
- D. N. Kothawala, E. Wachenfeldt, B. Koehler and L. J. Tranvik, Selective loss and preservation of lake water dissolved organic matter fluorescence during long-term dark incubations, Sci. Total Environ., 2012, 433, 238–246 CrossRef CAS PubMed
.
- C. Lønborg, K. Davidson, X. A. Álvarez-Salgado and A. E. J. Miller, Bioavailability and bacterial degradation rates of dissolved organic matter in a temperate coastal area during an annual cycle, Mar. Chem., 2009, 113, 219–226 CrossRef PubMed
.
- J. L. Weishaar, G. R. Aiken, B. A. Bergamaschi, M. S. Fram, R. Fujii and K. Mopper, Evaluation of specific ultraviolet absorbance as an indicator of the chemical composition and reactivity of dissolved organic carbon, Environ. Sci. Technol., 2003, 37, 4702–4708 CrossRef CAS
.
- J. K. Edzwald, Coagulation in drinking water treatment: particles, organics and coagulants, Water Sci. Technol., 1993, 27, 21–35 CAS
.
- B. Marschner and K. Kalbitz, Controls of bioavailability and biodegradability of dissolved organic matter in soils, Geoderma, 2003, 113, 211–235 CrossRef CAS
.
- K. Kalbitz, S. Solinger, J.-H. Park, B. Michalzik and E. Matzner, Controls on the dynamics of dissolved organic matter in soils: a review, Soil Sci., 2000, 165, 277–304 CrossRef CAS PubMed
.
- J. K. Edzwald, W. C. Becker and K. L. Wattier, Surrogate parameters for monitoring organic matter and THM precursors, J. - Am. Water Works Assoc., 1985, 77, 122–132 CAS
.
- D. S. Baldwin and W. Valo, Exploring the relationship between the optical properties of water and the quality and quantity of dissolved organic carbon in aquatic ecosystems: strong correlations do not always mean strong predictive power, Environ. Sci.: Processes Impacts, 2015, 17, 619–630 CAS
.
- J. K. Edzwald and J. E. Tobiason, Enhanced coagulation: US requirements and a broader view, Water Sci. Technol., 1999, 40, 63–70 CrossRef CAS
.
- J. Peuravuori and K. Pihlaja, Molecular size distribution and spectroscopic properties of aquatic humic substances, Anal. Chim. Acta, 1997, 337, 133–149 CrossRef CAS
.
- R. S. Summers, P. K. Cornel and P. V. Roberts, Molecular size distribution and spectroscopic characterization of humic substances, Sci. Total Environ., 1987, 62, 27–37 CrossRef CAS
.
- N. J. O'Driscoll, S. D. Siciliano, D. Peak, R. Carignan and D. R. S. Lean, The influence of forestry activity on the structure of dissolved organic matter in lakes: implications for mercury photoreactions, Sci. Total Environ., 2006, 366, 880–893 CrossRef PubMed
.
- M. C. Graham, K. G. Gavin, A. Kirika and J. G. Farmer, Processes controlling manganese distributions and associations in organic-rich freshwater aquatic systems: the example of Loch Bradan, Scotland, Sci. Total Environ., 2012, 424, 239–250 CrossRef CAS PubMed
.
-
C. A. Stedmon and X. A. Álvarez-Salgado, Shedding light on a black box: UV-visible spectroscopic characterization of marine dissolved organic matter, in Microbial Carbon Pump in the Ocean, ed. N. Jiao, F. Azam and S. Sanders, 2011 Search PubMed
.
- C. S. Moody, F. Worrall, C. D. Evans and T. G. Jones, The rate of loss of dissolved organic carbon through a catchment, J. Hydrol., 2013, 492, 139–150 CrossRef CAS PubMed
.
- K. P. Wickland, J. C. Neff and G. R. Aiken, Dissolved organic carbon in Alaskan Boreal forest: sources, chemical characteristics, and biodegradability, Ecosystems, 2007, 10, 1323–1340 CrossRef CAS PubMed
.
- W. Granéli, M. Lindell and L. Tranvik, Photo-oxidative production of dissolved inorganic carbon in lakes of different humic content, Limnol. Oceanogr., 1996, 41, 698–706 CrossRef
.
- L. Björkvald, I. Buffam, H. Laudon and C.-M. Mörth, Hydrogeochemistry of Fe and Mn in small Boreal streams: the role of seasonality, landscape type and scale, Geochim. Cosmochim. Acta, 2008, 72, 2789–2804 CrossRef PubMed
.
- M. M. Shafer, D. A. Perkins, D. S. Antkiewicz, E. A. Stone, T. A. Quraishi and J. J. Schauer, Reactive oxygen species activity and chemical speciation of size-fractionated atmospheric particulate matter from Lahore, Pakistan: an important role for transition metals, J. Environ. Monit., 2010, 12, 704–715 RSC
.
- A. T. Chow, F. Guo, S. Gao, R. Breuer and R. A. Dahlgren, Filter pore size selection for characterizing dissolved organic carbon and trihalomethane precursors from soils, Water Res., 2005, 39, 1255–1264 CrossRef CAS PubMed
.
- M. W. Hahn, Broad diversity of viable bacteria in ‘sterile’ (0.2 μm) filtered water, Res. Microbiol., 2004, 155, 688–691 CrossRef PubMed
.
- M. Peacock, A. Burden, M. Cooper, C. Dunn, C. D. Evans, N. Fenner, C. Freeman, R. Gough, D. Hughes, S. Hughes, T. Jones, I. Robinson, M. West and P. Zieliński, Quantifying dissolved organic carbon concentrations in upland catchments using phenolic proxy measurements, J. Hydrol., 2013, 477, 251–260 CrossRef CAS PubMed
.
| This journal is © The Royal Society of Chemistry 2015 |


