 Open Access Article
Electrochemical hydrogenation of a homogeneous nickel complex to form a surface adsorbed hydrogen-evolving species†
Daniel J.
Martin
a,
Brian D.
McCarthy
a,
Carrie L.
Donley
b and
Jillian L.
Dempsey
*a
aDepartment of Chemistry, University of North Carolina, Chapel Hill, North Carolina 27599-3290, USA. E-mail: dempseyj@email.unc.edu
bChapel Hill Analytical and Nanofabrication Laboratory, Department of Applied Physical Sciences, University of North Carolina, Chapel Hill, North Carolina 27599-3216, USA
First published on 4th December 2014
Abstract
A Ni(II) complex degrades electrochemically in the presence of acid in acetonitrile to form an electrode adsorbed film that catalytically evolves hydrogen. Comparison with a similar compound permitted investigation of the degradation mechanism.
The pursuit of sunlight-to-fuels technologies has motivated exploration of electrocatalysts for the production of chemical fuels.1–3 These efforts span both homogeneous and heterogeneous systems. Molecular electrocatalysts are particularly attractive targets because their electronic structure can be tuned through ligand modification,4 their secondary coordination sphere can be modified to promote substrate stabilization or provide a substrate relay,5 and mechanistic and kinetic information can be gleaned through electrochemical6 or spectroscopic methods.1,7 Through these studies, molecular structure and catalytic activity can be correlated.
While molecular catalysts offer an ideal platform with which to study the hydrogen evolution reaction, their stability under electrocatalytic conditions must be assessed. A molecular complex may degrade to a new active or inactive molecular or heterogeneous species.8,9 If, during electrocatalysis, a molecular species degrades or transforms into a heterogeneous species, the resulting product may adsorb to the electrode. If adsorption is strong, rinsing the electrode and analyzing its electrochemical response in a solution containing only substrate can reveal whether a heterogeneous active species has deposited on the electrode.10,11 Characterization of the electrode surface by various surface techniques can then help identify the heterogeneous active material. These methods have already been used to identify the transformation of a nickel bis(benzenedithiolate) complex into a Ni–S film active for electrochemical hydrogen evolution.10 Several cobalt complexes have been found to degrade into electrode-adsorbed cobalt nanoparticles also active for hydrogen evolution.12–15 Very recently, decomposition of a nickel bisglyoximato complex to nickel-based nanoparticles was reported.16 Another diagnostic for heterogeneous electrochemical catalysis is the appearance of irreversible prewaves prior to the onset of the electrocatalytic wave in cyclic voltammetry (CV). In several careful recent studies10,13–16 these prewaves have been proposed to represent the modification of the precatalyst by electrons and substrate (e.g., protons), which, in reported cases, initiates degradation of the molecular species into a catalytically active heterogeneous species.
Although these examples illustrate methods capable of distinguishing between homogeneous and heterogeneous active species, the structural factors that favor modification and even decomposition of molecular species under electrocatalytic conditions are not well understood. Even more poorly understood are the pathways by which degradation occurs. Improved understanding of catalyst decomposition mechanisms will aid in the rational design of next generation catalysts with enhanced stability. Here we examine the electrochemical decomposition mechanism of the molecular nickel species [Ni(N–N–SCH3)2](BF4)2 (N–N–SCH3 = 2-pyridyl-N-(2′-methylthiophenyl)methyleneimine) to form an electrode adsorbed film catalytic for hydrogen evolution and characterize the active material through surface analysis techniques. Our results highlight structural features that are vulnerable under electrocatalytic conditions.
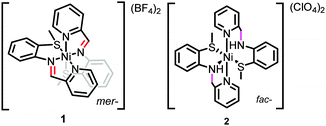
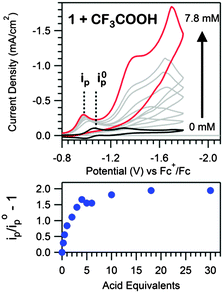
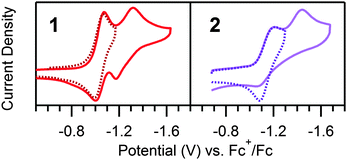
[Ni(N–N–SCH3)2](BF4)2 (1, Scheme 1) was synthesized analogously to literature methods (ESI†).17 The structural motifs of 1 are similar to the reported hydrogen evolution catalyst [Ni(pyS)3]− (pyS = pyridine-2-thiolate) and related complexes.18,19 We initially hypothesized that the pendant pyridines may act as temporary proton docking sites, capable of positioning protons near the nickel center and promoting H2 production, as invoked for the [Ni(pyS)3]− system and for a number of nickel bis(diphosphine) complexes that incorporate pendant bases.5,20,21 In agreement with prior investigation, two reversible reductions, assigned to the NiII/NiI and NiI/Ni0 couples, are observed via CV for 1 in CH3CN (E1/2 = −1.03 V and E1/2 = −1.25 V vs. Fc+/Fc, respectively; Fig. S5, ESI†).22 Peak currents varied linearly with scan rate (ν1/2), as anticipated for a diffusion controlled process, indicating that 1 is a homogeneous species.23 A irreversible reduction is also observed (Ep,c = −2.0 V) with twice the intensity and current integration of the NiII/NiI reduction (Fig. S7, ESI†). The wave is likely the direct reduction of the [N–N–SCH3] ligands, as suggested by voltammograms of the ligand alone (Fig. S8, ESI†). Addition of CF3COOH (pKMeCNa = 12.65 (ref. 24)) yields a new, irreversible reduction with Ep,c = −0.98 V (Fig. 1), followed by a second, larger irreversible wave with an onset near −1.10 V, suggesting electrocatalytic proton reduction. Direct reduction of CF3COOH occurs at more negative potentials (Fig. S11, ESI†).25
Upon further acid titration, the prewave peak asymptotically approaches an upper limit that corresponds to the exchange of two electrons per molecule of 1 (Fig. 1). Peak height analysis (Fig. 1, Fig. S10, ESI†) and prewave current integration (Fig. S9, Table S1, ESI†), relative to the NiII/NiI reduction of 1 in the absence of acid, both support a two electron exchange. The observed prewave is very similar to a feature observed for solutions of a cobalt clathrochelate complex and perchloric acid, where a limiting six electron stoichiometry was observed.15 A net six electron, six proton ligand hydrogenation of the three glyoxime ligands was proposed for the cobalt clathrochelate compound.15 Likewise, a net four electron, four proton ligand hydrogenation was similarly suggested for the related cobalt and nickel bisglyoximato compounds.13,16 Similar to these glyoxime ligands, the N–N–SCH3 ligands of 1 contain a C![[double bond, length as m-dash]](https://www.rsc.org/images/entities/char_e001.gif) N bond. We thus postulate that the prewave feature corresponds to hydrogenation of this imine functionality.
N bond. We thus postulate that the prewave feature corresponds to hydrogenation of this imine functionality.
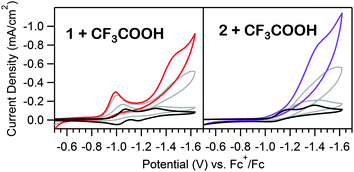
To support assignment of the prewave as ligand hydrogenation, a hydrogenated analogue (2, Scheme 1) was synthesized per literature methods.22 In contrast to the meridional geometry of 1, the ligands of 2 coordinate facially. In the absence of acid, a reversible reduction corresponding to the NiII/I redox couple of 2 is observed (E1/2 = −1.14 V vs. Fc+/Fc), and, in contrast to 1, an irreversible wave, attributed to the NiI/0 couple, is seen (Ep,c = 1.42 V) (Fig. 2). As anticipated, no prewave is observed upon the addition of acid, yet catalytic waves appear, similar to those observed in analogous scans of 1 (Fig. 3). The catalytic waves of 2 pass more current than the respective scans of 1, likely the result of proton depletion near the electrode surface from the ligand hydrogenation of 1. The lack of a prewave for 2, yet an otherwise similar electrochemical response to that of 1, provides further evidence that the prewave corresponds to an electrochemical hydrogenation of the C![[double bond, length as m-dash]](https://www.rsc.org/images/entities/char_e001.gif) N bonds. UV-vis studies reveal no chemical changes to either complex upon acid titration in the absence of reductant other than reversible protonation of the sp3 hybridized nitrogens in 2 (Fig. S13–S15, ESI†).
N bonds. UV-vis studies reveal no chemical changes to either complex upon acid titration in the absence of reductant other than reversible protonation of the sp3 hybridized nitrogens in 2 (Fig. S13–S15, ESI†).
As the prewave feature seen in the CV of 1 indicates a chemical transformation is initiated under electrocatalytic conditions, the catalytic responses of both 1 and 2 were investigated. For 1, the second, large wave increases linearly with acid concentration up to 100 eq. (Fig. S16, ESI†), as anticipated for a catalytic response.26 To evaluate the possibility that a catalytically active, surface-adsorbed heterogeneous species is formed during the cathodic sweep of 1 in the presence of acid, a rinse test10,11 was conducted. Using a freshly polished electrode in a solution of 1 and acid, the potential was scanned from −0.70 V to −1.80 V vs. Fc+/Fc. The electrode was then removed from the solution, rinsed with CH3CN, and scanned over the same range in a fresh acid-only solution, generating a voltammogram exhibiting a similar catalytic wave to that observed in the first scan, but with the absence of the prewave (Fig. S17, ESI†). No catalytic wave is observed in the acid-only solution if the electrode was not initially scanned beyond the prewave feature (Fig. S18, ESI†). Similar to the behavior of electrodes in solutions of 1 and acid, increasing the concentration of acid in the acid-only solution with a treated electrode results in linearly increasing catalytic waves up to similar acid eq., (Fig. S19, ESI†), further confirming that an active, surface adsorbed species is formed upon electrolysis. At higher acid concentrations, the peak current begins to level out, likely limited by the turnover rate of the active material (Fig. S16 and S19, ESI†). A similar rinse test was performed using a solution of 2, in which an electroactive, surface adsorbed species forms (Fig. S20, ESI†). In this case, only scans to potentials beyond the NiI/0 reduction potential (−1.65 V) produce catalytic responses in acid-only solutions. However, the electroactive material formed from 2 also deposits in the absence of acid. Polarizing the electrode at −1.65 V in an acid-free solution of 2 is sufficient to generate a catalytic film, suggesting the acid is essential for hydrogenation of 1, but electrodeposition of hydrogenated 1 or 2 does not require additional protons. Further investigation of deposition conditions were pursued, as detailed in the ESI† (Fig. S21).
To determine if the electrocatalytic response observed for heterogeneous material produced by 1 resulted in production of hydrogen, a glassy carbon electrode was treated in an acidic solution of 1 for 480 s (at −1.75 V), rinsed, and dried. This treated electrode was then subjected to a controlled potential electrolysis in a 10 mM CF3COOH solution. Gas chromatography of the headspace confirmed the production of hydrogen with a Faradaic efficiency of 97% (see ESI† for details).
The composition of the active material was evaluated by scanning electron microscopy (SEM), transition electron microscopy (TEM), and X-ray photoelectron spectroscopy (XPS). Large area samples were prepared by electrolyzing solutions of 1 and 2 in the presence of CF3COOH with 1 × 1 × 0.1 cm glassy carbon plates. For comparison, a bare glassy carbon plate and dropcast samples of 1, 2, and [Bu4N][PF6] on gold plated silicon wafers were also analysed.
SEM of glassy carbon plates electrolyzed with 1 or 2 for 480 s revealed surface films ca. 40 nm thick (Fig. S22–S23, ESI†). No differences between the two samples were observed.
TEM analysis of film material scraped off the glassy carbon plates revealed that these films contained nanoparticles (Fig. S22–S23, ESI†). Metal nanoparticle deposition from homogeneous precatalysts has previously been observed for cobalt and nickel compounds.13,15,16 Energy-dispersive X-ray spectroscopy (EDS) of the TEM samples confirmed the presence of nickel, sulfur, and oxygen with atomic ratios for Ni![[thin space (1/6-em)]](https://www.rsc.org/images/entities/char_2009.gif) :
:![[thin space (1/6-em)]](https://www.rsc.org/images/entities/char_2009.gif) S of 18.2
S of 18.2![[thin space (1/6-em)]](https://www.rsc.org/images/entities/char_2009.gif) :
:![[thin space (1/6-em)]](https://www.rsc.org/images/entities/char_2009.gif) 1 and 14.2
1 and 14.2![[thin space (1/6-em)]](https://www.rsc.org/images/entities/char_2009.gif) :
:![[thin space (1/6-em)]](https://www.rsc.org/images/entities/char_2009.gif) 1 for plates treated with 1 and 2, respectively, and atomic ratios for Ni
1 for plates treated with 1 and 2, respectively, and atomic ratios for Ni![[thin space (1/6-em)]](https://www.rsc.org/images/entities/char_2009.gif) :
:![[thin space (1/6-em)]](https://www.rsc.org/images/entities/char_2009.gif) O of 6.4
O of 6.4![[thin space (1/6-em)]](https://www.rsc.org/images/entities/char_2009.gif) :
:![[thin space (1/6-em)]](https://www.rsc.org/images/entities/char_2009.gif) 1 and 7.6
1 and 7.6![[thin space (1/6-em)]](https://www.rsc.org/images/entities/char_2009.gif) :
:![[thin space (1/6-em)]](https://www.rsc.org/images/entities/char_2009.gif) 1. The excess of nickel relative to sulfur and oxygen suggests that the nanoparticles produced are primarily nickel-based.
1. The excess of nickel relative to sulfur and oxygen suggests that the nanoparticles produced are primarily nickel-based.
The Ni 2p XPS peak structure is complex, especially for nickel in oxidation states other than Ni0. The characteristic doublet is often accompanied by satellite peaks due to different final state effects with varying intensities and spacings from the main doublet peaks.27–30 For dropcast samples of 1 and 2, the XPS spectra reflect the atomic ratios and binding energies consistent with the molecular species; however, XPS analysis of the electrolyzed samples reveal starkly different atomic ratios and binding energies from the molecular species (Table S3, ESI†). The differences of the Ni![[thin space (1/6-em)]](https://www.rsc.org/images/entities/char_2009.gif) :
:![[thin space (1/6-em)]](https://www.rsc.org/images/entities/char_2009.gif) S
S![[thin space (1/6-em)]](https://www.rsc.org/images/entities/char_2009.gif) :
:![[thin space (1/6-em)]](https://www.rsc.org/images/entities/char_2009.gif) N atomic ratios observed for dropcast samples of 1 (1
N atomic ratios observed for dropcast samples of 1 (1![[thin space (1/6-em)]](https://www.rsc.org/images/entities/char_2009.gif) :
:![[thin space (1/6-em)]](https://www.rsc.org/images/entities/char_2009.gif) 1.48
1.48![[thin space (1/6-em)]](https://www.rsc.org/images/entities/char_2009.gif) :
:![[thin space (1/6-em)]](https://www.rsc.org/images/entities/char_2009.gif) 2.93) vs. electrolyzed 1 (1
2.93) vs. electrolyzed 1 (1![[thin space (1/6-em)]](https://www.rsc.org/images/entities/char_2009.gif) :
:![[thin space (1/6-em)]](https://www.rsc.org/images/entities/char_2009.gif) 0.11
0.11![[thin space (1/6-em)]](https://www.rsc.org/images/entities/char_2009.gif) :
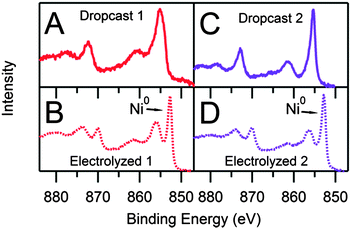
:![[thin space (1/6-em)]](https://www.rsc.org/images/entities/char_2009.gif) 0.05) indicates that the molecular species undergoes a transformation as the active film is generated. The high resolution Ni 2p spectrum of electrolyzed 1 reveals a narrow diagnostic peak at 852.7 eV, corresponding to the Ni 2p3/2 peak of Ni0,27 and a peak at 856.0 eV, indicating the presence of a second Ni species (Fig. 4). While the Ni 2p peak at 856.0 eV possibly represents Ni–O10 or Ni–S (via comparison with the dropcast data) interactions, the XPS data do not permit absolute assignment. By contrast, the high resolution Ni 2p spectra of dropcast 1 and 2 show no evidence of Ni0. The spectrum of electrolyzed 2 is qualitatively indistinguishable from that of 1, suggesting that 1 and 2 decompose into the same Ni-containing products during electrolysis.
0.05) indicates that the molecular species undergoes a transformation as the active film is generated. The high resolution Ni 2p spectrum of electrolyzed 1 reveals a narrow diagnostic peak at 852.7 eV, corresponding to the Ni 2p3/2 peak of Ni0,27 and a peak at 856.0 eV, indicating the presence of a second Ni species (Fig. 4). While the Ni 2p peak at 856.0 eV possibly represents Ni–O10 or Ni–S (via comparison with the dropcast data) interactions, the XPS data do not permit absolute assignment. By contrast, the high resolution Ni 2p spectra of dropcast 1 and 2 show no evidence of Ni0. The spectrum of electrolyzed 2 is qualitatively indistinguishable from that of 1, suggesting that 1 and 2 decompose into the same Ni-containing products during electrolysis.
The elemental ratios found by TEM-EDS and XPS analysis were dissimilar, with the ratios of Ni![[thin space (1/6-em)]](https://www.rsc.org/images/entities/char_2009.gif) :
:![[thin space (1/6-em)]](https://www.rsc.org/images/entities/char_2009.gif) S and Ni
S and Ni![[thin space (1/6-em)]](https://www.rsc.org/images/entities/char_2009.gif) :
:![[thin space (1/6-em)]](https://www.rsc.org/images/entities/char_2009.gif) O smaller in the XPS elemental analysis than those in the TEM-EDS analysis (Fig. S22 and S23, ESI†). Despite these differences, both forms of analysis show an excess of nickel relative to sulfur and oxygen. One possible explanation for the differences in Ni
O smaller in the XPS elemental analysis than those in the TEM-EDS analysis (Fig. S22 and S23, ESI†). Despite these differences, both forms of analysis show an excess of nickel relative to sulfur and oxygen. One possible explanation for the differences in Ni![[thin space (1/6-em)]](https://www.rsc.org/images/entities/char_2009.gif) :
:![[thin space (1/6-em)]](https://www.rsc.org/images/entities/char_2009.gif) S and Ni
S and Ni![[thin space (1/6-em)]](https://www.rsc.org/images/entities/char_2009.gif) :
:![[thin space (1/6-em)]](https://www.rsc.org/images/entities/char_2009.gif) O ratios lies in sample treatment: XPS sampled the deposited material still attached to the substrate, while TEM-EDS analysis involved scrapping the deposit off the substrate followed by dispersion by ultrasonication prior to deposition onto a TEM grid. This dispersion may have separated an amorphous overcoat layer (suggested from the SEM and TEM images) from encompassed nanoparticles. Additionally, while XPS probed a thin surface layer over a large area, TEM-EDS analyzed a smaller portion in bulk. We hypothesize that XPS largely analyzed the amorphous film which appears to surround the nanoparticles while the deeper penetrating TEM-EDS preferentially sampled the bulk composition of the nanoparticles.
O ratios lies in sample treatment: XPS sampled the deposited material still attached to the substrate, while TEM-EDS analysis involved scrapping the deposit off the substrate followed by dispersion by ultrasonication prior to deposition onto a TEM grid. This dispersion may have separated an amorphous overcoat layer (suggested from the SEM and TEM images) from encompassed nanoparticles. Additionally, while XPS probed a thin surface layer over a large area, TEM-EDS analyzed a smaller portion in bulk. We hypothesize that XPS largely analyzed the amorphous film which appears to surround the nanoparticles while the deeper penetrating TEM-EDS preferentially sampled the bulk composition of the nanoparticles.
The presence of elemental nickel in the heterogeneous film is further supported by CV. For electrodes treated with 1 and 2 under identical conditions used for the rinse test, an irreversible, anodic nickel stripping wave is observed between −0.10 V and −0.60 V (Fig. S24, ESI†). Scanning through this region degrades the catalytic activity of the heterogeneous film, as evidenced by a cathodic shift of the catalytic wave for sequential scans over the stripping wave (Fig. S25, ESI†). The catalytic ability is preserved for repeated scans in an acid-only solution provided that the potential is never scanned positive of −0.50 V.
Surface analysis and voltammetry measurements both suggest the presence of more than one nickel species on the electrode surface, including Ni0. To determine if Ni0 was the only catalytically active species in the film, or if another nickel species contributed to the catalytic response currents, electrochemical acid titration experiments were performed with solutions of Ni(ClO4)2·6H2O (Fig. S26, ESI†). A catalytic wave is observed with an onset potential more negative than produced from either solution of 1 or 2. The difference observed between the catalytic wave onset potentials of 1, 2 and Ni(ClO4)2·6H2O further support the surface analysis identification of two Ni species in electrolyzed samples of 1 and 2 and indicate that more than one nickel species contribute to the catalytic activity of the film.
Taken together, the electrochemical data and surface analyses help elucidate the pathway by which the active, surface adsorbed species is deposited. The lack of a prewave for 2 strongly supports assignment of the prewave observed for solutions of 1 in the presence of acid as C![[double bond, length as m-dash]](https://www.rsc.org/images/entities/char_e001.gif) N hydrogenation. The limiting two electron stoichiometry of this prewave suggests a net two electron, two proton, C
N hydrogenation. The limiting two electron stoichiometry of this prewave suggests a net two electron, two proton, C![[double bond, length as m-dash]](https://www.rsc.org/images/entities/char_e001.gif) N hydrogenation of a single ligand of 1. Since reduction and hydrogenation of the free ligand in the presence of acid (Fig. S8 and S9, ESI†) occurs at potentials much more negative than the prewave, this suggests that ligand hydrogenation in 1 occurs via an intramolecular pathway mediated by electrochemically generated NiI, analogous to the mechanism proposed for ligand hydrogenation in the cobalt clathrochelate complex.15 As noted previously, the NiI/0 redox couple of 1 is quasi-reversible while by contrast the NiI/0 redox couple of 2 is irreversible (Fig. 2). After two one-electron reductions of 2, 22− decomposes. We hypothesize that after the first metal-mediated ligand C
N hydrogenation of a single ligand of 1. Since reduction and hydrogenation of the free ligand in the presence of acid (Fig. S8 and S9, ESI†) occurs at potentials much more negative than the prewave, this suggests that ligand hydrogenation in 1 occurs via an intramolecular pathway mediated by electrochemically generated NiI, analogous to the mechanism proposed for ligand hydrogenation in the cobalt clathrochelate complex.15 As noted previously, the NiI/0 redox couple of 1 is quasi-reversible while by contrast the NiI/0 redox couple of 2 is irreversible (Fig. 2). After two one-electron reductions of 2, 22− decomposes. We hypothesize that after the first metal-mediated ligand C![[double bond, length as m-dash]](https://www.rsc.org/images/entities/char_e001.gif) N hydrogenation of 1, the species generated (1*) is electronically more similar to 2, and upon two sequential reductions, 1*2− decomposes to form multiple electrode-adsorbed active species as identified by electrochemical and XPS analysis.
N hydrogenation of 1, the species generated (1*) is electronically more similar to 2, and upon two sequential reductions, 1*2− decomposes to form multiple electrode-adsorbed active species as identified by electrochemical and XPS analysis.
Surface analysis by XPS, SEM, and TEM support this decomposition pathway by identifying similarities between the decomposition products of 1 and 2, in which both nickel-containing nanoparticles and an additional Ni species are present.
This work joins only a few other studies describing the transformation of a precatalyst to an H2-evolving film and offers new insight into decomposition pathways of coordination complexes under electrocatalytic conditions. Further, these results, along with related studies on cobalt complexes,13–15 indicate that C![[double bond, length as m-dash]](https://www.rsc.org/images/entities/char_e001.gif) N bonds are readily hydrogenated under electrocatalytic conditions and that this hydrogenation is the first step towards transforming these coordination complexes into heterogeneous species. Unlike prior studies where C
N bonds are readily hydrogenated under electrocatalytic conditions and that this hydrogenation is the first step towards transforming these coordination complexes into heterogeneous species. Unlike prior studies where C![[double bond, length as m-dash]](https://www.rsc.org/images/entities/char_e001.gif) N bond hydrogenation is implicated to be responsible for electrochemical prewaves, this work provides compelling evidence that this assignment is correct via comparison with a completely hydrogenated molecular analogue. The susceptibility of C
N bond hydrogenation is implicated to be responsible for electrochemical prewaves, this work provides compelling evidence that this assignment is correct via comparison with a completely hydrogenated molecular analogue. The susceptibility of C![[double bond, length as m-dash]](https://www.rsc.org/images/entities/char_e001.gif) N bonds towards hydrogenation suggests such structural components should be avoided in the design of molecular electrocatalysts.
N bonds towards hydrogenation suggests such structural components should be avoided in the design of molecular electrocatalysts.
Catherine Pitman, Seth Barrett, and Eric Rountree are thanked for helpful discussions. Dr Amar S. Kumbhar is thanked for SEM-EDS/TEM-EDS operation. D.J.M. acknowledges support from the North Carolina American Chemical Society (NC-ACS) for the Howie James Undergraduate Research Scholarship and the UNC-CH E. C. Markham Undergraduate Research Fellowship. B.D.M. thanks support from the Department of Energy Office of Science Graduate Fellowship Program (DOE SCGF), made possible by the American Recovery and Reinvestment Act of 2009, administered by ORISE-ORAU under contract no. DE-AC05-06OR23100. This research made use of instrumentation funded by the UNC EFRC: Center for Solar Fuels, an Energy Frontier Research Center supported by the U.S. Department of Energy, Office of Science, Office of Basic Energy Sciences, under award no. DE-SC0001011.
Notes and references
- J. L. Dempsey, J. R. Winkler and H. B. Gray, in Comprehensive Inorganic Chemistry II, ed. J. Reedijk and K. Poeppelmeier, Elsevier, Oxford, 2013, vol. 8, pp. 553–565 Search PubMed.
- V. S. Thoi, Y. Sun, J. R. Long and C. J. Chang, Chem. Soc. Rev., 2013, 42, 2388–2400 RSC.
- J. R. McKone, S. C. Marinescu, B. S. Brunschwig, J. R. Winkler and H. B. Gray, Chem. Sci., 2014, 5, 865–878 RSC.
- K. Redin, A. D. Wilson, R. Newell, M. R. DuBois and D. L. DuBois, Inorg. Chem., 2007, 46, 1268–1276 CrossRef CAS PubMed.
- M. Rakowski DuBois and D. L. DuBois, Chem. Soc. Rev., 2009, 38, 62–72 RSC.
- E. S. Rountree, B. D. McCarthy, T. T. Eisenhart and J. L. Dempsey, Inorg. Chem., 2014, 53, 9983–10002 CrossRef CAS PubMed.
- D. J. Wasylenko, C. Rodríguez, M. L. Pegis and J. M. Mayer, J. Am. Chem. Soc., 2014, 136, 12544–12547 CrossRef CAS PubMed.
- J. A. Widegren and R. G. Finke, J. Mol. Catal. A: Chem., 2003, 198, 317–341 CrossRef CAS.
- V. Artero and M. Fontecave, Coord. Chem. Rev., 2005, 249, 1518–1535 CrossRef CAS PubMed.
- M. Fang, M. H. Engelhard, Z. Zhu, M. L. Helm and J. A. S. Roberts, ACS Catal., 2014, 4, 90–98 CrossRef CAS.
- V. Artero and M. Fontecave, Chem. Soc. Rev., 2013, 42, 2338–2356 RSC.
- S. El Ghachtouli, R. Guillot, F. Brisset and A. Aukauloo, ChemSusChem, 2013, 6, 2226–2230 CrossRef CAS PubMed.
- E. Anxolabéhère-Mallart, C. Costentin, M. Fournier and M. Robert, J. Phys. Chem. C, 2014, 118, 13377–13381 Search PubMed.
- S. El Ghachtouli, M. Fournier, S. Cherdo, R. Guillot, M.-F. Charlot, E. Anxolabéhère-Mallart, M. Robert and A. Aukauloo, J. Phys. Chem. C, 2013, 117, 17073–17077 CAS.
- E. Anxolabéhère-Mallart, C. Costentin, M. Fournier, S. Nowak, M. Robert and J.-M. Savéant, J. Am. Chem. Soc., 2012, 134, 6104–6107 CrossRef PubMed.
- S. Cherdo, S. El Ghachtouli, M. Sircoglou, F. Brisset, M. Orio and A. Aukauloo, Chem. Commun., 2014, 50, 13514–13516 RSC.
- L. F. Lindoy and S. E. Livingstone, Inorg. Chem., 1968, 7, 1149–1154 CrossRef CAS.
- Z. Han, L. Shen, W. W. Brennessel, P. L. Holland and R. Eisenberg, J. Am. Chem. Soc., 2013, 135, 14659–14669 CrossRef CAS PubMed.
- Z. Han and R. Eisenberg, Acc. Chem. Res., 2014, 47, 2537–2544 CrossRef CAS PubMed.
- C. J. Curtis, A. Miedaner, R. Ciancanelli, W. W. Ellis, B. C. Noll, M. R. DuBois and D. L. DuBois, Inorg. Chem., 2003, 42, 216–227 CrossRef CAS PubMed.
- R. M. Bullock, A. M. Appel and M. L. Helm, Chem. Commun., 2014, 50, 3125–3143 RSC.
- S. K. Chatterjee, S. Roy, S. K. Barman, R. C. Maji, M. M. Olmstead and A. K. Patra, Inorg. Chem., 2012, 51, 7625–7635 CrossRef CAS PubMed.
- A. J. Bard and L. R. Faulkner, Electrochemical Methods: Fundamentals and Applications, John Wiley & Sons, Inc., 2nd edn, 2001 Search PubMed.
- K. Izutsu, Acid-Base Dissociation Constants in Dipolar Aprotic Solvents, IUPAC Chemical Data Series, Blackwell Science, Oxford, UK, 1990 Search PubMed.
- B. D. McCarthy, D. J. Martin, E. S. Rountree, A. C. Ullman and J. L. Dempsey, Inorg. Chem., 2014, 53, 8350–8361 CrossRef CAS PubMed.
- J.-M. Savéant, Chem. Rev., 2008, 108, 2348–2378 CrossRef PubMed.
- A. P. Grosvenor, M. C. Biesinger, R. S. C. Smart and N. S. McIntyre, Surf. Sci., 2006, 600, 1771–1779 CrossRef CAS PubMed.
- H. W. Nesbitt, D. Legrand and G. M. Bancroft, Phys. Chem. Miner., 2000, 27, 357–366 CrossRef CAS.
- E. L. Ratcliff, J. Meyer, K. X. Steirer, A. Garcia, J. J. Berry, D. S. Ginley, D. C. Olson, A. Kahn and N. R. Armstrong, Chem. Mater., 2011, 23, 4988–5000 CrossRef CAS.
- B. P. Payne, M. C. Biesinger and N. S. McIntyre, J. Electron Spectrosc. Relat. Phenom., 2012, 185, 159–166 CrossRef CAS PubMed.
Footnote |
| † Electronic supplementary information (ESI) available: Additional electrochemical characterization, XPS spectra, SEM and TEM images, EDS spectra, and bulk electrolysis details. See DOI: 10.1039/c4cc08662g |
| This journal is © The Royal Society of Chemistry 2015 |

