Measuring reaction kinetics in a lab-on-a-chip by microcoil NMR
Henk
Wensink
a,
Fernando
Benito-Lopez
b,
Dorothee C.
Hermes
a,
Willem
Verboom
b,
Han J. G. E.
Gardeniers
*a,
David N.
Reinhoudt
b and
Albert
van den Berg
a
aBIOS, the Lab-on-a-Chip group, MESA+ Research Institute, University of Twente, P.O. Box 217, 7500 AE, Enschede, The Netherlands. E-mail: j.g.e.gardeniers@utwente.nl; Fax: +31 53 4892287; Tel: +31 53 4894356
bLaboratory of Supramolecular Chemistry and Technology, MESA+ Research Institute, University of Twente, P.O. Box 217, 7500 AE, Enschede, The Netherlands
First published on 28th January 2005
Abstract
A microfluidic chip with an integrated planar microcoil was developed for Nuclear Magnetic Resonance (NMR) spectroscopy on samples with volumes of less than a microliter. Real-time monitoring of imine formation from benzaldehyde and aniline in the microreactor chip by NMR was demonstrated. The reaction times in the chip can be set from 30 min down to ca. 2 s, the latter being the mixing time in the microfluidic chip. Design rules will be described to optimize the microreactor and detection coil in order to deal with the inherent sensitivity of NMR and to minimize magnetic field inhomogeneities and obtain sufficient spectral resolution.
Introduction
Recent years have seen an increased interest in the use of miniaturized systems for the study of chemical reactions.1 Advantages that these microreactors offer are improvements in heat exchange and mixing,2 or extremely high surface-to-volume ratios in microchannel reactors for heterogeneous catalysis.3 Another advantage is that integration of functional elements like active mixers and heaters or components for the real-time in-situ analysis of reaction intermediates and products has become possible due to the developments in the field of microelectromechanical systems (MEMS). An example of this, related to the present paper, is the work by Kakuta et al., who have used a micromachined micromixer coupled to a microcoil NMR probe to study the kinetics of protein conformation changes.4This paper deals with the integration of planar metal-film microcoils for the excitation and detection of Nuclear Magnetic Resonance (NMR) signals in a microreactor chip. Coupling NMR microcoils directly to a microreactor provides spectroscopic information that will allow both the identification and quantification of chemical species in the microreactor. As will be demonstrated in this paper, the information that can be obtained in this way may serve to study the kinetics of chemical reactions real-time and in-situ.
Design aspects of lab-on-a-chip-based NMR
A drawback of NMR is that it is inherently insensitive, requiring special measures in case it is applied to the very small sample volumes present in a microreactor. NMR performed on small sample volumes, down to 5 nl, was first demonstrated in capillaries, in which case a solenoidal coil for excitation and detection of the NMR signals was wrapped around the capillary.5 In this form, NMR has been used as an on-line detection method for capillary separation techniques like High-Performance Liquid Chromatography (HPLC) and Capillary Electrophoresis (CE).6 An extra feature of being able to work with small sample volumes is the possibility to insert multiple probes into a single NMR magnet, which allows high-throughput NMR analysis.7The combination of chip-based microfluidics with NMR was to our knowledge first demonstrated by Trumbull et al.,8 who integrated a planar NMR coil on a CE chip. These authors reported 1H spectra of a 30 nL water sample acquired at 250 MHz with a frequency-domain signal-to-noise-ratio (SNRf) of 23.5 per scan, and a minimal linewidth of 1.39 Hz. Comparable results have been obtained by Massin et al.,9viz. a SNRf of 117 per scan but with a linewidth of 30 Hz for 30 nL water in a micromachined glass chip with integrated microcoil, acquired at 300 MHz. The main factor that limits the performance of micromachined NMR-probes in terms of sensitivity and spectral resolution was indentified to be probe-induced static magnetic field inhomogeneity, and routes for improvement were suggested to be in the areas of probe design and materials, magnetic field shimming, and signal processing.10 In the following section we will focus on aspects of probe design.
Signal to noise ratio
For an optimal signal-to-noise-ratio, the planar microcoil has to be properly designed, i.e. the parameter set that defines the coil (see Fig. 1) viz. the number (N), width (w), height (h) and separation (s) of the windings and the inner diameter (ri,), has to be optimized. Different effects play a role in this optimization. For example, increasing the number of windings will increase the signal level but will also increase the coil resistance and therewith the noise level (the main source is Johnson noise that scales with the square root of the coil resistance). It is difficult to calculate analytically which parameters yield the maximum SNR, since the coil resistance depends non-linearly on e.g. the amount of windings, due to the frequency-dependent skin effect and the proximity effect caused by neighbouring windings.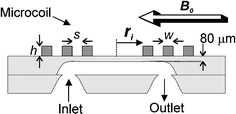 | ||
| Fig. 1 Schematic cross-section of the micro coil with three windings on top of a microfluidic chip. | ||
In previous work11 we have shown how to find the optimum coil geometry by using finite element simulations in FEMM.12 The design rules that can be derived from this work and that of others are as follows: (1) The windings and the separations between the windings should be as small as possible; this puts demands on the tolerances of the microfabrication process; (2) The coil height has only a small influence on the resistance and should be about 20 to 50 μm (i.e. at least twice the skin depth13); (3) The inner coil radius should match the average radius of the sample volume to obtain a high filling factor;9 (4) There is no general rule to determine the optimal number of windings, it should be determined by simulations for specific coil shapes (examples of optimized coils can be found in ref. 11); (5) For a simple model of a planar microcoil it can be derived14 that SNR scales with the inverse of the distance between NMR detection coil and sample, which distance should therefore be as small as possible.
Spectral resolution
Spectral resolution mainly depends on the homogeneity of the magnetic fields over the interrogated NMR sample volume. Commercial high-resolution NMR equipment is designed to have a homogeneous magnetic field over a sufficiently large area. Any material introduced in the homogeneous area distorts the magnetic field, unless the magnetic permeability of the material matches with that of the magnetic field area. Although the permeability of e.g. glass and copper differs only slightly from that of air, it still disturbs the homogeneity and therewith decreases the spectral resolution. This is a typical problem for NMR detection in a lab on a chip, since, in contrast to conventional NMR probes, the volume of glass surrounding the sample is relatively large.To avoid these field distortions, abrupt changes in material geometry near the NMR detection area can best be avoided. Consequently, electrical and fluidic connections should not be placed in the neighbourhood of the detection area. The fluidic channel that contains the sample will also disturb the magnetic field, but for reasons of sensitivity this has to be close to the detection coil. Two approaches can be followed to maintain a homogeneous field inside the sample volume of interest. The first approach becomes clear from the simulation result in Fig. 2a: in a spherical or cylindrical volume, the field inside the volume will be very homogeneous. This approach was followed by others.10,15 The second approach, the one followed in this work, is to place a straight channel (which could have arbitrary cross-section) in line with the magnetic field. Any disturbances created by the ends of the channel part will have faded out in the central region of the channel, where the detection coil is placed (Fig. 2b). With state-of-the-art microfabrication techniques this configuration is easier to achieve than perfectly spherical or cylindrical channels.
 | ||
| Fig. 2 The effect of the cross-sectional channel shape on the B0 magnetic field lines. a, Spherical or cylindrical channel and b, long straight channel in line with the field lines. | ||
Chip fabrication and NMR set-up
Two 1.1 mm thick Borofloat wafers were powder blasted,16 to obtain a 450 µm deep channel structure in one and through-holes in the other. The channel width is 500 µm underneath the detection coil and the cross-section has a rounded V-shape; the channels that connect the through holes to the detection channel are slightly smaller. The wafers are bonded and annealed at a temperature of 600 °C for 1 h. About 570 µm of glass is removed from one side of the wafer stack by etching in 33 wt.% HF which will leave about 80 µm of glass between the NMR detection coil and the bottom of the channel (see Fig. 1). A 25 nm titanium adhesion layer and 150 nm copper seed layer was sputtered over the whole wafer. Thick AZ9240 resist was patterned on the wafer with a thickness of 25 µm to define the NMR detection coil. 18 µm of copper was electroplated on the wafer using the resist as a mould. After the resist was removed, the remaining seed layer was removed by ion beam etching to avoid electrical shorting between the windings. The coil has 24 windings with a width and separation of 20 µm and an inner diameter of 200 µm. Simulations showed that at 60 MHz, this coil has a self induction of 500 nH, a resistance of 4.5 Ω and a quality factor of 42. Finally, the wafer was diced in 1 cm by 1.5 cm chips. Fig. 3 shows a photograph of the result.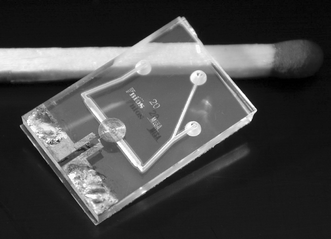 | ||
| Fig. 3 The glass NMR chip with planar micro coil. Chip size is 1 by 1.5 cm; channel width underneath coil is 500 µm. | ||
A conventional NMR magnet was used for the measurements (1.4 Tesla, 60 MHz, Varian EM360L), with the original probe head removed. A chip was placed on a plastic bar (the probe head) that allowed it to be suspended in the magnet. The probe head could be moved to position the chip exactly in the center of the two magnetic heads, where the homogeneous region of the magnetic field is located. Two adjustable capacitors were mounted on the probe head at 3.5 cm from the chip and electrically connected to the coil. This allows the coil to be matched to 50 Ω impedance and tuned to resonate at 60 MHz for a maximum power transfer to the electrical set-up. The electrical set-up, similar to that of Massin et al.,17 is shown in Fig. 4. Switches (ZYSW-2-50DR), amplifiers (ZFL-500LN), mixer (ZAD-1) and power splitter (ZSC-2-1) were obtained from Mini-Circuits Europe, Surrey, United Kingdom. The filter is a simple RC-network with a cut-off frequency of 1500 Hz. The 60 MHz RF-source is an Agilent 33250A function generator, the pulse length was determined by an HP33120A function generator. The NMR signal was acquired by an Agilent oscilloscope 54621A and Fourier transformed by Agilent VEE Pro 6.0 software that also controlled the set-up. The acquisition parameters (acquisition time, number of data points, electronic filter settings) were kept constant for all measurements. The correct power for a 90° pulse was determined by gradually increasing the power till maximum NMR signal was obtained. The pulse typically had an amplitude of 0.5 V (top) at a length of 28 µs.
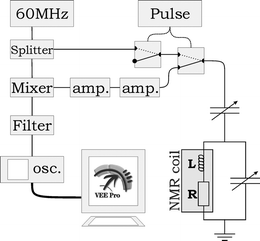 | ||
| Fig. 4 Electrical scheme of NMR set-up. | ||
Results and discussion
In our previous work we have reported a SNRf of 550 and a spectral resolution of 0.022 ppm for water manually loaded to a similar chip in the same set-up as described above. In this work we modified the probe head to allow Upchurch Nanoport connectors to be fixed to the chip. This reduced the spectral resolution to ca. 0.1 ppm, indicating that fluidic connections should be moved further away from the NMR coil in future chip designs. Nevertheless, the new set-up allowed solutions to be pumped into the chip by a syringe pump (CMA/102 Microdialysis), via glass capillaries.The total channel volume between the mixing point, i.e. the point where the two inlet channels join (see Fig. 3) and the detection coil is ca. 0.57 µL, the detection volume (the channel volume under the coil) is estimated to be 56 nl. The residence time in this volume ranges from 0.9 s to 30 min, depending on flow rate. If the flow rate is too high, the excited volume of sample will be removed from the detection region before NMR signal acquisition is completed, which will reduce spectral resolution. We did not observe such an effect for the settings used in this paper.
Imine (Schiff base) formation was chosen as a model reaction, see Fig. 5. This reaction has been performed in a microfluidic chip before, and in the previous work was analyzed by mass spectrometry18 or Raman microscopy.19 In our case, the chip inlets were connected to two 100 µL syringes containing 4.95 M benzaldehyde and 0.475 M tetramethylsilane (TMS; NMR reference) in deuterated nitromethane (CD3NO2) and 4.95 M aniline, 0.523 M TMS in CD3NO2, respectively. Fig. 6 shows the 1H NMR spectra of the individual solutions measured in the chip.
 | ||
| Fig. 5 Imine (3) formation from benzaldehyde (1) and aniline (2). | ||
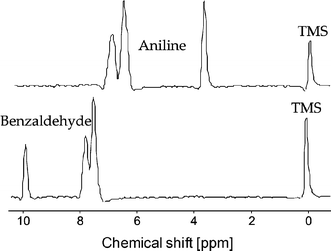 | ||
| Fig. 6 1H NMR spectra of the two reactant solutions. | ||
Due to the high reactant concentrations, a substantial amount of water was formed during the reaction, which is immiscible with the organic substances and remains stuck at channel walls, particularly at corners. Therefore, a high flowrate flush was applied between the scans to prevent the dominance of water resonance in the spectra. After flushing, the flow rate was set to a lower value to achieve the desired residence time.
The measurement procedure was as follows: the two reactants were loaded in the chip with a chosen flowrate. The flowrate determines the residence time in the channel section between the mixing point and the detection area, and this residence time is taken as the reaction time. A NMR scan is taken (aquisition time 0.2 s, 2000 data points), after which a delay time was taken before the next scan was recorded. The exact delay time was scaled with the flowrate to ensure complete refreshment of the detection volume, however a maximum delay time of 10 s was taken. Per reaction time 32 NMR scans were measured and averaged.
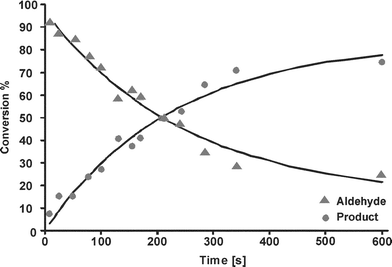
For analysis of the reaction kinetics, we focused on two peaks, viz. the aldehyde peak of benzaldehyde at 9.9 ppm and the imine peak of the product at 8.4 ppm. Fig. 7 shows the increase of the imine peak and decrease of the aldehyde signal with increasing residence time. The peak area of the two peaks of interest was calculated to follow the course of the reaction. In Fig. 8, the conversion of the reaction is plotted as the ratio of each peak area to the sum of both peak areas, as a function of the residence time. The lines in this figure are a fit with a second order rate equation with a rate constant of 6.6 × 10⁻² M−1min−1, with a correlation coefficient of 0.93.
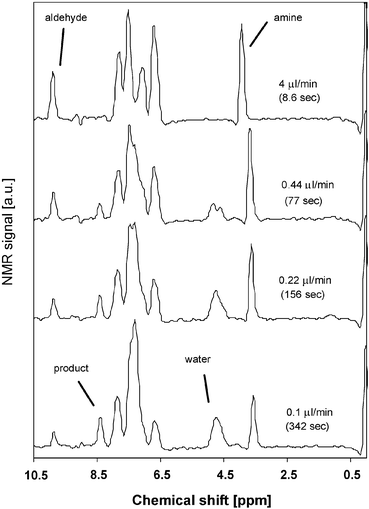 | ||
| Fig. 7 1H NMR spectra taken at different residence times. | ||
The reaction of Fig. 5 was also carried out in a conventional probe in a 400 MHz NMR machine (Varian) using the same concentration as in the chip. The reaction was followed by taking a single scan every 5 s, and the experiment was performed 3 times, the second order rate constant was found to be (3.35 ± 0.05) × 10−2 M−1min−1. This value is in the same range as values measured by Raman spectroscopy for imine formation (in chloroform).20 The reaction rate constant found in the chip is ca. 2 times that in the larger-scale system, which is probably due to a better mixing performance in the chip.
The degree of mixing may be characterized by the penetration depth for diffusion of a species from one liquid into the other, which in a simple 1-dimensional diffusion model without chemical reaction is equal to the square root of 2Dt, with t the time of contact of the two liquids and D the diffusivity of the species of interest. The diffusivity of the reactants benzaldehyde and aniline is 1.5 × 10⁻⁹ m2 s−1 and 1.96 × 10⁻⁹ m2 s−1, respectively.21,22 Thus, the time needed for complete mixing in a 160 µm wide channel is ca. 2 s, from which it can be concluded that mixing can be considered to be instantaneous for most of the time range in which we have measured the reaction kinetics (Fig. 8). The reaction time range that is available for study in our chip is comparable to that obtained by Kakuta et al.,4 who mention a mixing time of 1.4 s for a Y-connector included in their system and could measure reaction times down to 3.8 s.
Improving the set-up
In this work we have demonstrated monitoring of a simple chemical reaction. The chip may be improved by adding extra functionality (e.g. mixers and heaters). More complex pulse sequences, like COSY and NOESY,23 are in principle possible with the system we have developed, and in fact a simple COSY experiment with 13C-labeled acetic acid on a microfluidic chip with an integrated Helmholtz microcoil (i.e. a dual microcoil) has been demonstrated.15 Additional functionality that aids in the measurement of reaction kinetics could be the implementation of a fast mixer4 or heaters, or the use of two or more coils at different positions along a microchannel, a configuration that was used by Ciobanu et al., who wrapped several solenoidal microcoils at different locations around a flow-through capillary.24The performance of the chip for NMR spectroscopy was adequate for the reaction kinetic study presented here, in which relatively simple, low molecular weight species at high concentrations were studied. However, to work at more practical concentrations or with more complex molecules, a much better spectral resolution is required. Since in the present design the spectral resolution is completely determined by magnetic field imhomogeneity in the chip, improving the design of the chip is the main step to be taken. Chip designs other than the planar coil (e.g. striplines25) are currently under investigation.
Conclusions
In this paper we have demonstrated the design, fabrication and testing of a microreactor chip with integrated microcoil for NMR measurement. The system is optimized for low field NMR in a conventional NMR magnet. Monitoring of the reaction kinetics of imine formation from benzaldehyde and aniline in the microreactor by NMR at 60 MHz was demonstrated, and compared with measurements in a conventional tube in a 400 MHz NMR system. The kinetic data show that the kinetics in the chip are a factor of 2 faster, which is attributed to faster mixing in the chip. The mixing time in the microreactor was calculated to be ca. 2 s, while the reaction times in the chip can be set from 30 min down to only 0.9 s, therewith enabling monitoring of relatively fast reactions.Acknowledgements
We acknowledge financial support from the Dutch Technology Foundation (STW) and Avantium Technologies. We thank Arno Kentgens, Jan van Bentum and Hans Janssen, all of the NSRIM Center at the University of Nijmegen, The Netherlands, for stimulating discussions on NMR.References
- S. Haswell and V. Skelton, Trends Anal. Chem., 2000, 19, 389 CrossRef CAS.
- V. Hessel, S. Hardt and H. Löwe, Chemical Micro Process Engineering, Wiley-VCH, Weinheim, 2004 Search PubMed.
- J. Kobayashi, Y. Mori, K. Okamoto, R. Akiyama, M. Ueno, T. Kitamori and S. Kobayashi, Science, 2004, 304, 1305 CrossRef CAS.
- M. Kakuta, D. A. Jayawickrama, A. M. Wolters, A. Manz and J. V. Sweedler, Anal. Chem., 2003, 75, 956 CrossRef CAS.
- D. L. Olson, T. L. Peck, A. G. Webb, R. Magin and J. V. Sweedler, Science, 1995, 270, 1967 CrossRef CAS.
- D. A. Jayawickrama and J. V. Sweedler, J. Chromatogr. A, 2003, 1000, 819 CrossRef CAS.
- M. A. Macnaughtan, T. Hou, J. Xu and D. Raftery, Anal. Chem., 2003, 75, 5116 CrossRef CAS.
- J. D. Trumbull, I. K. Glasgow, D. J. Beebe and R. L. Magin, IEEE Trans. Biomed. Eng., 2000, 47, 3 CrossRef CAS.
- C. Massin, A. Daridon, F. Vincent, G. Boero, P.-A. Besse, E. Verpoorte, N. F. de Rooij and R. S. Popovic, Proc. µTAS 2001 Symp., Monterey, CA, USA, Oct. 21–25, IEEE, Piscataway NJ, USA, 2001, p. 438 Search PubMed.
- C. Massin, F. Vincent, A. Homsy, K. Ehrmann, G. Boero, P. A. Besse, A. Daridon, E. Verpoorte, N. F. de Rooij and R. S. Popovic, J. Magn. Reson. 164, 2003, 242 Search PubMed.
- H. Wensink, D. C. Hermes and A. van den Berg, Proc. 17th Int. workshop on Micro Electro Mechanical Systems (MEMS2004), Maastricht, the Netherlands, January 25–29, Kluwer Academic Publishers, Norwell MA, USA, 2004, p. 407 Search PubMed.
- FEMM free software available from http://femm.foster-miller.net/, e-mail: dmeeker@foster-miller.com (David Meeker).
- C. Massin, Microfabricated Planar Coils in Nuclear Magnetic Resonance, Series in Microsystems Vol. 15, Hartung-Gorre Verlag, Konstanz, Germany, 2004 Search PubMed.
- A. G. Webb, Prog. Nucl. Magn. Reson. Spectrosc., 1997, 31, 1 CrossRef CAS.
- J. H. Walton, J. S. de Ropp, M. V. Shutov, A. G. Goloshevsky, M. J. McCarthy, R. L. Smith and S. D. Collins, Anal. Chem., 2003, 75, 5030 CrossRef CAS.
- H. Wensink and M. C. Elwenspoek, Sens. Act. A, 2002, 102, 157 Search PubMed.
- C. Massin, G. Boero, P. Eichenberger, P. A. Besse and R. S. Popovic, Sens. Actuators A, 2002, 97–98, 280 CrossRef.
- M. Brivio, R. H. Fokkens, W. Verboom, D. N. Reinhoudt, N. R. Tas, M. Goedbloed and A. van den Berg, Anal. Chem., 2002, 74, 3972 CrossRef CAS.
- L. Moonkwon, L. Jong-phil, R. Hakjune, C. Jaebum, C. Young Gyu and L. Eum Kyu, J. Raman Spectrosc., 2003, 34, 737 CrossRef CAS.
- L. Moonkwon, K. Hyesung, R. Hakjune and C. Jaebum, Bull. Korean Chem. Soc., 2003, 24, 205 CAS.
- M. Terazima, K. Okamoto and N. Hirota, J. Chem. Phys., 1995, 102, 2506 CrossRef CAS.
- Landolt-Börnstein, Numerical data and functional relationships in science and technology,, 6th edn., vol. II/5a, 1969 Search PubMed.
- A. E. Derome, Modern NMR Techniques for Chemistry Research, Pergamon Press, Oxford, 1987 Search PubMed.
- L. Ciobanu, D. A. Jayawickrama, X. Zhang, A. G. Webb and J. V. Sweedler, Angew. Chem. Int. Ed. Engl., 2003, 42, 4669 CrossRef CAS.
- P. J. M. van Bentum, J. W. G. Janssen and A. P. M. Kentgens, Analyst, 2004, 129, 793 RSC.
| This journal is © The Royal Society of Chemistry 2005 |

