
 Open Access Article
 This Open Access Article is licensed under a Creative Commons Attribution-Non Commercial 3.0 Unported Licence
Magnetic hyperthermia-triggered multi-functional thermo-responsive lipid nanoparticles for enhanced paclitaxel release and cytotoxicity†
Muhammad
Tayyab
 a,
Naveed
Ahmed
*a,
Muhammad Hisham
Al Nasir
b,
Ayesha
Ihsan
c,
Asim Ur
Rehman
a,
Khurram Shahzad
Munawar
d,
Daniel Jaque
Garcia
*e,
Maria del Carmen
Iglesias de la Cruz
f and
Mubashar
Rehman
*a
a,
Naveed
Ahmed
*a,
Muhammad Hisham
Al Nasir
b,
Ayesha
Ihsan
c,
Asim Ur
Rehman
a,
Khurram Shahzad
Munawar
d,
Daniel Jaque
Garcia
*e,
Maria del Carmen
Iglesias de la Cruz
f and
Mubashar
Rehman
*a
aDepartment of Pharmacy, Quaid I Azam University, Islamabad, 45320, Pakistan. E-mail: mtayyab@bs.qau.edu.pk; natanoli@qau.edu.pk; arehman@qau.edu.pk; mrehman@qau.edu.pk
bDepartment of Physics, Riphah International University, Islamabad 44000, Pakistan. E-mail: hisham.nasir@riphah.edu.pk
cNational Institute of Biotechnology and Genetic Engineering (NIBGE-C), Pakistan Institute of Engineering and Applied Sciences (PIEAS), Faisalabad, Pakistan. E-mail: aishaehsan@gmail.com
dDepartment of Chemistry, University of Mianwali, 42200 Punjab, Pakistan. E-mail: khurramchemist@gmail.com
eNanomaterials for Bioimaging Group (nanoBIG), Facultad de Ciencias, Departamento de Física de Materiales, Universidad Autónoma de Madrid, 28049, Spain. E-mail: daniel.jaque@uam.es
fNanomaterials for Bioimaging Group (nanoBIG), Departamento de Fisiología, Facultad de Medicina, Universidad Autónoma de Madrid, Avda, Arzobispo Morcillo 2, Madrid, 28029, Spain. E-mail: mc.cruz@uam.es
First published on 22nd April 2025
Abstract
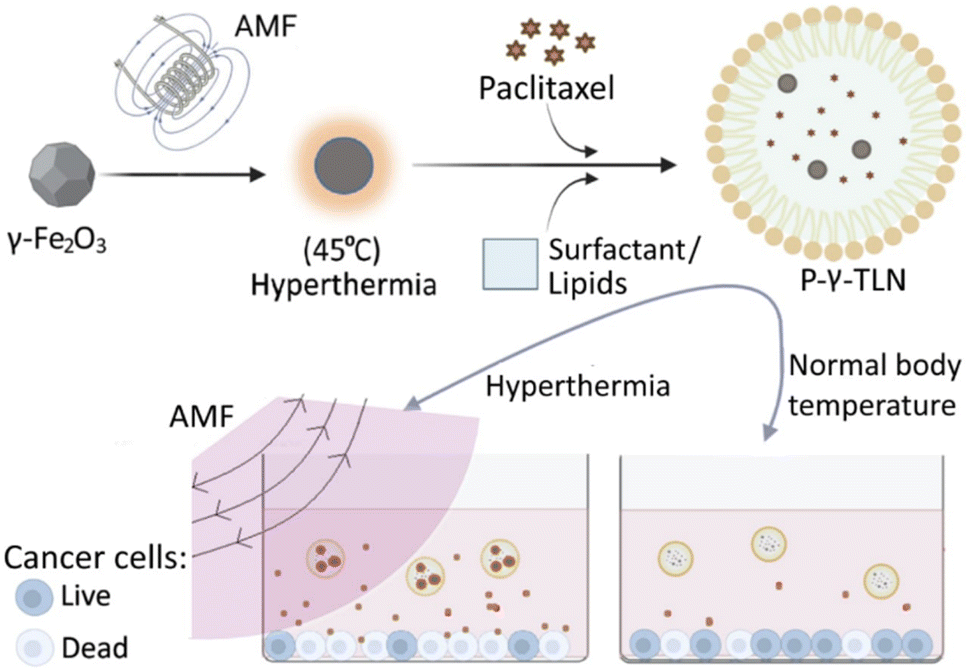
The inadequate safety and efficacy of chemotherapy have led cancer medicine to focus on localizing drug delivery to the target. Thermoresponsive nanocarriers (liposomes and polymeric networks) exploit local hyperthermia to trigger targeted payload release; however, their low stability and unpredictable fate in vivo have led to failure in clinical studies. To overcome these challenges, we reported first-of-its-kind thermoresponsive lipid nanoparticles (TLNs) that undergo solid–liquid phase transition under hyperthermia to release the payload. This study enabled TLNs with on-demand drug delivery functionality to breast cancer cells by incorporating magnetically activated iron oxide nanoparticles (γ-Fe2O3) into a lauric and oleic acid-based phase-changing lipid-matrix to synthesize paclitaxel (PTX)- and γ-Fe2O3-loaded TLNs (P-γ-TLN). Critical independent variables were selected and then optimized using a central composite design to obtain the optimized formulation, P-γ-TLN 12, with a size of ∼183 nm, polydispersity of 0.50, zeta potential of −22 mV, and encapsulation efficiencies of 85% for PTX and 60.49% for γ-Fe2O3. Thermoresponsive delivery was confirmed, with TLNs remaining relatively stable at 37 °C for 72 h, releasing only 34.26% of the drug, whereas exposure to 45 °C resulted in more than a two-fold increase, releasing 79.35% over the same period. Under an external alternating magnetic field, γ-Fe2O3 generated hyperthermia and induced a phase transition in P-γ-TLN, leading to abrupt drug release. Both γ-Fe2O3 and TLNs exhibited high biocompatibility, but TLN encapsulation significantly improved uptake in MCF-7 breast cancer cells. Under AMF, P-γ-TLN showed enhanced PTX release, resulting in more potent cytotoxicity against MCF-7 cells. The combination of high payload capacity, stimuli-responsive release, thermotherapy, and enhanced chemotherapeutic response highlights the substantial potential for TLNs in cancer therapy.
1. Introduction
Breast cancer is the most prevalent malignant tumor, accounting for 23.8% of all cancers affecting women.1 According to Breast Cancer Facts and Figures 2024–2025, an estimated 367![[thin space (1/6-em)]](https://www.rsc.org/images/entities/char_2009.gif) 220 new cases of breast cancer in women and 2790 cases in men will be diagnosed this year in the United States alone.2 There are several chemotherapeutic options for breast cancer; however, paclitaxel (PTX) is considered one of the most successful drugs to date. Clinically effective doses in cancer patients raise serious concerns due to its poor water solubility and associated toxicity. It has very low bioavailability due to poor permeability and solubility, classifying it as a biopharmaceutical classification system (BCS) Class IV drug.3 Chemotherapy and other traditional cancer treatments have not been entirely successful due to a lack of specificity, damaging both cancerous and healthy cells,4 as well as issues related to drug resistance, recurrence, and metastasis.5
220 new cases of breast cancer in women and 2790 cases in men will be diagnosed this year in the United States alone.2 There are several chemotherapeutic options for breast cancer; however, paclitaxel (PTX) is considered one of the most successful drugs to date. Clinically effective doses in cancer patients raise serious concerns due to its poor water solubility and associated toxicity. It has very low bioavailability due to poor permeability and solubility, classifying it as a biopharmaceutical classification system (BCS) Class IV drug.3 Chemotherapy and other traditional cancer treatments have not been entirely successful due to a lack of specificity, damaging both cancerous and healthy cells,4 as well as issues related to drug resistance, recurrence, and metastasis.5
A notable shortcoming of clinically used nanoparticles is the limited spatial and temporal control of drug release. Most rely on passive release, which can result in either rapid drug leakage causing toxicity or slow release leading to reduced efficacy. On-demand release at the target site could revolutionize chemotherapy by minimizing side effects.6 The integration of magnetic hyperthermia treatment (MHT) into nanotechnology-based systems enables magnetically triggered heat generation under an alternating magnetic field.7 Various materials, such as lipids, micelles, polymers, and copolymers, have been employed for their thermoresponsive potential, yielding promising results.8
Similarly, low temperature-sensitive liposomes (LTSLs), such as ThermoDox®, aided by radiofrequency ablation (RFA), have reached clinical development (phase III) for augmenting stimuli-responsive drug availability in the hyperthermic (<40 °C) tumor microenvironment.9 However, liposomes involve complex synthesis methods employing toxic solvents,10 fusion, and drug leakage due to defects within lattice structures during storage.11 Ultimately, the phase III clinical trial of ThermoDox® failed, i.e., it did not increase progression-free survival (PFS) or overall survival (OS) due to long-term formulation instability and lack of supporting preclinical data.12 Therefore, safe, effective, and feasible thermoresponsive nanoparticles for targeted chemotherapy of cancer were used in this research.
Limited intrinsic hyperthermia of cancer or loss of hyperthermia after partial treatment can compromise thermoresponsive function and lead to the development of lipid-based biomimetic magneto-vectors. These hybrids exhibit enhanced hyperthermia upon AMF exposure, ensuring complete payload delivery at the target site. Compared to polymeric systems, lipid-based nanoparticles demonstrate superior magnetothermal responsiveness, a potential that intrigues researchers in the field, with relatively higher drug loading and excellent biocompatibility.13 SLNs have been loaded in thermosetting hydrogels, where SLNs act as a drug reservoir and hydrogels as a thermoresponsive component.14 However, the gels are rather thermosetting, i.e., forming a gel in situ at the normal body temperature rather than modifying drug release. The thermoresponsive lipid nanoparticles (TLN) were prepared from solid and liquid fatty acids for faster drug release upon exposure to hyperthermia, i.e., <39 °C. The TLN undergoes a solid–liquid phase transition under hyperthermia, leading to faster drug release, higher cytotoxicity and uptake by cancer cells, and enhanced penetration across biological barriers.15,16 Later, different research groups have demonstrated the thermoresponsive drug release from lipid nanoparticles under different names.17–21
In this study, we integrated iron oxide nanoparticles (γ-Fe2O3) in TLN to generate hyperthermia by externally applied AMF pulses, offering precise spatiotemporal control over thermoresponsive drug delivery. When loaded into TLN, PTX provided chemotherapy, whereas γ-Fe2O3 produced hyperthermia under AMF to induce drug release. All ingredients were biocompatible and low-cost, and the preparation method was simple and feasible for industrial production.
2. Experimental
2.1 Materials
Lauric acid, oleic acid (OA), Span 80, Tween 80, Cremophor EL, and high-quality ethanol were purchased from Sigma-Aldrich (St Louis, USA). Paclitaxel (PTX) was generously gifted by Consolidated Chemical Laboratories (CCL) Ltd, Pakistan. Milli Q deionized water was used throughout the study. The dialysis bag (molecular weight 3.2 kDa) was purchased from Spectrum Labs (Rancho Dominguez, Canada). Ferrous chloride, ferric chloride, iron nitrate, ammonium hydroxide (33%), and nitric acid were all purchased from Merck, Germany.2.2 Method of preparation and optimization
2.2.2.1 Synthesis of maghemite (γ-Fe2O3). The γ-Fe2O3 nano-vectors, which were synthesized using the Massart method,22 exhibit unique properties such as high magnetization and biocompatibility, making them promising candidates for various applications in materials science and nanotechnology. Briefly, iron(II) chloride and iron(III) chloride were co-precipitated in an alkaline aqueous media at room temperature. To begin the synthesis, a molar ratio of 2
:1 for Fe3+:Fe2+ containing 0.04 M (5.40 g mol−1) of iron chloride hexahydrate (FeCl3·6H2O) and 0.02 M (1.9854 g mol−1) of iron chloride tetrahydrate (FeCl2·4H2O) were prepared in 25 mL of de-ionized water. The two solutions were mixed and slowly added dropwise into 250 mL of de-ionized water under magnetic stirring. After 30 minutes of stirring, a 32% ammonia solution was gradually added at a rate of approximately 10–12 drops per minute. This addition was continued until the pH of the solution reached 10, resulting in the formation of brown precipitates. The solution was then stirred for an additional hour before allowing the precipitates to settle. The product of this co-precipitation was then washed several times and dried using the oven at 80 °C to obtain a powder of magnetite (Fe3O4) nanocrystals. The oxidation of Fe3O4 was carried out initially with nitric acid and then with Fe3(NO3)3 to convert Fe3O4 into stable γ-Fe2O3 nanoparticles.23
2.2.2.2 Synthesis of TLN. TLN was synthesized using a modified emulsification method.16 First, 18 mg of the OA was mixed with the PTX or/and γ-Fe2O3 (5–10 mg) in an acetonitrile solution and sonicated at 50 °C for complete dissolution and evaporation of organic solvent. This process yields coated inorganic nanoparticles that enhance hydrophobicity and colloidal stability.24 82 mg of lauric acid was then added and heated at 10 °C above the melting point to get a melted lipid mixture. Span 80 and Cremophor EL were added to the melted oil phase to enhance the homogenization and miscibility of the hydrophobic entities. The aqueous phase (2.3–5.6% of Tween 80), heated to the temperature of the oily phase, was added slowly and stirred until the microemulsion settled to room temperature. The final emulsion mixture was then centrifuged and pelletized. The obtained pellets were then redispersed in deionized water to obtain PTX-loaded TLN (P-TLN), γ-Fe2O3-loaded TLN (γ-TLN), and PTX and γ-Fe2O3 co-loaded TLN (P-γ-TLN).25
| Coding | A (mg) | B (mg) | C (rpm) | Y1 (nm) | Y2 (—) | Y3 (mV) | Y4 (%) | Y5 (%) |
|---|---|---|---|---|---|---|---|---|
| a A: surfactant/co-surfactant, B: γ-Fe2O3, and C: stirring speed; Y1: particle Size, Y2: PDI, Y3: zeta potential, Y4: EE of PTX, and Y5: EE of γ-Fe2O3. | ||||||||
| P-γ-TLN 1 | 200 | 7.5 | 900 | 255.8 | 0.58 | −17.1 | 55.5 | 55.44 |
| P-γ-TLN 2 | 284.1 | 7.5 | 900 | 197.7 | 0.57 | −27.1 | 71 | 63.23 |
| P-γ-TLN 3 | 250 | 10 | 700 | 318.3 | 0.50 | −22.5 | 41.9 | 62.88 |
| P-γ-TLN 4 | 200 | 7.5 | 1236 | 305.5 | 0.64 | −20.9 | 68.5 | 60.27 |
| P-γ-TLN 5 | 200 | 7.5 | 900 | 260.1 | 0.53 | −19.9 | 57.3 | 55.34 |
| P-γ-TLN 6 | 200 | 7.5 | 563 | 201.2 | 0.39 | −16.8 | 47.2 | 47.44 |
| P-γ-TLN 7 | 150 | 10 | 700 | 477.3 | 0.62 | −16.6 | 33.5 | 56.55 |
| P-γ-TLN 8 | 150 | 5 | 1100 | 291.9 | 0.76 | −15.6 | 60.11 | 41.78 |
| P-γ-TLN 9 | 200 | 7.5 | 900 | 259.6 | 0.56 | −19.8 | 56.7 | 58.38 |
| P-γ-TLN 10 | 250 | 10 | 1100 | 296.6 | 0.52 | −25.3 | 61.76 | 68.34 |
| P-γ-TLN 11 | 200 | 7.5 | 900 | 253.3 | 0.41 | −17 | 52.5 | 55.39 |
| P-γ-TLN 12 | 250 | 5 | 1100 | 183.1 | 0.51 | −21.8 | 85.37 | 60.49 |
| P-γ-TLN 13 | 150 | 5 | 700 | 329.5 | 0.42 | −15 | 42.5 | 31.68 |
| P-γ-TLN 14 | 200 | 7.5 | 900 | 261.3 | 0.59 | −17.7 | 53.9 | 55.48 |
| P-γ-TLN 15 | 150 | 10 | 1100 | 349.6 | 0.83 | −16.6 | 38.27 | 61.11 |
| P-γ-TLN 16 | 115.9 | 7.5 | 900 | 342.5 | 0.63 | −14.8 | 40.1 | 46.75 |
| P-γ-TLN 17 | 200 | 7.5 | 900 | 333.3 | 0.58 | −17.4 | 54.5 | 63.11 |
| P-γ-TLN 18 | 200 | 3.3 | 900 | 159.8 | 0.44 | −16.7 | 72.5 | 42.11 |
| P-γ-TLN 19 | 200 | 11.7 | 900 | 337.1 | 0.44 | −21 | 44.5 | 63.34 |
| P-γ-TLN 20 | 250 | 5 | 700 | 191.3 | 0.43 | −21.1 | 67.5 | 57.22 |
This model, designed with axial points twice the number of factors, surfactant/co-surfactant (248.09 and 115.91), γ-Fe2O3 amount (3.29 and 11.70), and stirring speed (563.64 and 1236.36), was executed with utmost precision. The number of batches for this design was calculated using:
| N = 2k + 2k + nC, | (1) |
2.3 Characterizations
:100 with de-ionized water and vortexed continuously until transparent. Photon correlation spectroscopy was employed using Zetasizer (Nano ZS, Malvern, Instruments, England) to evaluate the particle size (PS), zeta potential (ZP), and polydispersity index (PDI).28
:10) were mounted on a copper grid and placed in a desiccator overnight for drying prior to imaging.29
2.3.3.1 Encapsulation of PTX. The encapsulation and loading efficiency (EE) of PTX in P-TLN and P-γ-TLN were determined using a modified protocol for high-pressure liquid chromatography (HPLC).30 A combination of acetonitrile and water in a 70
:30 ratio was utilized as a mobile phase along with 0.03% trifluoroacetic acid to run through the reversed phased column (C-18, 4.66 mm × 250 mm, 5 μm) at 1 mL min−1. The mobile phase pH was adjusted to 5.0 using glacial acetic acid, degassed for 60 min, and filtered using a 0.22 μm nylon syringe filter. PTX was quantified by direct and indirect methods by measuring the absorbance at 227 nm using a calibration curve (0.025 to 2 μg mL−1). The chromatographic data obtained was processed using Lab Solutions software, and EE was calculated according to eqn (2).| EE (%) = (amount (μg) of PTX in PTX loaded TLN)/(initial amount of PTX added) ×100 | (2) |
2.3.3.2 Encapsulation of γ-Fe2O3. The unentrapped γ-Fe2O3 in the colloidal dispersion was removed by gradient centrifugation to separate and could serve as a viable alternative to size exclusion chromatography (SEC) separations. Centrifugation (1000 rpm for 2 min) was carried out on P-γ-TLN to remove any excess of γ-Fe2O3, possibly not embedded in the lipid matrix,31 whereas entrapped γ-Fe2O3 was obtained by centrifugation (20
000 rpm for 15 min) until the supernatant is free from iron content. In an effort to achieve the highest purification of P-γ-TLN, SEC was employed to separate γ-Fe2O3. The preparations were poured onto a pretreated (soaked in PBS for 12 h at 30 °C, followed by 10 min centrifugation at 1000g) Sephadex G50 mini gel column. The separated P-γ-TLN were collected by a Retriever 500 fraction collector tube.32 To avoid the possibility of aggregated γ-Fe2O3 with larger size being co-eluted with the P-γ-TLN during the SEC procedure, the free γ-Fe2O3 were treated by the same procedure used for P-γ-TLN preparation without adding lipids and analyzed by SEC.
The iron content in purified P-γ-TLN was determined using a 55AA flame atomic absorption spectrophotometer (Agilent Technologies Inc., Santa Clara, CA) at 248.3 nm. Samples of P-γ-TLN were digested (1 mL suspension in a 5 mL acidic solution) in 6 M HCl overnight and subsequently diluted to the final concentration using 1% hydrochloric acid.33 Standard solutions of γ-Fe2O3 were run in the 0.01–0.1 μg mL−1 range to establish a calibration curve after digesting them with concentrated HCl solution.
The determination of solid-state properties (crystalline or amorphous), physical compatibility, thermal change, and phase transitions were conducted using differential scanning calorimetry (DSC). The effect of the incorporation of PTX/γ-Fe2O3 on the melting and crystallization temperatures of the formulated P-γ-TLN, transition temperature (Tm), and thermal endurance/stability were also recorded. Indium was used as a control with a heating rate of 10 °C min−1 for PTX and γ-Fe2O3, whereas 1 °C min−1 for lipid mixtures/TLN, variable temperature range of 25–350 °C, and nitrogen purge of 50 cm3 min−1.35
The XRD patterns of PTX, γ-Fe2O3, and P-γ-TLN were determined using Bruker D8-Advance diffractometer. All samples were analyzed in the 20–80° 2θ range at a scan rate of 2° min−1.36
The heating efficiency of the polydisperse magnetic materials was determined with a comprehensive approach, calculating the specific loss power (SLP) given by SLP = A × f, where the area of the hysteresis loop is denoted by A and frequency by f. The value of SAR was calculated, determining the energy dissipation rate to the medium for the colloidal dispersion from the unit mass of solid magnetic material, leaving no room for doubt about the validity of the conclusions.
The magnetic heating efficiency of γ-Fe2O3 and γ-TLN was evaluated using nanoTherics Magnetherm NAN201003 (NanoTherics Ltd, UK) at various frequencies and magnetic field strengths: 163.8 kHz (B = 16.4 mT and 17 induction coil turns), 327.3 kHz (B = 17.1 mT and 17 induction coil turn), and 518.7 kHz (B = 23.9 mT and 09 induction coil turn). Chilled water was circulated to maintain the temperature of the field coils. The temperature was recorded for a certain time interval by a non-metallic fiber optic temperature sensor to avoid Eddy currents.37 An amount of 1 mL of the Cremophor EL-based aqueous solutions (5 to 20 mg mL−1) of γ-Fe2O3 and γ-TLN were taken in an Eppendorf tube with a hole in the cap to submerge the temperature probe. Samples were placed in a thermally insulated polystyrene holder to ensure adiabatic conditions. The time-dependent temperature rise (ΔT) was measured for 400 s, while the heating efficiency (SLP) was calculated by utilizing the initial readings from the time–temperature rise curves using the following relation:
| SLP = (Csamp × ρsamp)/mFeΔT/Δt | (3) |
| ILP = SLP/(Ho2f) | (4) |
| Drug release (%) = (drug release concentration)/(drug loading concentration) × 100 | (5) |
To determine the magnetically triggered drug release at a field frequency of 518.7 kHz (B = 23.8915 mT and 09 induction coil turn), specific quantities of γ-Fe2O3 equivalent P-γ-TLN and P-TLN were exposed to a pulsative (ON and OFF) AMF for 10 min at pH 7.4. Briefly, 900 μL of the samples were poured into a dialysis bag of 3.2 kDa pore size, sealed tightly from both ends and then gently placed in a Falcon tube containing 50 mL of phosphate buffer. This assembly was then immersed in a water bath pre-set at 37 °C. After defined time intervals, the upper part of the tube containing submerged cellophane was exposed to an AMF-producing coil.40 AMF pulses were applied to the P-γ-TLN and P-TLN to only increase in temperature up to 43 °C, a temperature that corresponds to the transition temperature of the TLN matrix coat. Samples were taken at variable intervals every 10 minutes upon exposure to AMF, i.e., one before and one after the application, whereas OFF cycles were analyzed every 50 min. The drug release behavior was monitored by measuring the absorption of the drug using a UV-visible spectrophotometer.
2.3.8.1 In vitro cytotoxicity. The dimethyl thiazolyl diphenyl tetrazolium (MTT) colorimetric assay was conducted to evaluate the cytotoxic activity of the free PTX, γ-Fe2O3, Cremophor EL, blank TLN, P-TLN, and P-γ-TLN against cancerous (MCF-7) cells. The cells were incubated with the different formulations under study for 48 h. After incubation, the cells were washed with PBS buffer and 100 μL of fresh complete medium containing MTT (10%, 5 mg mL−1) and subsequently incubated for another 4 h. Finally, MTT was removed, and DMSO was added to dissolve MTT crystals for another 10 min at 37 °C. Cells treated with PBS were considered as negative control, whereas the ones treated with Triton X 100 were positive control. The absorbance of the free MTT was calculated after measuring absorbance on the microplate reader (BioTek-ELx800, USA).43 The cell viability percentage was calculated based on eqn (6).
| Cell viability (%) = (absorbance of treated cells)/(absorbance of control cells) × 100% | (6) |
2.3.8.2 In vitro chemo-magnetic hyperthermic cytotoxicity. Cytotoxicity analysis of γ-Fe2O3, γ-TLN, and P-γ-TLN with or without AMF treatment, was carried out at a concentration of 500 μg mL−1. For the AMF-triggered chemo-hyperthermia therapy, the cells were incubated with plain and lipid-embedded γ-Fe2O3 and were exposed to AMF of 518.7 kHz (B = 23.9 mT and 09 induction coil turns) for 10 min. The cell viability was assessed using the MTT assay after the required incubation time with 100 μL MTT solution as described previously.44
2.3.8.3 In vitro cell uptake imaging. A qualitative cellular uptake study was conducted with MCF-7 (1 × 10⁵ cells), seeded and kept for adherence overnight. The culture medium was decanted and washed with 200 μL of PBS to remove the serum of the culture medium to avoid any interference in the cellular uptake of the dye or nanoparticles. The cultured cells were then treated with a 50 μM concentration of 100 μL of rhodamine-B or an equivalent concentration of rhodamine-B-NPs and incubated for 45 min at 37 °C in a 5% CO2 incubator. At the end of the incubation, the cells were washed thrice with 200 μL PBS to remove the adsorbed dye or nanoparticles. The cells were stained with DAPI (4′,6-diamidino-2-phenylindole-1 μg mL−1) for 10 min, washed three times with PBS and then visualized under a fluorescence microscope (Nikon Eclipse 2 Ti2 with light emitting diode lamp-pE-300 light series, CoolLED), focusing light on the sample using a 40×, 0.35 NA objective lens (SLMPLN, Olympus). Images were acquired with a metal oxide semiconductor camera (sCMOS) (OrcaFlash4.0, Hamamatsu), and a standard series DAPI filter cube and GLP filter cube from Nikon were employed.45
3. Results and discussions
3.1 Method of preparation and optimization
Our study stabilized the drug delivery system with two non-ionic surfactants: relatively minor sorbitan mono-oleate (Span 80) and larger polyoxyethylene sorbitan mono-oleate (Tween 80). Tween 80 is an aqueous, non-ionic surfactant with an HLB value of 15, whereas Span 80 is a hydrophobic surfactant with an HLB value of 4.3. A combination of non-ionic surfactants, Tween 80 and Span 80, were used to form a compact surfactant coating and prevent particle coalescence. The long-chain alkyl groups in both emulsifiers prevented polymorphic transitions, thus resulting in more stable TLN formation.49 Furthermore, they are more biocompatible than cationic, anionic, or amphoteric counterparts.50
A modified emulsification method produced four formulations (TLN, P-TLN, γ-TLN, and P-γ-TLN). TLN and P-TLN appeared as milky white homogenous emulsions, while γ-TLN and P-γ-TLN appeared as milky orange emulsions due to the iron oxide contents.
Interrelation between several variables was assessed using polynomial equations.
| Particle size = +280.24 − 51.44A + 54.49B − 1.45C | (7) |
| Polydispersity = +0.5496 − 0.0581A + 0.0269B + 0.0793C | (8) |
| Zeta potential = +19.03 + 3.84A + 1.08B + 0.8051C | (9) |
| EE of PTX = +55.26 + 9.82A − 9.31B + 7.02C − 2.30AB + 1.92AC − 1.36BC | (10) |
| EE of γ-Fe2O3 = +55.32 + 6.26A + 6.84B + 3.29C − 3.84AB − 0.7413AC − 0.4187BC | (11) |
Positive and negative signs before a variable in a polynomial equation determine the synergistic and antagonistic effects, respectively.52 Equally important, the magnitude of the response is defined by the coefficients of the independent variables. Understanding these coefficients is a key aspect of interpreting polynomial equations. The interconnection of independent vs. dependent variables was further elucidated by 3D surface and 2D contour plots. Sensitivity and insensitivity towards the response variable were well illustrated by the steepness and flatness of the curve, respectively.53
The experimental runs yielded particle sizes ranging from 159.8 to 477.3 nm (Table 1). The ANOVA results revealed both significant and insignificant effects, with the stirring speed showing a significant effect in a sequence of C > 0.05 and B > A (0.0002 < 0.0004), respectively (Table S2†). Fig. 1-1A demonstrates a linear increase in particle size with the rise in γ-Fe2O3 amount, while the surfactant/co-surfactant had a significant decreasing effect, and stirring had an insignificant effect (0.9018). The polynomial equation for particle size showed a strong positive correlation between the γ-Fe2O3 amount and the nanoparticle size.54 This effect, depicted in Fig. 1-1A, could be explained in terms of the lipid-to-aqueous ratio, a crucial factor for the nanoparticle size produced by lipid dispersion. The size of the nanoparticles decreased by decreasing the amount of solid lipid due to the change in the system's viscosity. A less viscous lipid mixture will bear more homogenization, and strong shear will result in smaller nanoparticles. At the same time, a more viscous system will resist the movement of fluid55 and will not break down into smaller particles, which is valid for the increased amount of lipid/drug/γ-Fe2O3. The surfactant/co-surfactant amount and stirring had an inverse relationship, i.e., a decreasing particle size when increasing both (Fig. 1-1C). A system with higher viscosity produces bigger-sized particles; the addition of surfactant reduces the interfacial tension more effectively, thereby reducing particle sizes.56 Likewise, stirring produces the desired shear to break the matrix to fine rearrangement, making small-sized nanoparticles, but the coefficient (−1.45) represents a very meagre synergistic effect (Fig. 1-1B and 1C).
 | ||
| Fig. 1 3D graphical interpretation of the interaction factors (A) AB, (B) BC, and (C) AC at the mid-level of C, A, and B, respectively, for particle size (1A–C), polydispersity (2A–C), zeta potential (3A–C), entrapment efficiency of PTX (4A–C), and entrapment efficiency of γ-Fe2O3 (5A–C). | ||
The variability in polydispersity with different alterations in variable quantity depicted a linear decrease in increasing the surfactant/co-surfactant and stirring speed (Fig. 1-2C). The amount of payload increased the polydispersity from 0.426 (5 mg) to 0.838 (10 mg) for formulations P-γ-TLN 13 and P-γ-TLN 15, respectively. ANOVA depicted a maximal response by stirring, whereas the payload had an insignificant response (C > A > B). At a higher level of surfactant/co-surfactant concentration, the surfaces of the TLN were covered effectively, which prevented them from aggregating and resulting in a small polydispersity index.57 Surfactants lessen the contact angle between the lipid matrix and the aqueous phase, causing less particle aggregation.58Fig. 1-2A depicts the higher concentration of γ-Fe2O3 caused by unentrapped particles in the suspension, resulting in increased chances of agglomerations.59
The zeta potential results were subjected to ANOVA, a powerful tool that depicted the significant role of all independent variables in a sequence of A > B > C with P-values in the increasing order of <0.0001 < 0.0073 < 0.0359, respectively. This statistical analysis provided a comprehensive understanding of the impact of each variable on the zeta potential. Anionic carboxylate headgroups in lauric acid render an overall negative charge,60 which is presented on the nanoparticle's surface. A zeta potential of around 30 mV is an important determinant, predicting the stability of colloidal formulations,61 preferentially by steric stabilization and electrostatic repulsion. All formulations had a negative charge even though the particles were stabilized using two non-ionic surfactants, Tween 80 and Span 80. This negative charge was attributed to the solid lipid and preferential adsorption of OH− ions from water by lipid particles. The surface of the nanoparticles was stabilized by the non-ionic emulsifiers, but they had an overall negative charge. This charge was attributed to the negatively charged fatty acid chains of the solid lipid and OH− ions adsorbed by the lipid matrix from the water molecules. Additionally, the polyoxyethylene (POE) dense tails extending to the lipid matrix provided steric hindrance and colloidal integrity.56 The non-ionic surfactant decreased the zeta potential due to the shielding of endogenous negative charge of the lipid matrix.62
The ANOVA analysis depicted that EE of PTX/γ-Fe2O3 was remarkably changed (P < 0.05) with the alteration in all the individual independent variables (<0.0001). This means that the efficiency of PTX/γ-Fe2O3 is significantly affected by changes in the independent variables. In contrast, combination factors had only a significant effect on AB, whilst others had an insignificant role in altering the surface potential (AC and BC). Surfactant/co-surfactant and amount of PTX/γ-Fe2O3 increased the drug loading/entrapment efficiency and stabilized the system (Fig. 1-4A–C and 5A–C). The increased initial payload made more lipophilic drugs available to the lipid matrix, increasing the partitioning and drug entrapment.63 Surfactant/co-surfactant also decreased the matrix's crystallinity and improved the payload's solubilization to improve entrapment. Similarly, hydrophilic oxyethylene groups in Tween 80 furnished steric hindrance to prevent coalescence and aggregation of nanoparticles. The role of Span 80 was to anchor lipophilic entities like PTX and γ-Fe2O3 in the lipid matrix to prevent their leakage and diffusion into the aqueous phase.64 The point-prediction function was used to select an optimized formulation based on employing different sets of goals (minimize particle size, minimize polydispersity, maximize zeta potential, maximize payloads) for all the responses with the desirability of 0.793. The selected formulation (P-γ-TLN 12) had 250 mg surfactant/co-surfactant (A), 5 mg γ-Fe2O3 (B), and 1068 stirring speed (C). The experimental optimized batch with the projected independent variables was developed and re-characterized for the response variables. The projected responses (particle size-173.08 nm, polydispersity-0.531, zeta potential-22.12, EE of PTX-85.37%, and EE of γ-Fe2O3-61.08%) and the obtained result (particle size-183.1 nm, polydispersity-0.507, zeta potential-21.8, EE of PTX-85.37%, and EE of γ-Fe2O3-60.49) were in a reasonable agreement, representing the optimized formulation's saneness.
3.2 Characterizations
 | ||
| Fig. 2 Morphological analysis of γ-Fe2O3 (A)–(C) and P-γ-TLN (E)–(G) at various resolutions. Size distribution analysis using ImageJ for γ-Fe2O3 (D) and P-γ-TLN (H). | ||
3.2.3.1 Encapsulation of PTX. The quantitative detection of PTX in P-γ-TLN was carried out on HPLC equipped with a UV detector. PTX was eluted by employing ACN and aqueous 0.03% TFA mixtures at a pH of 5 without a buffer system and a short retention time of 4.55 min. The main advantage of this method was the column safety and short-time analysis. The linearity of the method was established by running standard solutions at five different concentrations from 4.74 to 62.86 μg mL−1, demonstrating the precision of our approach. The accuracy was ensured using a recovery test by direct and indirect methods fortifying with the PTX standard at three levels, confirming there is no possible overlap. The amount of drug used to prepare TLN was 5 mg, and the mean entrapment values for both methods for P-γ-TLN 12 were 85.37 + 3.44 and 84.89 + 3.55, respectively.
3.2.3.2 Encapsulation of γ-Fe2O3. In P-γ-TLN, a fatty acid-based solid lipid formed a solid-phase matrix with an inner core containing γ-Fe2O3. The incorporation of γ-Fe2O3 depends on the number of particles that can be accommodated.70 For this reason, gradient centrifugation in conjunction with atomic absorption spectroscopy (AAS) was used to determine the unentrapped and entrapped iron content. The entrapment for all the batches was between 31.68% and 68.34%, with the optimized batch P-γ-TLN 12 having EE of up to 60.49%. This unentrapped iron content was also separated, with no significant difference between either of the techniques. These findings demonstrated the capability of TLN to not only load small molecular drugs with high efficiency but also achieve remarkable entrapment of colloidal entities, such as γ-Fe2O3. The EE of P-γ-TLN and PTX is sufficient for cancer treatment, instilling confidence for further testing.
![[double bond, length as m-dash]](https://www.rsc.org/images/entities/char_e001.gif) O stretch was illustrated as an intense peak at 1708 cm−1 (ref. 72) while two other sharp bands appeared at 2853 and 2922 cm−1 due to the symmetric CH2 stretch and the asymmetric CH2 stretch, respectively. The C–O stretch, O–H in-plane and out-of-plane bands appeared at 1285, 1465, and 937 cm−1, respectively.73 The detected peaks in paclitaxel at wavenumbers 1733, 1645, 1242, 1072, and 704 cm−1 were attributed to the functional groups of CO, C–C, C–N, C–O, and CC, respectively, in the paclitaxel structure.74 The absorbance bands of C–H in the benzene ring of paclitaxel were observed at 770 and 709 cm−1.75 The characteristic peaks of Tween-80 at 2916, 2848, and 1701 cm−1 were due to the stretching vibrations of C–H in –CH2–, C–H, –CH3, and CO in the ester group, respectively.76 Sorbitan and polyethylene glycol constitute the hydrophilic polar center. At the same time, fatty alcohols, esters, and fatty acids account for their major lipophilic groups in the form of long non-polar hydrocarbon chains in Span 80. The characteristic peaks at 3390 cm−1 were attributed to the stretching vibration of the O–H group in alcohols. The peaks at 2916 and 2849 cm−1 were attributed to the significant C–H vibration in the co-surfactant, contributing to the compound's vibrational characteristics. The peaks in 1734 and 1457 cm−1 were attributed to the CO stretching vibration and C–H scissoring vibration, respectively.77 The detected peaks in Cremophor EL at wavenumbers 2926, 2857, 1734, 1653, 1457, and 1097 cm−1 were due to the functional group's CH(CH3) asymmetric stretch, CH(–CH2–) asymmetric stretch, CO ester stretching, CC cis stretching, –CH2 scissoring, and C–O stretching, respectively.78 The absorption peaks at 542 and 628 cm−1 identified the vibration of γ-Fe–O.79
O stretch was illustrated as an intense peak at 1708 cm−1 (ref. 72) while two other sharp bands appeared at 2853 and 2922 cm−1 due to the symmetric CH2 stretch and the asymmetric CH2 stretch, respectively. The C–O stretch, O–H in-plane and out-of-plane bands appeared at 1285, 1465, and 937 cm−1, respectively.73 The detected peaks in paclitaxel at wavenumbers 1733, 1645, 1242, 1072, and 704 cm−1 were attributed to the functional groups of CO, C–C, C–N, C–O, and CC, respectively, in the paclitaxel structure.74 The absorbance bands of C–H in the benzene ring of paclitaxel were observed at 770 and 709 cm−1.75 The characteristic peaks of Tween-80 at 2916, 2848, and 1701 cm−1 were due to the stretching vibrations of C–H in –CH2–, C–H, –CH3, and CO in the ester group, respectively.76 Sorbitan and polyethylene glycol constitute the hydrophilic polar center. At the same time, fatty alcohols, esters, and fatty acids account for their major lipophilic groups in the form of long non-polar hydrocarbon chains in Span 80. The characteristic peaks at 3390 cm−1 were attributed to the stretching vibration of the O–H group in alcohols. The peaks at 2916 and 2849 cm−1 were attributed to the significant C–H vibration in the co-surfactant, contributing to the compound's vibrational characteristics. The peaks in 1734 and 1457 cm−1 were attributed to the CO stretching vibration and C–H scissoring vibration, respectively.77 The detected peaks in Cremophor EL at wavenumbers 2926, 2857, 1734, 1653, 1457, and 1097 cm−1 were due to the functional group's CH(CH3) asymmetric stretch, CH(–CH2–) asymmetric stretch, CO ester stretching, CC cis stretching, –CH2 scissoring, and C–O stretching, respectively.78 The absorption peaks at 542 and 628 cm−1 identified the vibration of γ-Fe–O.79
 | ||
| Fig. 3 FTIR analysis of all individual components and TLN loaded with PTX and γ-Fe2O3 (A). Melting point profile of lauric acid and loaded nanocarriers (B) and XRD pattern identifying the significant 2θ values of PTX, γ-Fe2O3, and P-γ-TLN (C). | ||
In the oleic acid-coated γ-Fe2O3, the CO stretch, symmetric and asymmetric CH2 stretch appeared at 1708, 2853, and 2922 cm−1, respectively. The band at 1283 cm−1 slightly shifted the C–O stretch to a low frequency. The characteristic bands of the surfactant molecules slightly shifted to the lower frequency regions, indicating the hydrophobic regions of the monolayer were packed tightly in a crystalline state around the nanoparticle surface.72 A distinguished carboxylate (COO) stretch at 1461 cm−1 is a confirmation of OA chemisorption on the surface of the nanoparticles via its oxygen.71,80
The stretching vibrations of C–H were retained in lauric acid, OA, Tween-80, Span-80, and Cremophor EL at ∼2920 and ∼2850 cm−1. The optimized batch also showed the CO stretching vibration for Span-80 and Cremophor EL. The characteristic γ-Fe–O vibration and symmetric carboxylate (COO) stretch were present in the final formulation at 628 and 1461 cm−1, respectively. The suppression of the characteristic peaks of PTX at 1645 and 770 cm−1, indicating its effective loading into the lipid vehicle, is a novel finding. The slight changes in the peaks of PTX at wavenumbers 1733, 1242, 1072, and 709 cm−1 to 1734, 1249, 1076, and 720 cm−1 for the CO, C–N, C–O, and CC, respectively, are indicative of its nano transformation.81 The characteristic peaks of individual components, lipid, PTX, and γ-Fe2O3, were retained in P-γ-TLN, inferring that no new bonds were generated. Moreover, there was no prominent peak displacement/shift, confirming that only physical interaction occurred.82
The melting and enthalpy data of lauric acid, TLN, γ-Fe2O3, and P-γ-TLN, obtained through DSC, are summarized in Table S3.† The sharp endothermic peak at 48.1 °C and the high enthalpy of around 72.4 J g−1 were observed due to the crystallinity of lauric acid. The comparison of thermograms of lauric acid and TLN and the subsequent understanding of the decreased melting point of TLN due to the addition of liquid lipids (Fig. 3B)83 is a unique observation. The nanocarrier P-TLN demonstrates a decrease in enthalpy and melting, which adds to the novelty of our findings.
The results indicated a nanoparticulate transformation, resulting in reduced crystallinity and an imperfect crystal structure compared to primary lipids. The surfactant was found to be a significant factor in this phase transformation, leading to an increased surface-to-volume ratio in smaller particulates. Furthermore, the liquid lipid was observed to distort the crystal structure, weakening crosslinking and thereby reducing the overall melting point.84 The disorder in the lipid's crystal structure was calculated using the difference between the melting (Tm) and the onset of melting temperatures (To):
| Disorder of lipid crystallinity = Tm − To | (12) |
The Tm − To values serve as a crucial indicator of the disorder in the crystal structure of the lipid matrix. The higher the difference, the more pronounced the disorder. For instance, the solid lipid, lauric acid, exhibited a difference of 2.68, while P-γ-TLN, with a high value of 16.29, depicted a significant level of disturbance. A distinct single melting endotherm emerged at 234.09 °C just before degradation, with an enthalpy of 505.16 J g−1.
The thermogram of γ-Fe2O3 underwent an enthalpy change of 1129.7 J g−1 and a total weight loss of 15.99% in two stages upon heating the powder sample to 800 °C. The first small drop at ∼50–100 °C is attributed to the physisorbed water. The weight loss of 9.11% at temperatures ranging from 189.4 °C to about 281.7 °C is due to multi-layers of water of hydration from the surface of the nanoparticles.85 An endothermic peak at 275.9 °C corresponds to the transformation of Fe3O4 into γ-Fe2O3 (Fig. S5†).86
The addition of payloads significantly influenced the overall enthalpy and melting behavior of the lipid matrix. Notably, the introduction of PTX at approximately 5 mg resulted in negligible alterations in the lipid matrix's pretransition and main phase transitions, with the exception of a broadening pretransition with increasing amounts (Fig. 3B).87 Conversely, the inclusion of γ-Fe2O3 above 10 mg led to a substantial shift and broadening in the phase transition to 52.96 °C and enthalpy of 306.58 J g−1 due to the rigidity, phase transformation, and stabilization of the lipid layers by the encapsulated γ-Fe2O3,88 necessitating the selection of payloads below this threshold. These findings shed new light on the effects of different payloads on lipid matrix properties.
The peaks were identified using ICSD 00-002-1047 for iron oxide (Fe2O3) nanoparticles, providing a clear and reliable method for differentiation. Additional peaks appearing in γ-Fe2O3 at 24.25° and 25.52°, which were absent in Fe3O4 nanoparticles, served as a clear and distinguishable feature between the two forms (Fig. 3C).89 PTX exhibited three sharp peaks at the diffraction angles of 10.02, 12.33, 15.58, 18.63, 21.94, 25.15, and 29.87°, indicating a crystalline structure.73 The XRD patterns of P-γ-TLN clearly revealed the presence of lauric acid with peaks at 20.43, 21.16, 25.17,90 and 40.34,91 while the manifestations attributed to PTX were absent, suggesting its integration within the lipid matrix.92 The absence of payload peaks confirmed the amorphous phase transformation, which enhances solubility, surface area, bioavailability, and dissolution rate, providing a clear understanding of the lipid matrix properties.93
Fig. 4b illustrates the low-field regions of the M(H) loops. The loops of γ-Fe2O3 and γ-TLN were shifted along the field axis, manifesting an exchange bias (Hex) of 43 Ôe and 36 Ôe for γ-Fe2O3 and γ-TLN, respectively. This bias could be attributed to the disordered surface spin as in the already reported chemically synthesized nanoparticles.95 Moreover, the disordered surface moments can produce a spin-glass-like state that is effective in pinning the ferromagnetic core96 thus producing exchange bias. These findings have significant implications for our understanding of exchange bias in magnetic materials.
 | ||
| Fig. 4 Room temperature magnetization hysteresis loops of γ-Fe2O3 and γ-TLN samples (a), the enlarged low-field portion of the M(H) loops (b), field-cooled thermal demagnetization measurements of γ-Fe2O3 nanoparticles in a measuring field of 100 Ôe (c), dM/dT as a function of temperature to calculate the Curie temperature (d). Time-dependent heating curves of γ-Fe2O3 fluid samples in a measuring field of (e) f = 164 kHz and Ho = 16.4 mT, (f) f = 327 kHz and Ho = 17.09 mT, (g) f = 519 kHz and Ho = 23.90 mT, and (h) 5 mg γ-Fe2O3 encapsulated TLN lyophilized samples measured at different fields and frequencies. | ||
Zero field-cooled (ZFC) thermal-demagnetization measurements were carried out at 300–800 K in a 100 Ôe static field (Fig. 4c). The Tc, a crucial parameter, has been depicted as the point of minimum change in dM/dT against the T curve (Fig. 4d). The results show that the Tc of γ-Fe2O3 nanoparticles is 644 K, significantly above the therapeutic range required for self-controlled magnetic hyperthermia. This key finding is of utmost importance as it demonstrates the potential of these nanoparticles for therapeutic applications. Encapsulation in a biocompatible agent further improved the Tc, bringing it to the required range without significant magnetization loss.
The obtained results for heating measurements carried out on fluid samples of γ-Fe2O3 and γ-TLN in an AC magnetic field of different fields and frequencies are shown in Fig. 4e–h. These graphs illustrated a stable and consistent increase in the temperature over the course of applying a magnetic field for 250 s. This stability in the temperature increase provides reassurance about the reliability of the results. Lipid encapsulated γ-TLN also produced reasonable results at low doses and field exposure time. The rate of increase in temperature was suggestive of an immense SLP value. The SLP represents the magnetothermal behavior of nanoparticles and is estimated by calculating the initial heating rates (dT/dt) (t = 0) and applying the equation for the fluid sample:97
| SLP = Cwater(dT/dt)(t=0)Vsample/m(magn.) | (13) |
C water is the specific heat capacity of the fluid sample (assumed to be equal to that of pure water 4185 J per kg per K), Vsample is the sample volume, and m(magn.) is the fraction of the magnetically active elements in the sample. Fig. S6a and b† show that the SLP values of 356 W g−1 were obtained at 518.7 kHz and 23.9 mT, which increased linearly with increasing concentration and strength of the applied magnetic field Ho. Contrastingly, encapsulated γ-TLN fluid samples manifested a higher magnetothermal response at lower fields and frequencies, i.e., an extreme dependence on applied field amplitude and frequencies.
The AMF produces eddy currents in biological tissues, which can also cause harm to the surrounding healthy tissues measured in terms of the Brezovich criterion. The calculated values for two out of the three frequencies (13051.12 A m−1 × 163800 s−1 = 2.14 × 10⁹ A m−1 s−1, 13608.18 A m−1 × 1327300 s−1 = 4.45 × 10⁹ A m−1 s−1) used in the study correspond to the criterion i.e., 4.85 × 10⁸ A m−1 s−1, while one falls out (19 019.62 A m−1 × 518700 s−1 = 9.87 × 10⁹ A m−1 s−1). Some studies suggest the limit to be less rigid and time-bound,98,99 which means that contrary to more than one hour of exposure, 10 minutes pulses would be a safe alternative. However, for the in vivo experimentation, the recommendation for the criterion must be followed to meet the safety standards even for the pulsed treatment.
For perfect sink compliance, a concentration and dilution volume at twenty times dilution was selected, with 500 μg mL−1 (1 mL) and 100 mL, respectively. This precision ensures that the solubility of the system remains well below the saturation solubility (6.49%) of the twenty times dilution, i.e., 77.0 μg mL−1, maintaining perfect sink conditions. The temperature-dependent PTX release was observed at different simulated temperatures, including 37 °C (body temperature), 41 °C (tumor microenvironment), and 45 °C (magnetic hyperthermia). These results were compared with that of the PTX solution in the Cremophor EL ethanol blend, which showed a maximum release of 99.8% in 72 h (Fig. 5A).
 | ||
| Fig. 5 In vitro PTX release assessment using temperature as a parameter for plain PTX and PTX-loaded TLN (A). In vitro PTX release assessment over 12.16 h under an alternating magnetic field (solid lines) and without a magnetic field (dotted lines) (B). | ||
The nanoparticle demonstrated a temperature-dependent release pattern, with the release order being 45 °C > 41 °C > 37 °C. The release at 45 °C and 41 °C were comparable due to the solid–liquid phase transition beyond ∼39 °C. This release pattern at 41 °C and 45 °C, indicating that the reopening of pores caused PTX release with a temperature-dependent diffusion process, confirms the suitability of P-γ-TLN for thermos-responsive drug delivery under hyperthermia. The release rates at the later stages of the drug release profile illustrated a slower rate attributed to the decrease in the concentration gradient, providing further evidence of the system's potential.102
The release profiles of PTX with/without AMF for 12.16 h are depicted in Fig. 5B. The extent of drug release without a magnetic field pulse was relatively lower, i.e., 17.28% + 2.38% at pH 7.4. The core contains most of the lipophilic payload, but the outer part has some of the liquid lipid trapping payload in the periphery, thus releasing a small portion due to erosion. Proceeding this release, the slow, sustained release continued for the rest of the time course.103
In comparison, under a stronger magnetic field, a 2.553-fold increase in PTX release (44.13% + 0.56%) was observed at pH 7.4 (Fig. 5B). The magnetic-field specified drug release profile refers to the drug release pattern that is specifically influenced by the application of a magnetic field. This profile suggested an effective burst due to system collapse from the lipid matrix of P-γ-TLN.104 The pulse during the ON cycle was given for a moment of 10 min after which the system recovered back to the microemulsion state and subsequently reduced the diffusivity from the collapsed matrix, resulting in slower release rates during the OFF cycles. Also, during this phase, the system temperature decreases, resulting in solidifying the matrix to halt the drug leakage.105
3.2.8.1 In vitro cytotoxicity. The cytotoxicity findings of PTX, γ-Fe2O3, TLN, P-TLN, and P-γ-TLN were investigated by the MTT test using the MCF-7 cell lines, presented in Fig. 6. Even at the highest concentration of 10 mg mL−1, 43.32% + 1.11% cytotoxicity was detected with the calculated IC50 of 11.41 mg mL−1 for γ-Fe2O3 (Fig. 6B). Furthermore, more than 90% of the cells were still alive at 0.1 mg mL−1 of γ-Fe2O3 concentration, demonstrating that they were cytocompatible. Similarly, TLN depicted cytocompatibility due to 29.43 + 1.171 cell cytotoxicity at 27.33 μg mL−1 concentration with an IC50 of 54.98 μg mL−1 (Fig. 6D). These results agreed with the previous finding on stearic/OA nanostructured lipid-based systems with the IC50 value of 44.6 μg mL−1.107 When cells were treated with P-TLN and P-γ-TLN, the vitality of the cells decreased dramatically, suggesting a higher level of inhibitory activity of cancer cells compared to free PTX and γ-Fe2O3 alone (Fig. 6E and F).108
 | ||
| Fig. 6 Cell viability measurements at concentrations predetermined in the established protocols for PTX (A), γ-Fe2O3 (B), TLN (C), P-TLN (D), P-γ-TLN (E), blank, and control (F). | ||
The IC50 values of P-TLN and P-γ-TLN were approximately 34-fold lower than the free PTX, accounting for the drug's enhanced solubility and cytotoxic activity in TLN compared with the aqueous solution. Positive and standard control depicted 99.41 + 0.092 and 0.00035% + 0.34% cell cytotoxicity, respectively (Fig. 6F).
3.2.8.2 In vitro chemo-magnetic hyperthermic cytotoxicity. PTX and γ-Fe2O3 were used as a control to determine the cytocompatibility with and without AMF, respectively. PTX produced similar cytotoxicity results with/without AMF (Fig. 6A and 7A), whereas γ-Fe2O3/AMF produced concentration-dependent cytotoxicity due to the enhanced magnetic hyperthermia and cell aggregation/agglomerations at higher levels.109
 | ||
| Fig. 7 Cell toxicity measurements under AMF at concentrations predetermined in the established protocols for PTX (A), γ-Fe2O3 (B), γ-Fe2O3/AMF (C), and P-γ-TLN/AMF (D). | ||
The concentration of γ-Fe2O3 at around 125 μg mL−1 produced a minimal cytotoxicity of about 7%, which was consistent with the results depicted in Fig. 4, i.e., concentration-dependent ΔT at all field strengths (Fig. 7C).
At a higher concentration of 1000 μg mL−1, ∼80% cytotoxicity was achieved, which could also be due to enhanced magnetic heating and loss in colloidal stability of the dispersion.110 P-γ-TLN had similar results in AMF to that of P-TLN due to the equal amount of PTX and γ-Fe2O3 loaded in them, i.e., 0.5–20 μg mL−1 (Fig. 7A and D). However, when the concentration of γ-Fe2O3 was increased to 500 μg mL−1, a significant enhancement in cytotoxicity was observed at all concentrations of the PTX in P-γ-TLN, a result of significant impact in our research, indicating almost 98% cell cytotoxicity at 20 μg mL−1 of PTX.
3.2.8.3 In vitro cell uptake imaging. Microscopy studies, as shown in Fig. 8, show that the cells could uptake green-fluorescent rhodamine-B in the form of nanoparticles compared to the solution. Higher fluorescence intensity, corresponding to 50 μM RHO concentration, distributed throughout the cytoplasm of the cells. Similarly, blue fluorescent-DAPI accumulated in the nucleus of the MCF-7 cells. Strong co-localization was observed with rhodamine-loaded nanoparticles due to a stable environment that protects the encapsulated fluorescent molecules from degradation by enzymes or pH changes in the cellular environment.111 In solution, the same molecules might degrade or lose activity before being internalized. Also, cellular uptake was enhanced through endocytosis mechanisms for which the lipid-based nature mimics cell membranes, facilitating better interaction and uptake than free molecules in solutions. Cellular efflux mechanisms might more readily expel free molecules in solution, whereas encapsulation in NLCs can protect them from immediate recognition and expulsion.
 | ||
| Fig. 8 Cell uptake analyses for normal groups (A)–(C), rhodamine only (D)–(F), and rhodamine-loaded nanoparticles (G)–(I). Bright field, blue, and green fluorescent imaging from left to right, depicting internalization inside the cells. | ||
4. Conclusions
In this work, a new strategy involving chemo-magnetic thermoresponsive delivery, based on the co-loading of a chemotherapeutic agent, PTX, and γ-Fe2O3 nanoparticles, has been accomplished. We have successfully optimized and demonstrated the biocompatible thermoresponsive performance of TLN under clinically safe conditions of magnetically clickable hyperthermia. The tissue hyperthermia-triggered release was justified with an increased PTX release at elevated temperatures. Similarly, an enhanced magnetically triggered release (∼2.5 fold) was also recorded using an AMF device. The successful validation of the release behavior through cytotoxicity assessment with/without AMF further reassures the efficacy of this system. The AMF-triggered cytotoxicity testing proved this system to be efficacious in killing almost all the cells (∼98%), but further investigations are required on suitable animal models in the future.Data availability
The data supporting this article have been included as part of the ESI.†Author contributions
Muhammad Tayyab: conceptualization, methodology, visualization, investigation, formal analysis, writing – original draft, writing – review & editing. Naveed Ahmed: conceptualization, supervision, visualization, formal analysis, software, review & editing. M. Hisham Al Nasir: methodology, investigation, formal analysis, writing – review & editing. Ayesha Ihsaan: methodology, visualization, investigation, writing – review & editing. Asim Ur Rehman: methodology, visualization, investigation, formal analysis, writing – review & editing, resources. Khurram Shahzad Munawar: methodology, investigation, validation, review & editing, resources. Mubashar Rehman: supervision, conceptualization, methodology, visualization, validation, funding acquisition, writing – original draft, writing – review & editing, resources, project administration. Maria del Carmen Iglesias de la Cruz: methodology, visualization, validation, writing – review & editing, resources. Daniel Jaque Garcia: supervision, conceptualization, methodology, visualization, validation, funding acquisition, writing – review & editing, resources, project administration.Conflicts of interest
There are no conflicts to declare.Acknowledgements
This study was conducted by using facilities provided by the Department of Pharmacy, Quaid-i-Azam University and received generous funding from the Higher Education Commission of Pakistan under the HEC “Indigenous 5000 PhD Fellowship Program Phase-II” awarded to Muhammad Tayyab (first author, No. 518-79944-2MD5-037). Part of the study was also conducted at the Facultad de Ciencias and Fisiología, Universidad Autónoma de Madrid, Spain, funded by HEC under the International Research Scholarship Batch 54, PIN: IRSIP 54 PSc 10. We are deeply appreciative of their support. The funders had no role in study design, data collection and analysis, publication decisions, or manuscript preparation.Notes and references
- T. Li, H. Zhang, M. Lian, Q. He, M. Lv, L. Zhai, J. Zhou, K. Wu and M. Yi, J. Hematol. Oncol., 2025, 18(1), 1–25 CrossRef.
- American Cancer Society, Breast Cancer Facts & Figures, American Cancer Society, 2024 Search PubMed.
- S. Guo, M. Vieweger, K. Zhang, H. Yin, H. Wang, X. Li, S. Li, S. Hu, A. Sparreboom and B. M. Evers, Nat. Commun., 2020, 11, 972 CrossRef CAS PubMed.
- J. Marin, R. Al-Abdulla, E. Lozano, O. Briz, L. Bujanda, J. M. Banales and R. Macias, Anti-Cancer Agents Med. Chem., 2016, 16, 318–334 CrossRef CAS PubMed.
- L. Zhang, B.-Z. Zhai, Y.-J. Wu and Y. Wang, Drug Delivery, 2023, 30, 1–18 CrossRef CAS PubMed.
- E. G. Fuller, H. Sun, R. D. Dhavalikar, M. Unni, G. M. Scheutz, B. S. Sumerlin and C. Rinaldi, ACS Appl. Polym. Mater., 2019, 1(2), 211–220 CrossRef CAS.
- A. Shakeri-Zadeh and J. W. M. Bulte, Nat. Rev. Bioeng., 2025, 3, 245–260 CrossRef CAS PubMed.
- P. C. Lyon, M. D. Gray, C. Mannaris, L. K. Folkes, M. Stratford, L. Campo, D. Y. Chung, S. Scott, M. Anderson and R. Goldin, Lancet Oncol., 2018, 19, 1027–1039 CrossRef CAS PubMed.
- N. Borys and M. W. Dewhirst, Adv. Drug Delivery Rev., 2021, 178, 113985 CrossRef CAS PubMed.
- M. Regenold, K. Kaneko, X. Wang, H. B. Peng, J. C. Evans, P. Bannigan and C. Allen, J. Controlled Release, 2023, 354, 19–33 CrossRef CAS PubMed.
- M. Bhuimali, S. Munshi, K. Hapa, P. K. Kadu and P. P. Kale, Int. J. Polym. Mater. Polym. Biomater., 2024, 73, 395–404 CrossRef CAS.
- Y. Dou, K. Hynynen and C. Allen, J. Controlled Release, 2017, 249, 63–73 CrossRef CAS PubMed.
- N. Borys and M. W. Dewhirst, Adv. Drug Delivery Rev., 2021, 178, 113985 CrossRef CAS PubMed.
- M. Regenold, K. Kaneko, X. Wang, H. B. Peng, J. C. Evans, P. Bannigan and C. Allen, J. Controlled Release, 2023, 354, 19–33 CrossRef CAS PubMed.
- M. Rehman, A. Ihsan, A. Madni, S. Z. Bajwa, D. Shi, T. J. Webster and W. S. Khan, Int. J. Nanomed., 2017, 8325–8336 CrossRef CAS PubMed.
- M. Anwar, M. Rehman, T. Ur-Rehman, M. I. Khan, N. Ahmed, A. Madni and M. Tayyab, J. Pharm. Sci., 2025, 103723 CrossRef CAS.
- M. Yoozbashi, H. Rashidzadeh, M. Kermanian, S. Sadighian, M.-J. Hosseini, Z. Kaboli and K. Rostamizadeh, J. Biomater. Appl., 2022, 36, 1055–1063 CrossRef CAS PubMed.
- G. Qing, X. Zhao, N. Gong, J. Chen, X. Li, Y. Gan and X. J. Liang, Nat. Commun., 2019, 10(1), 4336 CrossRef PubMed.
- I. Brezaniova, M. Hruby, J. Kralova, V. Kral, Z. Cernochova, P. Cernoch and P. Stepanek, J. Controlled Release, 2016, 241, 34–44 CrossRef CAS PubMed.
- M. Kawish, S. Ullah, T. Roome, A. Razzak, S. Aslam and M. Raza Shah, Pharm. Dev. Technol., 2024, 29(7), 762–775 Search PubMed.
- Y. N. Tan, Y. P. Li, J. D. Huang, M. Luo, S. S. Li, A. W. M. Lee and X. Y. Guan, Cancer Lett., 2021, 522, 238–254 Search PubMed.
- R. Massart, IEEE Trans. Magn., 1981, 17, 1247–1248 CrossRef.
- S. Zhu, Y. Leng, M. Yan, X. Tuo, J. Yang, L. Almásy, Q. Tian, G. Sun, L. Zou and Q. Li, Appl. Surf. Sci., 2018, 447, 381–387 CrossRef CAS.
- M. E. Villanueva, F. Giudice, E. Ambroggio and R. V. Vico, Langmuir, 2021, 37, 1861–1873 CrossRef CAS PubMed.
- P. Banerjee, T. Geng, A. Mahanty, T. Li, L. Zong and B. Wang, Int. J. Pharm., 2019, 557, 374–389 CrossRef CAS PubMed.
- C. N. Njoku and S. K. Otisi, in Response Surface Methodology-Research Advances and Applications, IntechOpen, 2023 Search PubMed.
- S. N. A. Bukhari, A. Ali, M. A. Hussain, M. Tayyab, N. F. Alotaibi, M. A. Elsherif, K. Junaid and H. Ejaz, Polymers, 2022, 14, 1904 CrossRef CAS PubMed.
- G. A. El-Emam, A. Motawea, W. E. Abd El Hady, S. Saber, A. A. Mourad, H. A. Ramadan and A. M. El-Baz, J. Drug Delivery Sci. Technol., 2023, 89, 105012 CrossRef CAS.
- S. A. Lee, H. J. Joung, H. J. Park and G. H. Shin, J. Food Sci., 2017, 82, 904–912 CrossRef CAS PubMed.
- N. Kumar, P. K. S. Rathore, R. Sharma and N. K. Gupta, Appl. Therm. Eng., 2023, 224, 120088 CrossRef CAS.
- R. M. Iacobazzi, F. Vischio, I. Arduino, F. Canepa, V. Laquintana, M. Notarnicola, M. P. Scavo, G. Bianco, E. Fanizza and A. A. Lopedota, J. Colloid Interface Sci., 2022, 608, 239–254 CrossRef CAS PubMed.
- S. Ghosh, I. Ghosh, M. Chakrabarti and A. Mukherjee, Food Chem. Toxicol., 2020, 136, 110989 Search PubMed.
- R. Nasiri, J. H. Almaki, A. B. Idris, F. A. A. Majid, M. Nasiri, M. Salouti, M. Irfan, N. Amini and M. Marvibaigi, Mater. Sci. Eng., C, 2016, 69, 1147–1158 Search PubMed.
- F. Marino, E. R. Lopez, A. Arnosa, M. A. G. Gómez, Y. Pineiro, J. Rivas, C. Alvarez-Lorenzo and J. Fernandez, J. Mol. Liq., 2022, 348, 118401 Search PubMed.
- N. Kumar, S. Goindi, B. Saini and G. Bansal, J. Therm. Anal. Calorim., 2014, 115, 2375–2383 CrossRef CAS.
- A. Ahmed, Y. Chaker, E. H. Belarbi, O. Abbas, J. Chotard, H. Abassi, A. N. Van Nhien, M. El Hadri and S. Bresson, J. Mol. Struct., 2018, 1173, 653–664 CrossRef CAS.
- S. Khizar, N. M. Ahmad, N. Ahmed, S. Manzoor and A. Elaissari, Polym. Adv. Technol., 2020, 31, 1732–1743 CrossRef CAS.
- G. Kandasamy, A. Sudame, T. Luthra, K. Saini and D. Maity, ACS Omega, 2018, 3, 3991–4005 CrossRef CAS PubMed.
- S. Lv, Z. Tang, D. Zhang, W. Song, M. Li, J. Lin, H. Liu and X. Chen, J. Controlled Release, 2014, 194, 220–227 CrossRef CAS PubMed.
- H. Oliveira, E. Pérez-Andrés, J. Thevenot, O. Sandre, E. Berra and S. Lecommandoux, J. Controlled Release, 2013, 169, 165–170 CrossRef CAS PubMed.
- M. Ferreira, L. L. Chaves, S. A. C. Lima and S. Reis, Int. J. Pharm., 2015, 492, 65–72 CrossRef CAS PubMed.
- M. Jamil, I. S. Mustafa, N. M. Ahmed and S. B. S. Hamid, Biomater. Adv., 2022, 143, 213178 CrossRef CAS PubMed.
- F. Ganjouzadeh, S. Khorrami and S. Gharbi, J. Drug Delivery Sci. Technol., 2022, 71, 103340 CrossRef CAS.
- W. Montha, W. Maneeprakorn, I.-M. Tang and W. Pon-On, RSC Adv., 2020, 10, 40206–40214 RSC.
- P. Parhi and S. K. Sahoo, J. Colloid Interface Sci., 2015, 451, 198–211 CrossRef CAS PubMed.
- L. M. Negi, M. Jaggi and S. Talegaonkar, Int. J. Pharm., 2014, 461, 403–410 CrossRef CAS PubMed.
- S. N. A. S. Azhar, S. E. Ashari, J. K. Tan, N. K. Kassim, M. Hassan, N. Zainuddin, R. Mohamad and I. D. M. Azmi, Ind. Crops Prod., 2023, 198, 116668 CrossRef.
- Y.-k. Sun, M. Ma, Y. Zhang and N. Gu, Colloids Surf., A, 2004, 245, 15–19 CrossRef CAS.
- Y. M. Gabal, A. O. Kamel, O. A. Sammour and A. H. Elshafeey, Int. J. Pharm., 2014, 473, 442–457 CrossRef CAS PubMed.
- T. V. Truong, M. Ghosh, B. Hosamani, T. V. Baiju, G. Dhandapani, E. Wachtel, E. Kesselman, D. Danino, M. Sheves and I. N. Namboothiri, J. Pept. Sci., 2019, 25, e3174 CrossRef PubMed.
- M. A. Hussain, A. Ali, T. G. Alsahli, N. Khan, A. Sharif, M. T. Haseeb, O. A. Alsaidan, M. Tayyab and S. N. A. Bukhari, Gels, 2023, 9, 525 CrossRef CAS PubMed.
- Z. Azizi, R. Barzegarian and M. Behvandi, Sustainable Energy Technologies and Assessments, 2022, 50, 101876 CrossRef.
- U. K. Baruah, K. Gowthamarajan, V. Ravisankar, V. V. S. R. Karri, P. K. Simhadri and V. Singh, J. Drug Targeting, 2018, 26, 576–591 CrossRef CAS PubMed.
- L. A. S. Bahari and H. Hamishehkar, Adv. Pharm. Bull., 2016, 6, 143 CrossRef CAS PubMed.
- M. T. Chaichan, M. T. Mahdi, H. A. Kazem, A. H. Al-Waeli, M. A. Fayad, A. A. Al-Amiery, W. N. R. W. Isahak, A. A. H. Kadhum and M. S. Takriff, Sustainability, 2022, 14, 12015 CrossRef CAS.
- M. I. Teixeira, C. M. Lopes, H. Gonçalves, J. Catita, A. M. Silva, F. Rodrigues, M. H. Amaral and P. C. Costa, J. Mol. Liq., 2023, 388, 122749 CrossRef.
- R. Bnyan, I. Khan, T. Ehtezazi, I. Saleem, S. Gordon, F. O'Neill and M. Roberts, J. Pharm. Sci., 2018, 107, 1237–1246 CrossRef CAS PubMed.
- A. Alhalmi, S. Amin, S. Beg, R. Al-Salahi, S. R. Mir and K. Kohli, J. Drug Delivery Sci. Technol., 2022, 74, 103590 CrossRef CAS.
- N. Dudhipala and K. Veerabrahma, Eur. J. Pharm. Biopharm., 2017, 110, 47–57 CrossRef CAS PubMed.
- L. K. Holte, B. A. Kuran, G. L. Richmond and K. E. Johnson, J. Phys. Chem. C, 2014, 118, 10024–10032 CrossRef CAS.
- U. Klinkesorn and Y. Namatsila, Food Hydrocolloids, 2009, 23, 1374–1380 CrossRef CAS.
- P. Witayaudom and U. Klinkesorn, J. Colloid Interface Sci., 2017, 505, 1082–1092 CrossRef CAS PubMed.
- X. Song, Y. Zhao, S. Hou, F. Xu, R. Zhao, J. He, Z. Cai, Y. Li and Q. Chen, Eur. J. Pharm. Biopharm., 2008, 69, 445–453 CrossRef CAS PubMed.
- P. Kaur, T. Garg, G. Rath, R. R. Murthy and A. K. Goyal, Drug Delivery, 2016, 23, 1912–1925 CAS.
- S. Bhattacharjee, J. Controlled Release, 2016, 235, 337–351 CrossRef CAS PubMed.
- A. D. Wulandari, S. Sutriyo and R. Rahmasari, J. Adv. Pharm. Technol. Res., 2022, 13(2), 89–94 CrossRef CAS PubMed.
- S. Jose, S. S. Anju, T. A. Cinu, N. A. Aleykutty, S. Thomas and E. B. Souto, Int. J. Pharm., 2014, 474(1–2), 6–13 CrossRef CAS PubMed.
- A. A. Shimojo, A. R. V. Fernandes, N. R. Ferreira, E. Sanchez-Lopez, M. H. Santana and E. B. Souto, Antioxidants, 2019, 8(8), 272 CrossRef CAS PubMed.
- M. Khaledian, M. S. Nourbakhsh, R. Saber, H. Hashemzadeh and M. H. Darvishi, Int. J. Nanomed., 2020, 6167–6182 CrossRef CAS PubMed.
- A. Carvalho, M. Martins, M. Corvo and G. Feio, Mater. Sci. Eng., C, 2014, 43, 521–526 CrossRef CAS PubMed.
- X. Fu, W. Kong, Y. Zhang, L. Jiang, J. Wang and J. Lei, RSC Adv., 2015, 5, 68881–68889 RSC.
- M. I. Idris, J. Zaloga, R. Detsch, J. A. Roether, H. Unterweger, C. Alexiou and A. R. Boccaccini, Sci. Rep., 2018, 8, 7286 CrossRef PubMed.
- L. Zhang, R. He and H.-C. Gu, Appl. Surf. Sci., 2006, 253, 2611–2617 CrossRef CAS.
- S. Alipour, H. Montaseri and M. Tafaghodi, Colloids Surf., B, 2010, 81, 521–529 CrossRef CAS PubMed.
- K. Hasanbegloo, S. Banihashem, B. F. Dizaji, S. Bybordi, N. Farrokh-Eslamlou, P. G.-s. Abadi, F. S. Jazi and M. Irani, Int. J. Biol. Macromol., 2023, 230, 123380 CrossRef CAS PubMed.
- L. Wang, X. Zhao, F. Yang, W. Wu, M. Wu, Y. Li and X. Zhang, Int. J. Biol. Macromol., 2019, 138, 207–214 CrossRef CAS PubMed.
- M. M. Bora, P. Gogoi, D. C. Deka and D. K. Kakati, Ind. Crops Prod., 2014, 52, 721–728 CrossRef CAS.
- D. B. Alfaro, E. Prokhorov, G. L. Barcenas and H. García, J. Mol. Liq., 2023, 374, 121304 CrossRef.
- E. Darezereshki, Mater. Lett., 2010, 64, 1471–1472 CrossRef CAS.
- W. K. Lewis, A. T. Rosenberger, J. R. Gord, C. A. Crouse, B. A. Harruff, K. S. Fernando, M. J. Smith, D. K. Phelps, J. E. Spowart and E. A. Guliants, J. Phys. Chem. C, 2010, 114, 6377–6380 CrossRef CAS.
- I. D. R. Pedro, O. P. Almeida, H. R. Martins, J. de Alcântara Lemos, A. L. B. de Barros, E. A. Leite and G. Carneiro, J. Drug Delivery Sci. Technol., 2019, 54, 101370 CrossRef CAS.
- V. H. S. Araujo, P. B. da Silva, I. O. Szlachetka, S. W. da Silva, B. Fonseca-Santos, M. Chorilli, R. Ganassin, G. R. T. de Oliveira, M. C. O. da Rocha and R. P. Fernandes, Colloids Surf., A, 2020, 602, 125070 CrossRef CAS.
- C. Dhanya, W. Paul, M. Rekha and R. Joseph, J. Mol. Liq., 2023, 380, 121738 CrossRef CAS.
- R. Osanlou, M. Emtyazjoo, A. Banaei, M. A. Hesarinejad and F. Ashrafi, Colloids Surf., A, 2022, 641, 128588 CrossRef CAS.
- S. J. Iyengar, M. Joy, C. K. Ghosh, S. Dey, R. K. Kotnala and S. Ghosh, RSC Adv., 2014, 4, 64919–64929 Search PubMed.
- M. Aliahmad and N. Nasiri Moghaddam, Mater. Sci.-Pol., 2013, 31, 264–268 CrossRef CAS.
- M. Ali, P. Adie, C. H. Marrows, D. Greig, B. J. Hickey and R. L. Stamps, Nat. Mater., 2007, 6, 70–75 CrossRef CAS PubMed.
- C. C. Cheung, I. Monaco, N. Kostevšek, M. C. Franchini and W. T. Al-Jamal, Colloids Surf., B, 2021, 198, 111453 CrossRef CAS PubMed.
- W. Kim, C.-Y. Suh, S.-W. Cho, K.-M. Roh, H. Kwon, K. Song and I.-J. Shon, Talanta, 2012, 94, 348–352 Search PubMed.
- W. Kong, Z. Liu, Y. Yang, C. Zhou and J. Lei, Constr. Build. Mater., 2017, 152, 568–575 Search PubMed.
- J. Liu, D. Jiang, H. Fei, Y. Xu, Z. Zeng and W. Ye, ACS Omega, 2021, 6, 23542–23550 CrossRef CAS PubMed.
- B. Rodenak-Kladniew, N. Noacco, I. P. de Berti, S. J. Stewart, A. F. Cabrera, V. A. Alvarez, M. G. de Bravo, N. Durán, G. R. Castro and G. A. Islan, Colloids Surf., B, 2021, 202, 111710 CrossRef CAS PubMed.
- N. M. Patro, K. Devi, R. S. Pai and S. Suresh, J. Nanopart. Res., 2013, 15, 1–18 CrossRef.
- D. Cao, H. Li, L. Pan, J. Li, X. Wang, P. Jing, X. Cheng, W. Wang, J. Wang and Q. Liu, Sci. Rep., 2016, 6, 32360 CrossRef CAS PubMed.
- H. Khurshid, W. Li, M.-H. Phan, P. Mukherjee, G. C. Hadjipanayis and H. Srikanth, Appl. Phys. Lett., 2012, 101(2), 022403 Search PubMed.
- H. Wang, T. Zhu, K. Zhao, W. Wang, C. Wang, Y. Wang and W. Zhan, Phys. Rev. B: Condens. Matter Mater. Phys., 2004, 70, 092409 CrossRef.
- A. Hanini, L. Lartigue, J. Gavard, K. Kacem, C. Wilhelm, F. Gazeau, F. Chau and S. Ammar, J. Magn. Magn. Mater., 2016, 416, 315–320 CrossRef CAS.
- M. T. Luiz, J. A. P. Dutra, J. S. R. Viegas, J. T. C. de Araújo, A. G. Tavares Junior and M. Chorilli, Pharmaceutics, 2023, 15(3), 751 CrossRef CAS PubMed.
- M. K. Kwok, C. C. Maley, A. Dworkin, S. Hattersley, P. Southern and Q. A. Pankhurst, Appl. Phys. Lett., 2023, 122(24), 240502 CrossRef CAS.
- J. M. Terwogt, B. Nuijen, W. T. B. Huinink and J. Beijnen, Cancer Treat. Rev., 1997, 23, 87–95 CrossRef CAS PubMed.
- B. Nuijen, M. Bouma, J. H. Schellens and J. H. Beijnen, Invest. New Drugs, 2001, 19, 143–153 CrossRef CAS PubMed.
- G. Tan, S. Yu, J. Li and W. Pan, Int. J. Biol. Macromol., 2017, 103, 941–947 CrossRef CAS PubMed.
- G.-H. Son, B.-J. Lee and C.-W. Cho, J. Pharm. Invest., 2017, 47, 287–296 CrossRef CAS.
- N. S. Satarkar and J. Z. Hilt, J. Controlled Release, 2008, 130, 246–251 CrossRef CAS PubMed.
- W.-C. Huang, S.-H. Hu, K.-H. Liu, S.-Y. Chen and D.-M. Liu, J. Controlled Release, 2009, 139, 221–228 CrossRef CAS PubMed.
- F.-Q. Hu, S.-P. Jiang, Y.-Z. Du, H. Yuan, Y.-Q. Ye and S. Zeng, Int. J. Pharm., 2006, 314, 83–89 CrossRef CAS PubMed.
- S. Abdolahpour, N. Mahdieh, Z. Jamali, A. Akbarzadeh, T. Toliyat and M. Paknejad, BioNanoScience, 2017, 7, 32–39 Search PubMed.
- R. Al-Obaidy, A. J. Haider, S. Al-Musawi and N. Arsad, Sci. Rep., 2023, 13, 3180 Search PubMed.
- A. E. Deatsch and B. A. Evans, J. Magn. Magn. Mater., 2014, 354, 163–172 Search PubMed.
- H. L. Rodríguez-Luccioni, M. Latorre-Esteves, J. Méndez-Vega, O. Soto, A. R. Rodríguez, C. Rinaldi and M. Torres-Lugo, Int. J. Nanomed., 2011, 373–380 Search PubMed.
- X. Shao, C. Meng, W. Song, T. Zhang and Q. Chen, Adv. Drug Delivery Rev., 2023, 114977 CrossRef CAS PubMed.
Footnote |
| † Electronic supplementary information (ESI) available. See DOI: https://doi.org/10.1039/d5na00072f |
| This journal is © The Royal Society of Chemistry 2025 |