
The value of in situ/operando Raman spectroscopy in all-solid-state Li batteries
Runze
Zhang
ab,
Yinglei
Wu
*a,
Zhenying
Chen
bd,
Yu
Wang
a,
Jinhui
Zhu
 *b and
Xiaodong
Zhuang
*bc
*b and
Xiaodong
Zhuang
*bc
aSchool of Chemistry and Chemical Engineering, Shanghai University of Engineering Science, China. E-mail: wuyl@sues.edu.cn
bThe Meso-Entropy Matter Lab, State Key Laboratory of Metal Matrix Composites, Shanghai Key Laboratory of Electrical Insulation and Thermal Ageing, School of Chemistry and Chemical Engineering, Shanghai Jiao Tong University, Shanghai 200240, China. E-mail: zhujinhui1109@sjtu.edu.cn; zhuang@sjtu.edu.cn
cFrontiers Science Center for Transformative Molecules, Zhang Jiang Institute for Advanced Study, Shanghai Jiao Tong University, Shanghai 201203, China
dCollege of Chemistry, Zhengzhou University, Zhengzhou 450001, Henan, China
First published on 25th August 2023
Abstract
All-solid-state Li batteries (ASSLBs) are promising owing to their high safety and energy density. A comprehensive understanding of the failure mechanisms of ASSLBs can facilitate the development of strategies to improve their performance. Various real-time characterization techniques can be used to understand such mechanisms. Among such techniques, in situ/operando Raman spectroscopy (IS/O-RS) is commonly used because it can detect the molecular structural and compositional evolution of most of the electrodes, solid electrolytes (SEs), and their interface in ASSLBs. Herein, we review the applications of IS/O-RS in research on ASSLBs. We first introduce the principles, classifications, and development of IS/O-RS. We then describe various studies that used IS/O-RS to explore electrode–electrolyte interfaces, electrodes, and SEs. Finally, we summarize the review findings and propose optimized applications of IS/O-RS in research on ASSLBs. We hope that this review can enable researchers to use IS/O-RS to directly and conveniently investigate ASSLBs and then use their findings to improve the performance of ASSLBs.
 Runze Zhang | Runze Zhang received his bachelor's degree in Material Forming and Control Engineering major from Shandong Jiao Tong University in 2020. He is currently pursuing his master's degree at the Shanghai University of Engineering Science and working as an exchange student in Prof. Zhuang's group. His topic is development of sulfide electrolytes for all-solid-state Li batteries. |
 Yinglei Wu | Yinglei Wu obtained her Master's degree from Shanghai Jiao Tong University and then did her doctoral research at the University of Twente in the Netherlands. She is now working at Shanghai University of Engineering Science. Her current research interests focus on materials and chemicals, including lithium-ion batteries. |
 Jinhui Zhu | Jinhui Zhu obtained his PhD from Shanghai Jiao Tong University in 2018. He then did his postdoctoral research at Shanghai Jiao Tong University. He has been working at Shanghai Jiao Tong University as assistant professor since 2021. His current research interests focus on the development of practical all-solid-state Li batteries. |
 Xiaodong Zhuang | Xiaodong Zhuang, a synthetic material chemist, is a full professor at Shanghai Jiao Tong University and the head of The Meso-Entropy Matter Lab. His scientific interest is meso-entropy matter, including special aromatics, polymers, carbons and two-dimensional materials, for energy storage and conversion. |
1. Introduction
Li-ion batteries (LIBs), which typically consist of liquid electrolytes and a graphite anode, have stimulated the rapid development of industries such as portable consumer electronics and electric vehicles. Despite their popularity, LIBs have safety problems and limited specific energy density. All-solid-state Li batteries (ASSLBs) have been developed to address these problems; in ASSLBs, the liquid electrolytes and graphite anode of traditional LIBs are substituted with solid electrolytes (SEs) and a Li metal anode (LMA), respectively.1–6 SEs are key components in ASSLBs because they are nonflammable, signifying that they do not spontaneously combust or explode, and can improve the safety of batteries.7–9ASSLBs have yet to be commercialized because they have three critical sets of problems that remain unresolved. The first set of problems involves the unstable LMA–SE interface. Specifically, Li dendrites intrinsically grow on the surface of LMA even when SEs are employed.10 Moreover, solid Li has poor point-to-point contact with SEs, which results in high impedance of the cell.11 Finally, some of the SEs (e.g., sulfides and halides) are chemically and electrochemically reactive with LMA.12,13 The second set of problems involves the incompatibility between SEs and cathode materials. Specifically, SEs have poor point-to-point contact with cathodes, which causes slow Li+ diffusion in these cathodes that can increase their polarization.14 Furthermore, some of the commonly used SE compounds (e.g., sulfides and polymers) are chemically and electrochemically reactive with high-voltage cathode materials.15 Finally, the interface between SEs and conversion cathodes (e.g., sulfur-based cathodes) is mutable and thus unstable.16,17 The third set of problems involves SE degradation during cycling. Most SEs have a narrow electrochemical stability window, which can cause them to gradually decompose during cell cycling.18 Clearly understanding the mechanisms of cell failure is essential for the development of strategies to increase the performance of ASSLBs. Scholars have generally attempted to understand the mechanism of cell failure by using texture characterization methods, particularly combined such characterization methods with in situ/operando (IS/O) techniques.
IS/O microscopic and spectroscopic characterization techniques have traditionally been used to estimate the morphological and compositional evolution of electrodes, electrolytes, and the interface of these two materials in LIBs and ASSLBs. Microscopic characterization techniques include scanning electron microscopy (SEM), transmission electron microscopy (TEM), atomic force microscopy (AFM), scanning transmission electron microscopy (STEM), and scanning tunneling microscopy (STM). Combined with IS/O techniques, the microscopic characterization can be used to observe the morphological changes of electrodes, electrolytes, and the interface of these two materials during cycling; for example, they can be used to observe electrode cracks,19 Li dendrite growth,20 solid electrolyte interphase (SEI) evolution,21 and space-charge-layer formation.22 Spectroscopic characterization techniques include X-ray diffraction (XRD), X-ray photoelectron spectroscopy (XPS), X-ray absorption spectroscopy (XAS), Fourier transform infrared (FTIR) spectroscopy, nuclear magnetic resonance (NMR) spectroscopy, Raman spectroscopy (RS), and differential electrochemical mass spectroscopy (DEMS). The IS/O spectroscopic techniques can be adopted to estimate the structural and compositional evolution of electrodes, electrolytes, and the interface of these materials during cycling; for example, they can be used to estimate the crystal structure of the electrodes and SEs,23 the chemical nature of the formed SEI,24 the cathode electrolyte interphase,25 degraded electrodes and SEs,26 and the types of gas generated in the cell.27
Among the aforementioned characterization techniques, IS/O-RS has several advantages that render it ideal for qualitatively analyzing the molecular structure of electrodes, SEs, and their interface in order to comprehensively understand the failure mechanism of batteries.24,28–36 These advantages are listed as follows: (1) the laser source used in RS has only a moderate level of power and can thus be used to test samples without harming them. Conversely, the synchrotron-based X-ray beam used in XRD, XPS, and XAS may damage the samples during testing. (2) RS requires only a tiny sample (a few milligrams) and can accommodate many sample states, including powders, particles, films, and pellets. (3) RS is convenient and simple to operate in that it requires sample exposure to a laser only for signal collection. (4) RS exhibits high sensitivity, fast signal acquisition, and high signal accuracy for the investigation of molecular structures; these features are beneficial for analyzing the structural evolution of electrodes, SEs, and the interface between them.37 Certainly, in the testing process, it is essential to consider some limitations of the IS/O-RS technique. For instance, it may not be as sensitive to metals or alloys that do not efficiently scatter light, leading to potential challenges in their detection. Moreover, the technique is susceptible to interference from fluorescence, which can obscure or overpower the Raman signal. Additionally, the IS/O-RS method may suffer from a low signal-to-noise ratio, making it challenging to detect low concentrations or weak bands effectively. These limitations should be carefully accounted for and addressed when employing the IS/O-RS technique for accurate and reliable characterization.
Accordingly, in this review, we examine how IS/O-RS has been applied to examine ASSLBs. We first discuss the principles, classification, and development of IS/O-RS. We then discuss how various studies have used this technique to investigate the cathode–SE interfaces, anode–SE interfaces, cathodes, anodes, and SEs in ASSLBs. Finally, we summarize our review findings and propose suggestions for optimized operation of IS/O-RS. We hope that this review can help researchers understand the application of IS/O-RS in research on ASSLBs; such an understanding can enable researchers to use this technique to determine the mechanisms of cell failure in ASSLBs and increase the performance of ASSLBs.
2. Introduction of RS
In 1928, the Indian scientist Chandrasekhara Venkata Raman discovered that light scatters in an inelastic manner under certain conditions, and he won the Nobel Prize in Physics for this discovery in 1930. This phenomenon is referred to as Raman scattering. Raman scattering is an essential mechanism of RS, which can provide information on vibration, rotation, and low-frequency excited inelastic scattering of molecules. RS has been extensively used to study the structure, orientation, composition, defects, stress, phonons, and molecular recognition of materials.2.1. Principle
Raman scattering occurs when molecules are irradiated by monochromatic light. A Raman spectrum is a function of the frequency difference of incident and scattered light and the intensity difference of incident and scattered light. This frequency difference is called the Raman shift, which corresponds to the characteristic vibrational energy level of the irradiated molecules.38,39 The Raman shift is determined by the vibrational energy of the Raman position found in the interatomic bond of the molecules. This vibrational energy is also affected by the lattice symmetry, geometry, oxidation state, disorder, and strain of the samples.40Raman microscopy is a type of RS that entails the use of a microscope with a submicrometer spatial resolution. Raman microscopy can be used to distinguish individual particles of electrode materials and SEs. A Raman microscope has a high temporal resolution and can detect changes in the configuration of the materials at the atomic level in a LIB or ASSLB during cycling. For example, the changes in the atomic configuration of electrode materials that occur when Li+ de/intercalates from their lattice can be measured according to the position and strength changes of the Raman peaks of the materials.
2.2. Classification
Scholars have proposed several modifications to RS to expand the application scope of conventional RS. These include surface-enhanced Raman scattering (SERS)-based RS,41 shell-isolated nanoparticle-enhanced RS (SHINERS),42 and tip-enhanced RS (TERS).43Conventional RS uses Raman scattering to characterize materials in a nondestructive manner. In an ASSLB, an SE film is typically sandwiched between the Au working electrode (which faces the quartz optical window) and the Li counter/reference electrode. This three-layer sample cell comprising a film and two electrodes is then fixed in place with a T-shaped steel back contact (Fig. 1a). Conventional RS is versatile and can be applied to solid, liquid, or gas samples, eliminating the need for complex sample preparation. It is non-destructive, does not require vacuum conditions, and allows for rapid acquisition of spectra. Additionally, it can be utilized with glass containers and aqueous solutions and can even employ fiber optics for remote sampling. However, there are limitations, as it is unsuitable for metal or alloy samples due to their weak Raman effect. The technique exhibits low sensitivity, making it challenging to measure substances with low concentrations. Furthermore, it is susceptible to fluorescence interference from certain substances, which may affect the accuracy of measurements.44
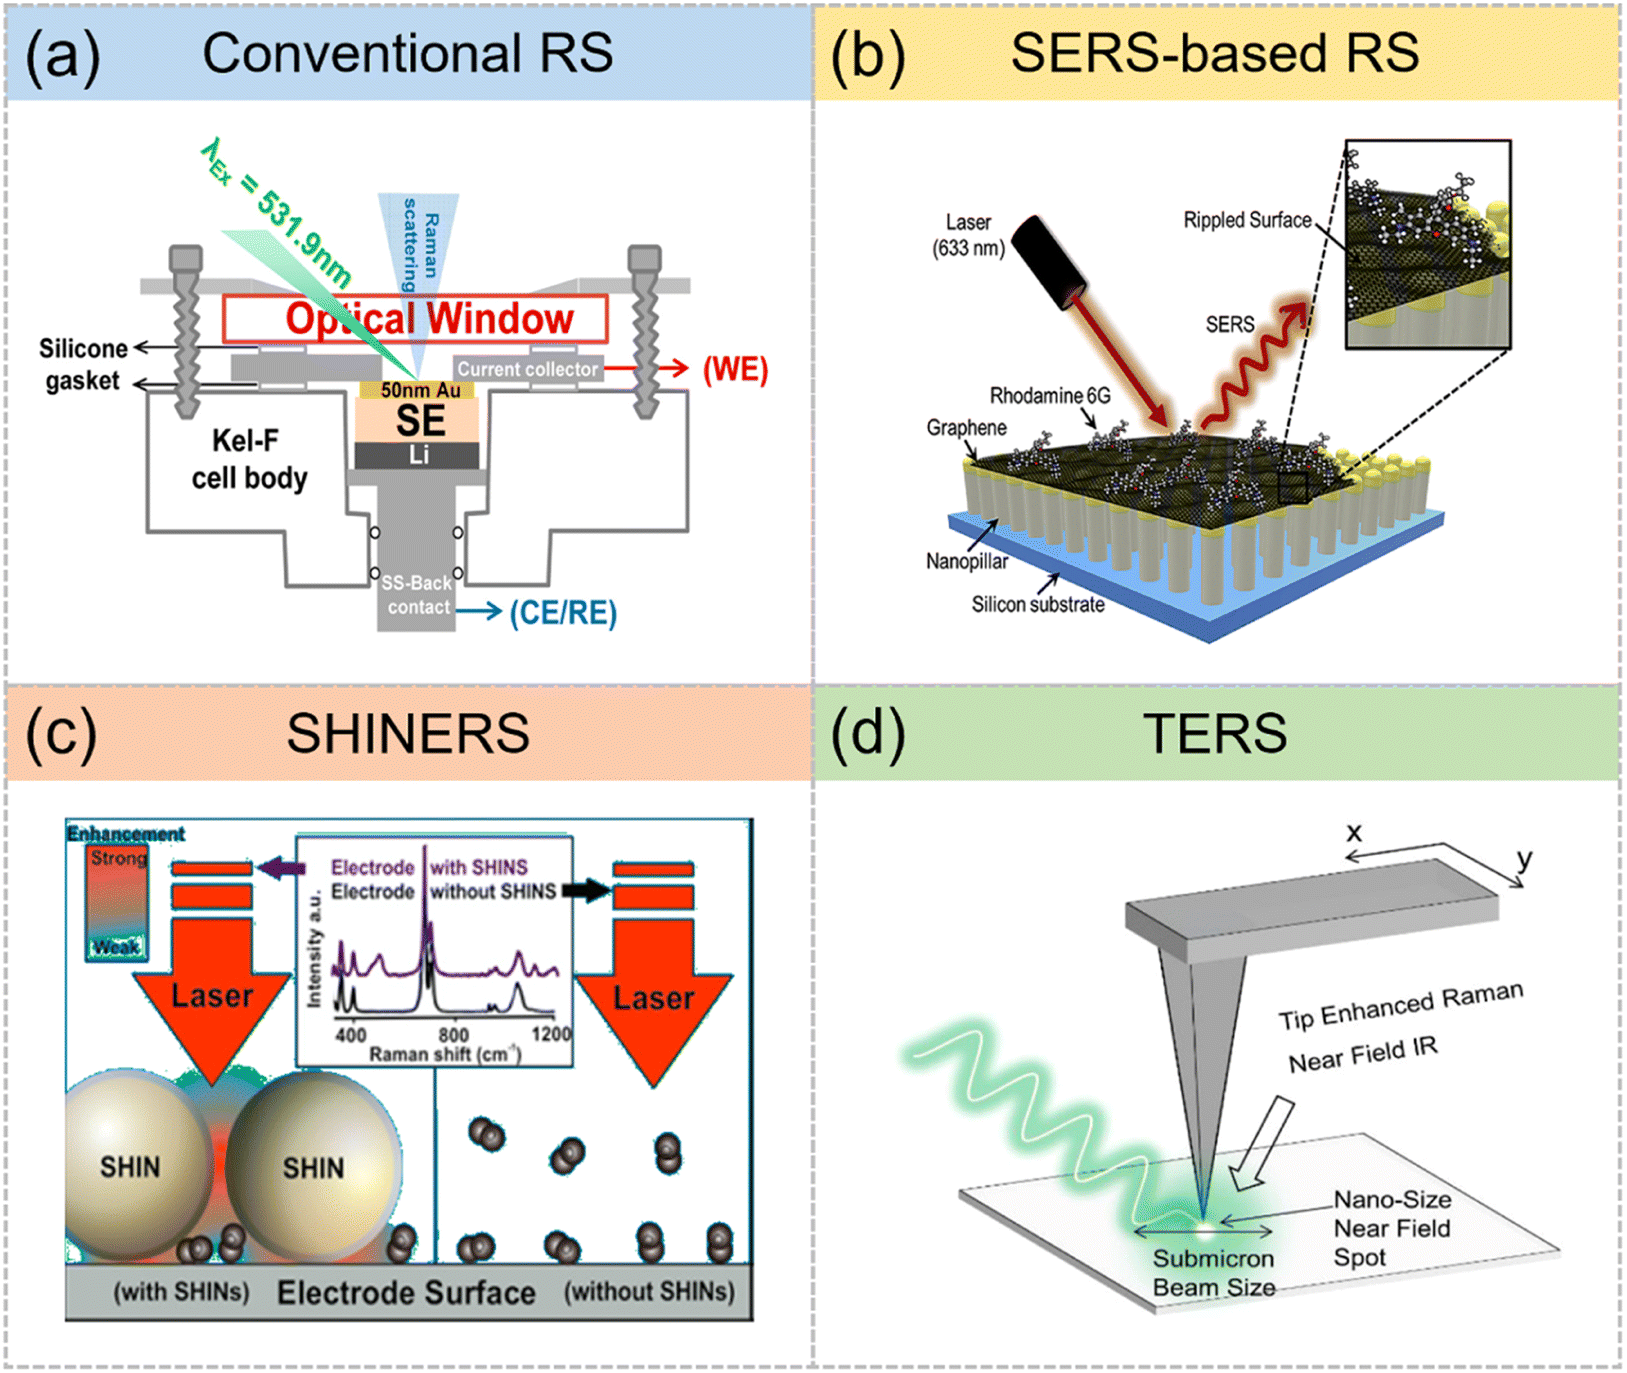 | ||
| Fig. 1 RS can be classified into (a) conventional RS. Reproduced with permission.44 Copyright 2017, American Chemical Society. (b) SERS-based RS. Reproduced with permission.41 Copyright 2019, Elsevier. (c) SHINERS. Reproduced with permission.42 Copyright 2016, American Chemical Society. (d) TERS. Reproduced with permission.43 Copyright 2022, American Chemical Society. | ||
Raman signals can be enhanced through SERS, which involves placing the tested materials on a rough metal surface for signal enhancement (enhancement factor: up to 1010–1011).41 SERS is engendered in two steps: (1) an enhanced electromagnetic field that is generated by surface plasmons formed when a metal surface is irradiated with a laser, and (2) a charge transfer is occurred between the metal surface and the tested material, which can enhance the molecular vibrations of the material. The incorporation of SERS into conventional RS improves the RS sensitivity and accuracy (Fig. 1b). SERS-based RS harnesses the electromagnetic field enhancement effect of metal nanoparticles or surfaces, significantly amplifying the Raman signal intensity and achieving single molecule level detection sensitivity. This technique finds applications in various fields, including environmental, biological, and medical analyses. However, to achieve optimal results, it requires appropriate metal substrates or nanoparticles. Signal inhomogeneity or irreproducibility may arise as potential challenges, and careful consideration of the interaction between substrates or nanoparticles and samples is necessary. Accordingly, SERS-based RS has been used to investigate the electrochemical reaction of dioxygen in metal–air batteries.45
SERS-based RS has limited practical use because it necessitates the use of nanostructured materials and placing such materials on a metal substrate. SHINERS was developed to address these limitations and is suitable for use with diverse materials and nanostructures.42 In SHINERS, the surface of analytes are coated with shell-isolated nanoparticles of various compositions and morphologies (Fig. 1c). Such nanoparticles can be easily manufactured and are composed of plasmonic gold or a silver core with an inert shell made of a material such as SiO2 or Al2O3. A key feature of shell-isolated nanoparticles is that they can enhance the Raman vibrational signal of nearby molecules (i.e., analytes). SHINERS offers a solution to the limitations of SERS when dealing with metal or alloy samples. By utilizing dielectric shells to isolate the metal cores from the samples, SHINERS can effectively avoid chemical interference and enhance the signal uniformly. However, to achieve optimal performance, the synthesis of high-quality core–shell nanoparticles with uniform size and shape becomes essential. Additionally, the optimization of shell thickness and material becomes necessary, varying according to different samples and wavelengths. SHINERS can be used to investigate the oxygen reduction reaction that occurs in metal–air batteries and to detect the intermediates and surface reactions of electrode materials in LIBs.42
When combined with AFM or STM, TERS can provide high-precision molecular fingerprints at nanometer resolution through a metalized probe tip scanning (Fig. 1d). TERS can enhance Raman scattering signals near the sharp tips of AFM or STM probes.43 In TERS, electrochemically etching the conductive STM tip or coating the insulating AFM tip with a metal can precisely confine the generated electromagnetic field to the plasma tip owing to the lightning rod effect and local surface plasmon resonance; this process improves the detection sensitivity of TERS to the single-molecule level and enhances the sensitivity (enhancement factor: 107).46 TERS is a powerful technique that merges scanning probe microscopy with SERS, enabling nanoscale spatial resolution and substantial signal enhancement. This capability makes it well-suited for imaging and characterizing nanostructures and biomolecules at the nanoscale. However, to achieve accurate and reliable results, it requires the fabrication of stable and reproducible metal tips with sharp apexes and appropriate plasmonic properties. Precise control of the tip-sample distance and alignment is crucial, and efforts must be made to avoid tip contamination and damage during the experimental process. Because of its nanometer spatial resolution, TERS can be used to determine the structure–function relationships in the interfaces and surfaces of electrodes; for example, it can be used to understand interface processes of SEI formation.47
2.3. Development
IS/O characterization involves measuring the tested materials under real-world conditions. For example, the evaluation of electrocatalysts in an electrolyzer or electrode/SE materials in a battery. In contrast to ex situ characterization techniques, the IS/O technique can be used to observe the compositional and morphological evolution of tested materials during physicochemical processes, thus enabling researchers to comprehensively understand the corresponding reaction mechanisms. IS/O-RS combines IS/O and RS—thus leveraging the advantages of both techniques—and has been applied to the research of LIBs and ASSLBs (Fig. 2). | ||
| Fig. 2 Timeline of IS/O-RS studies on LIBs and ASSLBs. (a) The first IS-RS cell. Reproduced with permission.48 Copyright 1995, Elsevier. (b) Cell used to investigate an LCO cathode. Reproduced with permission.49 Copyright 2000, Elsevier. (c) Cell used to investigate a S cathode. Reproduced with permission.50 Copyright 2013, The Electrochemical Society. (d) Cell used to investigate an electrode–SE interface. Reproduced with permission.44 Copyright 2017, American Chemical Society. (e) Cell used to investigate an NCM811–LPSC interface. Reproduced with permission.24 Copyright 2019, Wiley-VCH. (f) Cell used for HCOF-coupled Raman analysis. Reproduced with permission.51 Copyright 2022, Springer Nature. | ||
Inaba et al. invented the first IS-RS cell in 1996 by using a sealed glass bottle (Fig. 2a).48 Electrodes were glued to a stainless-steel current collector, and the surface of the working electrode was positioned as close to the glass bottle wall as possible to prevent the solvent from being scattered. Because the electrode materials (e.g., Li) were sensitive to humidity and oxygen, the cell was fabricated in a glove box filled with Ar. They used IS-RS to investigate the process of Li+ intercalation into natural graphite powder and highly ordered pyrolytic graphite; it was also used to examine the configuration of graphite intercalation compounds.
Novak et al.49 used IS-RS to measure the evolution of a LiCoO2 (LCO) cathode during charging (Fig. 2b). The thicknesses of the optical window and electrolyte layer were reduced to 0.1 and 0.2 mm, respectively, to optimize the IS-RS cells. In particular, the IS-RS cells were designed to provide optical access to either electrode. The optical access device for the anode was fixed on a Cu base and covered with a commercial separator. However, the optical access device for the cathode required an interchangeable electrode arranged on an Al base instead of a Cu base.
A study also used IS-RS to investigate the reaction mechanism of the S cathode in Li–S batteries.50 The IS-RS cell designed in the mentioned study was a rectangular, stainless-steel box with two windows (Fig. 2c). The windows were covered using microscopic glass with a thickness of 0.125 mm.50 A customized mold was used to create a rectangular separator and an electrode, which were placed in the chamber so that they maintained contact with stainless-steel strips. A spring maintained a specified pressure on the separator and electrode throughout the cell. IS-RS revealed that the presence of a variety of polysulfides depended on the cell's charging state; in each state of charge, the polysulfide monoanions and dianions were adjacent to one another.
Another study demonstrated IS-RS to be effective at evaluating the interface evolution of SEs and electrodes in a customized spectroelectrochemical cell (Fig. 2d).44 In this cell, an Au electrode was established to maintain contact with a key-shaped current collector made of steel. Two compressed silicone rings were used to separate the current collector from the cell body and optical window. Two O-rings were placed at the contact point to achieve a better seal. Subsequently, IS-RS was used to monitor the lithiation/delithiation of the Au electrode. Notably, the results indicated local Li+ depletion in the SEs, which led to the reduction of PS43− to P2S64−.
Zhang et al. used IS-RS to study the evolution of the LiNi0.8Co0.1Mn0.1O2 (NCM811)–Li6PS5Cl (LPSC) interface during charging in a customized spectroelectrochemical cell (Fig. 2e).24 The cell was designed to have a symmetrical structure to enable the observation of reactions occurring at the NCM811–LPSC interface during charging. The gap between the cell body and the optical window was sealed with high-vacuum silicone grease. The cell was assembled in an Ar-filled glove box before measurements were taken.
Another study fabricated a complex IS-RS cell by using a 10 cm-long hollow-core optical fiber (HCOF; Fig. 2f). The distal end of the HCOF was fixed between the electrodes of a pouch cell, and the proximal end of the HCOF was wrapped in a homemade, ultra-low-dead-volume microfluidic cell that was designed to allow light and liquid to enter the fiber. A two-layer polyethylene separator was used to prevent the HCOF from directly contacting the electrodes. The HCOF was optimized to guide light falling within the Raman wavelength range when it was filled with electrolytes. This type of apparatus can be used to monitor the extensive chemical changes that occur during electrolyte and SEI formation in the initial cycle of graphite|NCM cells.51
3. Applications of IS/O-RS in ASSLBs
For the convenience of readers, Table 1 includes the Raman shifts of typical electrode materials and SEs under the excitation wavelength of 532 nm.| Electrode materials or SEs | Raman shifts |
|---|---|
| LiFePO4 | 595, 1000, 1100 |
| LCO | 484, 593, 1080 |
| LiMn2O4 | 480, 600, 650, 700 |
| Li4Ti5O12 | 240, 300, 510, 660 |
| NCM811 | 485, 590, 1080 |
| S | 158, 220, 473 |
| Li2S | 220 |
| LGPS | 181, 287, 373, 433, 1559 |
| LPSC | 199, 268, 424, 574, 599 |
| C | 1350, 1580 |
3.1. Research on electrode–SE interfaces
The interfaces between electrodes and electrolytes are the most commonly discussed component of LIBs and ASSLBs because they play a leading role in redox reactions and a decisive role in the performance of the cells. However, developing stable interfaces is difficult in ASSLBs owing to problems such as the following: (1) side chemical and electrochemical reactions can occur between SEs and electrodes; (2) Li dendrite growth on LMA; (3) elemental diffusion and the space-charge layer can occur between SEs and cathodes; and (4) SEs have poor point-to-point contact with electrodes. A major reason why these problems are difficult to address is that examining the interfaces in ASSLBs is challenging because the interfaces have much smaller volume than SEs and electrodes. Among similar methods, IS/O-RS is the most effective technique for comprehensively monitoring the evolution of the electrode–SE interfaces during cell charging and discharging, such as the evolution of chemical bond vibrations and molecular fingerprints.33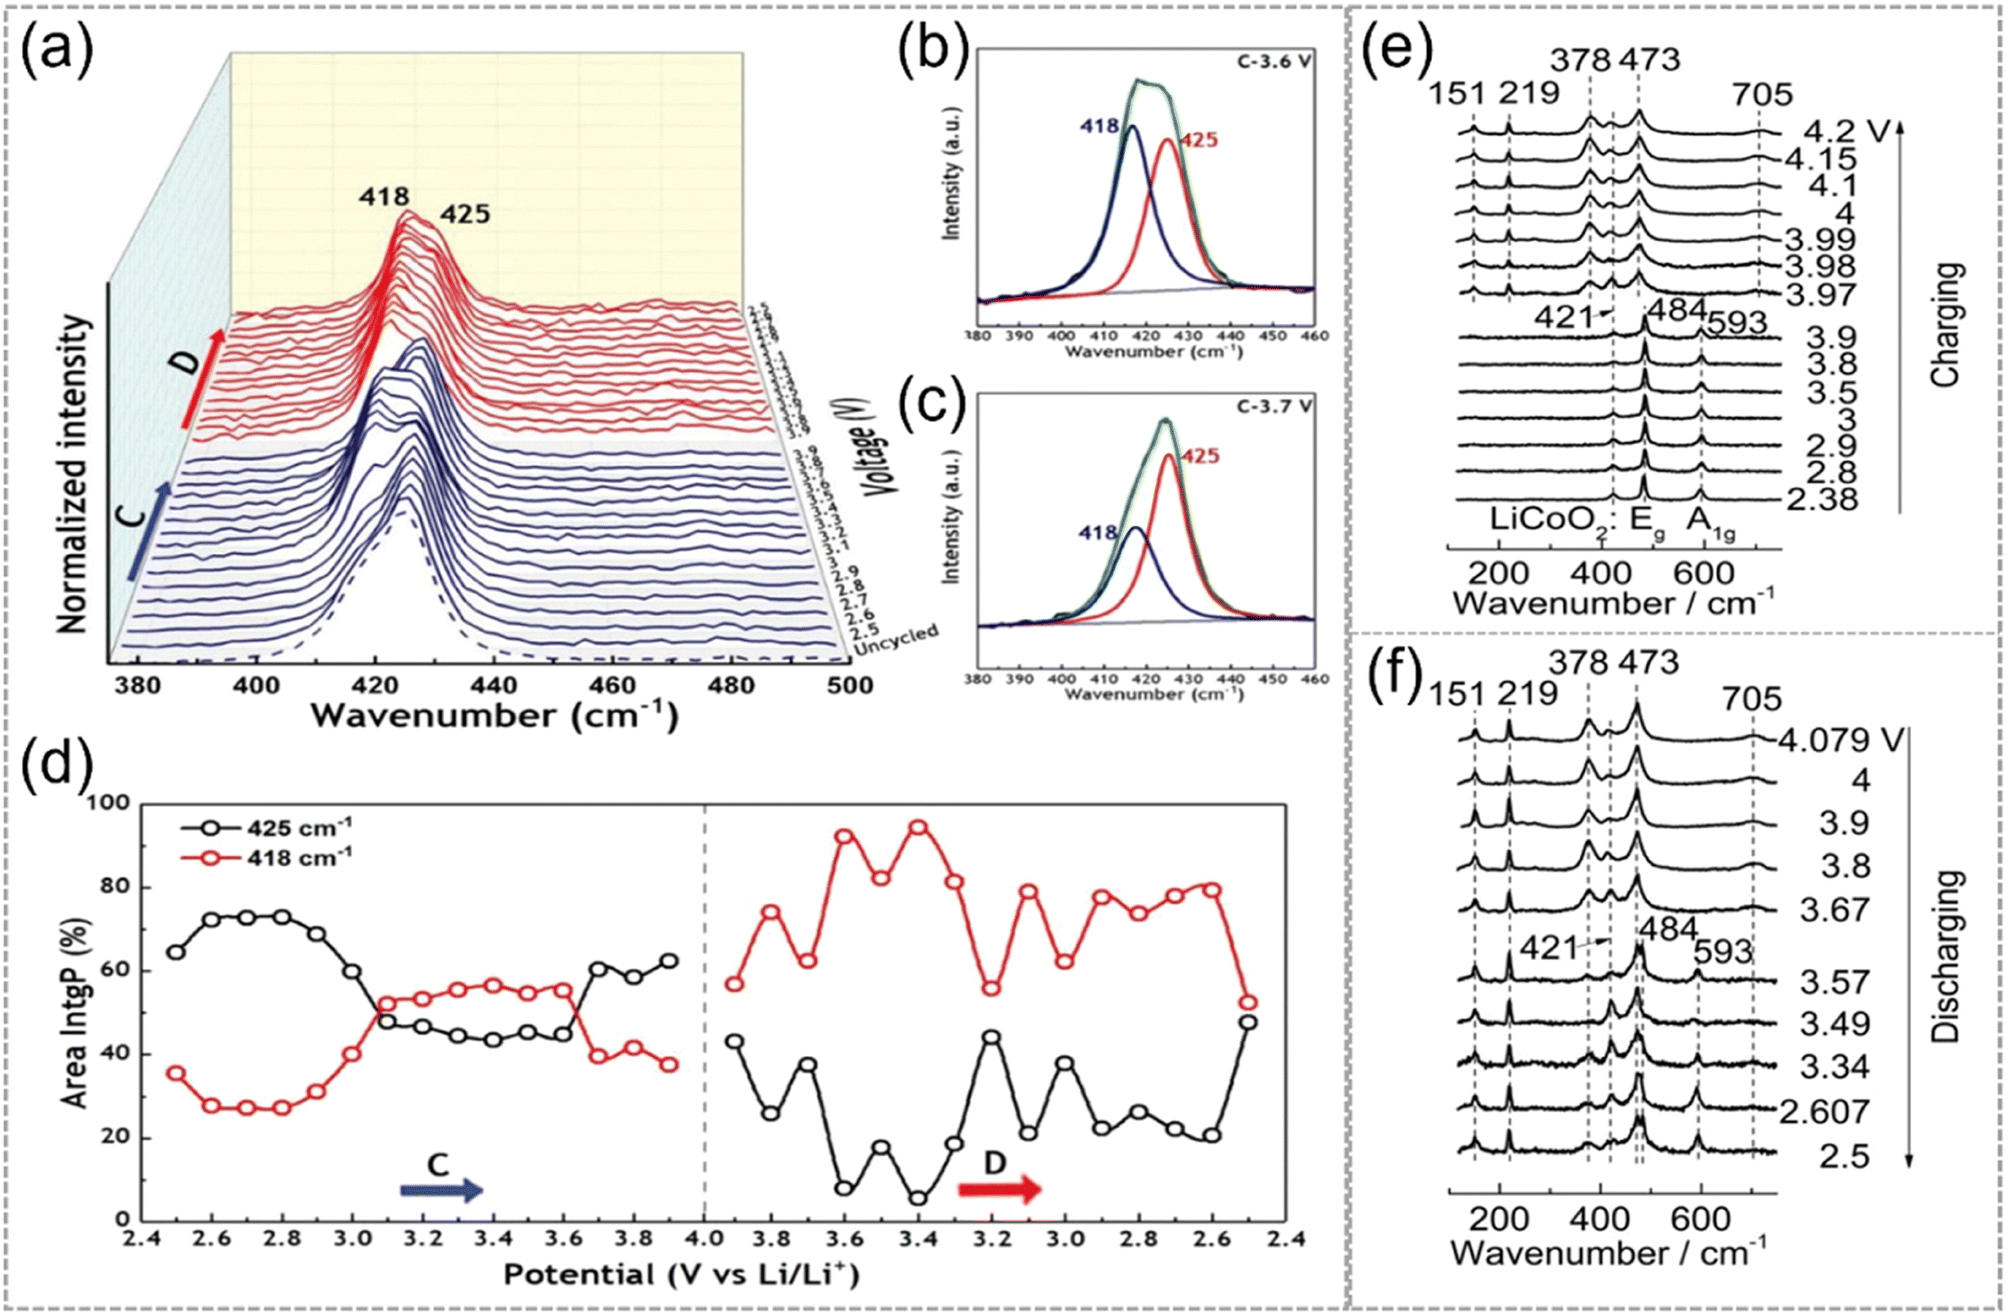 | ||
| Fig. 3 (a) IS-RS test of the NCM811−LPSC interface. (b, c) Fitting of Raman peaks. (d) Area percentages of Raman peaks at 425 and 418 cm−1. Reproduced with permission.24 Copyright 2019, Wiley-VCH. IS-RS test of the LCO–LPSC interface when the cell was (e) charged and (f) discharged. Reproduced with permission.28 Copyright 2020, Wiley-VCH. | ||
Another study used IS-RS to examine the evolution of the interface between LPSC and LCO (a high-voltage cathode). Three peaks were observed at the initial state of the LCO–LPSC interface (Fig. 3e); specifically, two peaks were observed at 593 and 484 cm−1 and were ascribed to A1g and Eg of LCO, respectively, and one peak was observed at 421 cm−1 and was ascribed to the PS43− vibration of LPSC. During charging, the intensity of the Eg and A1g peaks gradually decreased as the voltage increased; they disappeared when the voltage exceeded 3.97 V, indicating that Li-poor LixCoO2 (x < 1) formed with enhanced electronic conductivity.28 Moreover, two groups of peaks emerged when the voltage exceeded 3.97 V, which can be attributed to the generation of elemental S (151, 219, and 473 cm−1)54,55 and P2Sx (x = 5, 6, and 7; 378 and 705 cm−1); this demonstrated that LPSC had decomposed.56,57 The characteristic peaks of S and P2Sx always emerged in the subsequent discharge process (Fig. 3f), even when the voltage was reduced to 2.5 V. When the cell was discharged to 3.57 V, the A1g and Eg modes of LCO were restored to their initial states. The generation of P2Sx and S at the LPSC–LCO interface, as observed using IS-RS, was consistent with the results of XPS.58
The chemical stability between sulfide SEs and cathode materials can be estimated using time-dependent RS along with other characterization techniques. Li et al.59 conducted electrochemical impedance spectroscopy (EIS) and IS-RS to study the chemical compatibility of Li10GeP2S12 (LGPS) and Al-substituted LiNi0.85-xCo0.15AlxO2 (x = 0.25, 0.15, and 0.05). To prepare the samples, equal weights of cathode materials and LGPS were thoroughly mixed, pressed into pellets, and arranged for IS-RS and EIS tests. EIS results revealed that the resistance of the mixture increased over time (Fig. 4a–c), but this trend gradually slowed down as the amount of Al increased in the cathode materials (Fig. 4d), suggesting that the substitution of Ni with Al could enhance the stability of the interface between LiNi0.85-xCo0.15AlxO2 and LGPS. The Raman peaks of LGPS were located at 181, 287, 373, 433, and 1559 cm−1.59 For the LiNi0.8Co0.15Al0.05O2 (NCA005)/LGPS mixture, an extra Raman peak emerged at 1441 cm−1 after 60 min, and the intensity of this peak increased over time, signifying that NCA005 and LGPS are not chemically compatible (Fig. 4e). However, for the Al-rich LiNi0.6Co0.15Al0.25O2 (NCA025)/LGPS mixture, the peak at 1441 cm−1 was absent within 120 min and appeared at 150 min, indicating that Al substitution could not completely prevent side reactions at the interface (Fig. 4f). The Raman peak of LiNi0.85-xCo0.15AlxO2 (533 cm−1) could not be observed due to the overlapping peaks and weak peak intensity. The Raman peaks (<400 cm−1) of the other side products at the interface, such as NiS, LiPxCly, and LiCl, could also not be observed for the same reason.60,61
 | ||
| Fig. 4 (a–c) EIS spectra of LiNi0.85-xCo0.15AlxO2/LGPS mixtures. (d) Plots of resistance change. Raman spectra of (e) NCA005/LGPS and (f) NCA025/LGPS. Reproduced with permission.59 Copyright 2019, Elsevier. In situ Raman spectra of LPSC toward LCO (g) and LZPO-LCO (h) composite cathodes during the charge–discharge process. Reproduced with permission.62 Copyright 2021, Wiley-VCH. | ||
To prevent undesirable side reactions between cathode materials and sulfide SEs, Cui et al.62 developed a core–shell structural cathode material comprising a LCO core and a LiZr2(PO4)3 (LZPO) shell. They then evaluated the evolution of the cathode–LPSC interface using the IS-RS technique (Fig. 4g and h). The results revealed significant side reactions between the unmodified LCO cathode and LPSC during charging and discharging, leading to the generation of numerous decomposition products of LPSC. Consequently, the LPSC peak experienced continuous decomposition. In contrast, the interface between modified LZPO-LCO and LPSC displayed minimal decomposition products, and the LPSC peak remained stable without any attenuation. This finding highlighted the beneficial effect of the bidirectionally compatible buffering layer (i.e., LZPO) at the interface between LCO and LPSC during charging and discharging processes. The enhanced stability provided by the LZPO buffering layer had positive implications for the battery's performance, as it contributed to improved cycling life and rate capabilities.
In summary, the IS/O-RS technique proves highly effective for evaluating the evolution of the cathode interface in ASSLBs. Both inorganic (e.g., LCO, NCM, S) and organic (e.g., quinones) cathode materials exhibit clear Raman shift changes during the charge and discharge processes. Similarly, RS measurements can detect the oxidation decomposition of both inorganic (e.g., sulfide) and polymer (e.g., PEO) SEs.
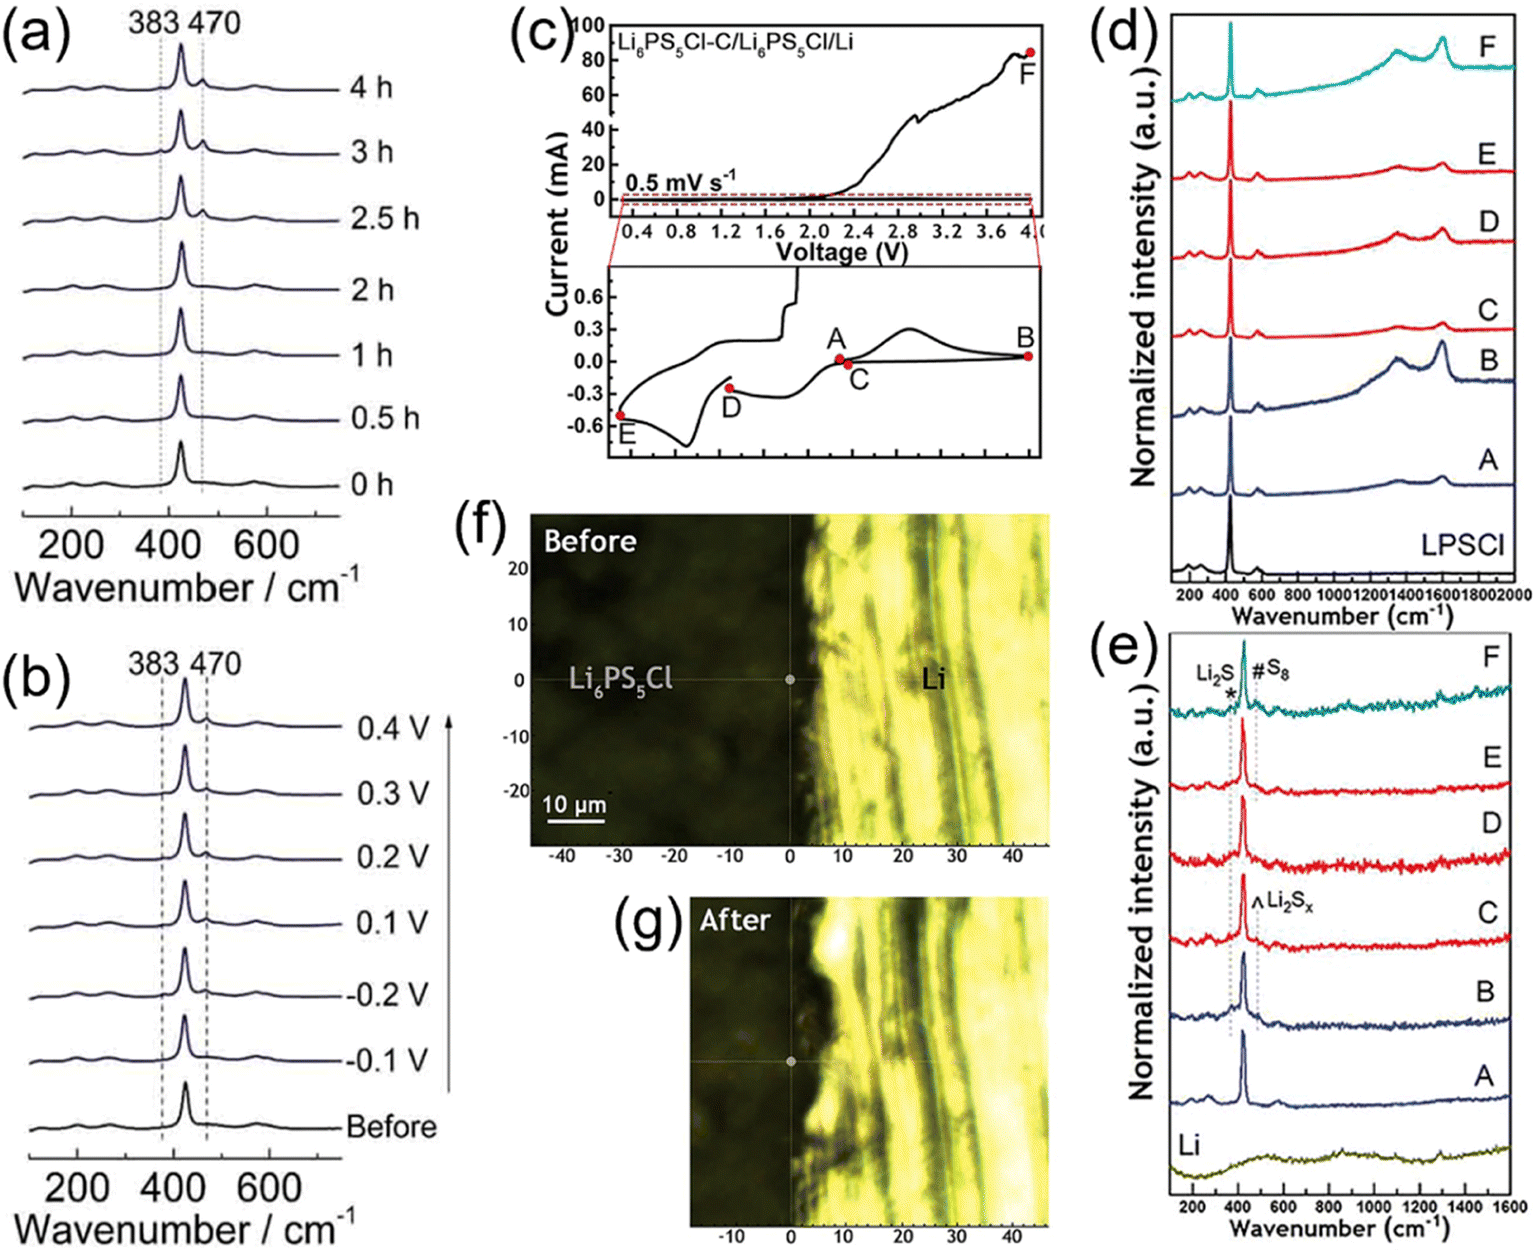 | ||
| Fig. 5 Raman spectra of the Li–LPSC interface under (a) constant potential at different times and (b) variable potentials. Reproduced with permission.28 Copyright 2020, Wiley-VCH. (c) CV curve of the Li|LPSC|LPSC-C cell. Raman spectra of the LPSC side (d) and Li side (e) at six typical potentials. Cross-sectional view of the optical micrographs of the interface before (f) and after (g) a CV test was conducted. Reproduced with permission.66 Copyright 2021, Wiley-VCH. | ||
Another study explored the evolution of the interface between LMA and LPSC by combining IS-RS and optical microscopy.66 Cyclic voltammetry (CV) was performed on a Li|LPSC|LPSC-C cell; several potentials were selected for the RS tests conducted on both the LMA and LPSC parts (Fig. 5c). The Raman spectra (Fig. 5d and e) indicated a weak peak at 374 cm−1 that was attributed to Li2S; peaks were also observed at 490 cm−1 (points F and E) and 474 cm−1 (points C and B) and were ascribed to the S–S stretching in Li2Sx and the S–S bending in S8,28,44 respectively. The formation of sulfides at the interface suggested that side reactions occurred between LMA and LPSC. Furthermore, the optical micrographs of the LMA–LPSC interface before and after cycling showed that Li dendrites moved into the SEs (Fig. 5f and g).
Hence, the IS/O-RS technique is particularly well-suited for evaluating the anode interface with inorganic SEs, especially for sulfide and halide SEs, given their poor reduction stability and the detectability of their decomposition products through RS. However, organic SEs show remarkable stability at the anode interface during cycling, making it challenging to obtain valuable information using this technique.
3.2. Research on electrodes
Monitoring the evolution of the molecular structure of electrode materials during cell charging and discharging can provide insight into electrochemical reaction mechanisms of these materials and why they degrade. IS/O-RS is an effective and sensitive technique for detecting the molecular structure of electrode materials, including conventional inorganic electrode materials,67 emerging electrode materials (e.g., S and Si), and some gas electrode materials (e.g., O2 and CO2).68 | ||
| Fig. 6 Schematic of IS-RS tests of the front (a) and back surfaces (b) of the LCO electrode in cells. Raman spectra of the front surface of LCO during cell charging (c) and discharging (d). Potential relationship of vibrational modes and their corresponding CV curves: A1g (e) and Eg (f) vibrational modes. Reproduced with permission.69 Copyright 2019, Elsevier. | ||
Another study used O-RS to investigate the electrochemical reaction mechanism of the S cathode in a sulfide SE-based ASSLB.72Fig. 7a displays the voltage–time profile of the cell used in this test and the operando Raman spectra of the S8 cathode. During cell discharging, the intensities of the S8 peaks (473, 220, and 158 cm−1) decreased gradually but did not reach zero, even at 1.2 V vs. Li/Li+. Moreover, no obvious new peak appeared during discharging. During charging, a new peak was generated at 438 cm−1, along with the stepwise enhancement of the S8 peaks, suggesting the formation of new substances in the Li2S oxidation process. These new substances were further explored conducting RS on the S8 cathode at different potentials, and the derived Raman spectra are illustrated in Fig. 7b and c (discharge process) and Fig. 7d and e (charge process). Notably, the S8 peaks remained even after the cell was discharged to 1.229 V vs. Li/Li+, suggesting the insufficient reaction of S8. When the cell was charged to 2.359 V vs. Li/Li+ (50% charged), a characteristic peak located at 438 cm−1 was observed and was ascribed to Li2S2. The intensity of this peak was observed to first increase and then decrease; it finally disappeared at 2.789 V vs. Li/Li+ (fully charged). The results showed that Li2S was first converted to Li2S2 and then transformed to S during the charging of the sulfide SE-based ASSLB.
 | ||
| Fig. 7 (a) Time-voltage profile of the sulfide SE-based ASS Li–S batteries and the corresponding operando Raman intensity mapping of the S cathode. Raman spectra of S cathode under cell discharging (b, c) and charging (d, e). Reproduced with permission.72 Copyright 2023, Wiley-VCH. | ||
IS-RS can be used to analyze the discharge products of a gas cathode, such as CO2. A study conducted IS-RS on an ASS Li–CO2 cell with a Li anode, polymer SE [poly(ethylene glycol)–poly(methacrylate)–LiClO4–SiO2], and multiwalled carbon nanotube cathode (Fig. 8a).68 An inlet hole was added to the cell for introducing CO2 that could participate in electrochemical reactions near the cathode, and an outlet hole was added to vent excess gas. The RS laser entered through a small hole covering the optical glass at the top of the cathode shell. Fig. 8b presents the IS-RS spectra obtained for the cathode. During cell discharging (red line), the peak intensities of Li2CO3 (1090 cm−1) and C (1350 and 1580 cm−1) increased gradually as the voltage decreased. Li2CO3 was derived from the reaction of CO2 and Li+ (from Li oxidation at the anode), and C originated from the reduction of CO2. Subsequently, during charging, the peak intensities of Li2CO3 and C were gradually weakened, signifying the degradation of Li2CO3 and oxidation of C. No other Raman peaks were observed, indicating that no side reactions occurred during cell charging and discharging. These results verified the electrochemical reaction mechanism: 4Li + 3CO2 = 2Li2CO3 + C.
 | ||
| Fig. 8 (a) Customized Li–CO2 cell subjected to IS-RS test. (b) Raman spectra of the cathode of Li–CO2 batteries. Reproduced with permission.68 Copyright 2017, Wiley-VCH. | ||
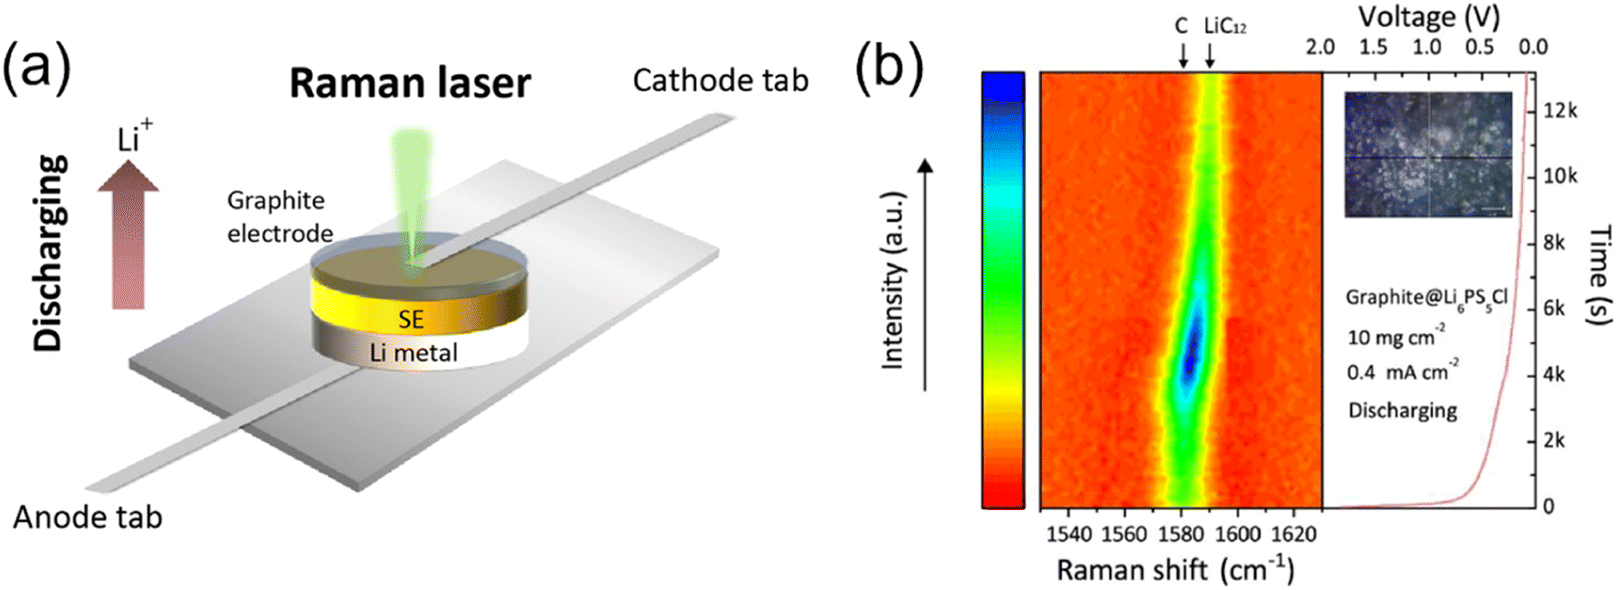 | ||
| Fig. 9 (a) Schematic of the O-RS test. (b) Raman spectra of graphite@LPSC anode. Reproduced with permission.73 Copyright 2022, Elsevier. | ||
3.3. Research on SEs
Exploring SEs can provide insight into the SE degradation that occurs during cell cycling, which can supplement the insight obtained from interfacial investigations that are conducted to analyze the side reactions between electrodes and SEs. IS/O-RS can be used to detect the structural evolution of SEs in real time.A study designed an innovative cell (Fig. 10a) to estimate the inoxidizability of LPSC. This cell comprised a Li anode, LPSC electrolyte, and LPSC/carbon composite cathode. Raman signals were collected from the cathode side through a glass window. LPSC oxidation was investigated using IS-RS during cell charging. The Raman spectra (Fig. 10b) indicated that the characteristic peaks of LPSC (203, 269, 428, 577, and 602 cm−1) disappeared gradually as the cell was charged. Three new peaks simultaneously emerged at 476, 223, and 156 cm−1, which were attributed to the S–S bond in elemental S and Li polysulfides. These results suggested that LPSC was unstable during cell charging and that PS43− in LPSC was easily oxidized to S0.75
 | ||
| Fig. 10 (a) Schematic of IS-RS cell. (b) Raman spectra of LPSC in different oxidation states. Reproduced with permission.75 Copyright 2019, American Chemical Society. (c) Raman spectra of prepared SSE before (top) and after (bottom) stripping and plating. Reproduced with permission.76 Copyright 2022, American Chemical Society. (d) Voltage profiles of Li|PEO–LiTFSI–1 wt% I2|LiFePO4 cell for IS-RS test and corresponding Raman spectra, (e) discharge process and (f) charge process. Reproduced with permission.77 Copyright 2021, Wiley-VCH. | ||
The stability of polymer SEs can also be evaluated using IS/O-RS measurement. For example, Ruffo et al.76 fabricated a Li|Li symmetric cell with PEO–TiO2–LiTFSI composite electrolytes. IS-RS was performed on this polymer SE during cycling. The Raman spectra showed the characteristic peaks of TiO2, PEO, and LiTFSI before and after cycling (Fig. 10c). As expected, the Raman shifts and intensities of these peaks remained after several cell cycles, suggesting that the PEO–TiO2–LiTFSI had high stability.
Furthermore, the IS/O-RS technique allows for the monitoring of structural changes in the fillers added to the polymer SEs during cycling. As shown in Fig. 10d–f, the investigation of I3− filler evolution in polymer SE (PEO–LiTFSI–1 wt% I2) was carried out during the charging and discharging process. To stabilize Li, a simple approach involving the in situ formation of LiI at the polymer SE–Li interphase was employed. Within the signal detecting range from 50 to 200 cm−1, a single peak at ≈120 cm−1 was observed, attributed to the symmetric stretching mode of the I3− structural unit. As the charging/discharging procedure progressed, the peak at 120 cm−1 gradually diminished, indicating the interaction of I3− with Li and Li2O to form an interfacial passivating layer of LiI and LiIO3.77
As mentioned earlier, the IS/O-RS technique proves valuable in deducing the structural changes of inorganic SEs during cycling, achieved by detecting their oxidation and reduction products resulting from the instability of these materials. Conversely, the high stability of organic SEs is evident through their consistent Raman spectra during charge and discharge processes. Moreover, the evolution of additives (fillers) in polymer SEs during cycling can be detected by IS/O-RS technique.
4. Conclusion and perspective
The key to developing high-capacity ASSLBs that have a long lifespan is to first understand their intrinsic failure mechanisms, which can be discovered using various IS/O characterization techniques. IS/O-RS is often used because it is simple to operate; does not damage samples; and has high sensitivity, fast signal acquisition, and high signal accuracy. In this review, we summarize IS/O-RS applications in research on ASSLBs. We first introduce four types of RS, namely conventional RS, SERS-based RS, SHINERS, and TERS, and the development of IS/O-RS. We then discuss various studies that employed IS/O-RS to explore the molecular structural and compositional evolution of electrode−SE interfaces, electrodes, and SEs in ASSLBs during cycling. This review demonstrates that IS/O-RS can be extensively used to estimate electrodes and SEs. In the reviewed studies, conventional electrodes (e.g., NCM, LCO, and graphite), emerging electrodes (e.g., Si, S, O2, and CO2), and organic electrodes all exhibited distinct characteristic Raman peaks whose positions and intensities transformed during cycling. RS was also used to detect SE decomposition and side reactions between SEs and electrodes with high sensitivity. We propose the following suggestions to broaden the application scope of RS and to help future studies obtain more accurate data when using RS to explore ASSLBs:(1) Before IS/O-RS is conducted on electrodes and SEs, ex situ RS tests must be performed first on the electrode and SE materials to clarify the Raman shifts of characteristic peaks. The characteristics of the electrodes, SEs, and cells, such as their shape, area, thickness, film-forming mode, and type of cell, should be optimized for testing. Moreover, a few interference Raman signals can be produced by auxiliary materials (e.g., current collector, conductive agents, binder, or even a residual solvent) and should thus be eliminated or replaced.
(2) A favorable cell design is crucial for IS/O-RS implementation and for obtaining the desired results. Conventional cells include an optical window that is parallel to the electrode–SE interface; through this window, a laser illuminates the front and back surfaces of the interface for Raman signal collection. However, these cells are not suitable for testing inorganic SE-based ASSLBs because the optical glass may crack under the adding pressure of the batteries. Therefore, a cell that can withstand higher pressure can be used for testing; in this type of cell, the optical window should be perpendicular to the electrode–SE interface, and the laser should be focused on the side of the electrode–SE interface for Raman signal collection.
(3) We expect that state-of-the-art RS, laser techniques, and IS/O techniques will continue to grow in popularity among researchers. Researchers must carefully choose a Raman spectrometer and incident laser wavelength that match the properties of the tested materials and the cell used in their studies. Moreover, artificial intelligence technology is becoming increasingly powerful and can be used for data collection and analysis.
(4) Although IS/O-RS is powerful, it is also restricted to analyze the evolution of the molecular structures of the electrodes and SEs. IS/O-RS can thus be combined with diverse IS/O techniques, such as SEM, TEM, AFM, STEM, XRD, XPS, XAS, FTIR, NMR, and DEMS, to comprehensively explore and understand the morphological and compositional evolution of electrodes and SEs during cell cycling and determine the degradation mechanism of cells. Thus, effective solutions to prevent cell failure can be created, and ASSLBs with high energy density and long cycle life can consequently be developed.
Conflicts of interest
There are no conflicts to declare.Acknowledgements
J. Z. thanks the support from Shanghai Pujiang Program (22PJ1408700). This work was financially supported by the National Natural Science Foundation of China (NSFC: 52173205, 51973114).References
- J. Lu and C. Xu, Chem, 2020, 6, 3165–3167 CAS.
- W. An, B. Gao, S. Mei, B. Xiang, J. Fu, L. Wang, Q. Zhang, P. K. Chu and K. Huo, Nat. Commun., 2019, 10, 1447 CrossRef PubMed.
- P. Albertus, S. Babinec, S. Litzelman and A. Newman, Nat. Energy, 2017, 3, 16–21 CrossRef.
- C. Zhao, G. L. Xu, Z. Yu, L. Zhang, I. Hwang, Y. X. Mo, Y. Ren, L. Cheng, C. J. Sun, Y. Ren, X. Zuo, J. T. Li, S. G. Sun, K. Amine and T. Zhao, Nat. Nanotechnol., 2021, 16, 166–173 CrossRef CAS PubMed.
- J.-H. Zuo and Y.-J. Gong, Tungsten, 2020, 2, 134–146 CrossRef.
- Z.-J. Cao, Y.-Z. Zhang, Y.-L.-S. Cui, B. Li and S.-B. Yang, Tungsten, 2020, 2, 162–175 CrossRef.
- J. Lu, S. Dey, I. Temprano, Y. Jin, C. Xu, Y. Shao and C. P. Grey, ACS Energy Lett., 2020, 5, 3681–3691 CrossRef CAS.
- T. Liu, J. P. Vivek, E. W. Zhao, J. Lei, N. Garcia-Araez and C. P. Grey, Chem. Rev., 2020, 120, 6558–6625 CrossRef CAS PubMed.
- H. Guo, G. Hou, L. Dai, Y. Yao, C. Wei, Z. Liang, P. Si and L. Ci, J. Phys. Chem. Lett., 2020, 11, 172–178 CrossRef CAS PubMed.
- L. Porz, T. Swamy, B. W. Sheldon, D. Rettenwander, T. Frömling, H. L. Thaman, S. Berendts, R. Uecker, W. C. Carter and Y. M. Chiang, Adv. Energy Mater., 2017, 7, 1701003 CrossRef.
- Z. Lu, J. Yu, J. Wu, M. B. Effat, S. C. T. Kwok, Y. Lyu, M. M. F. Yuen and F. Ciucci, Energy Storage Mater., 2019, 18, 311–319 CrossRef.
- Y. Zhu, X. He and Y. Mo, ACS Appl. Mater. Interfaces, 2015, 7, 23685–23693 CrossRef CAS PubMed.
- X. B. Cheng, R. Zhang, C. Z. Zhao and Q. Zhang, Chem. Rev., 2017, 117, 10403–10473 CrossRef CAS PubMed.
- M. Weiss, R. Ruess, J. Kasnatscheew, Y. Levartovsky, N. R. Levy, P. Minnmann, L. Stolz, T. Waldmann, M. Wohlfahrt-Mehrens, D. Aurbach, M. Winter, Y. Ein-Eli and J. Janek, Adv. Energy Mater., 2021, 11, 2101126 CrossRef CAS.
- C. Z. Zhao, Q. Zhao, X. Liu, J. Zheng, S. Stalin, Q. Zhang and L. A. Archer, Adv. Mater., 2020, 32, e1905629 CrossRef PubMed.
- H. Yuan, H.-J. Peng, J.-Q. Huang and Q. Zhang, Adv. Mater. Interfaces, 2019, 6, 1802046 CrossRef CAS.
- F. Yang, Y. Liu, T. Liu, Y. Wang, J. Nai, Z. Lin, H. Xu, D. Duan, K. Yue and X. Tao, Small Struct., 2022, 4, 2200122 CrossRef.
- F. Han, Y. Zhu, X. He, Y. Mo and C. Wang, Adv. Energy Mater., 2016, 6, 1501590 CrossRef.
- D. H. S. Tan, Y. T. Chen, H. Yang, W. Bao, B. Sreenarayanan, J. M. Doux, W. Li, B. Lu, S. Y. Ham, B. Sayahpour, J. Scharf, E. A. Wu, G. Deysher, H. E. Han, H. J. Hah, H. Jeong, J. B. Lee, Z. Chen and Y. S. Meng, Science, 2021, 373, 1494–1499 CrossRef CAS PubMed.
- J. Alvarado, M. A. Schroeder, T. P. Pollard, X. Wang, J. Z. Lee, M. Zhang, T. Wynn, M. Ding, O. Borodin, Y. S. Meng and K. Xu, Energy Environ. Sci., 2019, 12, 780–794 RSC.
- Y. Gao, Z. Yan, J. L. Gray, X. He, D. Wang, T. Chen, Q. Huang, Y. C. Li, H. Wang, S. H. Kim, T. E. Mallouk and D. Wang, Nat. Mater., 2019, 18, 384–389 CrossRef CAS PubMed.
- L. Wang, R. Xie, B. Chen, X. Yu, J. Ma, C. Li, Z. Hu, X. Sun, C. Xu, S. Dong, T.-S. Chan, J. Luo, G. Cui and L. Chen, Nat. Commun., 2020, 11, 5889 CrossRef CAS PubMed.
- F. Zhao, J. Liang, C. Yu, Q. Sun, X. Li, K. Adair, C. Wang, Y. Zhao, S. Zhang, W. Li, S. Deng, R. Li, Y. Huang, H. Huang, L. Zhang, S. Zhao, S. Lu and X. Sun, Adv. Energy Mater., 2020, 10, 1903422 CrossRef CAS.
- J. Zhang, C. Zheng, L. Li, Y. Xia, H. Huang, Y. Gan, C. Liang, X. He, X. Tao and W. Zhang, Adv. Energy Mater., 2020, 10, 1903311 CrossRef CAS.
- K. N. Wood, K. X. Steirer, S. E. Hafner, C. Ban, S. Santhanagopalan, S.-H. Lee and G. Teeter, Nat. Commun., 2018, 9, 2490 CrossRef PubMed.
- A. B. Gunnarsdottir, C. V. Amanchukwu, S. Menkin and C. P. Grey, J. Am. Chem. Soc., 2020, 142, 20814–20827 CrossRef CAS PubMed.
- Y. Yu, P. Karayaylali, D. Sokaras, L. Giordano, R. Kou, C.-J. Sun, F. Maglia, R. Jung, F. S. Gittleson and Y. Shao-Horn, Energy Environ. Sci., 2021, 14, 2322–2334 RSC.
- Y. Zhou, C. Doerrer, J. Kasemchainan, P. G. Bruce, M. Pasta and L. J. Hardwick, Batteries Supercaps, 2020, 3, 647–652 CrossRef CAS.
- Y. Yang, X. Liu, Z. Dai, F. Yuan, Y. Bando, D. Golberg and X. Wang, Adv. Mater., 2017, 29, 1606922 CrossRef PubMed.
- W. Zhu, D. Liu, A. Paolella, C. Gagnon, V. Gariepy, A. Vijh and K. Zaghib, Front. Energy Res., 2018, 6, 66 CrossRef.
- F. Gao, X.-D. Tian, J.-S. Lin, J.-C. Dong, X.-M. Lin and J.-F. Li, Nano Res., 2023, 16, 4855–4866 CrossRef CAS.
- L. Xue, Y. Li, A. Hu, M. Zhou, W. Chen, T. Lei, Y. Yan, J. Huang, C. Yang, X. Wang, Y. Hu and J. Xiong, Small Struct., 2022, 3, 2100170 CrossRef.
- J. Zhao, M. Cano, J. J. Giner-Casares, R. Luque and G. Xu, Energy Environ. Sci., 2020, 13, 2618–2656 RSC.
- D. Liu, Z. Shadike, R. Lin, K. Qian, H. Li, K. Li, S. Wang, Q. Yu, M. Liu, S. Ganapathy, X. Qin, Q.-H. Yang, M. Wagemaker, F. Kang, X.-Q. Yang and B. Li, Adv. Mater., 2019, 31, 1806620 CrossRef.
- Y. Matsuda, N. Kuwata, T. Okawa, A. Dorai, O. Kamishima and J. Kawamura, Solid State Ionics, 2019, 335, 7–14 CrossRef CAS.
- C. Wang, J. Liang, M. Jiang, X. Li, S. Mukherjee, K. Adair, M. Zheng, Y. Zhao, F. Zhao, S. Zhang, R. Li, H. Huang, S. Zhao, L. Zhang, S. Lu, C. V. Singh and X. Sun, Nano Energy, 2020, 76, 105015 CrossRef CAS.
- J.-Y. Lu, C.-Z. Ke, Z.-L. Gong, D.-P. Li, L.-J. Ci, L. Zhang and Q.-B. Zhang, Acta Phys. Sin., 2021, 70, 198102 CrossRef.
- R. Baddour-Hadjean and J.-P. Pereira-Ramos, Chem. Rev., 2010, 110, 1278–1319 CrossRef CAS.
- P. P. R. M. L. Harks, F. M. Mulder and P. H. L. Notten, J. Power Sources, 2015, 288, 92–105 CrossRef CAS.
- H. Okuda, R. J. Young, D. Wolverson, F. Tanaka, G. Yamamoto and T. Okabe, Carbon, 2018, 130, 178–184 CrossRef CAS.
- A. Prasad, A. Chaichi, A. Mahigir, S. P. Sahu, D. Ganta, G. Veronis and M. R. Gartia, Carbon, 2020, 157, 525–536 CrossRef CAS.
- T. A. Galloway and L. J. Hardwick, J. Phys. Chem. Lett., 2016, 7, 2119–2124 CrossRef CAS PubMed.
- Y. Wang and D. Chen, ACS Appl. Mater. Interfaces, 2022, 14, 23033–23055 CrossRef CAS PubMed.
- L. Sang, R. T. Haasch, A. A. Gewirth and R. G. Nuzzo, Chem. Mater., 2017, 29, 3029–3037 CrossRef CAS.
- I. M. Aldous and L. J. Hardwick, J. Phys. Chem. Lett., 2014, 5, 3924–3930 CrossRef CAS PubMed.
- D. Kurouski, A. Dazzi, R. Zenobi and A. Centrone, Chem. Soc. Rev., 2020, 49, 3315–3347 RSC.
- X. Wang, S. C. Huang, T. X. Huang, H. S. Su, J. H. Zhong, Z. C. Zeng, M. H. Li and B. Ren, Chem. Soc. Rev., 2017, 46, 4020–4041 RSC.
- M. Inaba, Y. Osa and Z. Ogumi, J. Electroanal. Chem., 1995, 383, 91–98 CrossRef.
- P. Novák, J. C. Panitz, F. Joho, M. Lanz, R. Imhof and M. Coluccia, J. Power Sources, 2000, 90, 52–58 CrossRef.
- M. Hagen, P. Schiffels, M. Hammer, S. Dörfler, J. Tübke, M. J. Hoffmann, H. Althues and S. Kaskel, J. Electrochem. Soc., 2013, 160, A1205–A1214 CrossRef CAS.
- E. Miele, W. M. Dose, I. Manyakin, M. H. Frosz, Z. Ruff, M. F. L. De Volder, C. P. Grey, J. J. Baumberg and T. G. Euser, Nat. Commun., 2022, 13, 1651 CrossRef CAS PubMed.
- L. Sang, K. L. Bassett, F. C. Castro, M. J. Young, L. Chen, R. T. Haasch, J. W. Elam, V. P. Dravid, R. G. Nuzzo and A. A. Gewirth, Chem. Mater., 2018, 30, 8747–8756 CrossRef CAS.
- T. Hakari, M. Deguchi, K. Mitsuhara, T. Ohta, K. Saito, Y. Orikasa, Y. Uchimoto, Y. Kowada, A. Hayashi and M. Tatsumisago, Chem. Mater., 2017, 29, 4768–4774 CrossRef CAS.
- S. N. White, Chem. Geol., 2009, 259, 240–252 CrossRef CAS.
- P. Boolchand, P. Chen and U. Vempati, J. Non-Cryst. Solids, 2009, 355, 1773–1785 CrossRef CAS.
- C. Dietrich, D. A. Weber, S. Culver, A. Senyshyn, S. J. Sedlmaier, S. Indris, J. Janek and W. G. Zeier, Inorg. Chem., 2017, 56, 6681–6687 CrossRef CAS PubMed.
- Q. Pang, X. Liang, A. Shyamsunder and L. F. Nazar, Joule, 2017, 1, 871–886 CrossRef CAS.
- J. Auvergniot, A. Cassel, J.-B. Ledeuil, V. Viallet, V. Seznec and R. Dedryvère, Chem. Mater., 2017, 29, 3883–3890 CrossRef CAS.
- X. Li, H. Guan, Z. Ma, M. Liang, D. Song, H. Zhang, X. Shi, C. Li, L. Jiao and L. Zhang, J. Energy Chem., 2020, 48, 195–202 CrossRef.
- S.-K. Jung, H. Gwon, S.-S. Lee, H. Kim, J. C. Lee, J. G. Chung, S. Y. Park, Y. Aihara and D. Im, J. Mater. Chem. A, 2019, 7, 22967–22976 RSC.
- F. Walther, R. Koerver, T. Fuchs, S. Ohno, J. Sann, M. Rohnke, W. G. Zeier and J. Janek, Chem. Mater., 2019, 31, 3745–3755 CrossRef CAS.
- L. Wang, X. Sun, J. Ma, B. Chen, C. Li, J. Li, L. Chang, X. Yu, T. S. Chan, Z. Hu, M. Noked and G. Cui, Adv. Energy Mater., 2021, 11, 2100881 CrossRef CAS.
- J. Nanda, G. Yang, T. Hou, D. N. Voylov, X. Li, R. E. Ruther, M. Naguib, K. Persson, G. M. Veith and A. P. Sokolov, Joule, 2019, 3, 2001–2019 CrossRef CAS.
- S. Wenzel, S. J. Sedlmaier, C. Dietrich, W. G. Zeier and J. Janek, Solid State Ionics, 2018, 318, 102–112 CrossRef CAS.
- T. Cheng, B. V. Merinov, S. Morozov and W. A. Goddard III, ACS Energy Lett., 2017, 2, 1454–1459 CrossRef CAS.
- C. Zheng, J. Zhang, Y. Xia, H. Huang, Y. Gan, C. Liang, X. He, X. Tao and W. Zhang, Small, 2021, 17, 2101326 CrossRef CAS PubMed.
- Y. X. Song, Y. Shi, J. Wan, B. Liu, L. J. Wan and R. Wen, Adv. Energy Mater., 2020, 10, 2000465 CrossRef CAS.
- X. Hu, Z. Li and J. Chen, Angew. Chem., Int. Ed., 2017, 129, 5879–5883 CrossRef.
- Y. Matsuda, N. Kuwata, T. Okawa, A. Dorai, O. Kamishima and J. Kawamura, Solid State Ionics, 2019, 335, 7–14 CrossRef CAS.
- M. Inaba, H. Yoshida and Z. Ogumi, J. Electrochem. Soc., 1995, 142, 20–26 CrossRef CAS.
- V. G. Hadjiev, M. N. Iliev and I. V. Vergilov, J. Phys. C: Solid State Phys., 1988, 21, L199–L201 CrossRef.
- D. Cao, X. Sun, F. Li, S. M. Bak, T. Ji, M. Geiwitz, K. S. Burch, Y. Du, G. Yang and H. Zhu, Angew. Chem., Int. Ed., 2023, 135, e202302363 CrossRef.
- Z. Zhang, J. Wang, Y. Jin, G. Liu, S. Yang and X. Yao, Energy Stor. Mater., 2023, 54, 845–853 Search PubMed.
- H. Nakagawa, Y. Domi, T. Doi, M. Ochida, S. Tsubouchi, T. Yamanaka, T. Abe and Z. Ogumi, J. Power Sources, 2013, 236, 138–144 CrossRef CAS.
- D. Cao, Y. Zhang, A. M. Nolan, X. Sun, C. Liu, J. Sheng, Y. Mo, Y. Wang and H. Zhu, Nano Lett., 2019, 20, 1483–1490 CrossRef PubMed.
- L. Mezzomo, R. Lorenzi, M. Mauri, R. Simonutti, M. D'Arienzo, T.-U. Wi, S. Ko, H.-W. Lee, L. Poggini, A. Caneschi, P. Mustarelli and R. Ruffo, Nano Lett., 2022, 22, 8509–8518 CrossRef CAS PubMed.
- O. Sheng, H. Hu, T. Liu, Z. Ju, G. Lu, Y. Liu, J. Nai, Y. Wang, W. Zhang and X. Tao, Adv. Funct. Mater., 2021, 32, 2111026 CrossRef.
| This journal is © The Royal Society of Chemistry 2023 |