
Reverse transcription-free digital-quantitative-PCR for microRNA analysis†
Hao T.
Mai
,
Brice C.
Vanness
and
Thomas H.
Linz
 *
*
Department of Chemistry, Wayne State University, 5101 Cass Ave, Detroit, MI 48202, USA. E-mail: tlinz@wayne.edu; Tel: +1 313-577-2580
First published on 31st May 2023
Abstract
MicroRNAs (miRNAs) are non-coding RNA sequences that regulate many biological processes and have become central targets of biomedical research. However, their naturally low abundances in biological samples necessitates the development of sensitive analytical techniques to conduct routine miRNA measurements in research laboratories. Digital PCR has the potential to meet this need because of its single-molecule detection capabilities, but PCR analyses of miRNAs are slowed by the ligation and reverse transcription steps first required to prepare samples. This report describes the development of a method to rapidly quantify miRNA in digital microwell arrays using base-stacking digital-quantitative-PCR (BS-dqPCR). BS-dqPCR expedites miRNA measurements by eliminating the need for ligation and reverse transcription steps, which reduces the time and cost compared to conventional miRNA PCR analyses. Under standard PCR thermocycling conditions, digital signals from miRNA samples were lower than expected, while signals from blanks were high. Therefore, a novel asymmetric thermocycling program was developed that maximized on-target signal from miRNA while minimizing non-specific amplification. The analytical response of BS-dqPCR was then evaluated over a range of miRNA concentrations. The digital PCR dimension increased in signal with increasing miRNA copy numbers. When the digital signal saturated, the quantitative PCR dimension readily discerned miRNA copy number differences. Overall, BS-dqPCR provides rapid, high-sensitivity measurements of miRNA over a wide dynamic range, which demonstrates its utility for routine miRNA analyses.
Introduction
MicroRNAs (miRNAs) are short non-coding RNAs that regulate gene expression.1 The binding of miRNAs to messenger RNAs silences protein translation and indirectly controls many biological processes such as cell proliferation and differentiation.2,3 Aberrant changes in miRNA concentrations have been correlated with numerous diseases including cancers,4 autoimmune,5 neurodegenerative,6 and inflammatory diseases.7 Due to the biomedical significance of miRNAs, research investigating their biological functions has increased in the last decade.8 Although many methods have been developed for measuring low-abundance miRNAs, there remains a need for more accessible technology to aid researchers conducting routine miRNA analyses. Analytical techniques must be cost- and time-effective, while providing high sensitivity for the target miRNAs.Quantitative PCR (qPCR) provides a good balance between sensitivity and cost for routine measurements of miRNAs, compared to techniques like next-generation sequencing.9–12 However, sample preparation for qPCR-based miRNA analysis methods is cumbersome,13 which detracts from its utility. miRNAs typically must first be ligated with poly(adenosine) using a poly(A) polymerase enzyme to extend the miRNA sequences in a sample.14,15 Reverse transcription (RT) then converts the extended miRNAs into complimentary DNAs (cDNAs) using a reverse transcriptase enzyme.15 cDNAs are then amplified by PCR using a DNA polymerase enzyme. The resulting double-stranded DNA products are detected with a fluorescent intercalating dye, whose signal is measured after each thermocycle. The cycle at which the fluorescence is detectable above the background is designated as the quantification cycle (Cq). Lower Cq values indicate higher miRNA concentrations in the original sample, as fewer thermocycles are needed to generate sufficient amplicon molecules for detection.16
The multiple sample preparation steps and distinct enzymes required for RT-qPCR of miRNAs increase the cost and complexity of the analysis. Additionally, systematic ligase-dependent biases can occur.17 Sequence-specific miRNA conformations influence ligation, resulting in under- or over-representation of certain miRNAs in the total cDNA products.18 This bias affects subsequent qPCR quantitation. Stem loop RT-qPCR provides a simplified approach for amplifying miRNAs that circumvents some of these issues. Stem loop primers are used to extend miRNA sequences, which obviates the need for ligation.13,19 However, a RT sample preparation step is still required. Besides challenges with ligation and RT, qPCR itself contributes to the biases of the analysis. In qPCR, a single contaminant or mis-priming event can be amplified, leading to false signal.20 Similarly, the presence of a PCR inhibitor can hinder the reaction, leading to underestimations of miRNA concentrations.21
To mitigate qPCR biases and enhance limits of detection, digital PCR (dPCR) can be used to quantify miRNAs.22,23 dPCR first partitions a bulk sample into >103 discrete ultralow-volume reactions. PCR is then performed on all partitions in parallel. Partitions containing even a single target molecule are amplified in the ultralow volume to produce a readily detectable fluorescence signal;24 these partitions are classified as digitally “active”. Partitions without a target molecule remain nonfluorescent after PCR and are classified as digitally “inactive”. The percentage of active partitions is proportional to the analyte concentration in the original sample, which is quantified by comparing the measured digital signal to the Poisson distribution.25 dPCR provides higher sensitivity and lower limits of detection than qPCR because individual molecules are counted within the ultralow reaction volumes.26,27 This performance cannot be achieved in qPCR because signal is diluted within the bulk reaction volume. dPCR also minimizes the effects of PCR inhibitors or contaminants on the analysis by partitioning these molecules into separate reactions.28,29 Although dPCR provides additional analytical benefits, it still requires multiple enzymes for ligation and RT to form cDNAs before samples can be analyzed.
Base-stacking PCR (BS-PCR) is an alternative miRNA analysis technique that eliminates sample preparation by obviating both poly(A) ligation and RT.30,31 Rather than using multiple enzymes to extend miRNA sequences and convert miRNAs into cDNAs, BS-PCR uses miRNA to catalyze the amplification of a DNA guide; this technique requires only a single DNA polymerase to complete the PCR reaction. BS-PCR begins with the assembly of a three-component base-stacking complex (BS-complex): a single-stranded DNA guide with a complementary region to the target miRNA (Fig. 1, orange), the target miRNA (Fig. 1, blue), and a forward primer (Fig. 1, black/green) with only five complementary nucleotides to the DNA guide (Fig. 1, black). In the absence of the target miRNA, the forward primer does not have sufficient binding energy to anneal to the DNA guide. However, hybridization of the miRNA onto the DNA guide stabilizes annealing of the forward primer to the DNA guide. This occurs due to pi–pi stacking interactions between the 3′ end of the primer and the 5′ end of the miRNA.32 This BS-complex (Fig. 1, anneal ii) is then extended by a DNA polymerase to form a full-length amplicon (Fig. 1, red/black/green), which can be amplified by standard PCR in subsequent cycles.
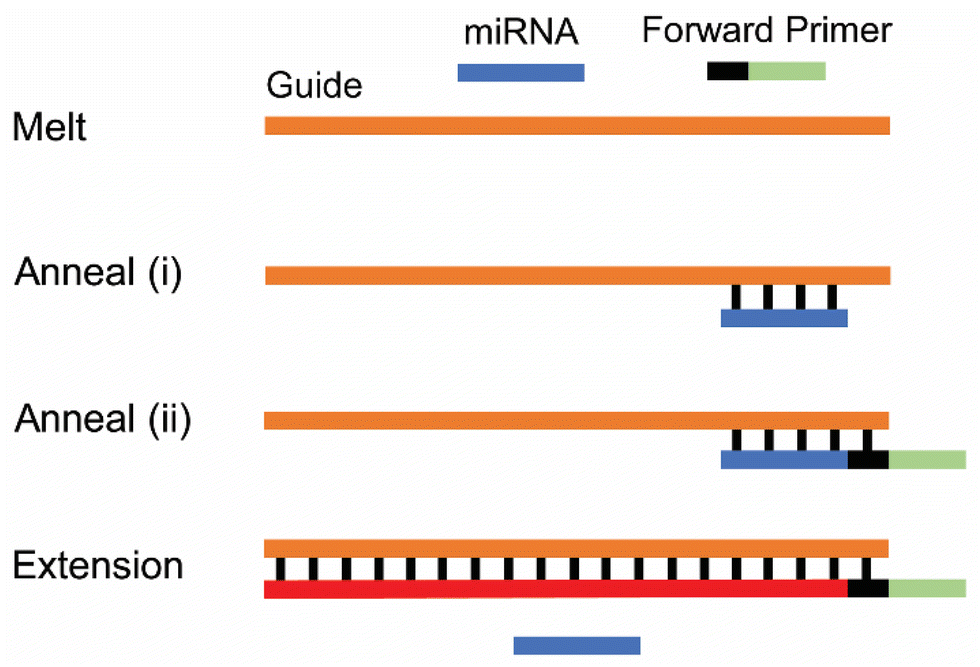 | ||
| Fig. 1 Cartoon showing the sequential steps in cycle 1 of BS-PCR. All components are first sealed into individual microwells, and PCR is then initiated. After melting, miRNA (blue) anneals to the DNA guide (orange), which stabilizes annealing of forward primer (black/green) to the guide. DNA polymerase binds to this base-stacking complex, displaces the miRNA, and extends the guide sequence into a full-length amplicon (red/black/green). | ||
BS-PCR has the potential to provide a simple and rapid means of amplifying miRNAs; however, it is seldom used because of the pervasive non-specific amplification observed. Low-concentration standards exhibit Cq values similar to the blank.30 This non-specificity precludes use in single-molecule digital assays because every reaction partition would be active with no way of discerning true positives from false positives. This manuscript reports the development of a base-stacking digital-quantitative-PCR (BS-dqPCR) method to accurately measure miRNAs in a high-sensitivity digital assay. A digital microwell array platform was developed to amplify miRNA while obviating the ligation and RT steps required by conventional miRNA PCR methods. Thermocycling conditions were optimized to analyze the miRNA let-7a with high sensitivity and low non-specific amplification. The quantitative response of BS-dqPCR was then assessed. dPCR signal increased with increasing let-7a concentrations while qPCR Cq values decreased, similar to theoretical expectations. The BS-dqPCR method developed here provides simple and sensitive detection of miRNA with minimal sample preparation. This work lays the foundation for a rapid, cost-effective platform for researchers requiring routine high-sensitivity miRNA analyses.
Experimental
Chemical reagents
Nuclease-free water, DNA guide, let-7a miRNA, and PCR primers (Table S1†) were purchased from Integrated DNA Technologies (Coralville, IA). PCR master mix (Table S2†) was obtained from KAPA Biosystems (Wilmington, MA). Tris-hydrochloride, 10× tris-buffered saline, 10% bovine serum albumin, Tween 20, Dynabeads M-270 streptavidin, ethanol, 10![[thin space (1/6-em)]](https://www.rsc.org/images/entities/char_2009.gif) 000× SYBR Green, trichloro(octyl) silane, and 5% buffered oxide etchant were purchased from ThermoFisher Scientific (Waltham, MA). Hexamethyldisilazane was obtained from Integrated Micro Materials (Argyle, TX). PRS 2000 was purchased from Mays Chemical (Indianapolis, IN). Ammonium hydroxide and hydrogen peroxide were obtained from Millipore Sigma (St Louis, MO). Vacuum pump oil was acquired from VWR (Radnor, PA).
000× SYBR Green, trichloro(octyl) silane, and 5% buffered oxide etchant were purchased from ThermoFisher Scientific (Waltham, MA). Hexamethyldisilazane was obtained from Integrated Micro Materials (Argyle, TX). PRS 2000 was purchased from Mays Chemical (Indianapolis, IN). Ammonium hydroxide and hydrogen peroxide were obtained from Millipore Sigma (St Louis, MO). Vacuum pump oil was acquired from VWR (Radnor, PA).
Microfluidic microwell array fabrication
Detailed descriptions of the microfabrication procedure have been previously reported by our group.33 Briefly, microwell features were patterned onto silicon wafers (University Wafer, Boston, MA) using photolithography.34 Wafers were then subjected to deep reactive ion etching (SPTS Technologies, Newport, UK) to create recessed wells in the silicon. The final depths of the microwells were measured to be 4 μm using a profilometer (Bruker, Billerica, MA). Scanning electron microscope (SEM) (JEOL, Peabody, MA) images showed that the microwells had 3 μm bead-loading circles adjoined to 8 × 1.3 μm signal acquisition rectangles (Fig. 2A). Fluidic domes (Fig. S1A†) were patterned onto glass (S.I. Howard Glass, Worcester, MA) by photolithography and then etched to a depth of 20 μm using buffered oxide etchant. Glass and silicon substrates were cleaned in a base piranha solution (5:1:1 water:ammonium hydroxide:30% hydrogen peroxide) for 15 min at 60 °C. Substrates were then baked for 10 min at 110 °C and cleaned with an oxygen plasma (Plasma Etch, Carson City, NV). Both substrates were silanized with trichloro(octyl) silane under vacuum at 110 °C for 1 h. Glass and silicon substrates were then diced into individual units and epoxied together to form the final microwell array devices (Fig. S1B†).
 | ||
| Fig. 2 (A) Top-down SEM image of a region of a microwell array at 4000× magnification. (B) Tilted SEM image of an array device loaded with beads at 4000× magnification. The dimensions of the microwells permit only a single bead to be loaded into each microwell. (C) Top-down fluorescence image of a region of a microwell array after BS-PCR at 8× magnification. The autofluorescence of beads is observed in every loaded microwell. Microwells originally containing a target miRNA also exhibit fluorescence in the signal acquisition region after BS-PCR amplification. | ||
Microfluidic dqPCR analysis
Biotinylated DNA guides were conjugated onto streptavidin-coated beads (2.8 μm diameter) using our previously established protocol.33,35 The conjugation density of DNA guides was varied between 3000 and 3000000 molecules per bead. Microfluidic microwell arrays were conditioned with ethanol, water, and loading buffer (Table S2†). Guide-conjugated beads were then loaded into array devices using a magnet to draw beads into the microwells (Scheme 1A). Microwells were engineered with dimensions to only contain a single bead (Fig. 2B). The volumes of a microwell and a bead are 80 fL and 10 fL, respectively. PCR master mix was vacuumed into devices and allowed to sit for 3 min to enable master mix to passively diffuse into the microwells (Scheme 1B). Loaded microwells were then sealed with oil to create discrete reaction partitions (Scheme 1C). The hydrophobic silane surface treatment step during fabrication was included to aid device sealing by preventing the aqueous contents of multiple microwells from coalescing together.
 | ||
| Scheme 1 Side-view cartoon illustrating the steps of a BS-PCR assay (sizes not to scale). (A) Beads conjugated with DNA guides are loaded into microwells. (B) PCR master mix containing the target miRNA and primers is introduced into the device. (C) Loaded microwells are sealed with oil to create individual reaction partitions. (D) The PCR hot-start step simultaneously activates the PCR polymerase (as in conventional PCR) and releases DNA guides into solution within the individually sealed microwells. | ||
PCR was performed on an AZ100 epifluorescence microscope (Nikon Instruments, Melville, NY) with a custom thermocycling stage.33,35 The PCR thermocycling program contained a 30 s hot-start step at 94 °C (Scheme 1D), a 6 s melting step at 94 °C, a variable annealing step (reported in the Results and discussion), and a 10 s extension step at 69 °C. A total of 35 PCR cycles were performed for each analysis. Fluorescence images of devices (Fig. 2C) were acquired after every PCR thermocycling step for 1 s at 470/525 nm and 8× magnification. An Andor Zyla sCMOS camera (Oxford Instruments, Smyrna, TN) and a Sola SE light source (Lumencor, Beaverton, OR) were used to collect the images. dPCR digital signal was calculated as the percentage of active microwells at the end of the 35 cycles. Microwells were designated as active if their fluorescence was observable above the device background (S/N >1.03). qPCR curves were obtained by plotting the average signal from all active microwells at each PCR thermocycle. All analyses were performed in triplicate with n > 10000 total analyzed beads per replicate. Figures in the manuscript plot the average signal from these n = 3 analyses with error bars depicting ±1 standard deviation.
Conventional qPCR analysis
qPCR was performed on a QuantStudio™ 12K Flex Real-Time PCR system (ThermoFisher Scientific). 20 μL of PCR master mix (Table S2†) was added into a MicroAmp Optical 96-Well Reaction Plate (ThermoFisher Scientific). A qPCR thermocycling program recommended by the manufacturer was used for analysis, which was similar to the program previously used for BS-qPCR.30 Thermocycling contained a 180 s hot-start step at 95 °C, 40 cycles of a 1 s melting step at 95 °C, and a 30 s combined annealing and extension step at 60 °C. qPCR curves at each let-7a concentration were measured in triplicate, and normalized to the lowest fluorescence intensity. Cq values were automatically determined by the instrument software.Results and discussion
Optimizing guide concentration
BS-PCR has been previously employed to analyze bulk miRNA samples, using qPCR for analyte quantitation.30 However, optimal PCR conditions in bulk assays (e.g. 20 μL) often differ significantly from those in digital assays (e.g. 70 fL). The 108-fold lower reaction volume necessitates higher reagent concentrations to ensure sufficient numbers of molecules are loaded into each digital reaction partition. The 103-fold higher surface area-to-volume ratio in digital assays also accentuates surface adsorption issues that may cause PCR inhibition. Therefore, translating BS-PCR assays into a digital format requires optimization of reagent concentrations and PCR conditions to attain robust performance. Let-7a was selected as the model miRNA in these studies because of its important roles in cell proliferation and various disease pathways.36,37The first method optimization parameter that was evaluated was the number of DNA guides available in each reaction to ensure robust formation of the BS-complex (Fig. 1, anneal ii). More DNA guides per reaction increases the efficiency of BS-PCR by providing more opportunities for the miRNA and forward primer to hybridize to a DNA guide and trigger RT-free amplification. However, too many DNA guides leads to non-specific amplification, causing false positive signals. A balance must be struck to maximize on-target signal while minimizing non-specific amplification. Cursory calculations determined that it was cost-prohibitive to add DNA guides directly into the PCR master mix because of excessive reagent consumption. Therefore, guides were biotinylated and conjugated to streptavidin beads to enable their controlled delivery into the microwells. A two-tiered signal response was sought for method optimization, where all microwells were either active or inactive. To achieve this, positive controls were prepared by adding let-7a to the PCR master mix at 4 copies of miRNA per microwell. Negative controls only contained master mix without miRNA. Positive and negative controls were expected to provide 98% and 0% digital signal, respectively, as predicted by the Poisson distribution.38,39
Digital signal was measured from positive and negative controls using between 3000 and 3000000 guides/bead. At 3000 and 30000 guides/bead, the percentage of active wells for both positive and negative controls were near zero and indistinguishable from each other (Fig. 3). Digital signal increased when using 300000 guides/bead but then plateaued, with no further improvements at 3000000 guides/bead. The highest ratio between the digital signal from the positive control and negative control (P/N ratio) occurred using 300000 guides/bead. However, even at this optimal guide number, considerable digital signal was observed in the negative control. This suggests significant non-specific priming of the DNA guides occurred in the absence of miRNA. This result is surprising given that the forward primer only has five complementary nucleotides to the DNA guide. The melting temperature of primer-guide binding is computationally predicted to be −5 °C (Visual Oligonucleotide Modeling Platform, DNA Software, Plymouth, MI); thus, no binding should occur at 58 °C. But the prevalence of false positives in the experimental results suggests that transient hybridization of the primer to the guide occurs at a sufficient frequency to be amplified, which is attributed to the relatively high reagent concentrations. However, this result is consistent with the previous BS-PCR report that observed ubiquitous non-specific amplification,30 which would manifest as 100% activity in digital assays. Although false positives in this study did not saturate the digital array, their high rate still limits the sensitivity of a digital BS-PCR assay, so further method optimization was needed.
 | ||
| Fig. 3 DNA guide number was evaluated by measuring the digital signal from positive controls (4 copies of let-7a per microwell) and negative controls (0 copies of let-7a per microwell). Increasing guide numbers yielded more base-stacking complex in the positive controls but also caused more non-specific amplification in the negative controls. A 58 °C PCR annealing temperature was used in this study. | ||
Optimizing annealing temperature
Annealing temperature is often the main parameter in PCR optimization because it is crucial to the success and stringency of amplification. The importance of the annealing step is accentuated in BS-PCR because both the miRNA and forward primer must hybridize to the DNA guide. Given the high rates of false positives observed during the guide optimization study, non-specific binding between the forward primers and DNA guides in the absence of miRNA likely occurred because the annealing temperature was too low. However, annealing temperatures must be finely tuned as excessively high temperatures can decrease PCR yield by preventing on-target hybridization and negatively affect the efficiency of the assay.Thermocycling programs with annealing temperatures between 53 °C and 69 °C were evaluated using 300000 guides/bead. Digital signals for both positive and negative controls were observed to decrease as annealing temperature increased. Binding between primers and guides became less stable at higher temperatures, lowering the probability of a successful extension event (Fig. S2†). Interestingly, while digital signal from the negative control decreased gradually over this temperature range, signal from the positive control decreased sharply at 60 °C, suggesting dissociation of the on-target BS-complex. The highest P/N ratio occurred at 58 °C; however, the positive control still underperformed its predicted 98% activity because of inefficient hybridization between the DNA guide, miRNA, and forward primer. Similarly, the negative control exhibited prohibitively high digital signal at 58 °C, which was attributed to the extension of transient primer-guide hybrids due to the high reagent concentrations in the microwells.
Asymmetric thermocycling
The annealing temperature study revealed a high rate of false positives at all temperatures, except 69 °C where signal from the positive control was near zero and indistinguishable from the negative control. To increase the signal from the positive control without increasing signal from the negative control, an asymmetric thermocycling strategy was evaluated. In conventional PCR, the time and temperature of the melting, annealing, and extension steps are kept constant throughout each cycle. However, this scheme may be inappropriate for BS-PCR where the first cycle requires additional considerations. The BS-complex must first be assembled in cycle 1 to be extended by the polymerase and produce a full-length amplicon (Fig. 1). Once this product has been produced, it can be amplified by conventional PCR. We hypothesized that the P/N ratio could be increased by tailoring conditions in cycle 1 to facilitate the formation of the BS-complex. Specifically, increasing the time (long-start) or reducing the temperature (cold-start) in cycle 1 would favor BS-complex assembly to promote on-target amplification. The thermocycling conditions could then be altered in cycles 2–35 to reduce the probability of non-specific amplification in subsequent cycles.The cycle 1 annealing time was first evaluated to determine if a long-start could increase on-target BS-PCR amplification. The results showed that the digital signal was indistinguishable between positive and negative controls with a long-start up to 600 s (Fig. S3A†). A 69 °C annealing temperature was used for these experiments because the negative control in the annealing study above did not produce signal, but this temperature may have been prohibitively high. Therefore, a second long-start study was performed at an annealing temperature of 65 °C to make hybridization more favorable. However, similar trends were observed where digital signals from positive and negative controls were indistinguishable, regardless of the annealing time at cycle 1 (Fig. S3B†). These results demonstrated that kinetic factors alone were not responsible for the low BS-PCR amplification efficiency, as providing more time for the BS-complex to form did not increase on-target signal.
Next, the effect of decreasing the cycle 1 annealing temperature was investigated to promote formation of the BS-complex. Computational calculations predicted that the guide had a stable secondary structure with a melting temperature of 47 °C. To ensure self-annealing of the guide did not hinder assembly of the BS-complex, the lowest cold-start temperature evaluated was 46 °C. Among cold-starts between 46 °C and 69 °C, two conditions at 53 °C and 58 °C produced higher digital signal for positive controls than for negative controls (Fig. S4†). However, on-target signal remained significantly lower than expected, suggesting that lowering the cycle 1 annealing temperature alone was insufficient to increase the response of the positive control. However, when both cold-start and long-start were combined into a single program, an improved response was observed (Fig. 4). The program using a 300 s long-start combined with a 53 °C cold-start achieved the greatest performance, with a P/N ratio of 3.8. These empirical optimizations demonstrate that the BS-complex requires both longer times and colder temperatures to promote assembly of the guide, miRNA, and primer. However, even with this enhanced performance, positive controls remained underactive compared to their theoretical values while negative controls were overactive.
 | ||
| Fig. 4 The cycle 1 annealing time and temperature were evaluated to determine their combined effect on the digital signal of a BS-PCR assay. The highest P/N ratio was attained using a cold-long-start where the cycle 1 annealing time was 300 s and the temperature was 53 °C. Annealing for cycles 2–35 occurred at 69 °C. | ||
A benefit of microwell arrays over other digital assay formats is that qPCR data can be collected in parallel with dPCR data.34,35 Thus far, only the digital signal has been considered in our method optimization, so we next examined the qPCR dimension, which revealed insightful findings. qPCR curves of active microwells from positive and negative controls were obtained for the best uniform (annealing at 58 °C for 20 s) and asymmetric (cycle 1 annealing at 53 °C for 300 s and cycles 2–35 at 69 °C for 20 s) thermocycling programs. Under conventional uniform thermocycling, the negative and positive controls were indistinguishable from each other, having the same Cq of 27 (Fig. 5, dashed lines). However, using the cold-long-start thermocycling program, the positive control exhibited a Cq of 13 (Fig. 5, solid green line), shifting 14 cycles earlier compared to uniform thermocycling. This Cq shift indicated more efficient amplification, demonstrating the benefits of the cold-long-start program. The negative control also experienced a Cq shift with a cold-long-start (Fig. 5, solid gray line), but the majority of active microwells appeared at later cycles. These false positives could be eliminated from the assay by ending PCR at cycle 17. Although some active microwells from the positive control are sacrificed, conducting fewer PCR thermocycles increased the P/N from 3.8 to 9.7 and reduced the analysis time to 15 min. Assays using the cold-long-start program also exhibited active wells with higher analog fluorescence. This higher signal-to-noise enabled digitally active and inactive microwells to be more easily assigned and aided in the determination of Cq values.
 | ||
| Fig. 5 qPCR curves for positive controls (green) and negative controls (gray) using uniform thermocycling (dashed lines) with annealing at 58 °C for 20 s and asymmetric thermocycling (solid lines) with a 300 s long-start combined with a 53 °C cold-start for cycle 1 and annealing at 69 °C for 20 s for cycles 2–35. Each trace depicts the average fluorescence from all active wells at each thermocycle. | ||
Quantifying let-7a with BS-dqPCR
The optimized BS-dqPCR method above produced a high P/N ratio, although digital signals were lower than theoretical predictions. We attribute these results to incomplete diffusion of miRNA from the bulk master mix solution into the microwells (Scheme 1B) over the short time provided for device loading. However, even if reagent concentrations did not reach equilibrium between the bulk and the microwells, proportional concentration-dependent responses should still be observed. Thus, the quantitative performance of BS-dqPCR was evaluated by analyzing a series of miRNA concentrations using the optimal asymmetric thermocycling program established above (cycle 1 annealing at 53 °C for 300 s and cycles 2–35 at 69 °C for 20 s). Digital signals were found to increase between 0 and 50 copies per microwell (Fig. 6A, blue), proving BS-PCR digital signal is concentration dependent. No digital signal change was observed between 50 and 500 copies per microwell because the digital signal saturated at these high concentrations. However, 50 and 500 copies per microwell were discernable using Cq values from the qPCR dimension (Fig. 6A, red). A two-cycle shift in Cq was observed between 50 and 500 copies of let-7a per microwell. This is below the expected three-cycle shift, but the general trend of higher miRNA copy numbers shifting Cq values to earlier cycles matches with theoretical predictions. The limit of detection for this free-solution BS-dqPCR assay was found to be 0.26 copies per well. Performance will be improved in future studies by introducing a capture step to preconcentrate miRNA onto beads rather than relying on passive diffusion of miRNA molecules into microwells. This bead capture approach has been reported to improve LODs 103-fold in the analysis of proteins;40,41 similar performance gains are expected for miRNAs. | ||
| Fig. 6 (A) Digital signal (blue circles) and Cq values (red triangles) from BS-PCR were measured over a range of let-7a copy numbers in microfluidic microwell arrays. Concentration-dependent responses are observed in both the dPCR and qPCR dimensions. (B) Cq values from bulk BS-qPCR analyses over a range of let-7a copy numbers analyzed using a commercial qPCR instrument. A concentration-dependent response was not observed over this broad concentration range. | ||
We sought to benchmark the quantitative performance of the microfluidic assay against a bulk analysis using a commercial qPCR instrument. Cq values were measured from samples containing between 0 and 1010 let-7a copies per reaction (Fig. S5†) based on the concentrations used in the previous BS-qPCR report.30 All Cq values from bulk qPCR assays were indistinguishable from one another and from the blank (Fig. 6B). This suggests that signal obtained from bulk BS-qPCR was not produced by the let-7a, but rather from mis-priming events between DNA guides and forward primers. It is unclear why bulk BS-qPCR did not yield a concentration-dependent response to the target miRNA; however, optimizing this bulk analysis was beyond the scope of this study. Regardless, this data accentuates the benefits of microfluidic BS-dqPCR, as our on-chip technique demonstrated a sensitive and quantitative method to measure miRNA at low copy numbers.
Conclusions
This report describes a promising BS-dqPCR method to analyze miRNA in a high sensitivity digital microwell array format. The use of BS-PCR to amplify miRNA eliminated the need for ligation and RT steps, which reduced the time, complexity, and cost of the analysis compared to conventional miRNA qPCR methods. The success of microfluidic BS-dqPCR stemmed from a unique asymmetric PCR thermocycling program that was developed to facilitate the formation of the BS-complex while concurrently minimizing non-specific amplification. Additionally, the ability of our method to use qPCR data to inform dPCR analysis conditions resulted in the optimized method providing a high P/N ratio. Incorporating both dPCR and qPCR dimensions into a single assay afforded an ultrawide dynamic range where the dPCR dimension reliably measured low miRNA copy numbers, but at high copy numbers where digital signal saturated, qPCR Cq values readily discerned sample concentrations. Overall, the short analysis times and high sensitivity demonstrate that microfluidic BS-dqPCR can analyze miRNA for broad research applications.Conflicts of interest
There are no conflicts of interest to declare.Acknowledgements
This work was funded by Wayne State University. B. C. V. was supported by an Initiative for Maximizing Student Diversity training grant at Wayne State University (NIH T32GM139807). Microfluidic devices were fabricated at the Lurie Nanofabrication Facility at the University of Michigan. The authors thank Dr Katherine Gurdziel and Daniela Cukovic in the Genome Sciences Core at Wayne State University for assisting with bulk qPCR analyses and Dr John SantaLucia for helpful discussions.References
- L. F. R. Gebert and I. J. MacRae, Regulation of microRNA function in animals, Nat. Rev. Mol. Cell Biol., 2019, 20(1), 21–37 CrossRef CAS PubMed.
- A. Schoolmeesters, T. Eklund, D. Leake, A. Vermeulen, Q. Smith, S. Force Aldred and Y. Fedorov, Functional Profiling Reveals Critical Role for miRNA in Differentiation of Human Mesenchymal Stem Cells, PLoS One, 2009, 4(5), e5605 CrossRef PubMed.
- L. Shen, M. Gan, Q. Li, J. Wang, X. Li, S. Zhang and L. Zhu, MicroRNA-200b regulates preadipocyte proliferation and differentiation by targeting KLF4, Biomed. Pharmacother., 2018, 103, 1538–1544 CrossRef CAS PubMed.
- H. Wang, R. Peng, J. Wang, Z. Qin and L. Xue, Circulating microRNAs as potential cancer biomarkers: the advantage and disadvantage, Clin. Epigenet., 2018, 10(1), 59 CrossRef PubMed.
- J.-Q. Chen, G. Papp, P. Szodoray and M. Zeher, The role of microRNAs in the pathogenesis of autoimmune diseases, Autoimmun. Rev., 2016, 15(12), 1171–1180 CrossRef CAS PubMed.
- F.-B. Gao and E. Gascon, Cause or Effect: Misregulation of microRNA Pathways in Neurodegeneration, Front. Neurosci., 2012, 6, 48 Search PubMed.
- A. Tahamtan, M. Teymoori-Rad, B. Nakstad and V. Salimi, Anti-Inflammatory MicroRNAs and Their Potential for Inflammatory Diseases Treatment, Front. Immunol., 2018, 9, 1377 CrossRef PubMed.
- J. Hanna, G. S. Hossain and J. Kocerha, The Potential for microRNA Therapeutics and Clinical Research, Front. Genet., 2019, 10, 478 CrossRef CAS PubMed.
- T. Mosolygó, K. Laczi, G. Spengler and K. Burián, A Practical Approach for Quantitative Polymerase Chain Reaction, the Gold Standard in Microbiological Diagnosis, Sci, 2022, 4, 4 CrossRef.
- H. D. VanGuilder, K. E. Vrana and W. M. Freeman, Twenty-five years of quantitative PCR for gene expression analysis, BioTechniques, 2008, 44(5), 619–626 CrossRef CAS PubMed.
- J. P. Lopez, A. Diallo, C. Cruceanu, L. M. Fiori, S. Laboissiere, I. Guillet, J. Fontaine, J. Ragoussis, V. Benes, G. Turecki and C. Ernst, Biomarker discovery: quantification of microRNAs and other small non-coding RNAs using next generation sequencing, BMC Med. Genomics, 2015, 8(1), 35 CrossRef PubMed.
- J. Koshiol, E. Wang, Y. Zhao, F. Marincola and M. T. Landi, Strengths and Limitations of Laboratory Procedures for MicroRNA Detection, Cancer Epidemiol. Biomarkers Prev., 2010, 19(4), 907–911 CrossRef CAS PubMed.
- C. Chen, D. A. Ridzon, A. J. Broomer, Z. Zhou, D. H. Lee, J. T. Nguyen, M. Barbisin, N. L. Xu, V. R. Mahuvakar, M. R. Andersen, K. Q. Lao, K. J. Livak and K. J. Guegler, Real-time quantification of microRNAs by stem–loop RT–PCR, Nucleic Acids Res., 2005, 33(20), e179–e179 CrossRef PubMed.
- H.-J. Fu, J. Zhu, M. Yang, Z.-Y. Zhang, Y. Tie, H. Jiang, Z.-X. Sun and X.-F. Zheng, A novel method to monitor the expression of microRNAs, Mol. Biotechnol., 2006, 32(3), 197–204 CrossRef CAS PubMed.
- S. D. Fiedler, M. Z. Carletti and L. K. Christenson, Quantitative RT-PCR Methods for Mature microRNA Expression Analysis, in RT-PCR Protocols, ed. N. King, Humana Press, Totowa, NJ, 2nd edn, 2010, pp. 49–64 Search PubMed.
- S. F. C. Hawkins and P. C. Guest, Multiplex Analyses Using Real-Time Quantitative PCR, in Multiplex Biomarker Techniques: Methods and Applications, ed. P. C. Guest, Springer New York, New York, NY, 2017, pp. 125–133 Search PubMed.
- A. D. Jayaprakash, O. Jabado, B. D. Brown and R. Sachidanandam, Identification and remediation of biases in the activity of RNA ligases in small-RNA deep sequencing, Nucleic Acids Res., 2011, 39(21), e141–e141 CrossRef CAS PubMed.
- M. Hafner, N. Renwick, M. Brown, A. Mihailovic, D. Holoch, C. Lin, J. T. Pena, J. D. Nusbaum, P. Morozov, J. Ludwig, T. Ojo, S. Luo, G. Schroth and T. Tuschl, RNA-ligase-dependent biases in miRNA representation in deep-sequenced small RNA cDNA libraries, RNA, 2011, 17(9), 1697–1712 CrossRef CAS PubMed.
- P. Mestdagh, T. Feys, N. Bernard, S. Guenther, C. Chen, F. Speleman and J. Vandesompele, High-throughput stem-loop RT-qPCR miRNA expression profiling using minute amounts of input RNA, Nucleic Acids Res., 2008, 36(21), e143–e143 CrossRef PubMed.
- B. Boyle, N. Dallaire and J. MacKay, Evaluation of the impact of single nucleotide polymorphisms and primer mismatches on quantitative PCR, BMC Biotechnol., 2009, 9(1), 75 CrossRef PubMed.
- M. Sidstedt, P. Rådström and J. Hedman, PCR inhibition in qPCR, dPCR and MPS—mechanisms and solutions, Anal. Bioanal. Chem., 2020, 412(9), 2009–2023 CrossRef CAS PubMed.
- J. Ma, N. Li, M. Guarnera and F. Jiang, Quantification of Plasma miRNAs by Digital PCR for Cancer Diagnosis, Biomarker Insights, 2013, 8, 127–136 CrossRef CAS PubMed.
- D. Conte, C. Verri, C. Borzi, P. Suatoni, U. Pastorino, G. Sozzi and O. Fortunato, Novel method to detect microRNAs using chip-based QuantStudio 3D digital PCR, BMC Genomics, 2015, 16(1), 849 CrossRef PubMed.
- D. R. Walt, Optical Methods for Single Molecule Detection and Analysis, Anal. Chem., 2013, 85(3), 1258–1263 CrossRef CAS PubMed.
- A. S. Basu, Digital Assays Part I: Partitioning Statistics and Digital PCR, SLAS Technol., 2017, 22(4), 369–386 CrossRef PubMed.
- A. S. Whale, J. F. Huggett, S. Cowen, V. Speirs, J. Shaw, S. Ellison, C. A. Foy and D. J. Scott, Comparison of microfluidic digital PCR and conventional quantitative PCR for measuring copy number variation, Nucleic Acids Res., 2012, 40(11), e82–e82 CrossRef CAS PubMed.
- P. Campomenosi, E. Gini, D. M. Noonan, A. Poli, P. D'Antona, N. Rotolo, L. Dominioni and A. Imperatori, A comparison between quantitative PCR and droplet digital PCR technologies for circulating microRNA quantification in human lung cancer, BMC Biotechnol., 2016, 16(1), 60 CrossRef PubMed.
- R. H. Sedlak, J. Kuypers and K. R. Jerome, A multiplexed droplet digital PCR assay performs better than qPCR on inhibition prone samples, Diagn. Microbiol. Infect. Dis., 2014, 80(4), 285–286 CrossRef CAS PubMed.
- J. F. Huggett, J. O'Grady and S. Bustin, qPCR, dPCR, NGS – A journey, Biomol. Detect. Quantif., 2015, 3, A1–A5 CrossRef PubMed.
- C. Y. Yu, B. C. Yin and B. C. Ye, A universal real-time PCR assay for rapid quantification of microRNAs via the enhancement of base-stacking hybridization, Chem. Commun., 2013, 49(74), 8247–8249 RSC.
- Z. Lu, D. Duan, R. Cao, L. Zhang, K. Zheng and J. Li, A reverse transcription-free real-time PCR assay for rapid miRNAs quantification based on effects of base stacking, Chem. Commun., 2011, 47(26), 7452–7454 RSC.
- P. Mignon, S. Loverix, J. Steyaert and P. Geerlings, Influence of the π–π interaction on the hydrogen bonding capacity of stacked DNA/RNA bases, Nucleic Acids Res., 2005, 33(6), 1779–1789 CrossRef CAS PubMed.
- B. F. McCarthy Riley, C. L. Ward and T. H. Linz, Influence of microfabrication on digital PCR performance in bead-based microwell array assays, Anal. Bioanal. Chem., 2020, 412(25), 6917–6926 CrossRef CAS PubMed.
- W. H. Henley, N. A. Siegfried and J. M. Ramsey, Spatially isolated reactions in a complex array: using magnetic beads to purify and quantify nucleic acids with digital and quantitative real-time PCR in thousands of parallel microwells, Lab Chip, 2020, 20(10), 1771–1779 RSC.
- B. F. McCarthy Riley, H. T. Mai and T. H. Linz, Microfluidic Digital Quantitative PCR to Measure Internal Cargo of Individual Liposomes, Anal. Chem., 2022, 94(20), 7433–7441 CrossRef CAS PubMed.
- M. Rijavec, P. Korošec, M. Žavbi, I. Kern and M. M. Malovrh, Let-7a is differentially expressed in bronchial biopsies of patients with severe asthma, Sci. Rep., 2014, 4(1), 6103 CrossRef CAS PubMed.
- M. M. Vickers, J. Bar, I. Gorn-Hondermann, N. Yarom, M. Daneshmand, J. E. L. Hanson, C. L. Addison, T. R. Asmis, D. J. Jonker, J. Maroun, I. A. J. Lorimer, G. D. Goss and J. Dimitroulakos, Stage-dependent differential expression of microRNAs in colorectal cancer: potential role as markers of metastatic disease, Clin. Exp. Metastasis, 2012, 29(2), 123–132 CrossRef CAS PubMed.
- N. Majumdar, S. Banerjee, M. Pallas, T. Wessel and P. Hegerich, Poisson Plus Quantification for Digital PCR Systems, Sci. Rep., 2017, 7(1), 9617 CrossRef PubMed.
- J. R. Taylor, An Introduction to Error Analysis: The Study of Uncertainties in Physical Measurements, University Science Books, 2022 Search PubMed.
- L. Cohen, N. Cui, Y. Cai, P. M. Garden, X. Li, D. A. Weitz and D. R. Walt, Single Molecule Protein Detection with Attomolar Sensitivity Using Droplet Digital Enzyme-Linked Immunosorbent Assay, ACS Nano, 2020, 14(8), 9491–9501 CrossRef CAS PubMed.
- D. M. Rissin, C. W. Kan, T. G. Campbell, S. C. Howes, D. R. Fournier, L. Song, T. Piech, P. P. Patel, L. Chang, A. J. Rivnak, E. P. Ferrell, J. D. Randall, G. K. Provuncher, D. R. Walt and D. C. Duffy, Single-molecule enzyme-linked immunosorbent assay detects serum proteins at subfemtomolar concentrations, Nat. Biotechnol., 2010, 28(6), 595–599 CrossRef CAS PubMed.
Footnote |
| † Electronic supplementary information (ESI) available. See DOI: https://doi.org/10.1039/d3an00351e |
| This journal is © The Royal Society of Chemistry 2023 |