 Open Access Article
Creative Commons Attribution 3.0 Unported Licence
Synthesis, characterization, interactions with the DNA duplex dodecamer d(5′-CGCGAATTCGCG-3′)2 and cytotoxicity of binuclear η6-arene-Ru(II) complexes†
Christina
Georgakopoulou‡
a,
Dimitrios
Thomos‡
a,
Theodoros
Tsolis
a,
Konstantinos
Ypsilantis
a,
John C.
Plakatouras
ae,
Dimitris
Kordias
bc,
Angeliki
Magklara
bcd,
Constantine
Kouderis
a,
Angelos G.
Kalampounias
ae and
Achilleas
Garoufis
 *ae
*ae
aDepartment of Chemistry, University of Ioannina, GR-45110 Ioannina, Greece. E-mail: agaroufi@uoi.gr
bBiomedical Research Institute-Foundation for Research and Technology, 45110 Ioannina, Greece
cLaboratory of Clinical Chemistry, Faculty of Medicine, University of Ioannina, 45110 Ioannina, Greece
dInstitute of Biosciences, University Research Center of Ioannina (U.R.C.I.), Ioannina, Greece
eUniversity Research Center of Ioannina (URCI), Institute of Materials Science and Computing, Ioannina, Greece
First published on 24th August 2022
Abstract
The novel binuclear η6-arene-Ru(II) complexes with the general formula {[(η6-cym)Ru(L)]2(μ-BL)}(PF6)4, and their corresponding water soluble {[(η6-cym)Ru(L)]2(μ-BL)}Cl4, where cym = p-cymene, L = 2,2′-bipyridine (bpy) and 1,10-phenanthroline (phen), BL = 4,4′-bipyridine (BL-1), 1,2-bis(4-pyridyl)ethane (BL-2) and 1,3-bis(4-pyridyl)propane (BL-3), were synthesized and characterized. The structure of {[(η6-cym)Ru(phen)]2(μ-BL-1)}(PF6)4 was determined by X-ray single crystal methods. The interaction of {[(η6-cym)Ru(phen)]2(μ-BL-i)}Cl4 (i = 1, 2, 3; (4), (5) and (6) correspondingly) with the DNA duplex d(5′-CGCGAATTCGCG-3′)2 was studied by means of NMR techniques and fluorescence titrations. The results show that complex (4) binds with a Kb = 12.133 × 10³ M−1 through both intercalation and groove binding, while (5) and (6) are groove binders (Kb = 2.333 × 10³ M−1 and Kb = 3.336 × 10³ M−1 correspondingly). Comparison with the mononuclear complex [(η6-cym)Ru(phen)(py)]2+ reveals that it binds to the d(5′-CGCGAATTCGCG-3′)2 with a Kb value two orders of magnitude lower than (4) (Kb = 0.158 × 10³ M−1), indicating that for the binuclear complexes both ruthenium moieties participate in the binding. The complexes were found to be cytotoxic against the A2780 and A2780 res. cancer cell line with a selectivity index (SI) in the range of 3.0–5.9.
1. Introduction
It is a well-known fact that complexes with a metal saturated coordination sphere can interact with DNA mainly in three different ways: non-specific external association, major or minor groove binding, and intercalation between adjacent DNA base pairs.1 Intercalation can be described as the insertion of a planar aromatic system between adjacent base pairs.2,3 Once the insertion happens, the new intercalator–DNA complex is stabilized through non-covalent interactions, such as van der Waals and π-stacking interactions.1,4,5 Intercalation results in DNA changes in structural step parameters, helix elongation and unwinding.6 DNA-targeting antitumor intercalators, that act as topoisomerase II poisons, disrupt helicase activity, and cause ribosomal frame-shift mutations, have been suggested in the literature.7 As a result, the inhibition of the transcription and repair processes of DNA lead to the apoptotic death of the cell.The requirements for a metal complex to act as an intercalator8 are the presence of (i) a coordinated ligand involving a planar aromatic moiety, and (ii) a metal coordination sphere with kinetically inert ligands. Furthermore, the solubility of the complex in aqueous media and its cationic nature are desired. In general, platinum square planar complexes with aromatic ligands, such as terpy, intercalate the entire flat cationic complex between the DNA base pairs.9 On the other hand, octahedral complexes either intercalate an aromatic ligand between two continuous bases, unwinding the DNA helix, or insert themselves into the DNA duplex.10
Bis-intercalation first drew attention as a mode of ligand–DNA interaction upon the discovery of echinomycin and its binding mode.11 Bis-metallo-intercalators are always binuclear complexes which can bind more effectively to DNA than their mononuclear analogues.12,13 In some cases, this higher binding affinity may be responsible for their higher cytotoxicity as well.14 Also, it has been suggested that the binding in long-range intercalation sites might inhibit the DNA repair.15 However, this is not always the case, as there are examples of bis-metallo-intercalators showing the same, or even lower, levels of cytotoxicity compared to their monomer analogues.12,16,17 A factor that regulates the binding properties of a bis-metallo-intercalator is the ligand which bridges the two mononuclear moieties (BL), by adjusting the distance between the two intercalating aromatic ligands as well as their relative orientation. It has been suggested that when the two intercalating ligands are separated by a rigged BL at approximately 20 Å away from each other, a bis-intercalation binding mode is favored.17 However, in the cases of flexible BLs, the potentially intercalating ligands adopt many different orientations, so that the intercalating one enforces the second to bind in the DNA double helix.18,19 Ruthenium polypyridine bis-metallo-intercalators with various bridging, ancillary, and intercalating ligands are among the most studied complexes.10a,20–28 Among them the binuclear complex [{Ru(TAP2)}2(μ-tpphz)]4+ (TAP = 1,4,5,8-tetraazaphenanthrene, tpphz = tetrapyrido-[3,2-a:2′,3′-c:3′′,2′′-h:2′′′,3′′′-j]phenazine), which photoexcited using near-infrared irradiation at low power, resulted in specific phototoxicity against human melanoma cells.29a The similar complex [{Ru(bpy)2}2(μ-tpphz)]4+ separated to all its three stereoisomers (ΔΔ, ΛΔ, ΛΛ) and the interactions of each stereoisomer with DNA was studied. The results showed a threading intercalation binding mode with slow and chirality-dependent rates.29b Recently, the synthesis of a heterobinuclear complex Ru(II)/Re(I) with dppz (dipyrido[3,2-a:2′,3′-c]phenazine) and N,N′-bis(4-pyridylmethyl)-1,6-hexanediamine as BL has been reported. Comparison with a similar complex with BL (BL = a simple dipyridyl alkane ligand) showed that the nature of the linker affects the excited state dynamics of the complexes and their DNA photocleavage properties.29c
However, only a few examples involving organometallic bis-intercalators have been reported, mainly limited to metallo-arene complexes.30 A bis-intercalating binding mode was observed in the case of the binuclear complex {[(η6-bip)RuCl]2BLx}2+ (bip = biphenyl BLx = Et(H)NCH2CH2NH2) together with inter-strand cross-links with similar efficiency to cisplatin.31 Sheldricks’ group has studied the DNA binding of binuclear organoiridium complexes of the type [{(η5-C5Me5)Ir(L}2(μ-BLy)]+ (L = an intercalative ligand e.g. dipyrido[2,3-a:2′,3′-c]phenazine and BLy = a dipyridinyl bridging ligand), suggesting that the intercationic distance, adjusted by the BLy, controls the DNA binding mode. Mono-intercalation binding mode for a distance of 13.1–13.3 Å and bis-intercalation mode for a distance of 20.6 Å, where five bases are sandwiched between the parallel dppz ligands, were observed.17 Bis-intercalation binding was also observed for the complex [{(η5-C5Me5)Ir(dppz)}2(4,4′-bpy)]4+ (4,4′-bpy = 4,4′-bipyridine) and the oligonucleotide d(5′-CGCGTAGGCC-3′).14
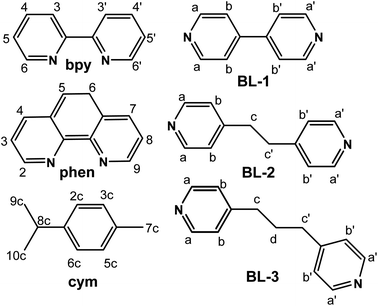
With the aim to give insight in the binding mode of organometallic complexes, herein we report on the synthesis, characterization, interactions with the DNA 12mer duplex d(5′-CGCGAATTCGCG-3′)2 and cytotoxicity of novel binuclear organoruthenium complexes with the general formula {[(η6-cym)Ru(L)]2(μ-BL)}(PF6)4, where cym = p-cymene, L = 2,2′-bipyridine (bpy) and 1,10-phenanthroline (phen), BL = 4,4′-bipyridine (BL-1), 1,2-bis(4-pyridyl)ethane (BL-2) and 1,3-bis(4-pyridyl)propane (BL-3). The structures and numbering of the ligands involved in this study are illustrated in Scheme 1.
2. Experimental
2.1. Materials and methods
All solvents were of analytical grade and were used without further purification. 2,2′-Bipyridine, 1,10-phenanthroline, 4,4′-bipyridine, 1,2-bis(4-pyridyl)ethane, 1,3-bis(4-pyridyl)propane, α-phellandrene were purchased from Sigma-Aldrich. Hydrated ruthenium trichloride, RuCl3·3H2O was purchased from Precious Chemical Company (Pittsburgh, USA). The deoxynucleotide d(5′-CGCGATCGCG-3′) (DNA) was purchased from Eurogentec and purified by standard purification option. DNA concentrations were quantified by measuring the absorbance at 260 nm. The complexes [(η6-cym)Ru(μ-Cl)Cl]2,32 [(η6-cym)Ru(bpy)Cl]PF6,33 [(η6-cym)Ru(phen)Cl]PF6![[thin space (1/6-em)]](https://www.rsc.org/images/entities/char_2009.gif) 34 and [(η6-cym)Ru(phen)(py)](PF6)2
34 and [(η6-cym)Ru(phen)(py)](PF6)2![[thin space (1/6-em)]](https://www.rsc.org/images/entities/char_2009.gif) 35 were synthesized according to the literature methods.
35 were synthesized according to the literature methods.
C, H and N determinations were performed on a PerkinElmer 2400 Series II analyzer. High resolution electrospray ionization mass spectra (HR-ESI-MS) were obtained on a Thermo Scientific, LTQ Orbitrap XL™ system. NMR spectra were recorded on Bruker Avance spectrometers operating for 1H frequencies of 400.13 and 500.13 MHz and for 13C at 100 MHz and processed using Topspin 4.1.1 (Bruker Analytik GmbH). COSY and TOCSY experiments were used to assist the assignments of 1H signals. The 1H NMR spectra of the synthesized complexes were recorded in H2O/D2O, 9![[thin space (1/6-em)]](https://www.rsc.org/images/entities/char_2009.gif) :
:![[thin space (1/6-em)]](https://www.rsc.org/images/entities/char_2009.gif) 1 (100 mM phosphate buffer, pH = 7.0), at 298 K. Under the same conditions the spectra of the DNA were recorded as follows: 1D 1H NMR spectra were recorded for samples with DNA concentration of approximately 0.5 mM, while 2D NMR experiments were performed with more concentrated samples (e.g., 2 mM). Two-dimensional NOESY experiments were performed with 300 ms mixing time and data sets were acquired with 4096 × 512 complex points at 8 kHz sweep widths in both dimensions.
1 (100 mM phosphate buffer, pH = 7.0), at 298 K. Under the same conditions the spectra of the DNA were recorded as follows: 1D 1H NMR spectra were recorded for samples with DNA concentration of approximately 0.5 mM, while 2D NMR experiments were performed with more concentrated samples (e.g., 2 mM). Two-dimensional NOESY experiments were performed with 300 ms mixing time and data sets were acquired with 4096 × 512 complex points at 8 kHz sweep widths in both dimensions.
2.2. Crystal structure determination
A suitable crystal of compound (4)(PF6)4 was glued to a thin glass fiber with cyanoacrylate (super glue) adhesive and placed on the goniometer head. Diffraction data were collected on a Bruker D8 Quest Eco diffractometer, equipped with a Photon II detector and a TRIUMPH (curved graphite) monochromator utilizing Mo Kα radiation (λ = 0.71073 Å) using the APEX3 software package.36 The collected frames were integrated with the Bruker SAINT software using a wide-frame algorithm. Data were corrected for absorption effects using the multi-scan method (SADABS).37 The structure was solved using the Bruker SHELXT Software Package and refined by full-matrix least squares techniques on F2 (SHELXL 2018/3)38via the ShelXle interface.39 The non-H atoms were treated anisotropically, while the organic H atoms were placed in calculated, ideal positions and refined as riding on their respective carbon atoms. Some residual electron density present in the void space of the structure (3.3%) is assigned to volatile solvents; we could not model it and was treated with SQUEEZE, implemented in PLATON.40 Probably the loss of lattice solvent molecules is the reason of slow degradation of the crystal during the data collection that led to Rint = 0.1329 for the dataset. One of the [PF6]− anions was severely disordered and modelled as two face-sharing octahedra. PLATON was used for geometric calculations, and X-Seed41 for molecular graphics. Details on data collection and refinement are presented in Table S1.† Full details on the structures can be found in the CIF files deposited with CCDC. CCDC 2179567† contain the supplementary crystallographic data for this paper.2.3. Fluorescence measurements
Fluorescence emission study was carried out using a Jasco FP-8300 fluorimeter equipped with a xenon lamp source. All the experiments were done by using a 10 mm path length cuvette in a 100 mM phosphate buffer at pH 7.0. Successive amounts of each complex (75–750 μL) from a stock solution of 1 mM were added to a 20 μM of d(5′-CGCGATCGCG-3′)2 saturated with ethidium bromide EtBr (5.2 μM),42 which is an important DNA probe for competitive studies with other DNA binders.43 A DNA–EtBr sample was titrated with (1)Cl4–(6)Cl4 and the emission spectra were recorded at wavelength of 510–850 nm with excitation at 480 nm in a 1 cm quartz cell. The excitation and emission slit widths were kept at 5 nm each. All the measurements were recorded after 15 min of incubation at 291, 298 and 310 K. Details on the calculations of Ksv and Kb are presented in the ESI.†2.4. Molecular docking
Computational investigation of the molecular docking between the species involved was performed by means of AutoDock software (version 4.2). DNA was the receptor, while the ruthenium complexes (4), (5) and (6) were the guest molecules. Initially, the size of the calculation box was set equal to 60 Å × 80 Å × 120 Å, large enough to fit adequately to the DNA molecule and allow free docking. For all docking calculations, the assignment of partial charges was performed using Gasteiger charges.44 The sampling was extended, using 250 initial poses and, at the end of the calculation, the best five were selected. The Lamarckian genetic algorithm was used to select the poses. Graphics were produced using UCSF Chimera version 1.16.45 The structure of the DNA fragment d(5′-CGCGAATTCGCG-3′)2 was downloaded from the PDB database.2.5. Cell culture
The human breast adenocarcinoma cell line MCF7 and the mouse embryonic fibroblast cell line NIH-3T3 were cultured in Dulbecco's modified Eagle's medium (DMEM, high glucose) supplemented with 10% fetal bovine serum and 1% penicillin/streptomycin. The human ovarian cancer cell line A2780 and its cisplatin resistant derivative (A2780cis-res) were cultured in RPMI1640 medium supplemented with 10% fetal bovine serum and 1% penicillin/streptomycin. Cells were routinely passaged every 2 or 3 days, and were incubated in a humidified atmosphere of 5% CO2 at 37 °C.2.6. Cell growth assay
To monitor the cell growth and validate the cytotoxicity effects of the complexes, the IncuCyte Zoom system (Essen BioScience, Hertfordshire, United Kingdom) and software were used, as it has been previously described.46 The IC50 values of cisplatin and of the complexes were calculated from a log(concentration) versus normalized response curve fit using Graphpad Prism version 8.01.2.7. Synthesis of the complexes
The complexes (1)(PF6)4–(6)(PF6)4 were synthesized similarly. A typical synthetic procedure follows:In a round bottom flask, 0.1 mmol of [Ru(cym)(L)Cl]PF6 (L = bpy, phen) was dissolved in 8 mL of a mixture of H2O![[thin space (1/6-em)]](https://www.rsc.org/images/entities/char_2009.gif) :
:![[thin space (1/6-em)]](https://www.rsc.org/images/entities/char_2009.gif) Me2CO (7
Me2CO (7![[thin space (1/6-em)]](https://www.rsc.org/images/entities/char_2009.gif) :
:![[thin space (1/6-em)]](https://www.rsc.org/images/entities/char_2009.gif) 1), and 0.095 mmol of AgNO3 was then added. The mixture was heated at reflux for 24 h in the dark and the precipitated AgCl was removed with centrifugation. 0.05 mmol of BL-i (i = 1, 2, 3) was added to the remaining solution, which was then heated at reflux overnight. After cooling the clear orange-yellow solution at room temperature, 0.5 mmol of KPF6 was added. The mixture was cooled at the fridge resulting in a microcrystalline orange solid which was collected by filtration, washed with cold water (3 × 5 mL H2O) and dried in vacuum over P2O5.
1), and 0.095 mmol of AgNO3 was then added. The mixture was heated at reflux for 24 h in the dark and the precipitated AgCl was removed with centrifugation. 0.05 mmol of BL-i (i = 1, 2, 3) was added to the remaining solution, which was then heated at reflux overnight. After cooling the clear orange-yellow solution at room temperature, 0.5 mmol of KPF6 was added. The mixture was cooled at the fridge resulting in a microcrystalline orange solid which was collected by filtration, washed with cold water (3 × 5 mL H2O) and dried in vacuum over P2O5.
The transformation of the complexes to their corresponding chloride salt was achieved as described earlier.46 In a typical experiment, an amount of 20 mg of the [PF6]− salt was dissolved in 5 mL of a saturated acetonic solution of LiCl. The [Cl]− salt was precipitated almost quantitatively, collected by filtration and washed several times with dry acetone.
![[thin space (1/6-em)]](https://www.rsc.org/images/entities/char_2009.gif) :
:![[thin space (1/6-em)]](https://www.rsc.org/images/entities/char_2009.gif) D2O, 90
D2O, 90![[thin space (1/6-em)]](https://www.rsc.org/images/entities/char_2009.gif) :
:![[thin space (1/6-em)]](https://www.rsc.org/images/entities/char_2009.gif) 10, δ in ppm): H2c/6c: 6.50 (d, 4H), H3c/5c: 6.09 (d, 4H), H7c: 1.84 (s, 6H), H8c: 2.50 (m, 2H), H9c/10c: 0.90 (d, 12H), Ha: 8.36 (d, 4H), Hc: 7.63 (d, 4H), H3/3′: 8.55 (d, 4H), H4/4′: 8.30 (t, 4H), H5/5′: 7.95 (t, 4H), H6/6′: 9.74 (d, 4H).
10, δ in ppm): H2c/6c: 6.50 (d, 4H), H3c/5c: 6.09 (d, 4H), H7c: 1.84 (s, 6H), H8c: 2.50 (m, 2H), H9c/10c: 0.90 (d, 12H), Ha: 8.36 (d, 4H), Hc: 7.63 (d, 4H), H3/3′: 8.55 (d, 4H), H4/4′: 8.30 (t, 4H), H5/5′: 7.95 (t, 4H), H6/6′: 9.74 (d, 4H).
![[thin space (1/6-em)]](https://www.rsc.org/images/entities/char_2009.gif) :
:![[thin space (1/6-em)]](https://www.rsc.org/images/entities/char_2009.gif) D2O, 90
D2O, 90![[thin space (1/6-em)]](https://www.rsc.org/images/entities/char_2009.gif) :
:![[thin space (1/6-em)]](https://www.rsc.org/images/entities/char_2009.gif) 10, δ in ppm): H2c/6c: 6.46 (d, 4H), H3c/5c: 6.02 (d, 4H), H7c: 1.71 (s, 6H), H8c: 2.47 (m, 2H), H9c/10c: 0.87 (d, 12H), Ha: 8.24 (d, 4H), Hb: 7.21 (d, 4H), Hc: 2.87 (s, 4H), H3/3′: 8.38 (d, 4H), H4/4′: 8.30 (t, 4H), H5/5′: 7.93 (t, 4H), H6/6′: 9.71 (d, 4H).
10, δ in ppm): H2c/6c: 6.46 (d, 4H), H3c/5c: 6.02 (d, 4H), H7c: 1.71 (s, 6H), H8c: 2.47 (m, 2H), H9c/10c: 0.87 (d, 12H), Ha: 8.24 (d, 4H), Hb: 7.21 (d, 4H), Hc: 2.87 (s, 4H), H3/3′: 8.38 (d, 4H), H4/4′: 8.30 (t, 4H), H5/5′: 7.93 (t, 4H), H6/6′: 9.71 (d, 4H).
![[thin space (1/6-em)]](https://www.rsc.org/images/entities/char_2009.gif) :
:![[thin space (1/6-em)]](https://www.rsc.org/images/entities/char_2009.gif) D2O, 90
D2O, 90![[thin space (1/6-em)]](https://www.rsc.org/images/entities/char_2009.gif) :
:![[thin space (1/6-em)]](https://www.rsc.org/images/entities/char_2009.gif) 10, δ in ppm): H2c/6c: 6.46 (d, 4H), H3c/5c: 6.04 (d, 4H), H7c: 1.80 (s, 6H), H8c: 2.50 (m, 2H), H9c/10c: 0.91 (d, 12H), Ha: 8.24 (d, 4H), Hb: 7.19 (d, 4H), Hc: 2.56 (t, 4H), Hd: 1.75 (m, 2H), H3/3′: 8.37 (d, 4H), H4/4′: 8.29 (t, 4H), H5/5′: 7.90 (t, 4H), H6/6′: 9.71 (d, 4H).
10, δ in ppm): H2c/6c: 6.46 (d, 4H), H3c/5c: 6.04 (d, 4H), H7c: 1.80 (s, 6H), H8c: 2.50 (m, 2H), H9c/10c: 0.91 (d, 12H), Ha: 8.24 (d, 4H), Hb: 7.19 (d, 4H), Hc: 2.56 (t, 4H), Hd: 1.75 (m, 2H), H3/3′: 8.37 (d, 4H), H4/4′: 8.29 (t, 4H), H5/5′: 7.90 (t, 4H), H6/6′: 9.71 (d, 4H).
![[thin space (1/6-em)]](https://www.rsc.org/images/entities/char_2009.gif) :
:![[thin space (1/6-em)]](https://www.rsc.org/images/entities/char_2009.gif) D2O, 90
D2O, 90![[thin space (1/6-em)]](https://www.rsc.org/images/entities/char_2009.gif) :
:![[thin space (1/6-em)]](https://www.rsc.org/images/entities/char_2009.gif) 10, δ in ppm): H2c/6c: 6.50 (d, 4H), H3c/5c: 6.14 (d, 4H), H7c: 1.77 (s, 6H), H8c: 2.35 (m, 2H), H9c/10c: 0.71 (d, 12H), Ha: 8.45 (d, 4H), Hb: 7.39 (d, 4H), H2/9: 10.02 (d, 4H), H3/8: 8.19 (t, 4H), H4/7: 8.80 (d, 4H), H5/6: 8.07 (s, 4H).
10, δ in ppm): H2c/6c: 6.50 (d, 4H), H3c/5c: 6.14 (d, 4H), H7c: 1.77 (s, 6H), H8c: 2.35 (m, 2H), H9c/10c: 0.71 (d, 12H), Ha: 8.45 (d, 4H), Hb: 7.39 (d, 4H), H2/9: 10.02 (d, 4H), H3/8: 8.19 (t, 4H), H4/7: 8.80 (d, 4H), H5/6: 8.07 (s, 4H).
![[thin space (1/6-em)]](https://www.rsc.org/images/entities/char_2009.gif) :
:![[thin space (1/6-em)]](https://www.rsc.org/images/entities/char_2009.gif) D2O, 90
D2O, 90![[thin space (1/6-em)]](https://www.rsc.org/images/entities/char_2009.gif) :
:![[thin space (1/6-em)]](https://www.rsc.org/images/entities/char_2009.gif) 10, δ in ppm): H2c/6c: 6.51 (d, 4H), H3c/5c: 6.09 (d, 4H), H7c: 1.59 (s, 6H), H8c: 2.37 (m, 2H), H9c/10c: 0.72 (d, 12H), Ha: 8.20 (d, 4H), Hb: 7.07 (d, 4H), Hc: 2.74 (s, 4H), H2/9: 10.05 (d, 4H), H3/8: 8.24 (t, 4H), H4/7: 8.88 (d, 4H), H5/6: 8.15 (s, 4H).
10, δ in ppm): H2c/6c: 6.51 (d, 4H), H3c/5c: 6.09 (d, 4H), H7c: 1.59 (s, 6H), H8c: 2.37 (m, 2H), H9c/10c: 0.72 (d, 12H), Ha: 8.20 (d, 4H), Hb: 7.07 (d, 4H), Hc: 2.74 (s, 4H), H2/9: 10.05 (d, 4H), H3/8: 8.24 (t, 4H), H4/7: 8.88 (d, 4H), H5/6: 8.15 (s, 4H).
![[thin space (1/6-em)]](https://www.rsc.org/images/entities/char_2009.gif) :
:![[thin space (1/6-em)]](https://www.rsc.org/images/entities/char_2009.gif) D2O, 90
D2O, 90![[thin space (1/6-em)]](https://www.rsc.org/images/entities/char_2009.gif) :
:![[thin space (1/6-em)]](https://www.rsc.org/images/entities/char_2009.gif) 10, δ in ppm): H2c/6c: 6.53 (d, 4H), H3c/5c: 6.16 (d, 4H), H7c: 1.80 (s, 6H), H8c: 2.39 (m, 2H), H9c/10c: 0.78 (d, 12H), Ha: 8.22 (d, 4H), Hb: 7.03 (d, 4H), Hc: 2.40 (t, 4H), Hd: 1.59 (m, 2H), H2/9: 10.06 (d, 4H), H3/8: 8.25 (t, 4H), H4/7: 8.85 (d, 4H), H5/6: 8.12 (s, 4H).
10, δ in ppm): H2c/6c: 6.53 (d, 4H), H3c/5c: 6.16 (d, 4H), H7c: 1.80 (s, 6H), H8c: 2.39 (m, 2H), H9c/10c: 0.78 (d, 12H), Ha: 8.22 (d, 4H), Hb: 7.03 (d, 4H), Hc: 2.40 (t, 4H), Hd: 1.59 (m, 2H), H2/9: 10.06 (d, 4H), H3/8: 8.25 (t, 4H), H4/7: 8.85 (d, 4H), H5/6: 8.12 (s, 4H).
3. Results and discussion
3.1. Synthesis and characterization of the complexes (1)–(6)
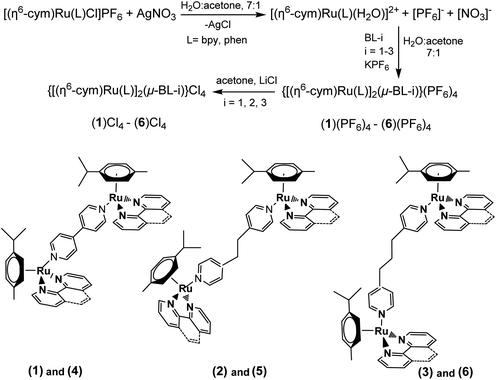
The binuclear complexes were synthesized by bridging the mononuclear complexes with the ligands BL-1, 2, 3. The yield of the reaction increased with the increase of the length of BL, BL-1 > BL-2 > BL-3. It is notable that the reaction between BL and the mononuclear complexes proceeds only after removing the Cl from the ruthenium coordination sphere. The complexes (1)–(6) were isolated and characterized as [PF6]− salts, however their interactions with the DNA and their biological properties were studied as [Cl]− salts, which are soluble in aqueous media. The synthesis is summarized in the following Scheme 2.The HR-ESI-MS spectra of the prepared complexes show double, or triple charged cations of (1)(PF6)4–(6)(PF6)4 in accordance with their proposed formulae. Also, the isotopic distribution in the observed cluster-peaks confirms that BL bridges the two ruthenium centers (Fig. S1–S6†).
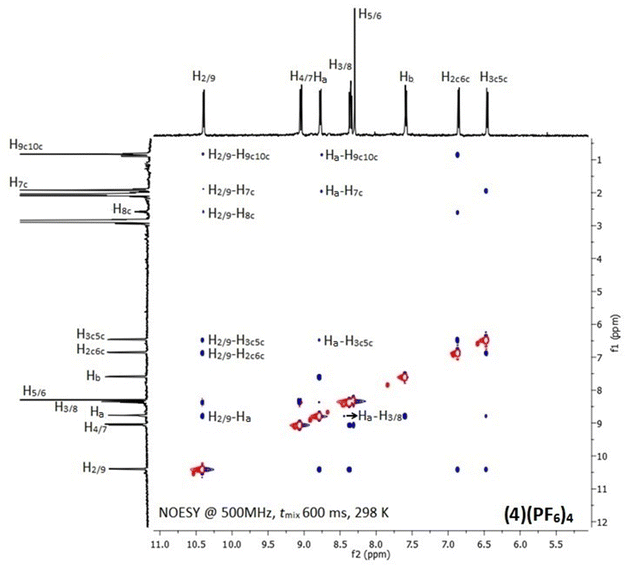
In the 1H NMR spectra of (1)(PF6)4–(6)(PF6)4, only signals of the half part of the complexes appeared due to their high symmetry (Fig. S7–S12†). Downfield shifts in the range of 0.20–0.60 ppm for the protons which are neighboring to the coordination sites of the chelating ligands (L) were observed, confirming their coordination to ruthenium center. However, the proton signals of the bridging ligands shifted unexpectedly upfield due to their positioning above the aromatic ring system of L. Similarly, upfield shifts (0.10–0.70 ppm) were also observed for the methyl and isopropyl group protons of cym which are in close proximity with the aromatic ring system of L.47 The above observations were investigated by recording the 2D NOE spectra of (1)(PF6)4–(6)(PF6)4 at various mixing times. Indeed, inter-ligand and intra-ligand cross-peaks between protons of all involved ligands in the complexes were observed (Fig. 1 and S13†). For example, in the (4)(PF6)4 NOESY spectrum (Fig. 1), the NOE cross-peaks between the Hb of BL-1 and the phen H2/9 and H3/8 indicate that the pyridine moieties of BL-1 are oriented almost vertically towards the aromatic ring system of phen. Also, the cross-peaks between the cymene aliphatic protons H9c10c and H7c and the phen H2/9 confirm that phen and cym are in proximity. Similar results were observed for all the studied complexes.
Suitable crystals for X-ray single-crystal analysis of (4)(PF6)4 were grown in a closed vessel through slow diffusion of diethyl ether vapors into a solution of the complex in acetonitrile. The asymmetric unit consists of a binuclear cation, illustrated in Fig. 2 and formulated as {[(η6-cym)Ru(phen)]2(μ-4,4′-bpy)}4+, and four [PF6]− anions. Selected geometrical characteristics of the cation are presented in Table 1. Both metallic centers of the complex adopt the expected piano stool (pseudo-octahedral) geometry with minor differences from each other.
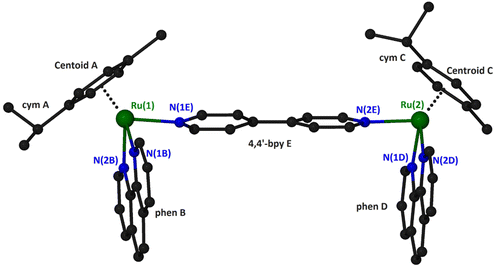 | ||
| Fig. 2 A “ball and stick” diagram of the cation in compound (4)(PF6)4 with a partial labeling scheme. Hydrogen atoms have been omitted for clarity. | ||
| Bond lengths (Å) | |||
| Ru(1)–N(2B) | 2.084(5) | Ru(2)–N(2D) | 2.083(4) |
| Ru(1)–N(1B) | 2.096(4) | Ru(2)–N(1D) | 2.096(5) |
| Ru(1)–N(1E) | 2.100(4) | Ru(2)–N(2E) | 2.114(4) |
| Ru(1)–C(2A) | 2.176(7) | Ru(2)–C(5C) | 2.181(6) |
| Ru(1)–C(5A) | 2.189(6) | Ru(2)–C(6C) | 2.195(6) |
| Ru(1)–C(6A) | 2.196(7) | Ru(2)–C(2C) | 2.206(6) |
| Ru(1)–C(3A) | 2.203(6) | Ru(2)–C(3C) | 2.220(6) |
| Ru(1)–C(4A) | 2.220(6) | Ru(2)–C(1C) | 2.233(6) |
| Ru(1)–C(1A) | 2.227(7) | Ru(2)–C(4C) | 2.241(6) |
| Ru(1)–centroid A | 1.705 | Ru(2)–centroid C | 1.709 |
| Bond angles (°) | |||
| N(2B)–Ru(1)–N(1B) | 78.11(19) | N(2D)–Ru(2)–N(1D) | 78.09(19) |
| N(2B)–Ru(1)–N(1E) | 84.30(17) | N(2D)–Ru(2)–N(2E) | 87.36(16) |
| N(1B)–Ru(1)–N(1E) | 84.64(17) | N(1D)–Ru(2)–N(2E) | 83.70(17) |
| N(1B)–Ru(1)–centroid A | 132.1 | N(1D)–Ru(2)–centroid C | 131.7 |
| N(2B)–Ru(1)–centroid A | 131.8 | N(2D)–Ru(2)–centroid C | 128.7 |
| N(1E)–Ru(1)–centroid A | 127.7 | N(2E)–Ru(2)–centroid C | 129.6 |
The ruthenium atoms are surrounded by the π-bonded cym and three σ-bonded nitrogen atoms, two belonging to the chelating phen and one more from the bridging 4,4′-bpy. The bond distances and angles around the ruthenium center are similar to the corresponding of the mononuclear complex [(η6-cym)Ru(phen)(py)](PF6)2.35 The coordination spheres about the two Ru atoms in the binuclear cation are very similar, as can be seen by the corresponding geometrical characteristics. A minor difference can be realized comparing the dihedral angles formed by the calculated least square planes for the six-membered cym ring and phen bonded to the same ruthenium atom. Thus, the above-mentioned angles for Ru(1) and Ru(2) are respectively 61.17° and 53.36°. Although both cym ligands are located at the same side of the binuclear complex, they positioned differently with respect to the relative positions of the methyl and propyl groups. For example, the isopropyl group of cym A is directed towards the phen ligand whilst for cym C towards the 4,4′-bpy (Fig. 2). The 4,4′-bpy bridge is twisted with an angle of 22.5° between the two pyridyl planes.
The phen ligands are almost parallel to each other (the dihedral angle between the calculated least squares planes is 6.3°) with an interplanar distance approximately 10.9 Å which is comparable to that calculated for the dppz ligands (10.2 Å) in the similar organoiridium complex [{(η5-C5Me5)Ir(dppz)}2(4,4′-bpy)]4+.14,17
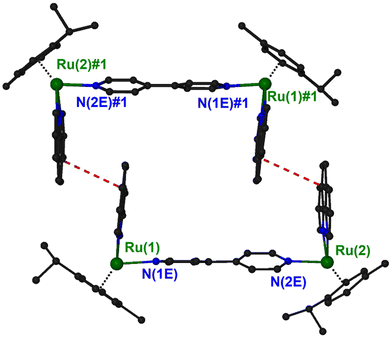
In the structure of (4)PF6, there is an interesting supramolecular interaction that leads to the formation of pairs of cations. Two symmetry related (−x + 1, −y + 2, −z + 1) {[(η6-cym)Ru(phen)]2(μ-4,4′-bpy)}4+ units interact with a pair of stacking interaction between the middle rings of phen ligands forming approximately rectangle channels, running parallel to the [−1, 1, 0] unit cell direction, and occupying 13.4% of the unit cell volume (Fig. 3 and S14†). The characteristics of the interaction are: centroid distance, 3.90 Å; mean distance of the ring planes, 3.60 Å; centroid offset, 1.49 Å. Squeeze40 suggested 75 electrons in the solvent accessible void space which correspond approximately to two solvated diethyl ether molecules.
3.2. NMR studies of the interactions of the complexes (4)Cl4, (5)Cl4 and (6)Cl4 with the DNA fragment d(5′-CGCGAATTCGCG-3′)2
The influence of the bridging ligands of the complexes (4)Cl4, (5)Cl4 and (6)Cl4 to their binding mode with the DNA fragment d(5′-CGCGAATTCGCG-3′)2 was studied by 1D 1H NMR and 2D NOESY spectroscopic techniques. The 1D 1H and 2D NMR spectra of the DNA were recorded in H2O![[thin space (1/6-em)]](https://www.rsc.org/images/entities/char_2009.gif) :
:![[thin space (1/6-em)]](https://www.rsc.org/images/entities/char_2009.gif) D2O (9
D2O (9![[thin space (1/6-em)]](https://www.rsc.org/images/entities/char_2009.gif) :
:![[thin space (1/6-em)]](https://www.rsc.org/images/entities/char_2009.gif) 1) at phosphate buffer solution (100 mM pH = 7.0) (Fig. S15–S17†). Under the same conditions the spectra of the complexes (4)Cl4, (5)Cl4 and (6)Cl4 were recorded, as well (Fig. S10b–S12b†). Then, the DNA was titrated with the complexes at increasing molar ratio, incubated at 298 K for 30 minutes, and the spectra were recorded again (Fig. S18, S21, S24, S27, S30, S33, S36, S39 and S42†). The assignments of the proton signals were assisted by COSY and NOESY experiments (Fig. S19, S20, S22, S23, S25, S26, S28, S29, S31, S32, S34, S35, S37, S38, S40, S41, S43 and S44†).
1) at phosphate buffer solution (100 mM pH = 7.0) (Fig. S15–S17†). Under the same conditions the spectra of the complexes (4)Cl4, (5)Cl4 and (6)Cl4 were recorded, as well (Fig. S10b–S12b†). Then, the DNA was titrated with the complexes at increasing molar ratio, incubated at 298 K for 30 minutes, and the spectra were recorded again (Fig. S18, S21, S24, S27, S30, S33, S36, S39 and S42†). The assignments of the proton signals were assisted by COSY and NOESY experiments (Fig. S19, S20, S22, S23, S25, S26, S28, S29, S31, S32, S34, S35, S37, S38, S40, S41, S43 and S44†).
![[thin space (1/6-em)]](https://www.rsc.org/images/entities/char_2009.gif) :
:![[thin space (1/6-em)]](https://www.rsc.org/images/entities/char_2009.gif) D2O, 9
D2O, 9![[thin space (1/6-em)]](https://www.rsc.org/images/entities/char_2009.gif) :
:![[thin space (1/6-em)]](https://www.rsc.org/images/entities/char_2009.gif) 1, 298 K, buffer phosphates 100 mM, pH = 7.0) free (r = 0), and upon the addition to the d(5′-CGCGAATTCGCG-3′)2 at r = 0.5, 1, and 2. Shifts are denoting in parenthesis (negative sign upfield and positive sign downfield shifts). n.o. = not observed. A and B denotes the signals of the two moieties of phen
1, 298 K, buffer phosphates 100 mM, pH = 7.0) free (r = 0), and upon the addition to the d(5′-CGCGAATTCGCG-3′)2 at r = 0.5, 1, and 2. Shifts are denoting in parenthesis (negative sign upfield and positive sign downfield shifts). n.o. = not observed. A and B denotes the signals of the two moieties of phen
| Protons/r | 0 | 0.5 | 1 | 2 | |||
|---|---|---|---|---|---|---|---|
| (4)Cl4 | A | B | A | B | A | B | |
| H2/9 | 10.02 | 9.91 (−0.11) | 9.67 (−0.35) | 9.94 (−0.08) | 9.71 (−0.31) | 9.97 (−0.05) | 9.77 (−0.25) |
| H3/8 | 8.20 | 8.00 (−0.20) | 7.18 (−1.02) | 8.00 (−0.20) | 7.16 (−1.04) | 8.09 (−0.11) | 7.46 (−0.74) |
| H4/7 | 8.80 | 8.34 (−0.46) | 7.43 (−1.37) | n.o. | 7.72 (1.16) | 8.26 (−0.54) | 7.98 (−0.82) |
| H5/6 | 8.07 | 7.17 (−0.90) | n.o. | n.o. | n.o. | n.o. | n.o. |
| Ha | 8.46 | 8.33 (−0.13) | 8.35 (−0.11) | 8.39 (−0.07) | |||
| Hb | 7.39 | 7.44 (+0.05) | 7.40 (+0.01) | 7.42 (+0.02) | |||
| H2c6c | 6.50 | 6.42 (−0.08) | 6.39 (−0.11) | 6.42 (−0.08) | |||
| H3c5c | 6.14 | 6.18 (+0.04) | 6.16 (+0.02) | 6.16 (+0.02) | |||
| H9c10c | 0.72 | 0.74 (+0.02) | 0.68 (−0.04) | 0.74 (+0.02) | 0.68 (−0.04) | 0.74 (+0.02) | 0.69 (−0.03) |
| H7c | 1.78 | 1.80 (+0.02) | 1.81 (+0.03) | 1.81 (+0.03) | |||
| H8c | 2.36 | 2.30 (−0.06) | 2.32 (−0.04) | 2.33 (−0.03) | |||
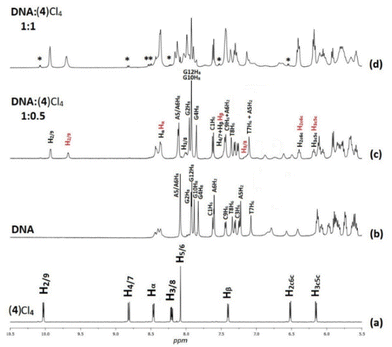
However, the signals of the two phen moieties of (4) were not shifted at the same degree indicating a different environment for each phen. On the other hand, the BL-1 Ha shifted slightly upfield (0.12 ppm) and Hb downfield (0.05 ppm) indicating the non-equivalence of the two phen ligands in the complex and the non-participation of BL-1 in the binding. At higher molar ratio (r = 1 and r = 2) proton signals of free (4) are also observable. For example, at r = 1 the presence of the unbound complex is about 1% of the total addition (based on the proton signal integrals) increasing with the ratio at about 4% (2![[thin space (1/6-em)]](https://www.rsc.org/images/entities/char_2009.gif) :
:![[thin space (1/6-em)]](https://www.rsc.org/images/entities/char_2009.gif) 1). These results confirm an intermediate equilibrium kinetic between the bound and the free form of the complex.
1). These results confirm an intermediate equilibrium kinetic between the bound and the free form of the complex.
3.2.1.1. Non-exchangeable DNA protons. Along with the changes of the proton signals of (4)Cl4, changes in the DNA signals were also observed. At r = 0.5 the A(5, 6)H8 signal was split and shifted downfield at 0.02 and 0.03 ppm. Similar downfield shifts were observed for the G(2, 4, 10)H8 while the G12H8, T(7, 8)H6 and the C(1, 9)H6 remained practically unaffected. More pronounced were the observed strong upfield shifts for A(5, 6)H2 (0.14 and 0.16 ppm respectively). Since these protons are located in the DNA helix minor groove, it can be concluded that the one phen of (4) was associated with the DNA through the minor groove between the –A5A6– bases. In the B-type DNA, the sugar protons H1′, H4′ and H5′ are located in the minor groove, as well. In fact, A(5, 6)H1′, together with the T8H1′ were among the most affected signals which shifted upfield in a range of 0.07 to 0.11 ppm (Table S2†). Supposing that the one phen moiety of (4) is bound at the –A5A6– sequence, the other cannot be in a long distance, as it is limited by the length of BL-1 (about 10.5 Å) and it may extend towards the -3′ or the -5′ sides of the sequence. At all cases the rigidity of (4) did not allow the effective binding of the other phen, since it was restricted by the close contact of the BL-1 with the DNA backbone. Thus, at the first case (→3′), (4) extended towards the T7T8C9 sequence meeting the major groove of the helix. The protons which were located there, such as T7(H2′′, H3′), T8H5′5′′ and C9H3′, shifted significantly upfield (>0.05 ppm) due to their proximity with the aromatic ring system of BL-1. The observed upfield shift of T8H1′ (0.07 ppm) could be explained with the assumption that the binding of (4) disorganized the DNA helix B-form. In the other case, (→5′), (4) must extend towards the G4C3G2 of the sequence meeting again the major groove of the helix. Indeed, the protons of G4(H2′, H2′′) and G2H2′ shifted significantly upfield indicating that the complex is directed towards the 5′- start of the sequence. In conclusion, both possibilities for the orientation of (4) are well supported by the 1H NMR observations (Fig. 4). Downfield shifts for the C1 sugar protons probably arise from structural perturbations of DNA helix. Increasing the ratio at r = 1, remarkable downfield shifts for the major groove aromatic protons of G2H8, C3(H5, H6), G4H8 and G10H8, T8CH3 and C9H5 were observed indicating that (4), after the phen binding between in the –A5A6– bases through the minor groove, extended to both sides of the helix major groove. It is worth mentioning, that a new signal assigned to the G4H1′ was observed shifted by 0.17 ppm upfield, probably due to a significant perturbation of the DNA helix. This signal was observed dramatically upfield (0.57 ppm) at r = 2 (Table S2†).
3.2.1.2. Exchangeable imino and amino protons. Exchangeable imino and amino protons of the DNA bases are observable in H2O/D2O (9
![[thin space (1/6-em)]](https://www.rsc.org/images/entities/char_2009.gif) :
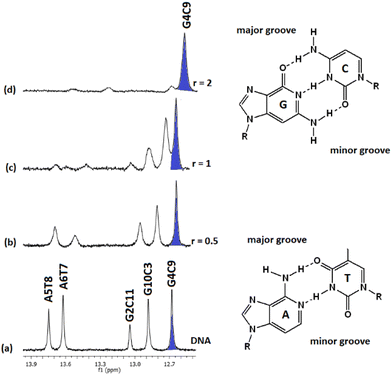
:![[thin space (1/6-em)]](https://www.rsc.org/images/entities/char_2009.gif) 1) and their chemical shifts are informative of the Watson–Crick (W.–C.) hydrogen bonds between the DNA strands. The C3, C9, and C11NH1 form three hydrogen bonds with the G10, G4, and G2N1 respectively, while the T8 and T7N1H form two hydrogen bonds with the A5 and A6N1. At the ends of the sequence, C1 and G12 are either not hydrogen bonded or they are, but their imino and amino protons were exchanged very fast with the solvent and therefore were not observable.49 Thus, in the spectrum of the free DNA five signals appeared as it is illustrated in Fig. 5.
1) and their chemical shifts are informative of the Watson–Crick (W.–C.) hydrogen bonds between the DNA strands. The C3, C9, and C11NH1 form three hydrogen bonds with the G10, G4, and G2N1 respectively, while the T8 and T7N1H form two hydrogen bonds with the A5 and A6N1. At the ends of the sequence, C1 and G12 are either not hydrogen bonded or they are, but their imino and amino protons were exchanged very fast with the solvent and therefore were not observable.49 Thus, in the spectrum of the free DNA five signals appeared as it is illustrated in Fig. 5.
Upon addition of (4)Cl4, at the r = 0.5, significant broadening of both the T8 and T7N1H was observed, while the C3, C9, and C11NH1 shifted downfield at the range of 0.1–0.5 ppm. At ratio 1![[thin space (1/6-em)]](https://www.rsc.org/images/entities/char_2009.gif) :
:![[thin space (1/6-em)]](https://www.rsc.org/images/entities/char_2009.gif) 1, significant changes in this part of the spectrum take place. Both signals of T7 and T8NH1 were lost, indicating that they no longer participate in hydrogen bonding between the A5T7 and A6T8 base pairs. On the other hand, the signals of C3, C9 and C11NH1 shifted considerably upfield by 0.25, 0.18 and 0.27 ppm correspondingly reflecting a weaker interaction of these protons with the complementary guanine N1. Also, low intensity broad signals appeared that may be assigned to adduct(s) between the DNA and (4)Cl4. At higher ratio 2
1, significant changes in this part of the spectrum take place. Both signals of T7 and T8NH1 were lost, indicating that they no longer participate in hydrogen bonding between the A5T7 and A6T8 base pairs. On the other hand, the signals of C3, C9 and C11NH1 shifted considerably upfield by 0.25, 0.18 and 0.27 ppm correspondingly reflecting a weaker interaction of these protons with the complementary guanine N1. Also, low intensity broad signals appeared that may be assigned to adduct(s) between the DNA and (4)Cl4. At higher ratio 2![[thin space (1/6-em)]](https://www.rsc.org/images/entities/char_2009.gif) :
:![[thin space (1/6-em)]](https://www.rsc.org/images/entities/char_2009.gif) 1, the signals of C3 and C9NH1 disappeared while the signal of the remaining hydrogen bonded C9NH1 shifted upfield by 0.23 ppm indicating that only the pair C9G4 is still connected by this bond. Additional information may be gained through the hydrogen bonded amino protons of the bases C and G. At r = 0.5 downfield shifts were observed. At r = 1 double signals for G4N2H/C9N2H, G10N2H/C3N2H and G2N2H/C11N2H were observed showing a reduction in the symmetry of the helix and a general unwinding of the strands. At r = 2 only two signals of the G4N2H/C9N2H were observed confirming that the strands connected only through these G4C9 hydrogen bonds. In other words, it seems that the addition of (4)Cl4 caused separation of the DNA strands, starting from the central part of the sequence –A5A6– at low ratio. At higher ratio the unwinding extended to both sides of the helix (–G2C3– and –G10C11–) omitting the base pair C9G4. The above results are summarized in Table 3 and Fig. 5.
1, the signals of C3 and C9NH1 disappeared while the signal of the remaining hydrogen bonded C9NH1 shifted upfield by 0.23 ppm indicating that only the pair C9G4 is still connected by this bond. Additional information may be gained through the hydrogen bonded amino protons of the bases C and G. At r = 0.5 downfield shifts were observed. At r = 1 double signals for G4N2H/C9N2H, G10N2H/C3N2H and G2N2H/C11N2H were observed showing a reduction in the symmetry of the helix and a general unwinding of the strands. At r = 2 only two signals of the G4N2H/C9N2H were observed confirming that the strands connected only through these G4C9 hydrogen bonds. In other words, it seems that the addition of (4)Cl4 caused separation of the DNA strands, starting from the central part of the sequence –A5A6– at low ratio. At higher ratio the unwinding extended to both sides of the helix (–G2C3– and –G10C11–) omitting the base pair C9G4. The above results are summarized in Table 3 and Fig. 5.
![[thin space (1/6-em)]](https://www.rsc.org/images/entities/char_2009.gif) :
:![[thin space (1/6-em)]](https://www.rsc.org/images/entities/char_2009.gif) D2O, 9
D2O, 9![[thin space (1/6-em)]](https://www.rsc.org/images/entities/char_2009.gif) :
:![[thin space (1/6-em)]](https://www.rsc.org/images/entities/char_2009.gif) 1, 298 K, buffer phosphates 100 mM, pH = 7.0), and induced shifts upon the addition (4)Cl4 at r = 0.5, 1, and 2. Negative sign for upfield shifts and positive sign for downfield shifts (in parenthesis). In bold indicated shifts which are higher than 0.05 ppm. n.o. = not observed
1, 298 K, buffer phosphates 100 mM, pH = 7.0), and induced shifts upon the addition (4)Cl4 at r = 0.5, 1, and 2. Negative sign for upfield shifts and positive sign for downfield shifts (in parenthesis). In bold indicated shifts which are higher than 0.05 ppm. n.o. = not observed
| r = 0 | r = 0.5 | r = 1 | r = 2 | |||||||||
|---|---|---|---|---|---|---|---|---|---|---|---|---|
| N1H | N2H | N2H* | N1H | N2H | N2H* | N1H | N2H | N2H* | N1H | N2H | N2H* | |
| C1G12 | n.o. | n.o. | n.o. | n.o. | n.o. | n.o. | n.o. | n.o. | ||||
| G2C11 | 13.04 | 8.44 | 6.57 | 12.94 (−0.10) | 8.42 (−0.02) | 6.61 (+0.04) | 12.77 (−0.27) | 8.43 (−0.01) | 6.51 (6.62) | — | 6.77 (6.73) | |
| C3G10 | 12.88 | 8.36 | 6.41 | 12.80 (−0.08) | 8.36 (0.00) | 6.49 (+0.08) | 12.63 (−0.25) | 8.37 (+0.01) | 6.81 (6.94) | — | 6.87 (6.92) | |
| G4C9 | 12.68 | 8.40 | 6.79 | 12.63 (−0.05) | 8.42 (+0.02) | 6.88 (+0.09) | 12.50 (−0.18) | 8.41 (+0.01) | 7.01 (7.06) | 12.45 (−0.23) | 8.41 (+0.01) | 7.02 (7.05) |
| A5T8 | 13.75 | — | 13.69 (−0.06) | — | — | |||||||
| A6T7 | 13.62 | — | 13.51 (−0.11) | — | — | |||||||
NOESY spectra at r = 0.5, 1 and 2 were recorded to give insight of the binding mode of (4) (Fig. S20, S23 and S26†). However, just a few unambiguous, low intensity cross-peaks were observed arising from the phenanthroline protons and the DNA. Thus, meaningful are the NOE connectivities between the binding to A5A6 phen (phenH3/8, phenH4/7 → A6H8) as well as those of the other phen (phenH2/9 → T8H3′ and phenH4/7 → C9H5H5′′) supporting that (4) was oriented towards the 3′-end of the sequence. Also, the NOEs between the phenH2/9 → G2H8, C3H6 and C3H5 support that (4) was oriented towards the 5′- start of the sequence.
Visualization drawings of the NMR results are presented in Fig. 6.
![[thin space (1/6-em)]](https://www.rsc.org/images/entities/char_2009.gif) :
:![[thin space (1/6-em)]](https://www.rsc.org/images/entities/char_2009.gif) D2O, 9
D2O, 9![[thin space (1/6-em)]](https://www.rsc.org/images/entities/char_2009.gif) :
:![[thin space (1/6-em)]](https://www.rsc.org/images/entities/char_2009.gif) 1, 298 K, buffer phosphates 100 mM, pH = 7.0) free (r = 0), and upon the addition to the d(5′-CGCGAATTCGCG-3′)2 at r = 0.5, 1 and 2. Shifts are denoting in parenthesis (negative sign upfield and positive sign downfield shifts). n.o. = not observed. A and B denotes the signals of the two moieties of (5)
1, 298 K, buffer phosphates 100 mM, pH = 7.0) free (r = 0), and upon the addition to the d(5′-CGCGAATTCGCG-3′)2 at r = 0.5, 1 and 2. Shifts are denoting in parenthesis (negative sign upfield and positive sign downfield shifts). n.o. = not observed. A and B denotes the signals of the two moieties of (5)
| Protons/r | 0.5 | 1 | 2 | ||||
|---|---|---|---|---|---|---|---|
| (5)Cl4 | A | B | A | B | A | B | |
| H2/9 | 10.04 | 9.94 (−0.10) | 9.82 (−0.22) | 9.96 (−0.08) | 9.86 (−0.18) | 9.99 (−0.05) | 9.89 (−0.15) |
| H3/8 | 8.24 | 8.12 (−0.12) | 7.78 (−0.46) | 8.14 (−0.10) | 7.82 (−0.42) | 8.19 (−0.05) | 7.86 (−0.38) |
| H4/7 | 8.87 | 8.47 (−0.40) | 8.32 (−0.55) | 8.53 (−0.34) | 8.36 (−0.51) | 8.60 (−0.27) | 8.43 (−0.34) |
| H5/6 | 8.15 | 7.62 (−0.53) | 7.60 (−0.55) | 7.65 (−0.50) | 7.65 (−0.50) | 7.72 (−0.43) | 7.70 (−0.45) |
| Ha | 8.20 | 8.19 (−0.01) | 8.18 (−0.02) | 8.17 (−0.03) | |||
| Hb | 7.06 | 7.13 (+0.07) | 7.13 (+0.07) | 7.11 (+0.05) | |||
| Hc | 2.74 | 2.73 (−0.02) | 2.71 (−0.03) | 2.68 (−0.04) | |||
| H2c6c | 6.52 | 6.41 (−0.11) | 6.41 (−0.11) | 6.42 (−0.10) | |||
| H3c5c | 6.09 | 6.10 (+0.01) | 6.09 (0.00) | 6.08 (−0.01) | |||
| H9c10c | 0.72 | 0.67 (−0.05) | 0.64 (−0.08) | 0.67 (−0.05) | 0.64 (−0.08) | 0.67 (−0.05) | 0.65 (−0.07) |
| H7c | 1.59 | 1.60 (+0.01) | 1.60 (+0.01) | 1.62 (+0.03) | |||
| H8c | 2.37 | 2.27 (−0.10) | 2.29 (−0.08) | 2.29 (−0.08) | |||
3.2.2.1. Non-exchangeable DNA protons. More informative about the binding mode of (5) are the affected proton signals of the DNA (Table S3†). Thus, from the lower ratio (r = 0.5) significant downfield shifts were observed for the C3H5 (0.06 ppm), G4H8 (0.05), C9H5 (0.08 ppm) and G10H8 (0.05 ppm) indicating a decrease in the stacking between these bases. However, significant upfield shifts of the minor groove located protons G(2,4)H1′, T8H1′, G10H1′ and C11H1′ were observed indicating the presence of the aromatic ring systems of (5) in the helix minor groove. Perturbations of the helix conformation at the C1–G2 start of the sequence may also be assumed due to the downfield shifts of C1 sugar protons. In principle, at r = 1 four phen moieties can be bound to DNA. Since the distance between C3G4 and T8C9 of the sequence is too long so that one (5) may be associated in both sequence places, it can be assumed that two different (5) bind to C3G4 and T8C9. At higher ratios all the proton signals of the DNA shifted further, while significant shifts were observed for the C3H6, G2H8 and C11H6 as well as for the majority of the base's H1′. All of the above observations are consistent with a binding of (5) at the C3G4 and T8C9 bases of the sequence in such a manner so that the second phen extended towards the end or the start of the sequence. It is worth mentioning that the affected aromatic protons of C3(H5, H6), G4H8 and C9H5, G10H8 are located at the helix major groove, while the sugars H1′ protons in the helix minor groove.
3.2.2.2. Exchangeable DNA protons. Upon the addition of (5) to DNA, the exchangeable non-hydrogen bonding amino protons N2H* of both C9 and C3 shifted significantly downfield showing a perturbation in helix conformation. Also, the imino C3N1H, C11N1H and T7N1H shifted upfield indicating that the C.–W. hydrogen bonds between the C3G10, C11G2 and T8A5 began to weaken (Fig. 7). Considering that these protons are located both in major and minor groove of the helix, it can be suggested that (5) is bound with the one phen in the major groove, extended at the allowed length of BL-2, to the helix minor groove. However, there are two different areas of the sequence where the one phen of (5) binds in the major groove: the –C3G4– and the –C9G10–. From this position, (5) extended either to the 3′ end or to 5′ start point of the sequence (Fig. 8). It is worth mentioning that the imino protons of C9N1H and T8N1H were not affected at all during the titration indicating that the C.–W. bonds of the base pairs C9G4 and T8A5 stabilize the duplex, as it was also observed. The above results are summarized in Table 5.
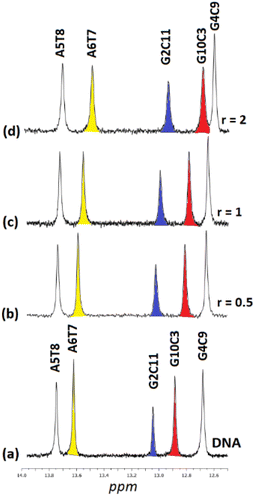 | ||
| Fig. 7 Part of the 1H NMR spectra of the d(5′-CGCGAATTCGCG-3′)2 (a) free, and upon addition of (5)Cl4 at r = 0.5, 1 and 2, (b–d), showing the imino protons of the W.–C. hydrogen bonds. | ||
![[thin space (1/6-em)]](https://www.rsc.org/images/entities/char_2009.gif) :
:![[thin space (1/6-em)]](https://www.rsc.org/images/entities/char_2009.gif) D2O, 9
D2O, 9![[thin space (1/6-em)]](https://www.rsc.org/images/entities/char_2009.gif) :
:![[thin space (1/6-em)]](https://www.rsc.org/images/entities/char_2009.gif) 1, 298 K, buffer phosphates 100 mM, pH = 7.0), and induced shifts upon the addition (5)Cl4 at r = 0.5, 1 and 2. Negative sign for upfield shifts and positive sign for downfield shifts (in parenthesis). In bold indicated shifts which are higher than 0.05 ppm. n.o. = not observed
1, 298 K, buffer phosphates 100 mM, pH = 7.0), and induced shifts upon the addition (5)Cl4 at r = 0.5, 1 and 2. Negative sign for upfield shifts and positive sign for downfield shifts (in parenthesis). In bold indicated shifts which are higher than 0.05 ppm. n.o. = not observed
| r = 0 | r = 0.5 | r = 1 | r = 2 | |||||||||
|---|---|---|---|---|---|---|---|---|---|---|---|---|
| N1H | N2H | N2H* | N1H | N2H | N2H* | N1H | N2H | N2H* | N1H | N2H | N2H* | |
| C1G12 | n.o. | n.o. | n.o. | n.o. | n.o. | n.o. | n.o. | n.o. | ||||
| G2C11 | 13.04 | 8.44 | 6.57 | 12.99 (−0.05) | 8.42 (−0.02) | 6.62 (+0.05) | 12.97 (−0.07) | 8.42 (−0.02) | 6.65 (+0.08) | 12.94 (−0.10) | 8.42 (−0.02) | 6.65 (+0.08) |
| C3G10 | 12.88 | 8.36 | 6.41 | 12.79 (−0.09) | 8.36 (0.00) | 6.53 (+0.08) | 12.73 (−0.15) | 8.36 (0.00) | 6.53 (+0.08) | 12.69 (−0.19) | 8.34 (−0.02) | 6.55 (+0.14) |
| G4C9 | 12.68 | 8.40 | 6.79 | 12.65 (−0.03) | 8.43 (+0.03) | 6.88 (+0.09) | 12.63 (−0.05) | 8.43 (+0.03) | 6.93 (+0.14) | 12.61 (−0.07) | 8.42 (+0.02) | 6.94 (+0.15) |
| A5T8 | 13.75 | — | — | 13.73 (−0.02) | — | — | 13.73 (−0.02) | — | — | 13.72 (−0.03) | — | — |
| A6T7 | 13.62 | — | — | 13.56 (−0.06) | — | — | 13.53 (−0.09) | — | — | 13.51 (−0.11) | — | — |
The NOESY spectra of the adducts at all ratios showed a few NOE connectivities between (5) and DNA due to the fast exchange equilibrium (Fig. S29, S32 and S35†). Among them are those arising from the one phen moiety (phenH2/9 → G4H8 and C3H5, phenH4/7 → C9H5′) as well as those of the other phen moiety of (5) (phenH3/8 → T8H3′, phenH4/7 → C9H5H5′′). Also, cross-peaks between the BL-2 and the DNA sugar protons, such as Ha → C9H4′, Hb → C9H3′, Hc → A6H3′ showed that (5) extended in both major and minor groove of the helix.
Visualization drawings of the NMR results are presented in Fig. 8.
![[thin space (1/6-em)]](https://www.rsc.org/images/entities/char_2009.gif) :
:![[thin space (1/6-em)]](https://www.rsc.org/images/entities/char_2009.gif) D2O, 9
D2O, 9![[thin space (1/6-em)]](https://www.rsc.org/images/entities/char_2009.gif) :
:![[thin space (1/6-em)]](https://www.rsc.org/images/entities/char_2009.gif) 1, 298 K, buffer phosphates 100 mM, pH = 7.0) free, and upon the addition to the d(5′-CGCGAATTCGCG-3′)2 at r = 0.5, 1, and 2. Shifts are denoting in parenthesis (negative sign upfield and positive sign downfield shifts). A and B denotes the signals of the two moieties of (6). n.o. = not observed
1, 298 K, buffer phosphates 100 mM, pH = 7.0) free, and upon the addition to the d(5′-CGCGAATTCGCG-3′)2 at r = 0.5, 1, and 2. Shifts are denoting in parenthesis (negative sign upfield and positive sign downfield shifts). A and B denotes the signals of the two moieties of (6). n.o. = not observed
| Protons/r | 0.5 | 1 | 2 | ||||
|---|---|---|---|---|---|---|---|
| (6)Cl4 | A | B | A | B | A | B | |
| H2/9 | 10.03 | 9.91 (−0.12) | 9.88 (−0.15) | 9.91 (−0.09) | 9.92 (−0.11) | 9.93 (−0.10) | 9.93 (−0.10) |
| H3/8 | 8.21 | 7.91 (−0.30) | 7.96 (−0.25) | 8.04 (−0.17) | |||
| H4/7 | 8.83 | 8.33 (−0.50) | 8.29 (−0.54) | 8.41 (−0.42) | 8.37 (−0.46) | 8.47 (−0.36) | 8.43 (−0.40) |
| H5/6 | 8.10 | 7.57 (−0.53) | 7.54 (−0.56) | 7.57 (−0.53) | 7.56 (−0.54) | 7.70 (−0.40) | 7.69 (−0.41) |
| Ha | 8.20 | 8.15 (−0.05) | 8.16 (−0.04) | 8.16 (−0.04) | |||
| Hb | 7.01 | 7.07 (+0.06) | 7.09 (+0.08) | 7.06 (+0.05) | |||
| Hc | 2.40 | 2.42 (+0.02) | 2.41 (+0.01) | 2.42 (+0.02) | |||
| Hd | 1.57 | 1.55 (−0.02) | 1.55 (−0.02) | 1.55 (−0.02) | |||
| H2c6c | 6.51 | 6.37 (−0.14) | 6.39 (−0.12) | 6.41 (−0.10) | |||
| H3c5c | 6.14 | 6.05 (−0.11) | 6.07 (−0.07) | 6.08 (−0.06) | |||
| H9c10c | 0.75 | 0.67 (−0.08) | 0.65 (−0.10) | 0.69 (+0.06) | 0.66 (−0.09) | 0.69 (−0.06) | 0.67 (−0.09) |
| H7c | 1.78 | 1.70 (−0.08) | 1.71 (−0.07) | 1.71 (−0.07) | |||
| H8c | 2.39 | 2.22 (−0.17) | 2.26 (−0.13) | 2.28 (−0.11) | |||
3.2.3.1. Non-exchangeable DNA protons. Marginal changes of the DNA signals at r = 0.5 were observed with the exception of the downfield shift of C(1, 3, 11)H5 (0.05 ppm) and the upfield shift for the T8H1′ (0.06 ppm). At r = 1 the above shifts were significantly prolonged together with downfield shifts for the C(3, 11)H6 and upfield shifts of the H1′ of G4, T8 and C11. At r = 2 significant upfield shifts (>0.05) were observed for the H1′ at the end of sequence from T8 to G12 (Table S4†). The above results are consistent with a binding of (6) in both minor and major groove of the helix, since the C(1, 3, 11)H5/H6 and G2H8 are located in the major while the sugar H1′ in the helix minor groove.
3.2.3.2. Exchangeable DNA protons. Upon the addition of (6) to DNA the signals of non-hydrogen bonding N2H* shifted significantly downfield suggesting a perturbation of helix conformation features. In parallel, the C11N1H imino proton contributing the G2C11 C.–W. hydrogen bonding, shifted upfield by 0.26 ppm (r = 2) indicating that this base pair began to dissociate. Similarly, the base pairs G10C3 and G4C9 showed the same tendency. However, the central part of the sequence –AATT– seemed to be rather undamaged. In other words, the binding of (6) unwound the DNA strands from the ends of the sequence affecting the –CGCG– domains. The above results are summarized in Fig. 9 and Table 7.
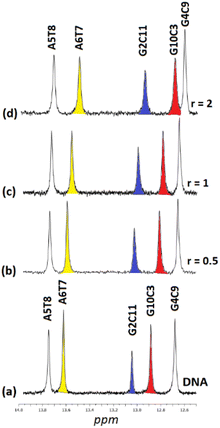 | ||
| Fig. 9 Part of the 1H NMR spectra of the d(5′-CGCGAATTCGCG-3′)2 (a) free, and upon addition of (5)Cl4 at r = 0.5, 1 and 2, (b–d), showing the imino protons of the W.–C. hydrogen bonds. | ||
![[thin space (1/6-em)]](https://www.rsc.org/images/entities/char_2009.gif) :
:![[thin space (1/6-em)]](https://www.rsc.org/images/entities/char_2009.gif) D2O, 9
D2O, 9![[thin space (1/6-em)]](https://www.rsc.org/images/entities/char_2009.gif) :
:![[thin space (1/6-em)]](https://www.rsc.org/images/entities/char_2009.gif) 1, 298 K, buffer phosphates 100 mM, pH = 7.0), and induced shifts upon the addition (6)Cl4 at r = 0.5, 1, and 2. Negative sign for upfield shifts and positive sign for downfield shifts (in parenthesis). In bold indicated shifts which are higher than 0.05 ppm. n.o. = not observed
1, 298 K, buffer phosphates 100 mM, pH = 7.0), and induced shifts upon the addition (6)Cl4 at r = 0.5, 1, and 2. Negative sign for upfield shifts and positive sign for downfield shifts (in parenthesis). In bold indicated shifts which are higher than 0.05 ppm. n.o. = not observed
| r | 0 | 0.5 | 1 | 2 | ||||||||
|---|---|---|---|---|---|---|---|---|---|---|---|---|
| Base | N1H | N2H | N2H* | N1H | N2H | N2H* | N1H | N2H | N2H* | N1H | N2H | N2H* |
| C1G12 | n.o. | n.o. | n.o. | n.o. | n.o. | n.o. | n.o. | n.o. | ||||
| G2C11 | 13.04 | 8.44 | 6.57 | 12.97 (−0.07) | 8.44 (0.00) | 6.62 (+0.05) | 12.86 (−0.18) | 8.47 (+0.03) | 6.68 (+0.11) | 12.78 (−0.26) | n.o. | 6.72 (+0.15) |
| C3G10 | 12.88 | 8.36 | 6.41 | 12.84 (−0.04) | 8.39 (+0.03) | 6.48 (+0.07) | 12.78 (−0.10) | 8.42 (+0.05) | 6.57 (+0.16) | 12.74 (−0.14) | 8.43 (+0.07) | 6.62 (+0.21) |
| G4C9 | 12.68 | 8.40 | 6.79 | 12.67 (−0.01) | 8.44 (+0.04) | 6.84 (+0.05) | 12.62 (−0.04) | 8.44 (+0.04) | 6.89 (+0.10) | 12.62 (−0.06) | 8.47 (+0.07) | 6.92 (+0.14) |
| A5T8 | 13.75 | — | 13.74 (−0.01) | — | — | 13.72 (−0.03) | 13.71 (−0.04) | |||||
| A6T7 | 13.62 | — | 13.60 (−0.02) | — | — | 13.58 (−0.04) | 13.56 (−0.06) | |||||
The NOESY spectra at all ratios show some very weak intensity NOE connectivities between (6) and DNA due to the fast exchange equilibrium which cannot be evaluated (Fig. S38, S41 and S44†).
Visualization drawings of the NMR results are presented in Fig. 10.
3.3. NMR studies of the interaction of the mononuclear complex [(η6-cym)Ru(phen)(py)]Cl2 (7)Cl2 with the DNA fragment d(5′-CGCGAATTCGCG-3′)2
For comparison reasons, the interaction of the mononuclear complex [(η6-cym)Ru(phen)(py)]Cl2 with the DNA was studied (Fig. S45–S47†). At r = 1, marginal upfield shifts for the proton signals of (7) were observed, mainly at phen H5/6 (Table 8). At higher ratios, the protons of phenanthroline were affected more than those of py and cym indicating that (7) interacts with the DNA through the chelating ligand phen. However, the magnitude of the observed upfield shifts is small enough, indicating a weak binding of (7) with the DNA. Also, marginal shifts were observed for the DNA non-exchangeable protons while the signals of the W.–C. hydrogen bonding protons remained intact (Fig. 11). It is worth mentioning that this complex exhibited promising cytotoxic activity against A2780 cell line (IC50 = 25.9 μM).35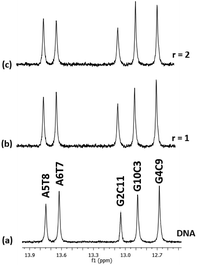 | ||
| Fig. 11 Part of the 1H NMR spectra of the d(5′-CGCGAATTCGCG-3′)2 (a) free and upon addition of (7)Cl2 at r = 1, and 2, (b) and (c), showing the imino protons of the W.–C. hydrogen bonds. | ||
![[thin space (1/6-em)]](https://www.rsc.org/images/entities/char_2009.gif) :
:![[thin space (1/6-em)]](https://www.rsc.org/images/entities/char_2009.gif) D2O, 9
D2O, 9![[thin space (1/6-em)]](https://www.rsc.org/images/entities/char_2009.gif) :
:![[thin space (1/6-em)]](https://www.rsc.org/images/entities/char_2009.gif) 1, 298 K, buffer phosphates 100 mM, pH = 7.0) free, and upon the addition to the d(5′-CGCGAATTCGCG-3′)2 at r = 1 and 2. Shifts are denoting in parenthesis (negative sign upfield and positive sign downfield shifts). n.o. = not observed
1, 298 K, buffer phosphates 100 mM, pH = 7.0) free, and upon the addition to the d(5′-CGCGAATTCGCG-3′)2 at r = 1 and 2. Shifts are denoting in parenthesis (negative sign upfield and positive sign downfield shifts). n.o. = not observed
| H2/9 | H3/8 | H4/7 | H5/6 | H2c6c | H3c5c | H9c10c | H7c | H8c | pyH2/6 | pyH3/5 | pyH4 | |
|---|---|---|---|---|---|---|---|---|---|---|---|---|
| r = 0 | 10.06 | 8.23 | 8.84 | 8.12 | 6.53 | 6.17 | 0.75 | 1.83 | 2.21 | 8.40 | 7.27 | 7.78 |
| r = 1 | 10.05 (−0.01) | 8.22 (−0.01) | 8.82 (−0.02) | 8.08 (−0.04) | 6.51 (−0.02) | 6.16 (−0.01) | 0.74 (−0.01) | 1.81 (−0.02) | 2.21 (0.00) | 8.39 (−0.01) | 7.26 (−0.01) | 7.78 (0.00) |
| r = 2 | 10.03 (−0.03) | 8.20 (−0.03) | 8.80 (−0.04) | 8.05 (−0.07) | 6.50 (−0.03) | 6.14 (−0.03) | 0.74 (−0.01) | 1.80 (−0.03) | 2.20 (0.01) | 8.38 (−0.02) | 7.25 (−0.02) | 7.77 (−0.01) |
3.4. Fluorescence quenching studies of the interactions of the complexes (4)Cl4, (5)Cl4, (6)Cl4 and the mononuclear (7)Cl2 with the DNA fragment d(5′-CGCGAATTCGCG-3′)2
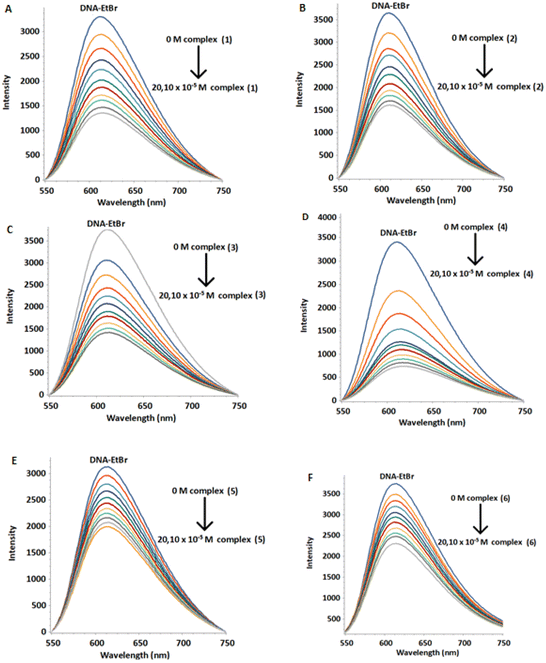
Fluorescence is a very sensitive and efficient method to study interaction between DNA and various types of binders.50 Among them, ethidium bromide (EtBr) is known to bind to DNA mainly through intercalation. The displacement of EtBr from a DNA–EtBr complex by a DNA binder is evidence that it intercalates as well. The above process results in a decrease in the DNA–EtBr emission intensity. However, EtBr can also bind to the DNA minor groove.51 In this case, its displacement causes smaller decrease in the intensity of the DNA–EtBr emission indicating a non-intercalative binding mode, most probably through the helix minor groove.52 Recently it has been reported that EtBr intercalates mainly in the terminal bases as well as in the internal pairs of d(5′-CGCGAATTCGCG-3′)2.53Initially, we loaded an amount of EtBr to a solution of d(5′-CGCGAATTCGCG-3′)2 (aqueous buffer phosphates 100 mM, pH = 7.0) until the intensity of emission became practically unaffected. Samples of the above stock-solution were titrated with the complexes (1)Cl4–(6)Cl4 and the monometallic (7)Cl2. At all cases the fluorescence intensity of the DNA–EtBr system decreased upon increasing the concentration of the complexes in different degree, without any considerable change in the wavelength of the emission maximum (Fig. 12 and S48, S49†). These results are consistent with displacement of the EtBr from the DNA–EtBr due to the binding of the complexes either through intercalation or through binding to the helix minor groove.54 This is exactly what the competition quenching constant, Ksv reflects. The quenching percentage of the complexes is 31–81% at 291 K, 49–90% at 298 K and 54–91% at 310 K. The values of the Stern–Volmer quenching constant (Ksv) were found from the slopes of the plots F/F0 = f([Q]) (Fig. S50†). The fluorescence quenching of the DNA–EB adduct was in good agreement with the Stern–Volmer linear equation (R > 0.98).
The binding constants (Kb) and the number of binding sites per dimer (n) were estimated by fluorescence titration data and calculated through the double logarithmic plot log[F0 − F/F] versus log[Q] (Fig. S51 and S52†). The Ksv, Kb and n values are summarized in Table 9 and Table S5.† The values of binding constants were in the range of 103–104 M−1, suggesting moderate binding affinity of the complexes, with the number of binding sites practically being one.55
| Complex | K sv (104 M−1) | K b (103 M−1) | n | Quenching (%) |
|---|---|---|---|---|
| (1) | 0.780 ± 0.073 | 10.002 ± 0.001 | 1.03 | 77.29 |
| (2) | 0.747 ± 0.031 | 6.511 ± 0.001 | 0.99 | 68.25 |
| (3) | 0.771 ± 0.025 | 3.473 ± 0.001 | 0.92 | 69.65 |
| (4) | 16.65 ± 0.080 | 12.133 ± 0.001 | 0.97 | 89.86 |
| (5) | 0.286 ± 0.018 | 2.333 ± 0.001 | 0.98 | 43.11 |
| (6) | 0.273 ± 0.027 | 3.336 ± 0.001 | 1.03 | 39.95 |
| (7) | 2.014 ± 0.129 | 0.158 ± 0.001 | 0.98 | 35.03 |
All the above results suggest that the complexes (4) and (1) were the most effective in competing the EtBr, with the tendency for all complexes to be: (4) > (1) > (3) > (2) > (5) > (6). Also, the binding constants of (4) and (1) were one order of magnitude greater than the other studied complexes. Regarding the values of the Ksv and Kb constants, it is concluded that the complexes (4) and (1) bound to DNA intercalate at least with one phen moiety between the DNA bases, while (3), (2), (5) and (6) are probably groove binders. Apart from the bridging ligand, the chelating ligand (phen or bpy) also plays a significant role in the interaction with the DNA. The Ksv value of (4) was 20 times higher than that of (1) due to the more extended aromatic ring system of phen compared to bpy, allowing (4) to stack easier between the DNA bases.56 On the other hand, the calculated values for the mononuclear complex (7)Cl2Ksv = 2.014 ± 0.129 × 10³ M−1 and Kb = 0.158 ± 0.001 × 10³ M−1 were significantly lower than those of (1)Cl4–(6)Cl4, indicating a lower ability to displace the EtBr from DNA–EtBr and much lower DNA binding affinity than the corresponding bimetallic ones (Fig. S53†). Similarly, a weak binding mode has been reported for the complex [(η6-cym)Ru(bpm)(4,4′-bpy)]2+.35
In general, the type of DNA–ligand interactions can be predicted by measuring the thermodynamic parameters (ΔH°, ΔS° and ΔG°). These parameters can usually be calculated by the van't Hoff plot (Fig. S54†). Specifically, based on the enthalpy and entropy value, the following can be assumed: (i) ΔH < 0 and ΔS < 0, van der Waals or hydrogen bonding, (ii) ΔH > 0 and ΔS > 0, hydrophobic forces, (iii) ΔH < 0 or ΔS ≈ 0 and ΔS > 0, ionic interactions and (iv) ΔH < 0 or ΔH ≈ 0 and ΔS > 0, electrostatic forces.
In the cases of (1)–(6), the values of both ΔH° and ΔS° were positive indicating that the binding between the complexes and DNA is driven by hydrophobic forces in the rich areas of the DNA helix, such as the minor groove and the stacked bases. Furthermore, the negative ΔG values showed the spontaneous interaction between the complexes and the DNA (Table 10 and Table S6†). The spontaneity of the reaction was due to the higher negative values of TΔS°, compared to ΔH°, suggesting that the interaction of the complexes with d(5′-CGCGAATTCGCG-3′)2 is mainly entropy-driven.
| Complex | ΔH° (kJ mol−1) | ΔS° (J mol−1) | ΔG° (kJ mol−1) |
|---|---|---|---|
| (1) | 40.38 ± 0.019 | 212.18 ± 0.065 | −22.85 ± 0.038 |
| (2) | 63.77 ± 0.108 | 286.51 ± 0.366 | −21.60 ± 0.218 |
| (3) | 64.24 ± 0.187 | 282.46 ± 0.630 | −19.93 ± 0.375 |
| (4) | 28.09 ± 0.032 | 172.31 ± 0.107 | −23.25 ± 0.064 |
| (5) | 34.56 ± 0.032 | 180.61 ± 0.108 | −19.26 ± 0.065 |
| (6) | 88.01 ± 0.172 | 363.63 ± 0.581 | −20.34 ± 0.346 |
3.5. Molecular docking
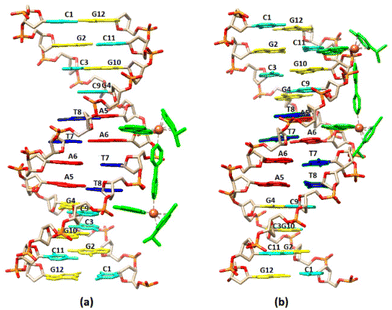
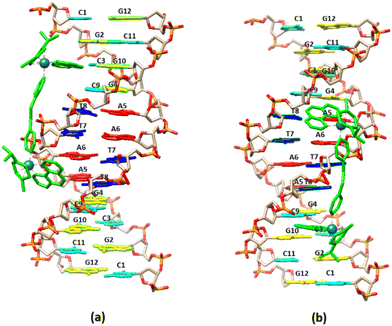
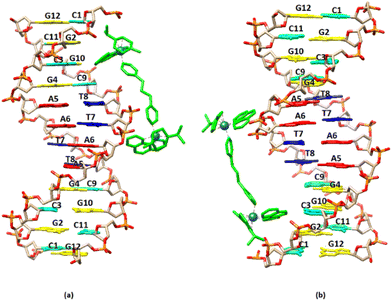
The molecular docking studies have been carried out for the complexes (4), (5) and (6).In the case of (4), since the NMR and fluorescence data indicate an intercalation binding for the guest molecule (DNA), a special twist was required. The free docking cannot handle intercalation, as the DNA is a rigid body and the space between the nucleic acids is too small. To overcome this issue, anthracenes were used in order to widen the gap between nucleic acids. A force field (OPLS3) was also utilized for the relaxation of the DNA into the new pose. This new pose was used as the receptor for complex (4). In addition, the narrowing down of the box to specific locations, especially in the center of the DNA, was used to enhance the docking results.57 By arranging the energy conformations (4) was found to adopt the lowest energy pose (−4.84 kcal mol−1) by binding between the bases A5 and A6 of the one strand, through the phenanthroline, extending towards the end of the sequence. In this arrangement the other phenanthroline of (4) is placed close to the base pairs G10/C3 and C11/G2 (Fig. 13a). In the case of (5) the pose with the lowest binding energy showed that the complex binds to the minor grove with the one phenanthroline at the –AATT– part of the sequence while the second phenanthroline is placed in the major groove. Similar results were obtained and in the case of (6). In summary, the molecular docking results are in a good agreement with those achieved from the NMR and fluorescence studies and are illustrated in Fig. 13.
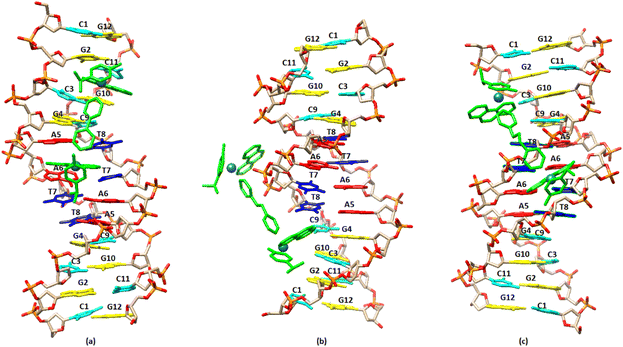 | ||
| Fig. 13 Molecular docked models of the complexes (a), (4); (b), (5); (c), (6), showing the binding with the DNA sequence d(5′-CGCGAATTCGCG-3′)2. | ||
3.6. Cytotoxic activity
To study the effects of the (4)Cl4, (5)Cl4 and (6)Cl4 complexes on cell growth in vitro, three cancer cell lines and an immortalized mouse normal cell line were treated with increasing concentrations of these complexes for 72 h. Cells were also treated with cisplatin as a positive control. The cytotoxic effects of the 3 complexes and cisplatin were monitored by employing real-time imaging using the Incucyte ZOOM system and the results are shown in Table 11. Cisplatin showed the greatest cytotoxicity of all agents in all cell lines, as expected, with IC50 values ranging from 3.87 to 17.10 μM (Table 11). Notably, the human ovarian cancer cell line A2780 and its cisplatin-resistant counterpart (A2780cis-res) were the most sensitive to the complexes (5)Cl4 and (6)Cl4, which showed similar cytotoxic action (Table 11). In contrast, the two complexes showed weak cytoxic effects in the mouse embryonic fibroblast cell line NIH-3T3 and even weaker in the human breast adenocarcinoma cell line MCF-7. The complex (4)Cl4 was moderately cytotoxic in the A2780 cells, had weak effects in NIH3T3 and A2780cis-res cells and had very low cytotoxicity in the MCF-7 cells (Table 11).| NIH-3T3 | MCF-7 | A2780 | A2780cis-res | |
|---|---|---|---|---|
| a The selectivity index (SI) has been introduced as the ratio of the IC50 of a compound against a cancer cell line and its toxicity IC50 against non-malignant cell line.58 | ||||
| Cisplatin | 11.63 ± 0.60 | 11.88 ± 1.20 (1.0) | 3.87 ± 0.33 (3.0) | 17.10 ± 0.24 (0.7) |
| (6)Cl4 | 184.9 ± 13.07 | 337.5 ± 0.16 (0.5) | 34.77 ± 1.71 (5.3) | 47.42 ± 3.51 (3.9) |
| (5)Cl4 | 137.6 ± 18.45 | 275.8 ± 37.43 (0.5) | 35.57 ± 9.75 (3.9) | 46.00 ± 6.13 (3.0) |
| (4)Cl4 | 192.3 ± 25.38 | 302.7 ± 26.62 (0.6) | 117.3 ± 26.92 (1.6) | 193.00 ± 33.15 (1.0) |
In conclusion, the complexes (5)Cl4 and (6)Cl4 are quite efficient in ovarian cancer in vitro and have low cytotoxic activity in breast cancer and normal cells. These data suggest that they could be potentially used as new pharmacological agents specifically in this type of cancer.
4. Conclusions
Bridging of η6-arene-Ru(II)-N,N′-1,10-phenanthroline or 2,2′-bipyridine, with various in length 4,4′-bipyridines (BL), leads to the formation of bimetallic complexes with saturated ruthenium coordination sphere. The inter-ruthenium distance is determined from the BL, as well as the relative orientation of the chelating ligand, producing different geometries. The latter is the factor that defines their DNA binding properties. In the case of (4) the ridged and short BL-1 leads to the intercalation of the one phenanthroline and minor groove binding of the other as indicated from the NMR and fluorescence titrations (Kb = 12.133 × 10³ M−1). Remarkable unwinding of the d(5′-CGCGAATTCGCG-3′)2 helix is induced, starting from the disruption of the C.–W. hydrogen bonds of the –AATT– central part of the sequence. Despite the effective binding with a Kb = 12.133 × 10³ M−1 and the derangement of the DNA helix, complex (4) was found to be almost inactive against all the studied cancer cell lines with low selectivity (SI = 0.5–1.6). In contrast, the complexes (5) and (6), that were found to be groove binders with Kb values one order of magnitude lower than that of (4), showed high selectivity against A2780 and A2780res (SI = 3.0–5.3). Finally, the similar mononuclear complex [(η6-cym)Ru(phen)(py)]2+ showed even lower binding affinity for the d(5′-CGCGAATTCGCG-3′)2 (Kb = 0.158 × 10³ M−1). However, it was found to be cytotoxic against A2780 cell line (IC50 = 25.9 μM).35In conclusion, η6-arene-Ru(II) binuclear complexes with ruthenium saturated coordination sphere bind to DNA with higher affinity than the corresponding mononuclear ones. The DNA Kb values might be regulated by the BL (inter-ruthenium distance) and the L, providing the ability for different binding modes. The binding through intercalation, that causes dramatic alterations in the DNA helix, is not the sufficient condition for such type of ruthenium compounds to be cytotoxic. Even though the binding mode is the crucial factor, the distance between the binding regions in the sequence seems to follow the rule, that the lengthier is the most cytotoxic.
Conflicts of interest
There are no conflicts to declare.Acknowledgements
The authors C. Georgakopoulou, D. Thomos and T. Tsolis, financially supported from the program “Development of research infrastructure for the design, production, development of quality characteristics and safety of agrofoods and functional foods (RI-Agrofoods)” (MIS 5047235) which is implemented under the Action “Reinforcement of the Research and Innovation Infrastructure”, funded by the Operational Programme Competitiveness, Entrepreneurship and Innovation (NSRF 2014–2020) and co-financed by Greece and the European Union (European Regional Development Fund). The authors would also like to thank the unit of environmental, organic, biochemical high-resolution analysis-ORBITRAP-LC-MS, the unit of single crystal diffraction and the NMR Center of the University of Ioannina for providing access to the facilities.References
- (a) A. D. Richards and A. Rodger, Chem. Soc. Rev., 2007, 36, 471–483 RSC; (b) B. J. Pages, D. L. Ang, E. P. Wright and J. R. Aldrich-Wright, Dalton Trans., 2015, 44, 3505–3526 RSC; (c) G.-Y. Li, R.-L. Guan, L.-N. Ji and H. Chao, Coord. Chem. Rev., 2014, 281, 100–113 CrossRef CAS.
- M. Karimi Goftar, N. M. Kor and Z. M. Kor, Int. J. Adv. Biol. Biomed. Res., 2014, 2, 811–822 Search PubMed.
- S. Li, V. R. Cooper, T. Thonhauser, B. I. Lundqvist and D. C. Langreth, J. Phys. Chem. B, 2009, 113, 11166–11172 CrossRef CAS PubMed.
- F. Gago, Methods, 1998, 14, 277–292 CrossRef CAS PubMed.
- P. Nagababu, M. Shilpa, J. N. Lavanya Latha, I. Bhatnagar, P. N. B. S. Srinivas, Y. P. Kumar, K. L. Reddy and S. Satyanarayana, J. Fluoresc., 2011, 21, 563–572 CrossRef CAS PubMed.
- (a) R. E. Dickerson and H. R. Drew, J. Mol. Biol., 1981, 149, 761–786 CrossRef CAS PubMed; (b) M. A. El Hassan and C. R. Calladine, Philos. Trans. R. Soc., A, 1997, 355, 43–100 CrossRef CAS; (c) A. A. Gorin, V. B. Zhurkin and W. K. Olson, J. Mol. Biol., 1995, 247, 34–48 CrossRef CAS PubMed.
- (a) R. Palchaudhuri and P. J. Hergenrother, Curr. Opin. Biotechnol., 2007, 18, 497–503 CrossRef CAS PubMed; (b) C. C. Tsai, S. C. Jain and H. M. Sobell, Proc. Natl. Acad. Sci. U. S. A., 1975, 72, 628–632 CrossRef CAS PubMed; (c) Y. Pommier, R. E. Schwartz, L. A. Zwelling and K. W. Kohn, Biochemistry, 1985, 24, 6406–6410 CrossRef CAS PubMed.
- H. K. Liu and P. J. Sadler, Acc. Chem. Res., 2011, 44, 349–359 CrossRef CAS PubMed.
- (a) K. R. Barnes and S. J. Lippard, Met. Ions Biol. Syst., 2004, 42, 143–177 CrossRef CAS PubMed; (b) A. H. Wang, J. Nathans, G. van der Marel, J. H. van Boom and A. Rich, Nature, 1978, 276, 471–474 CrossRef CAS PubMed.
- (a) B. M. Zeglis, V. C. Pierre and J. K. Barton, Chem. Commun., 2007, 44, 4549–4596 Search PubMed; (b) B. Elias and A. Kirsch-De Mesmaeker, Coord. Chem. Rev., 2006, 250, 1627–1641 CrossRef CAS; (c) N. W. Luedtke, J. S. Hwang, E. Nava, D. Gut, M. Kol and Y. Tor, Nucleic Acids Res., 2003, 31, 5732–5740 CrossRef CAS PubMed.
- M. J. Waring and L. P. G. Wakelin, Nature, 1974, 252, 653–657 CrossRef CAS PubMed.
- H. L. Chan, D. L. Ma, M. Yang and C. M. Che, ChemBioChem, 2003, 4, 62–68 CrossRef CAS PubMed.
- J. Aldrich-Wright, C. Brodie, E. C. Glazer, N. W. Luedtke, L. Elson-Schwab and Y. Tor, Chem. Commun., 2004, 8, 1018–1019 RSC.
- A. Nazif, J. A. Bangert, I. Ott, R. Gust, R. Stoll and W. S. Sheldrick, J. Inorg. Biochem., 2009, 103, 1405–1414 CrossRef PubMed.
- L. K. Batchelor and P. J. Dyson, Trends Chem., 2019, 1, 644–655 CrossRef CAS.
- H. L. Chan, D. L. Ma, M. Yang and C. M. Che, J. Biol. Inorg. Chem., 2003, 8, 761–769 CrossRef CAS PubMed.
- A. Nazif, R. Rubbiani, H. Alborzinia, I. Kitanovic, S. Wölfl, I. Ott and W. S. Sheldrick, Dalton Trans., 2012, 41, 5587–5598 RSC.
- M. Kokoschka, J. A. Bangert, R. Stoll and W. S. Sheldrick, Eur. J. Inorg. Chem., 2010, 1507–1515 CrossRef CAS.
- S. Q. Zhang, L. H. Gao, H. Zhao and K. Z. Wang, Curr. Med. Chem., 2018, 27, 3735–3752 CrossRef PubMed.
- H. K. Saeed, I. Q. Saeed, N. J. Buurma and J. A. Thomas, Chem. – Eur. J., 2017, 23, 5467–5477 CrossRef CAS PubMed.
- F. Li, J. G. Collins and F. R. Keene, Chem. Soc. Rev., 2015, 44, 2529–2542 RSC.
- F. E. Poynton, S. A. Bright, S. Blasco, D. C. Williams, J. M. Kelly and T. Gunnlaugsson, Chem. Soc. Rev., 2017, 46, 7706–7756 RSC.
- F. Jia, S. Wang, Y. Man, P. Kumar and B. Liu, Molecules, 2019, 24, 769–785 CrossRef PubMed.
- I. Greguric, J. R. Aldrich-Wright and J. Grant Collins, J. Am. Chem. Soc., 1997, 119, 3621–3622 CrossRef CAS.
- J. P. Hall, D. Cook, S. R. Morte, P. McIntyre, K. Buchner, H. Beer, D. J. Cardin, J. A. Brazier, G. Winter, J. M. Kelly and C. J. Cardin, J. Am. Chem. Soc., 2013, 135, 12652–12659 CrossRef CAS PubMed.
- S. P. Foxon, C. Metcalfe, H. Adams, M. Webb and J. A. Thomas, Inorg. Chem., 2007, 46, 409–416 CrossRef CAS PubMed.
- J. P. Hall, K. O'Sullivan, A. Naseer, J. A. Smith, J. M. Kelly and C. J. Cardin, Proc. Natl. Acad. Sci. U. S. A., 2011, 108, 17610–17614 CrossRef CAS PubMed.
- M. Bahira, M. J. McCauley, A. A. Almaqwashi, P. Lincoln, F. Westerlund, I. Rouzina and M. C. Williams, Nucleic Acids Res., 2015, 43, 8856–8867 CrossRef CAS PubMed.
- (a) A. Raza, S. A. Archer, S. D. Fairbanks, K. L. Smitten, S. W. Botchway, J. A. Thomas, S. MacNeil and J. W. Haycock, J. Am. Chem. Soc., 2020, 142, 4639–4647 CrossRef CAS PubMed; (b) S. D. Fairbanks, C. C. Robertson, F. R. Keene, J. A. Thomas and M. P. Williamson, J. Am. Chem. Soc., 2019, 141, 4644–4652 CrossRef CAS PubMed; (c) H. K. Saeed, S. Sreedharan, P. J. Jarman, S. A. Archer, S. D. Fairbanks, S. P. Foxon, A. J. Auty, D. Chekulaev, T. Keane, A. J. H. M. Meijer, J. A. Weinstein, C. G. W. Smythe, J. Bernardino de la Serna and J. A. Thomas, J. Am. Chem. Soc., 2020, 142, 1101–1111 CrossRef CAS PubMed.
- P. Starha, Coord. Chem. Rev., 2021, 431, 213690 CrossRef CAS.
- H. Chen, J. A. Parkinson, O. Novakova, J. Bella, F. Y. Wang, A. Dawson, R. Gould, S. Parsons, V. Brabec and P. J. Sadler, Proc. Natl. Acad. Sci. U. S. A., 2003, 100, 14623–14628 CrossRef CAS PubMed.
- M. A. Bennett, T. N. Huang, T. W. Matheson, A. K. Smith, S. Ittel and W. Nickerson, Inorg. Synth., 1982, 21, 74–78 CAS.
- D. R. Robertson, I. W. Robertson and T. A. Stephenson, J. Organomet. Chem., 1980, 202, 309–318 CrossRef CAS.
- J. Canivet, L. Karmazin-Brelot and G. Süss-Fink, J. Organomet. Chem., 2005, 690, 3202–3211 CrossRef CAS.
- S. Betanzos-Lara, L. Salassa, A. Habtemariam, O. Novakova, A. M. Pizarro, G. J. Clarkson, B. Liskova, V. Brabec and P. J. Sadler, Organometallics, 2012, 31, 3466–3479 CrossRef CAS.
- Bruker, APEX 3; SAINT, SHELXT, Bruker AXS Inc., 5465 East Cheryl Parkway, Madison, WI 53711, 2016 Search PubMed.
- G. M. Sheldrick, SADABS, University of Göttingen, Germany, 1996.
- G. M. Sheldrick, Acta Crystallogr., Sect. C: Struct. Chem., 2015, 71, 3 Search PubMed.
- C. B. Hübschle, G. M. Sheldrick and B. Dittrich, J. Appl. Crystallogr., 2011, 44, 1281 CrossRef PubMed.
- A. L. Spek, Acta Crystallogr., Sect. D: Biol. Crystallogr., 2009, 65, 148 CrossRef CAS PubMed.
- L. J. Barbour, J. Supramol. Chem., 2001, 1, 189 CrossRef CAS.
- S. U. Rehman, Z. Yaseen, A. R. Husain, T. Sarwar, H. M. Ishqi and M. Tabish, PLoS One, 2014, 9(4), e93913 CrossRef PubMed.
- Y. Song, J. Kang, J. Zhou, Z. Wang, X. Lu, L. Wang and J. Gao, Spectrochim. Acta, Part A, 2000, 56, 2491–24972 CrossRef.
- C. G. Ricci and P. A. Netz, J. Chem. Inf. Model., 2009, 49(8), 1925–1935 CrossRef CAS PubMed.
- E. F. Pettersen, T. D. Goddard, C. C. Huang, G. S. Couch, D. M. Greenblatt, E. C. Meng and T. E. Ferrin, J. Comput. Chem., 2004, 25, 1605–1612 CrossRef CAS PubMed.
- T. Tsolis, N. Nikolaou, K. Ypsilantis, A. Kougioumtzi, D. Kordias, A. Magklara and A. Garoufis, J. Inorg. Biochem., 2021, 219, 111435 CrossRef CAS PubMed.
- (a) T. Tsolis, K. Ypsilantis, A. Kourtellaris and A. Garoufis, Polyhedron, 2018, 149, 45–53 CrossRef CAS; (b) T. Tsolis, K. D. Papavasileiou, S. A. Divanis, V. S. Melissas and A. Garoufis, J. Inorg. Biochem., 2016, 160, 12–23 CrossRef CAS PubMed; (c) T. Tsolis, M. J. Manos, S. Karkabounas, I. Zelovitis and A. Garoufis, J. Organomet. Chem., 2014, 768, 1–9 CrossRef CAS.
- S. K. Konda, H. Wang, S. M. Cutts, D. R. Phillips and J. G. Collins, Org. Biomol. Chem., 2015, 13, 5972–5982 RSC.
- D. J. Patel, S. A. Kozalowski, L. A. Marky, C. Broka, J. A. Rice, K. Itakura and K. J. Breslauer, Biochemistry, 1982, 21, 428–436 CrossRef CAS PubMed.
- M. M. V. Ramana, R. Betkar, A. Nimkar, P. Ranade, B. Mundhe and S. Pardeshi, J. Photochem. Photobiol., B, 2015, 151, 194–200 CrossRef CAS PubMed.
- V. Brabec and J. Kasparkova, Coord. Chem. Rev., 2018, 376, 75–94 CrossRef CAS.
- Z. Aramesh-Boroujeni, S. Jahani, M. Khorasani-Motlagh, K. Kerman, N. Aramesh, S. Asadpour and M. Noroozifar, J. Biomol. Struct. Dyn., 2019, 37, 1–30 CrossRef PubMed.
- R. Galindo-Murillo and T. E. Cheatham, Nucleic Acids Res., 2021, 49, 3735–3747 CrossRef CAS PubMed.
- (a) S. Anbu, M. Kandaswamy, S. Kamalraj, J. Muthumarry and B. Varghese, Dalton Trans., 2011, 40, 7310–7318 RSC; (b) T. Afrati, A. A. Pantazaki, C. Dendrinou-Samara, C. Raptopoulou, A. Terzis and D. P. Kessissoglou, Dalton Trans., 2010, 39, 765–775 RSC; (c) C. Gurses, A. Aktas, S. Balcioglu, A. Fadhilah, Y. Gok and B. Ates, J. Mol. Struct., 2022, 1247, 131350 CrossRef CAS.
- P. Khanvilkar, S. R. Dash, A. Vohra, R. Devkar and D. Chakraborty, J. Biomol. Struct. Dyn., 2021, 39, 6044–6055 CrossRef CAS PubMed.
- J. M. Kelly, A. B. Tossi, D. J. McConnell and C. OhUigin, Nucleic Acids Res., 1985, 13, 6017–6034 CrossRef CAS PubMed.
- Y. Gilad and H. Senderowitz, J. Chem. Inf. Model., 2014, 54(1), 96–107 CrossRef CAS PubMed.
- (a) G. Indrayanto, G. S. Putra and F. Suhud, Validation of in-vitro bioassay methods: Application in herbal drug research, in Profiles of Drug Substances, Excipients and Related Methodology, ed. A. A. Al-Majed, Academic Press, 2021, vol. 46, pp. 273–307 Search PubMed; (b) J. C. Pritchetta, L. Naesens, J. Montoya, L. Flamand, I. Lautenschlager, G. Krueger and D. Ablashi, Diagnosis and Clinical Management, 3rd edn, 2014, pp. 311–331 Search PubMed; (c) O. A. Pena-Moran, M. L. Villarreal, L. Alvarez-Berber, A. Meneses-Acosta and V. Rodriguez-Lop, Molecules, 2016, 21, 1013 CrossRef PubMed.
Footnotes |
| † Electronic supplementary information (ESI) available. CCDC 2179567. For ESI and crystallographic data in CIF or other electronic format see DOI: https://doi.org/10.1039/d2dt02304k |
| ‡ Co-shared first authorship. |
| This journal is © The Royal Society of Chemistry 2022 |

