A NIR ratiometric fluorescent probe for the ‘naked-eye’ detection of endogenous hypochlorous acid in practical samples†
Kangming
Xiong
a,
Fangjun
Huo
 b,
Yongbin
Zhang
b,
Ying
Wen
a and
Caixia
Yin
b,
Yongbin
Zhang
b,
Ying
Wen
a and
Caixia
Yin
 *a
*a
aInstitute of Molecular Science, Key Laboratory of Materials for Energy Conversion and Storage of Shanxi Province, Shanxi University Taiyuan, 030006, China. E-mail: yincx@sxu.edu.cn
bResearch Institute of Applied Chemistry (RIAC), Shanxi University, Taiyuan, 030006, China
First published on 1st March 2019
Abstract
Hypochlorous acid (HClO), as one of the reactive oxygen species (ROS), is very important to the human immune system. Although many hypochlorous acid fluorescent probes have been developed, most of them are not suitable for detecting endogenous HClO due to their own limitations such as a slow response time and short emission wavelength. In this work, we designed a near-infrared ratiometric (2.1 to 15.3, I608/I735) fluorescent probe with a quick response (20 s) based on cyanine polyene derivatives. The system could detect endogenous hypochlorous acid in HepG-2 cells. It is significant that the color change in the measurement process makes the probe applicable to the determination of hypochlorous acid content in an 84 disinfectant and other actual samples.
1 Introduction
Reactive oxygen species (ROS) play important roles in some biological pathways and stress responses.1–4 As one of the reactive oxygen species (ROS), HClO is involved in multiple processes of the immune system such as counteracting pathogens, suppressing inflammation, and regulating cellular apoptosis.5–8 However, the excessive production of HClO in living systems can induce many human diseases.9–11 Due to the importance of HClO, a wide variety of fluorescent probes for the specific detection of HClO have been reported.12–22 From these reported HClO fluorescent probes, many have their own limitations such as a slow response time, short emission wavelength, and fluorescence signals in a single channel. Therefore, it is necessary to develop a fluorescent probe with good optical properties to detect endogenous hypochlorite.In the past few decades, NIR fluorescent probes have become promising modalities for monitoring the levels of various biologically important species in vitro and in vivo.23–25 To a large extent, the long NIR emission wavelength can greatly facilitate the in vivo imaging of molecular processes.26,27 NIR probes enable deep photon penetration in tissues, minimize photo-damage to biological samples, and produce low background autofluorescence in living systems. So far, cyanine dyes are considered to be the most efficient NIR fluorophores. In addition, the fluorescent probes based on cyanine dyes tend to have ratiometric optical properties.
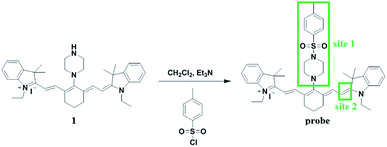
In this study, we aimed to develop a near-infrared ratiometric fluorescent probe for detecting endogenous hypochlorous acid. Herein, we employed cyanine dyes as NIR fluorophores and constructed two reaction sites in the probe for detecting HClO. Site 1 of the probe as an electron-withdrawing group was reactive and could leave easily via a nucleophilic substitution reaction by a hydroxyl ion, which could facilitate a rapid reaction between hypochlorous acid and the probe. In the presence of HClO, site 2 of the probe was oxidized to oxirane, which exhibited shorter absorption and emission wavelengths compared to the original probe molecule. Thus, the structure change enabled the probe to be a suitable near-infrared ratiometric probe for detecting endogenous HClO. Moreover, the probe was successfully applied for the detection of the ClO− level in an 84 disinfectant.
2 Experimental section
2.1 Materials and instruments
Cyclohexanone, 2,3,3-trimethylindolenine and 4-toluene sulfonyl chloride were purchased from Aladdin Industrial Corporation. 84 disinfectant was purchased from Beijing Ruitong Commodity Co., Ltd. Sodium hypochlorite solution was purchased from Tianjin Elephant Chemical Sales Co., Ltd. Anionic salts were purchased from Shanghai Experiment Reagent Co., Ltd. The HepG-2 cells were provided by the Institute of Biotechnology of Shanxi University. An MTT kit was purchased from Beyotime Biotechnology Co., Ltd. 1H NMR and 13C NMR spectra were recorded on Bruker AVANCE-600 MHz and 150 MHz NMR spectrometers, respectively. HRMS was performed with a Thermo Scientific Q Exactive MS instrument. Ultraviolet-visible (UV-Vis) spectra were obtained on an Agilent 8453 spectrophotometer. Fluorescence spectra were recorded on a Hitachi F-7000 spectrophotometer. Fluorescence imaging was conducted using an Airyscan confocal laser scanning microscope.2.2 Measurement procedure
The stock solution of the probe was prepared in CH3OH. Stock solutions of anionic salts were prepared in deionized water. UV-Vis and fluorescence spectra were obtained in CH3OH/H2O (v/v, 1![[thin space (1/6-em)]](https://www.rsc.org/images/entities/char_2009.gif) :
:![[thin space (1/6-em)]](https://www.rsc.org/images/entities/char_2009.gif) 1) solutions. Fluorescence measurements were studied with a slit width of 20 nm/20 nm.
1) solutions. Fluorescence measurements were studied with a slit width of 20 nm/20 nm.
HepG-2 cells were grown in Dulbecco's Modified Eagle's Medium (DMEM) supplemented with 10% heat-inactivated fetal bovine serum (FBS) and 1% antibiotic at 37 °C in a humidified incubator containing 5% CO2 and 95% air.
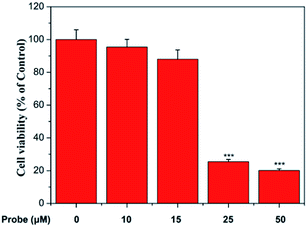
Cell cytotoxicity was evaluated by an MTT assay. Cells were seeded in 96-well plates (2 × 10⁴ cells per well), incubated with different concentrations of the probe (0–50 μM) for 12 h, and subjected to MTT assays (n = 5). The absorbance was measured with a microplate reader at 490 nm.
HepG-2 cells were plated on a 6-well plate and allowed to adhere for 12 hours. To detect exogenous ClO−, cells were incubated with the probe (10 μM) in a DMEM medium for 30 min at 37 °C; subsequently, the experimental group was incubated with ClO− (80 μM, 30 min). To detect endogenous ClO−, the experimental group was pretreated with LPS (2 μg L−1, 20 μL) for 10 h and then incubated with the probe (10 μM) for 30 min at 37 °C. Cells were imaged with an Airyscan confocal laser scanning microscope (λex = 561 nm, λem = 570–620 nm for the green channel, and λem = 710–754 nm for the red channel).
The stock solution of 84 disinfectant was diluted 10 times with deionized water. In the 2 mL solution of H2O/CH3OH (1/1, v/v) containing the probe (15 μM), different volumes (2, 4, and 6 μL) of the 84 disinfectant samples were added to the same solution system. After mixing, the corresponding UV-Vis absorption signals were recorded.
3 Results and discussion
3.1 Synthesis of the probe
The synthesis route of the probe is shown in Scheme 1. Compound 1 was synthesized according to previously reported procedures.28,291 (0.138 g, 0.2 mmol) was dissolved in dichloromethane and triethylamine (0.030 g, 0.3 mmol) was added; then, the resulting solution was cooled to 0 °C in an ice bath. After the resulting solution was stirred for 5 min, a solution of 4-toluene sulfonyl chloride (0.057 g, 0.3 mmol) in dichloromethane was added dropwise. Then, the reaction mixture was stirred for 4 hours at room temperature. The solvent was evaporated under reduced pressure and then, the product was purified by column chromatography on silica gel (CH2Cl2/MeOH, 20![[thin space (1/6-em)]](https://www.rsc.org/images/entities/char_2009.gif) :
:![[thin space (1/6-em)]](https://www.rsc.org/images/entities/char_2009.gif) 1 v/v) to give the probe as a purple-red solid (0.028 g, 32.8% yield). 1H NMR (600 MHz, chloroform-d) δ: 7.80 (d, J = 8.1 Hz, 1H), 7.77 (d, J = 8.0 Hz, 2H), 7.65 (d, J = 13.7 Hz, 2H), 7.49 (d, J = 8.0 Hz, 2H), 7.37 (t, J = 7.5 Hz, 2H), 7.25 (s, 1H), 7.22–7.18 (m, 2H), 7.08 (d, J = 8.0 Hz, 2H), 5.98 (d, J = 13.7 Hz, 2H), 4.10 (q, J = 6.8 Hz, 4H), 3.58 (s, 4H), 3.25 (s, 4H), 2.58 (s, 3H), 2.50 (t, J = 5.9 Hz, 4H), 1.81 (d, J = 6.0 Hz, 2H), 1.45 (s, 12H), 1.38 (t, J = 7.1 Hz, 6H). 13C NMR (150 MHz, chloroform-d) δ: 169.5, 161.0, 144.2, 142.0, 141.7, 140.5, 132.3, 130.1, 128.8, 128.3, 127.1, 124.4, 121.8, 110.0, 98.3, 53.3, 48.3, 47.7, 46.2, 45.0, 40.6, 39.5, 39.4, 29.7, 28.4, 25.5, 21.8, 21.5, 12.1. HRMS m/z: [M]+ calculated for C45H55N4O2S+: 715.40402; measured: 715.40594. The detailed characterization data of the probe are shown in Fig. S1.†
1 v/v) to give the probe as a purple-red solid (0.028 g, 32.8% yield). 1H NMR (600 MHz, chloroform-d) δ: 7.80 (d, J = 8.1 Hz, 1H), 7.77 (d, J = 8.0 Hz, 2H), 7.65 (d, J = 13.7 Hz, 2H), 7.49 (d, J = 8.0 Hz, 2H), 7.37 (t, J = 7.5 Hz, 2H), 7.25 (s, 1H), 7.22–7.18 (m, 2H), 7.08 (d, J = 8.0 Hz, 2H), 5.98 (d, J = 13.7 Hz, 2H), 4.10 (q, J = 6.8 Hz, 4H), 3.58 (s, 4H), 3.25 (s, 4H), 2.58 (s, 3H), 2.50 (t, J = 5.9 Hz, 4H), 1.81 (d, J = 6.0 Hz, 2H), 1.45 (s, 12H), 1.38 (t, J = 7.1 Hz, 6H). 13C NMR (150 MHz, chloroform-d) δ: 169.5, 161.0, 144.2, 142.0, 141.7, 140.5, 132.3, 130.1, 128.8, 128.3, 127.1, 124.4, 121.8, 110.0, 98.3, 53.3, 48.3, 47.7, 46.2, 45.0, 40.6, 39.5, 39.4, 29.7, 28.4, 25.5, 21.8, 21.5, 12.1. HRMS m/z: [M]+ calculated for C45H55N4O2S+: 715.40402; measured: 715.40594. The detailed characterization data of the probe are shown in Fig. S1.†
3.2 UV-Vis and fluorescence spectra for probe sensing ClO−
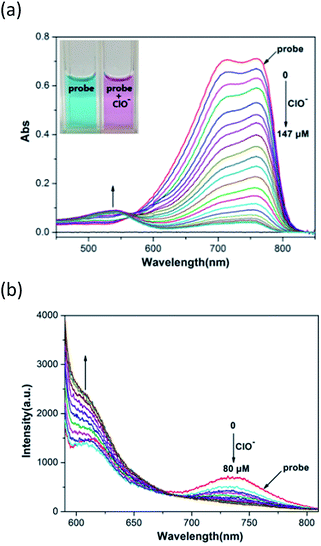
Initially, we used the probe to test its sensing behavior towards ClO− by obtaining UV-Vis and fluorescence spectra. Fig. 1a displays the change in the UV-Vis spectra after the addition of ClO− to a 15 μM solution of the probe in H2O/CH3OH (1/1, v/v). With an increase in the concentration of ClO− (0–147 μM), the absorption peak of the probe at 760 nm gradually decreased and a new absorption peak at 540 nm gradually increased. Fig. 1b displays the fluorescence intensity response of the probe to ClO− in an H2O/CH3OH (1/1, v/v) solution. We selected 560 nm as the excitation wavelength to test ClO−. After excitation, the emission intensity at 735 nm was remarkably reduced and the emission intensity at 608 nm was remarkably enhanced with a dramatic fluorescence ratio (I608/I735) enhancement from 2.1 to 15.3 in the ClO− concentration range of 0–80 μM.3.3 Selective response of probe to ClO−
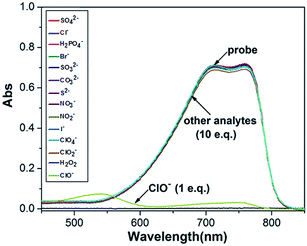
The selectivity of the probe to ClO− was studied through UV-Vis spectra. Fig. 2 displays the change in the UV-Vis spectra for the probe (15 μM) in the presence of various analytes in an H2O/CH3OH (1/1, v/v) solution, including SO42−, Cl−, H2PO4−, Br−, SO32−, CO32−, S2−, NO3−, NO2−, I−, ClO4−, ClO2−, H2O2, and ClO−. From Fig. 2, we can see that ClO− (147 μM, 1 eq.) causes a significant change in the UV-Vis spectra, but other analytes (1470 μM, 10 eq.) cause almost no changes in the UV-Vis spectra. At the same time, other analytes did not drive the color change of the system. These experimental results indicated that the probe can serve as a selective chemosensor for ClO−.3.4 Time dependence in the detection process of ClO−
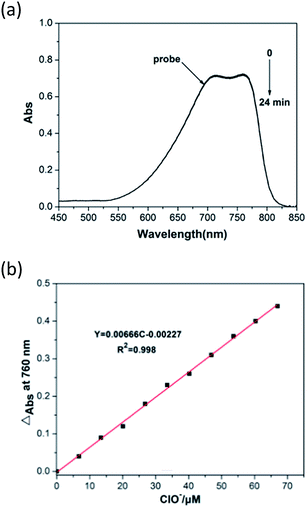
It is expected that the introduction of electron-withdrawing groups can accelerate the oxidation of hypochlorous acid to the probe. The response time of the probe to hypochlorous acid was studied by spectral monitoring. We also studied the response time between the probe and ClO− in H2O/CH3OH (1/1, v/v). The UV-Vis absorption spectra of the probe (15 μM) at 760 nm were recorded in the presence of 147 μM ClO−. The reaction was completed within 20 s. The process showed a color gradient, due to which the detection could be monitored by the naked eye in practical samples (Fig. 3).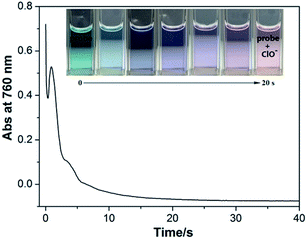 | ||
| Fig. 3 Response time curve of the probe (15 μM) upon the addition of 147 μM ClO− in H2O/CH3OH (1/1, v/v). | ||
3.5 Detection limits for ClO−
The detection limit of the probe for ClO− was calculated with the formula detection limit = 3σ/S.30 The absorption of the probe (15 μM) at 760 nm was linearly proportional to the amount of ClO− from 0 to 67 μM (Fig. 4). The detection limit for ClO− was calculated to be 1.165 μM, and the linear relationship was 0.998.3.6 Proposed sensing mechanism
To study the proposed sensing mechanism (Scheme 2), we conducted the corresponding preparation and characterization of the product probe-ClO−. The 1H NMR and HRMS characterization data of the product probe-ClO− can be seen in Fig. S2.† From the HRMS spectra of the product probe-ClO−, we can find a peak at 509.31625, corresponding to the product probe-ClO−, and a peak at 214.10036, corresponding to the by-product. Therefore, we can deduce that site 1 of the probe was eliminated and the olefin bond in site 2 was oxidized to oxirane.31 Besides, the corresponding partial 1H NMR spectra comparison of the probe and probe-ClO− agreed well with the above results.3.7 Cell viability assays
To determine the cytotoxicity of the probe, cell viability was evaluated by MTT. Different concentrations of the probe (0, 10, 15, 25, and 50 μM) were studied in complete media for 12 h. From the results, we can see that the concentration of the probe below 15 μM has low cytotoxicity to living HepG-2 cells (Fig. 5).3.8 Cell imaging of exogenous HClO
The probe displayed outstanding sensing capability compared to many other recently reported representative fluorescent probes for detecting HClO (Table S1†), which indicates that it is promising for fluorescence imaging. The ability of the probe to detect exogenous HClO in live HepG-2 cells was evaluated by fluorescence imaging (Fig. 6). Consistent with the study of the spectra in solution, a very weak fluorescence emission was displayed by the probe in the green channel and a strong fluorescence was exhibited in the red channel. After treatment with NaClO, the fluorescence emission showed significant enhancement in the green channel and slight decrease in the red channel. The fluorescence ratio (green/red channel) increased from 0.4 to 2.2, which indicated that the probe has a strong ratiometric imaging characteristic.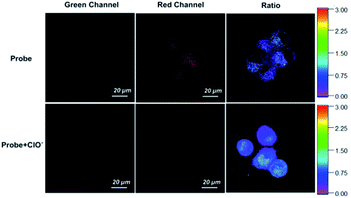 | ||
| Fig. 6 Fluorescence imaging of exogenous HClO in HepG-2 cells. Scale bar = 20 μM. Color bar: from 0 to 3. | ||
3.9 Cell imaging of endogenous HClO
To assess the capability of the probe to detect endogenous hypochlorous acid, we used lipopolysaccharide (LPS causes the release of HClO in cells and animals30,32) to induce endogenous hypochlorous acid in HepG-2 cells (Fig. 7). Compared to the observation for the control group without treatment of LPS, we found an apparent fluorescence increase in the green channel and slight decrease in the red channel of the experimental group cells treated with LPS. The fluorescence ratio (green/red channel) increased from 2 to 3.7 after the treatment of LPS. The results showed that the probe could detect endogenous hypochlorous acid generated from LPS-treated cells.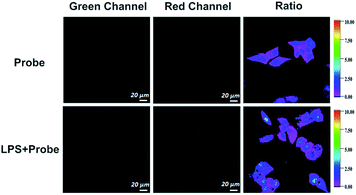 | ||
| Fig. 7 Fluorescence imaging of endogenous HClO in HepG-2 cells. Scale bar = 20 μM. Color bar: from 0 to 10. | ||
3.10 Detection of ClO− level in 84 disinfectant
The feasibility of the probe for detecting ClO− in practical samples was explored. From the UV-Vis spectra titration curves (Fig. S3†) and the calibration curve (Fig. 4b), the ClO− level in the 84 disinfectant sample was calculated to be 173.2 μM. In addition, the calculated recovery values from 92.8% to 112.5% were satisfactory, which indicated the accuracy of the method. Thus, the probe can be applied for the detection of the ClO− level in an 84 disinfectant sample. The corresponding values are listed in Table 1.4 Conclusions
In this study, we designed a near-infrared ratiometric fluorescent probe to detect LPS-induced HClO in live HepG-2 cells. The probe exhibited a fast response time, long emission wavelength, and dual fluorescence emission channels for detecting HClO. Moreover, the probe was successfully applied to the determination of the ClO− level in the 84 disinfectant. Based on the above experimental results, we hope that our work can boost the research of endogenous hypochlorous acid in disease diagnosis.Conflicts of interest
There are no conflicts of interest to declare.Acknowledgements
We thank the National Natural Science Foundation of China (No. 21775096, 21672131, 21705102), the Shanxi Province Foundation for Returness (2017-026), the Shanxi Province Science Foundation for Youths (201701D221061), the Shanxi Province “1331 project” Key Innovation Team Construction Plan Cultivation Team (2018-CT-1), and the Scientific Instrument Center of Shanxi University (201512).Notes and references
- B. D'Autreaux and M. B. Toledano, Nat. Rev. Mol. Cell Biol., 2007, 8, 813–824 CrossRef PubMed.
- T. Finkel and N. J. Holbrook, Nature, 2000, 408, 239–247 CrossRef CAS PubMed.
- M. Valko, D. Leibfritz, J. Moncol, M. T. D. Cronin, M. Mazur and J. Telser, Int. J. Biochem. Cell Biol., 2007, 39, 44–84 CrossRef CAS PubMed.
- C. C. Winterbourn, Nat. Chem. Biol., 2008, 4, 278–286 CrossRef CAS PubMed.
- C. H. Sam and H. K. Lu, J. Dent. Sci., 2009, 4, 45–54 CrossRef.
- C. C. Winterbourn, M. B. Hampton, J. H. Livesey and A. J. Kettle, J. Biol. Chem., 2006, 281, 39860–39869 CrossRef CAS PubMed.
- B. Kwaśny-Krochin, M. Bobek, E. Kontny, P. Gluszko, R. Biedroń, B. M. Chain, W. Maśliński and J. Marcinkiewicz, Amino Acids, 2002, 23, 419–426 CrossRef PubMed.
- M. Casciaro, E. D. Salvo, E. Pace, E. Ventura-Spagnolo, M. Navarra and S. Gangemi, Immun. Ageing, 2017, 14, 21 CrossRef PubMed.
- M. J. Steinbeck, L. J. Nesti, P. F. Sharkey and J. Parvizi, J. Orthop. Res., 2007, 25, 1128–1135 CrossRef CAS PubMed.
- E. Malle, T. Buch and H. J. Grone, Kidney Int., 2003, 64, 1956–1967 CrossRef CAS PubMed.
- M. Benhar, D. Engelberg and A. Levitzki, EMBO Rep., 2002, 3, 420–425 CrossRef CAS PubMed.
- K. M. Xiong, F. J. Huo, C. X. Yin, J. B. Chao, Y. B. Zhang and M. Xu, Sens. Actuators, B, 2015, 221, 1508–1514 CrossRef CAS.
- Y. T. Yang, C. X. Yin, F. J. Huo, J. B. Chao, Y. B. Zhang and S. Jin, Sens. Actuators, B, 2014, 199, 226–231 CrossRef CAS.
- J. F. Li, F. J. Huo and C. X. Yin, RSC Adv., 2014, 4, 44610–44613 RSC.
- Y. K. Yue, C. X. Yin, F. J. Huo, J. B. Chao and Y. B. Zhang, Sens. Actuators, B, 2014, 202, 551–556 CrossRef CAS.
- P. S. Zhang, H. Wang, Y. X. Hong, M. L. Yu, R. J. Zeng, Y. F. Long and J. Chen, Biosens. Bioelectron., 2018, 99, 318–324 CrossRef CAS PubMed.
- H. D. Xiao, J. H. Li, J. Zhao, G. Yin, Y. W. Quan, J. Wang and R. Y. Wang, J. Mater. Chem. B, 2015, 3, 1633–1638 RSC.
- L. Yuan, L. Wang, B. K. Agrawalla, S. J. Park, H. Zhu, B. Sivaraman, J. J. Peng, Q. H. Xu and Y. T. Chang, J. Am. Chem. Soc., 2015, 137, 5930–5938 CrossRef CAS PubMed.
- H. H. Li, L. M. Guan, X. J. Zhang, H. Yu, D. J. Huang, M. T. Sun and S. H. Wang, Talanta, 2016, 161, 592–598 CrossRef CAS PubMed.
- S. K. Yao and Y. Qian, Sens. Actuators, B, 2017, 252, 877–885 CrossRef CAS.
- Y. L. Pak, S. J. Park, D. Wu, B. Cheon, H. M. Kim, J. Bouffard and J. Yoon, Angew. Chem., Int. Ed., 2018, 57, 1567–1571 CrossRef CAS PubMed.
- Q. L. Xu, K. A. Lee, S. Lee, K. M. Lee, W. J. Lee and J. Yoon, J. Am. Chem. Soc., 2013, 135, 9944–9949 CrossRef CAS PubMed.
- K. Kiyose, H. Kojima and T. Nagano, Chem.–Asian J., 2008, 3, 506–515 CrossRef CAS.
- G. Qian and Z. Y. Wang, Chem.–Asian J., 2010, 5, 1006–1029 CrossRef CAS PubMed.
- L. Yuan, W. Y. Lin, K. B. Zheng, L. W. He and W. M. Huang, Chem. Soc. Rev., 2013, 42, 622–661 RSC.
- J. O. Escobedo, O. Rusin, S. Lim and R. M. Strongin, Curr. Opin. Chem. Biol., 2010, 14, 64–70 CrossRef CAS PubMed.
- S. A. Hilderbrand and R. Weissleder, Curr. Opin. Chem. Biol., 2010, 14, 71–79 CrossRef CAS.
- Y. Tan, L. Zhang, K. H. Man, R. PeItier, G. C. Chen, H. T. Zhang, L. Y. Zhou, F. Wang, D. Ho, S. Q. Yao, Y. Hu and H. Y. Sun, ACS Appl. Mater. Interfaces, 2017, 9, 6796–6803 CrossRef CAS PubMed.
- X. W. Cao, W. Y. Lin and L. W. He, Org. Lett., 2011, 13, 4716–4719 CrossRef CAS PubMed.
- G. X. Yin, T. T. Niu, Y. B. Gan, T. Yu, P. Yin, H. M. Chen, Y. Y. Zhang, H. T. Li and S. Z. Yao, Angew. Chem., Int. Ed., 2018, 130, 5085–5088 CrossRef.
- X. F. Zhang, W. Y. Zhao, B. Li, W. Q. Li, C. X. Zhang, X. C. Hou, J. Jiang and Y. Z. Dong, Chem. Sci., 2018, 9, 8207–8212 RSC.
- C. Y. Chuang, T. L. Chen, Y. G. Cherng, Y. T. Tai, T. G. Chen and R. M. Chen, Arch. Toxicol., 2011, 85, 209–218 CrossRef CAS PubMed.
Footnote |
| † Electronic supplementary information (ESI) available. See DOI: 10.1039/c9ay00011a |
| This journal is © The Royal Society of Chemistry 2019 |

