 Open Access Article
Enhancement of the antimicrobial activity of cinnamon essential oil-loaded electrospun nanofilm by the incorporation of lysozyme†
Kun Fenga,
Peng Wena,
Huan Yanga,
Ning Li a,
Wen Y. Loua,
Min H. Zonga and
Hong Wu
 *ab
*ab
aSchool of Food Science and Engineering, South China University of Technology, Guangzhou 510640, China. E-mail: bbhwu@scut.edu.cn; Tel: +86-20-22236669
bGuangdong Province Key Laboratory for Green Processing of Natural Products and Product Safety, Guangzhou 510640, China
First published on 5th January 2017
Abstract
Essential oils (EOs) are effective antimicrobial agents against a variety of foodborne pathogens; however, their peculiar flavor limits their applications in food preservation. Smaller amounts of EOs in the packaging material are preferable, and a combination of EOs with other antimicrobial compounds can decrease the required dose of EOs while maintaining the appropriate antimicrobial activity. In this study, a novel antimicrobial electrospun nanofilm, namely polyvinyl alcohol/β-cyclodextrin/cinnamon essential oil/lysozyme (PVA/β-CD/CEO/LYS), was fabricated by the combination of CEO and LYS as an antimicrobial agent. The suitable CEO and LYS concentration were determined as 2% (w/w) and 0.25% (w/w), respectively. Attenuated total reflectance-Fourier transform infrared spectroscopy (ATR-FTIR) and thermogravimetric analysis (TGA) indicated the existence of a molecular interaction among PVA, β-CD, CEO, and LYS, which improved the thermal stability of CEO and LYS. Compared to the PVA/LYS and PVA/β-CD/CEO nanofilm with an individual antimicrobial agent, PVA/β-CD/CEO/LYS nanofilm exhibited stronger antibacterial activity against Listeria monocytogenes and Salmonella enteritidis. In addition, it exhibited an excellent antifungal activity against Aspergillus niger and Penicillium. Its minimum inhibition concentration (MIC) against L. monocytogenes and S. enteritidis was approximately 0.8–1 mg mL−1 (corresponding CEO concentration 7.6–9.5 μg mL−1 and LYS concentration 36–45 U mL−1) and minimum bactericidal concentration (MBC) was approximately 6–7 mg mL−1 (corresponding CEO concentration 57–66.5 μg mL−1 and LYS concentration 270–315 U mL−1). Therefore, the antimicrobial PVA/β-CD/CEO/LYS electrospun nanofilm has a potential for application in active food packaging.
1 Introduction
Microbial contamination has been considered as the primary cause of foodborne disease and food quality deterioration.1 Hence, it is necessary for the food industries to develop a novel technology to inactivate or eliminate spoilage and foodborne pathogens on the surface of food products.2 One of the traditional ways to control microbial growth includes the application of antimicrobial dips or sprays on the surface of the product.3,4 However, the efficiency of the antimicrobial substances is restricted because of its uncontrolled migration into the food and partial inactivation caused by its interaction with the food components.5 A new approach to overcome this problem is the adoption of antimicrobial packaging, which has become one of the most promising active packaging methods. Contrary to the conventional packaging materials and technologies, which only provide a physical barrier to passively protect the enclosed items from tampering or contamination from physical, chemical, and biological sources,6 antimicrobial packaging materials offer several advantages, such as extending the shelf-life under a mild preservation condition, enhancing safety and sensory properties, while maintaining the nutritional quality of food.7–9Generally, inorganic, organic, and biologically active substances are used for preparing the antimicrobial packaging materials.10 To meet the health and ecological concerns, natural, efficient, and non-toxic antimicrobial agents are preferred. Essential oils (EOs), a kind of plant-derived secondary metabolites with powerful antimicrobial activity against a variety of foodborne pathogens,11,12 are catalogued as GRAS (Generally Recognized as Safe) by the U.S. Food and Drug Administration (FDA, cite: 21CFR582.20);13 however, their use in food preservation is limited due to some undesirable properties, such as their volatility, insolubility in water, and peculiar flavor. An encapsulation technique can overcome these limitations.14 β-Cyclodextrin (β-CD), which consists of a (1,4)-linked glucopyranose unit, has a truncated cone-shaped molecular structure and can entrap hydrophobic molecules into its inner cavity.15,16 Therefore, it is commonly used in the encapsulation of EOs to reduce their sensory impact on food products and increase their water solubility, which provides sufficient contact with the pathogens to inhibit their growth, making foods safer for human consumption.15
Recently, nanometer-sized materials have shown remarkable potential in food packaging. Moreover, the application of nanotechnology in food packaging has also been an emerging area.17 Compared to normal materials, nanomaterials can be developed with improved barrier, mechanical, heat-resistance, and antimicrobial properties.18,19 Electrospinning is a simple and highly versatile method to produce fibers in nanometer size with many special properties, such as smaller pores and higher surface area than that of the regular fibers,20 and this particular structure is favorable for the sustained release of antimicrobial substances from the packaging film to the food surface.21 The electrospinning technology is now well established in several fields, such as filtration,22 wound dressing,23 drug delivery,24 tissue engineering,25 etc. However, its potential use in the field of food science has been less explored.
It has been demonstrated that EOs can be incorporated into the electrospun nanofibers;26–28 however, there are few reports on the application of EOs for preparing the antimicrobial electrospun packaging materials, except for those reported by our group.29,30 For food preservation, smaller amounts of EO in the packaging materials are preferable due to their peculiar flavor. In addition, the combination of EOs with other antimicrobial compounds for fabricating the electrospun nanofilms help to solve this problem. Lysozyme (LYS), a GRAS status natural antimicrobial enzyme obtained from hen egg white, is one of the most potential candidates for antimicrobial packaging because of its good stability and activity in different films and food systems.31,32 However, LYS shows antimicrobial activity mainly against the Gram-positive bacteria by splitting the bonds between N-acetylmuramic acid and N-acetylglucosamine of the peptidoglycan in the cell wall.33 The combination of EO and LYS for preparing the antimicrobial packaging materials can not only decrease the dose of EO but also broaden the application of LYS-derived packaging material. Hence, in this study, a novel polyvinyl alcohol/β-CD/cinnamon essential oil/LYS (PVA/β-CD/CEO/LYS) nanofibrous film was first prepared by electrospinning. Herein, CEO was chosen as the target essential oil for its proper antimicrobial activity against the tested bacteria and molds. PVA was selected as the electrospinning matrix because it is a water-soluble and biocompatible polymer that has been widely applied for the preparation of electrospun antimicrobial materials used in food preservation.34,35 More importantly, the adoption of PVA can avoid the application of organic solvent, thereby preventing the denaturation of LYS.36 The effect of different concentrations of CEO and LYS on the antimicrobial activities of nanofibrous films was investigated. The electrospun nanofibrous films were characterized by scanning electron microscopy (SEM), attenuated total reflectance-Fourier transform infrared spectroscopy (ATR-FTIR), and thermogravimetric analysis (TGA). The antimicrobial activities of the resulting nanofibrous films against bacteria (Listeria monocytogenes and Salmonella enteritidis) and molds (Aspergillus niger and Penicillium) were investigated by a disc diffusion assay. Their minimal inhibition concentration (MIC) and minimum bacterial concentration (MBC) against L. monocytogenes and S. enteritidis were further evaluated by the broth dilution method. This biodegradable nanofibrous film containing composite natural antimicrobial agents with excellent antimicrobial activity is promising in active food packaging.
2 Materials and methods
2.1 Materials
PVA (97–98% hydrolysis) was purchased from Sinopharm Chemical Reagent Co., Ltd. (Beijing, China). β-CD was obtained from Boao Biotechnology Co., Ltd. (Guangzhou, China). CEO (containing 75% trans-cinnamaldehyde), star anise essential oil (SEO, containing 85% anethole), Zanthoxylum bungeanum Maxim essential oil (ZEO, containing 99% limonene, citronellol, terpene, eugenol, and so on), ginger essential oil (GEO, containing 99% gingerol, zingiberone), garlic essential oil (GAEO, containing 50% allicin, 40% allyl propyl disulfide), and cumin essential oil (CUEO, containing 99% p-cymene, dipentene, limonene, phellandrene, pinene, and so on) were purchased from Hengcheng natural flavor Co., Ltd. (Jiangxi, China), and all the EOs were obtained by steam-distillation. LYS (25![[thin space (1/6-em)]](https://www.rsc.org/images/entities/char_2009.gif) 000 U mg−1) was purchased from Feibo Biotechnology Co., Ltd. (Guangzhou, China). Water was obtained using a Millipore Milli-Q ultrapure water system. The microorganism strains of Listeria monocytogenes (ATCC19111), Salmonella enteritidis (ATCC14028), A. niger (ATCC1015), and Penicillium (CICC41489) were kept in our laboratory. Other materials and chemicals were purchased from the commercial sources and were of the highest purity available. The strawberries were obtained from a local market.
000 U mg−1) was purchased from Feibo Biotechnology Co., Ltd. (Guangzhou, China). Water was obtained using a Millipore Milli-Q ultrapure water system. The microorganism strains of Listeria monocytogenes (ATCC19111), Salmonella enteritidis (ATCC14028), A. niger (ATCC1015), and Penicillium (CICC41489) were kept in our laboratory. Other materials and chemicals were purchased from the commercial sources and were of the highest purity available. The strawberries were obtained from a local market.
2.2 Screening of EOs
The antimicrobial activities of six EOs, including CEO, SEO, ZEO, GEO, GAEO, and CUEO, against common foodborne microorganisms (L. monocytogenes, S. enteritidis, A. niger, and Penicillium) were evaluated by the disc diffusion method.37,38 First, 100 μL of broth culture containing approximately 108 CFU mL−1 of the tested bacterium was individually spread onto the sterilized nutrient agar and 100 μL of broth culture containing approximately 106 CFU mL−1 of the tested mold was individually spread on the sterilized Czapek–Dox medium. For the disc diffusion method, both sides of the 6 mm filter discs were sterilized under UV irradiation for 2 h (each side for 1 h), followed by adding 5 μL of EO, and then the discs containing EO were placed on the abovementioned plates. The Petri dishes were sealed using parafilm to prevent the leakage of EO vapor, and were then incubated at 37 °C for 24 h for bacteria and 28 °C for 3 d for mold. The diameter of the inhibition zone was measured using calipers. All the tests were carried out in triplicate for each EO.2.3 Preparation of the electrospinning solution
A PVA solution (5–10%, w/w) was prepared by dissolving 5–10 g PVA in a 100 g Milli-Q water under constant stirring using a magnetic stirrer (RT5, IKA, German) at 60 °C for 30 min, and then at 80 °C for 1 h. Subsequently, 1–3 g β-CD was dissolved in a PVA solution by constant stirring at 75 °C for 30 min. After this, 1–3 g CEO was added to the abovementioned solution and mixed at 55 °C for 2.5 h; the color of the solution became turbid milky white in the end. For the composite antimicrobial electrospun solution, 0.05–0.5 g (1.25 × 10⁶ to 1.25 × 10⁷ U) LYS was added to the milky white solution and constantly stirred at 25 °C for 1 h. For comparison, 0.05–0.5 g (1.25 × 10⁶ to 1.25 × 10⁷ U) LYS was dissolved in a PVA solution by constant stirring at 25 °C for 1 h and the solutions of pure PVA and the mixture of PVA, β-CD, CEO, and LYS were also prepared. The viscosity of the solution was measured using a Brookfield digital viscometer (Model DV-II t Pro, USA). The solution (15 mL) was put into the inbuilt stainless steel container of the viscometer, and then measured at 25 ± 0.1 °C, controlled by a temperature controller (EYELA, Tokyo Rikakikai Co. Ltd, Japan), using a S21 spindle at 140 rpm. The viscosity of the solution was directly obtained from the viscometer. The conductivity of each solution was measured at 25 °C using a conductivity meter (DDS-11A, China). The tests were carried out in triplicate and the data were the average.2.4 Electrospinning
Electrospinning of the as-prepared solutions was carried out by connecting the emitting electrode of positive polarity from a high-voltage power supply (ES50P-5W/DAM, Gamma, USA) to the solutions contained in a 10 mL syringe, the open end of which was attached to a 20 gauge steel needle, used as a nozzle, and a grounded collecting plate covered by a piece of aluminum foil was used as the collector for fiber deposition. For the PVA solutions, the feed rate of the solution was controlled at 0.5 mL h−1 by a syringe pump (NE-300, New Era Pump Systems Inc., USA); the applied voltage was 19 kV and the distance between the needle tip and collector was 14 cm. For the PVA/β-CD/CEO solutions, the electrospinning parameters were adjusted to an applied voltage of 15 kV, tip-to-collector distance of 14 cm, and a flow rate of 0.5 mL h−1. For PVA/β-CD/CEO/LYS solutions, the electrospinning parameters were adjusted to an applied voltage of 17 kV, tip-to-collector distance of 14 cm, and a flow rate of 0.6 mL h−1. During the electrospinning process, the temperature was controlled at 26 ± 0.5 °C by an air conditioner and the relative humidity was controlled at 56 ± 2% by a dehumidifier. For the morphological study, the collection time was about 5 min, whereas for the rest of the antimicrobial experiments, the collection time was about 16 h.The concentrations of CEO and LYS were obtained using a UV-Vis spectrophotometer (UV-2550, Shimadu, Japan). First, the calibration curves were determined as follows. For CEO, a known amount of CEO was dissolved in ethyl acetate to prepare a series of CEO concentrations (1–10 μg mL−1), and then the absorbance of the solutions was examined at 281 nm. The obtained CEO concentration–absorbance calibration curve was Y = 0.24643X − 0.01557 (r2 = 0.99972, wherein X is the concentration of CEO (μg mL−1) and Y is the absorbance). For LYS, the Bradford method,39 which used bovine serum albumin (BSA) as the standard sample, was applied to examine its content and the calibration curve was Y = 0.00946X − 0.00857 (r2 = 0.99967, wherein X is the concentration of BSA (μg mL−1) and Y is the absorbance). For sample analysis, the film (20–30 mg) was added to the mixture solution (ethyl acetate![[thin space (1/6-em)]](https://www.rsc.org/images/entities/char_2009.gif) :
:![[thin space (1/6-em)]](https://www.rsc.org/images/entities/char_2009.gif) distilled water = 10 mL
distilled water = 10 mL![[thin space (1/6-em)]](https://www.rsc.org/images/entities/char_2009.gif) :
:![[thin space (1/6-em)]](https://www.rsc.org/images/entities/char_2009.gif) 10 mL) in a stoppered conical flask and the CEO incorporated in the film was extracted into the organic phase and the LYS was dissolved into the aqueous phase by ultrasonic shaking for about 1 h. The organic phase was then decanted and the aqueous phase was extracted with ethyl acetate two times (5 mL each time); organic phase was collected together at last. The CEO and LYS concentrations were determined according to the abovementioned calibration curves.
10 mL) in a stoppered conical flask and the CEO incorporated in the film was extracted into the organic phase and the LYS was dissolved into the aqueous phase by ultrasonic shaking for about 1 h. The organic phase was then decanted and the aqueous phase was extracted with ethyl acetate two times (5 mL each time); organic phase was collected together at last. The CEO and LYS concentrations were determined according to the abovementioned calibration curves.
2.5 Characterization and measurements
SEM (S-3700N, Hitachi, Japan) was used to analyze the morphology and fiber diameter of the electrospun nanofibers. Prior to SEM imaging, the electrospun nanofibrous film was coated with Pt using a sputter coater (K550, Emitech, UK) under vacuum for 40 s and examined at 15 kV. The fiber diameter distribution was calculated by analyzing around 100 fibers from the SEM images.FTIR spectroscopy (Bruker Model Equinox 70, Germany) was used to investigate the interaction among PVA, β-CD, CEO, and LYS. The measurement of the samples was performed in the mid infrared region with a wavenumber range of 4000–400 cm−1 and a spectral resolution of 4 cm−1. For electrospun nanofilms, ATR was used for the FTIR measurement, whereas for CEO, β-CD, LYS, and physical mixture of PVA, β-CD, CEO, and LYS, KBr discs were adopted for the FTIR measurement. The signals were processed using the OPUS spectroscopic software.
TGA (Q500, TA Instruments, USA) was used to evaluate the thermal stability of different samples. It was performed at a 20 °C min−1 heating rate in the range from 25 °C to 700 °C under a nitrogen atmosphere (20 mL min−1 flow rate).
2.6 Antimicrobial assay
The disc diffusion assay was performed as a qualitative test to evaluate the antimicrobial activity of the electrospun nanofilm against L. monocytogenes, S. enteritidis, A. niger, and Penicillium.40–42Preparation of bacterium suspension: first, a loop of the tested bacterium was added to the conical flask filled with 50 mL nutrient broth and incubated at 37 °C for overnight. Subsequently, 5 mL of the overnight culture was transferred to another 50 mL nutrient broth and incubated at 37 °C for 8 h. Finally, the abovementioned culture was diluted to a concentration of 107 to 108 CFU mL−1 using the 10-fold dilution method and 100 μL of this culture was spread on the sterile nutrient agar.
Preparation of the fungus spore suspension: the fungus was streaked and cultivated on the slant medium at 28 °C for two weeks, followed by subculturing. The resulting culture was used for preparing the spore suspension. Briefly, the spore suspension was prepared by adding 10 mL sterilized distilled water to each slant medium, containing the fungus culture, three times to allow the spores to be suspended in water, and the concentration of the collected spore suspension was then adjusted to 106 spore per mL. The spore suspension (100 μL) of the fungus was evenly spreading on the surface of the sterile Czapek's medium.
After preparation of the microorganism suspension, different films were cut into 6 mm discs and sterilized under UV irradiation for 1 h (each side for 30 min), and then placed on the abovementioned inoculated nutritional agar or Czapek's medium. The inhibition zone diameter of each inoculated plate was measured after incubation at 37 °C for 24 h for the bacteria and at 28 °C for 3 d for the fungi. For the same mass of antimicrobial film, the larger the inhibition zone diameter, the stronger the antimicrobial activity. The PVA nanofilm was used as a negative control and the tests were carried out in triplicate for each film.
The broth dilution method was applied to further investigate the antimicrobial activity of the nanofilm containing both CEO and LYS. Three types of nanofilms (PVA/β-CD/CEO, PVA/LYS, and PVA/β-CD/CEO/LYS) with different masses were added to a 3 mL co-solvent (ethanol![[thin space (1/6-em)]](https://www.rsc.org/images/entities/char_2009.gif) :
:![[thin space (1/6-em)]](https://www.rsc.org/images/entities/char_2009.gif) water = 1
water = 1![[thin space (1/6-em)]](https://www.rsc.org/images/entities/char_2009.gif) :
:![[thin space (1/6-em)]](https://www.rsc.org/images/entities/char_2009.gif) 1) and the CEO and/or LYS incorporated in the film were extracted into the solution by ultrasonic shaking for 1 h to prepare a series of solutions with various concentrations (0.1–30 mg mL−1). Pre-cultured microorganisms with a concentration of approximately 108 CFU mL−1 were adjusted to approximately 106 CFU mL−1 with the nutrient broth. Subsequently, 100 μL of the abovementioned inoculum was added to a tube containing 0.5 mL of each dilution and 4.4 mL nutrient broth, and a blank control was carried out by adding 100 μL of the abovementioned inoculum to the tube containing 4.9 mL nutrient broth. After this, all the tubes were incubated at 37 °C for 24 h, and then 100 μL of the abovementioned culture from the tubes without visible turbidity was evenly spread on the sterile nutrient agar, followed by incubating at 37 °C for 24 h. Finally, the colonies in different plates were counted to determine the minimum inhibitory concentration (MIC) and minimum bactericidal concentration (MBC) of the different nanofilms. MIC is defined as the lowest concentration (mg mL−1) of the nanofilm at which the growth of the microorganism is inhibited, and MBC is defined as the lowest concentration (mg mL−1) of the nanofilm at which 99% of the incubated microorganism is killed.43 To investigate the sustained release characteristics and antimicrobial efficacy of the PVA/β-CD/CEO/LYS nanofilm, it was applied in the preservation of strawberry. Nine groups of strawberries (3 treatments, 3 replicates, and 5 fruits in each replicate) were stored at 20 °C. For the three treatments, one was packed with fresh-keeping film, another was packed with a PVA/β-CD/CEO/LYS nanofilm, and the last one contained the unpacked strawberries, which served as the control. All tests were performed in triplicate.
1) and the CEO and/or LYS incorporated in the film were extracted into the solution by ultrasonic shaking for 1 h to prepare a series of solutions with various concentrations (0.1–30 mg mL−1). Pre-cultured microorganisms with a concentration of approximately 108 CFU mL−1 were adjusted to approximately 106 CFU mL−1 with the nutrient broth. Subsequently, 100 μL of the abovementioned inoculum was added to a tube containing 0.5 mL of each dilution and 4.4 mL nutrient broth, and a blank control was carried out by adding 100 μL of the abovementioned inoculum to the tube containing 4.9 mL nutrient broth. After this, all the tubes were incubated at 37 °C for 24 h, and then 100 μL of the abovementioned culture from the tubes without visible turbidity was evenly spread on the sterile nutrient agar, followed by incubating at 37 °C for 24 h. Finally, the colonies in different plates were counted to determine the minimum inhibitory concentration (MIC) and minimum bactericidal concentration (MBC) of the different nanofilms. MIC is defined as the lowest concentration (mg mL−1) of the nanofilm at which the growth of the microorganism is inhibited, and MBC is defined as the lowest concentration (mg mL−1) of the nanofilm at which 99% of the incubated microorganism is killed.43 To investigate the sustained release characteristics and antimicrobial efficacy of the PVA/β-CD/CEO/LYS nanofilm, it was applied in the preservation of strawberry. Nine groups of strawberries (3 treatments, 3 replicates, and 5 fruits in each replicate) were stored at 20 °C. For the three treatments, one was packed with fresh-keeping film, another was packed with a PVA/β-CD/CEO/LYS nanofilm, and the last one contained the unpacked strawberries, which served as the control. All tests were performed in triplicate.
3 Results and discussion
3.1 Screening of the effective EO
Spices are used for flavor and aroma in food industry.44 EOs extracted from some spices have antimicrobial and antioxidant activity.45 Cinnamon, star anise, Zanthoxylum bungeanum Maxim, ginger, garlic, and cumin are frequently used in food industry. The antimicrobial activity of the EOs from these six spices (CEO, SEO, ZEO, GEO, GAEO, and CUEO) against different bacteria and fungi have been demonstrated.46,47 Herein, to screen the most effective EO, disc diffusion method was applied to assess the antimicrobial activity of these six EOs against the common foodborne bacteria (L. monocytogenes, S. enteritidis) and molds (A. niger and Penicillium). As shown in Fig. 1, CEO exhibited the largest inhibition zone against the tested bacteria compared to the other five EOs, which had no obvious inhibition zones. As for mold, it was obvious that CEO, SEO, and ZEO presented good antifungal activity against both A. niger and Penicillium, whereas GEO only showed antifungal activity against Penicillium. For GAEO and CUEO, no inhibition zone was observed towards the two tested molds. Apparently, CEO had a broad antimicrobial spectrum, and its antimicrobial activity against molds was better than that against bacteria, which was in agreement with the results of a previous report.48 On the other hand, CEO had stronger antimicrobial activity against L. monocytogenes than that against S. enteritidis (22.17 ± 0.23 vs. 21.19 ± 0.17 mm), suggesting that the Gram-positive bacterium was more sensitive than the Gram-negative bacterium. The possible reason was the presence of an additional layer of lipid in the cell wall of the Gram-negative strain, which acts as a permeability barrier.49 Based on the abovementioned results, CEO was selected as an appropriate candidate for preparing the antimicrobial packaging materials.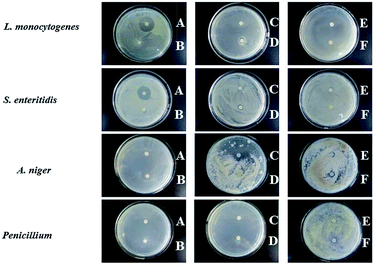 | ||
| Fig. 1 Inhibition zones of the various essential oils against the common foodborne microorganisms. (A: CEO; B: SEO; C: ZEO; D: GEO; E: GAEO; and F: CUEO). | ||
3.2 Fabrication of the electrospun nanofibrous film
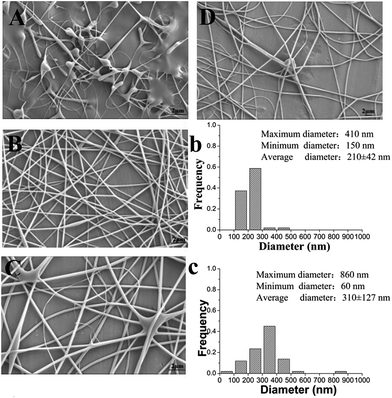
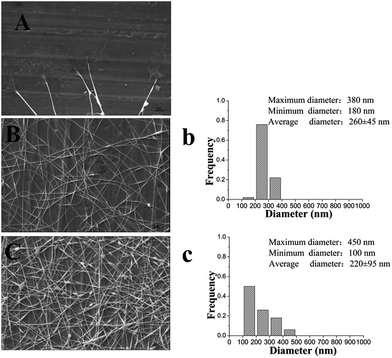
It is well known that a proper balance between the viscosity and conductivity of a solution is decisive for achieving the electrospun nanofibers with a good morphology.50 Moreover, the concentration of the solution would significantly influence its viscosity and conductivity. To select a suitable concentration of PVA for preparing the nanofilms, effects of different PVA concentrations (6%, 8%, and 10%, w/w) on the morphology of the resulting electrospun nanofibers were investigated. Table 1 summarizes the properties of different concentrations of a PVA solution and fiber diameter distribution of the resulting electrospun nanofilm. As shown in Fig. 2B and C, smoother and more continuous nanofibers were obtained at a concentration of 6%. The distribution of the nanofibers with 6% PVA was more uniform than that with 8% PVA (Fig. 2b and c). This was attributed to the higher viscosity of the 8% PVA solution, which disturbed the balance between the viscosity and conductivity. Unfortunately, for 10% PVA solution, the tip was easily blocked during the electrospinning due to its high viscosity. To determine if a lower PVA concentration was also suitable for forming a good fiber, 5% PVA was used for electrospinning. The results suggested that it was difficult to fabricate continuous fibers at this concentration because the viscosity was too low and the insufficient viscoelastic force cannot fully suppress the droplet break up. Therefore, 6% PVA was chosen as the electrospinning matrix for the further investigation.The addition of β-CD into the electrospinning solution would change the physical property of the solution. Table 2 shows the properties of the solution with different β-CD concentrations (1%, 2%, and 3%, w/w) and the fiber diameter distribution of the resulting electrospun nanofilm. The representative SEM images of the nanofilms with different β-CD concentrations are presented in Fig. 3. It was found that the viscosity and conductivity of the solution increased with the increasing β-CD concentration. The viscosity of the PVA/β-CD/CEO/LYS solution was higher than that of the pure PVA solution due to the interactions between the PVA polymer chains, CEO, and β-CD molecules. A similar phenomenon was also observed in the PVA/β-CD/EG solution.51 For 1% β-CD, it was difficult to fabricate a continuous fiber during electrospinning. The obtained electrospun fiber of 2% β-CD was more uniform with fewer beads than that of 3% β-CD due to the higher viscosity of 3% β-CD, which could not ensure the balance between the electric field force and the surface tension. Hence, a 2% β-CD concentration was chosen to encapsulate the CEO.
To determine the suitable CEO and LYS concentration, the disc diffusion assay was applied to investigate the antimicrobial effects of the PVA/β-CD/CEO nanofilms with three different concentrations of CEO (1%, 2%, and 3%, w/w) and the PVA/LYS nanofilms with three different concentrations of LYS (0.05%, 0.25%, and 0.5%, w/w) against L. monocytogenes and S. enteritidis. The inhibition zones of PVA/β-CD/CEO nanofilms are presented in Fig. 4, and the inhibition zones of PVA/LYS nanofilms are presented in Fig. 5. Table 3 lists the corresponding diameters of the different inhibition zones. It was obvious that greater inhibition zones were achieved against L. monocytogenes compared to those against S. enteritidis, suggesting that CEO and LYS both have better antimicrobial activity against the Gram-positive bacterium than the Gram-negative bacterium, and the inhibition effect increased with the increasing CEO and LYS concentrations. However, for PVA/β-CD/CEO nanofilms, there was no inhibition for 1% CEO and the inhibition zone of 3% CEO was larger than that of 2% CEO. For 0.25% and 0.5% LYS, the inhibition zones were 14.97 ± 0.41 mm and 15.16 ± 0.18 mm, respectively, which did not show an apparent difference. To decrease the dose of CEO while maintaining the appropriate antimicrobial activity, 2% CEO and 0.25% (62![[thin space (1/6-em)]](https://www.rsc.org/images/entities/char_2009.gif) 500 U) LYS were adopted to prepare PVA/β-CD/CEO/LYS nanofibrous film.
500 U) LYS were adopted to prepare PVA/β-CD/CEO/LYS nanofibrous film.
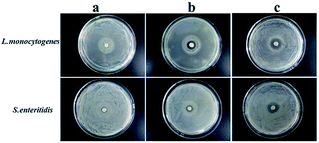 | ||
| Fig. 4 Inhibition zones of the PVA/β-CD/CEO film with different CEO concentrations (a: 1% CEO; b: 2% CEO; and c: 3% CEO). | ||
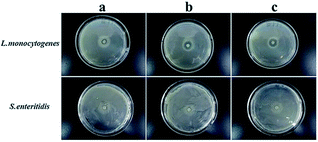 | ||
| Fig. 5 Inhibition zones of the PVA/LYS film with different LYS concentrations (a: 0.05% LYS; b: 0.25% LYS; and c: 0.5% LYS). | ||
| Sample | Inhibition zone diameter (mm) | |
|---|---|---|
| L. monocytogenes | S. enteritidis | |
| PVA/β-CD/1% CEO | 8.82 ± 0.60 | 7.05 ± 0.60 |
| PVA/β-CD/2% CEO | 11.53 ± 0.60 | 10.11 ± 0.11 |
| PVA/β-CD/3% CEO | 13.59 ± 0.22 | 11.42 ± 0.33 |
| PVA/0.05% LYS | 9.27 ± 0.10 | 6.62 ± 0.15 |
| PVA/0.25% LYS | 14.97 ± 0.41 | 7.33 ± 0.03 |
| PVA/0.5% LYS | 15.16 ± 0.18 | 7.86 ± 0.54 |
3.3 Characterization of the electrospun nanofibrous film
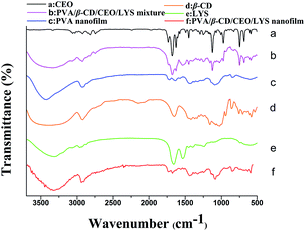
The FTIR spectra of CEO, β-CD, LYS, PVA/β-CD/CEO/LYS mixture, PVA nanofilm, and PVA/β-CD/CEO/LYS nanofilm are depicted in Fig. 6. As shown in the PVA spectrum, its characteristic absorption peak was at around 3332 cm−1, which was assigned to the O–H stretching formed between the PVA and water. Other absorption bands at around 2940, 1430, and 1090 cm−1 correspond to the stretching vibration of C–H, the bending stretching of C–H, and the stretching vibration of C–O and C–O–C groups in PVA, respectively. For β-CD spectrum, the absorption band at 3395, 2925, 1158, and 1028 cm−1 represent the stretching of O–H, the stretching of C–H, the stretching of C–O, and the coupling stretching of C–C and C–O, respectively. From the spectrum of LYS, two common bands of LYS at 1656 cm−1 and 1535 cm−1 belong to the amide I and amide II peaks, respectively, which corresponds to the stretching vibrations of the C![[double bond, length as m-dash]](https://www.rsc.org/images/entities/char_e001.gif) O bond and the coupling of bending of N–H bond and stretching of the C–N bonds, respectively.52 It was obvious that a blue shift occurred for the O–H stretching peak in the spectrum of PVA/β-CD/CEO/LYS film compared to the spectrum of PVA, β-CD, and LYS, suggesting that more hydrogen bonds were formed between PVA, β-CD, and LYS. The FTIR spectrum of pure CEO exhibited characteristic peaks at 1625 cm−1 and 1678 cm−1 assigned to the C–O–C, C–H, and O–H stretching vibration, respectively. These characteristic absorption peaks also existed in the spectrum of the mixture of PVA, β-CD, CEO, and LYS; however, these were not observed in the spectrum of PVA/β-CD/CEO/LYS film, suggesting that CEO was efficiently encapsulated into the hydrophobic cavity of β-CD. Moreover, for the amide I band, different regions were contributed by different secondary structural elements: 1600–1639 cm−1 by the β-sheet, 1640–1650 cm−1 by the γ-random coil, 1651–1660 cm−1 by the α-helix, and 1661–1700 cm−1 by the T-turns. In addition, the characteristic peak of LYS at 1656 cm−1 was shifted to 1676 cm−1 for the PVA/β-CD/CEO/LYS nanofilm, indicating that a more α-helix structure transferred to β-sheet and turned the structure.53
O bond and the coupling of bending of N–H bond and stretching of the C–N bonds, respectively.52 It was obvious that a blue shift occurred for the O–H stretching peak in the spectrum of PVA/β-CD/CEO/LYS film compared to the spectrum of PVA, β-CD, and LYS, suggesting that more hydrogen bonds were formed between PVA, β-CD, and LYS. The FTIR spectrum of pure CEO exhibited characteristic peaks at 1625 cm−1 and 1678 cm−1 assigned to the C–O–C, C–H, and O–H stretching vibration, respectively. These characteristic absorption peaks also existed in the spectrum of the mixture of PVA, β-CD, CEO, and LYS; however, these were not observed in the spectrum of PVA/β-CD/CEO/LYS film, suggesting that CEO was efficiently encapsulated into the hydrophobic cavity of β-CD. Moreover, for the amide I band, different regions were contributed by different secondary structural elements: 1600–1639 cm−1 by the β-sheet, 1640–1650 cm−1 by the γ-random coil, 1651–1660 cm−1 by the α-helix, and 1661–1700 cm−1 by the T-turns. In addition, the characteristic peak of LYS at 1656 cm−1 was shifted to 1676 cm−1 for the PVA/β-CD/CEO/LYS nanofilm, indicating that a more α-helix structure transferred to β-sheet and turned the structure.53
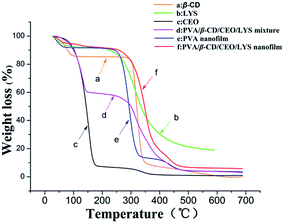
The thermal properties of different samples were investigated by TGA and their thermograms are presented in Fig. 7. In the TGA thermogram of pure CEO, the weight loss started at around 75 °C, showing an onset point at around 100 °C, indicating that CEO has a volatile nature. Two main weight losses were observed in the curve of β-CD. The initial weight loss below 100 °C was due to water loss, the second weight loss between 275 °C and 350 °C was due to the degradation of β-CD. For the TGA thermogram of the PVA nanofilm, the initial weight loss was attributed to the loss of water and the major weight loss at above 250 °C was due to the dehydration of water and thermal degradation of PVA. Similarly, the initial weight loss of LYS was due to water loss, and the main weight loss starting at around 200 °C was assigned to the degradation of LYS. Note that the main degradation temperature of PVA shifted to slightly higher temperature with the presence of β-CD, which may be because of the hydrogen bonding interaction between the hydroxyl groups of PVA and β-CD. Compared to the TGA thermograms of the pure CEO and the mixture of PVA, β-CD, CEO, and LYS, the weight loss of CEO in the PVA/β-CD/CEO/LYS nanofibers started at around 100 °C, showing that the thermal stability of CEO was significantly improved. The higher thermal stability of CEO in the PVA/β-CD/CEO/LYS nanofilm suggested an existence of the interactions between CEO and the β-CD cavity and similar phenomenon had been previously demonstrated.54,55 In addition, the thermal stability of LYS in the PVA/β-CD/CEO/LYS nanofibers was also enhanced, as indicated by the weight loss of LYS shifting to higher temperature (250 °C), which was probably due to the change in its secondary structure.
3.4 Antimicrobial activity of the electrospun nanofibrous film
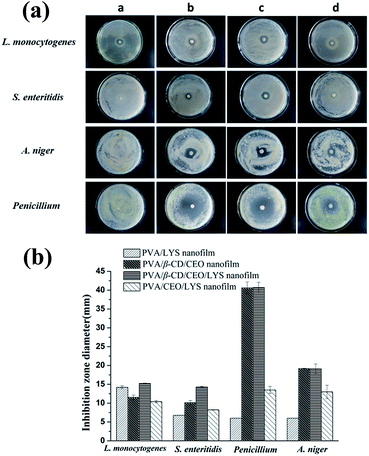
The antimicrobial activity of the PVA/β-CD/CEO/LYS nanofilm was compared to that of the PVA/LYS, PVA/β-CD/CEO and PVA/CEO/LYS nanofilms using a disc diffusion assay. The inhibition zones of different antimicrobial nanofilms against L. monocytogenes, S. enteritidis, A. niger, and Penicillium are shown in Fig. 8a, and the corresponding diameters of the inhibition zones are displayed in Fig. 8b. For the two tested foodborne bacteria, the PVA/β-CD/CEO/LYS nanofilm exhibited stronger antimicrobial activity than that of the PVA/LYS and PVA/β-CD/CEO nanofilms. It was reported that LYS showed antimicrobial activity mainly against the Gram-positive bacteria by splitting the bonds between N-acetylmuramic acid and N-acetylglucosamine of the peptidoglycan in the cell wall. However, lysozyme can be effective against the Gram-negative bacteria in the presence of membrane-destabilizing agents, such as detergents and chelators.56 The CEO has good antibacterial (both Gram-positive bacteria and Gram-negative bacteria) and antifungal properties (Fig. 1). In addition, CEO could destroy the structure of the cell wall and increase the permeability of the cell membrane causing cellular leakage.57 Therefore, the synergism between the two antimicrobials give the PVA/β-CD/CEO/LYS nanofilm a better antibacterial effect. Unfortunately, there was no inhibition zone against the two molds for the PVA/LYS nanofilm. However, the inhibition zones of the PVA/β-CD/CEO/LYS nanofilm against A. niger and Penicillium were similar to those of the PVA/β-CD/CEO nanofilm (19.18 ± 0.07 vs. 19.10 ± 1.27 mm; 40.71 ± 1.37 vs. 40.60 ± 1.56 mm). Note that the inhibition zones of the PVA/β-CD/CEO/LYS nanofilm against the four tested microorganisms were obviously greater than those of PVA/CEO/LYS nanofilm. One possible reason was that the entrapment of CEO into the hydrophobic cavity of β-CD decreased the loss of CEO and improved the solubility of CEO. A similar phenomenon was also reported previously.58 The MICs and MBCs of these nanofilms against the two tested bacteria were further determined by the broth-dilution method. As shown in Table 4, the PVA/β-CD/CEO/LYS nanofilm had the highest antimicrobial activity among the three samples, and its MIC against L. monocytogenes and S. enteritidis was approximately 0.8–1 mg mL−1 (corresponding CEO concentration 7.6–9.5 μg mL−1 and LYS concentration 36–45 U mL−1) and MBC was approximately 6–7 mg mL−1 (corresponding CEO concentration 57–66.5 μg mL−1 and LYS concentration 270–315 U mL−1). A previous study showed that when allyl isothiocyanate, which is also highly volatile and hydrophobic, was encapsulated in the electrospun PVA/AITC/β-CD nanofilm, it was possible to sustainably release it from the nanofilm.59 To further testify the sustained release characteristics and antimicrobial efficacy of the PVA/β-CD/CEO/LYS nanofilm, it was applied in the preservation of strawberries. As shown in Fig. S1,† the strawberries packed with the fresh-keeping film had decayed on the 4th day, the unpacked strawberries were rotten on the 6th day, whereas the strawberries packed with the PVA/β-CD/CEO/LYS nanofilm showed no signs of decay even at day 6. The results indicate that the strawberries packed with the PVA/β-CD/CEO/LYS nanofilm had a longer shelf-life than those of the control and those packed with the fresh-keeping film, which showed that the CEO can be sustainably released to inactivate or eliminate spoilage and foodborne pathogens on the surface of food product. These results suggested that the as-obtained composite nanofilm is an appropriate candidate for active food packaging. It can minimize the required dose of CEO while maintaining suitable antimicrobial activity and broaden the application space of LYS in the food packaging area.| Sample | L. monocytogenes | S. enteritidis | ||
|---|---|---|---|---|
| MIC (mg mL−1) | MBC (mg mL−1) | MIC (mg mL−1) | MBC (mg mL−1) | |
| PVA/β-CD/CEO | 1 | 7 | 2 | 8 |
| PVA/β-CD/CEO/LYS | 0.8 | 6 | 1 | 7 |
| PVA/LYS | 0.9 | 7 | 3 | >30 |
4 Conclusions
CEO was found to be the most effective antimicrobial agent against bacteria (L. monocytogenes and S. enteritidis) and molds (A. niger and Penicillium) among all the tested six EOs. To decrease the CEO dosage in the packaging material while maintaining the appropriate antimicrobial activity, the combination of CEO with LYS was applied to fabricate the PVA/β-CD/CEO/LYS nanofilm by electrospinning. The proper concentration of composite antimicrobial agent was 2% CEO and 0.25% LYS (w/w). The results of the ATR-FTIR and TGA analyses indicated that there existed a molecular interaction among PVA, β-CD, CEO, and LYS, which enhanced the thermal stability of CEO and LYS. Compared to the PVA/LYS and PVA/β-CD/CEO nanofilms, which contained only one microbial agent, the PVA/β-CD/CEO/LYS nanofilm showed stronger antibacterial activity against L. monocytogenes and S. enteritidis and prominent antifungal activity against A. niger and Penicillium. Therefore, the antimicrobial PVA/β-CD/CEO/LYS electrospun nanofilm can serve as a good candidate for active food packaging. The combination of CEO and LYS for the preparation of antimicrobial electrospun nanofilms can not only decrease the dosage of CEO but also broaden the applications of LYS-derived packaging material in the food industry.Acknowledgements
We acknowledge the Students Research Funding of Guangdong Province (Grant No. pdjh2016b0046), the Step Ladder Climbing Program of South China University of Technology (Grant No. DC30716039), and the National Natural Science Foundation of China (Grant No. 31671852) for the financial support.References
- H. Mith, R. Dure, V. Delcenserie, A. Zhiri, G. Daube and A. Clinquart, Food Sci. Nutr., 2014, 2, 403–416 CrossRef CAS PubMed.
- G. Mensitieri, E. Di Maio, G. G. Buonocore, I. Nedi, M. Oliviero, L. Sansone and S. Iannace, Trends Food Sci. Technol., 2011, 22, 72–80 CrossRef CAS.
- S. Benavides, R. Villalobos-Carvajal and J. E. Reyes, J. Food Eng., 2012, 110, 232–239 CrossRef CAS.
- J. P. Kerry, M. N. O'Grady and S. A. Hogan, Meat Sci., 2006, 74, 113–130 CrossRef CAS PubMed.
- S. Quintavalla and L. Vicini, Meat Sci., 2002, 62, 373–380 CrossRef CAS PubMed.
- G. Ren, D. Hu, E. W. Cheng, M. A. Vargas-Reus, P. Reip and R. P. Allaker, Int. J. Antimicrob. Agents, 2009, 33, 587–590 CrossRef CAS PubMed.
- M. J. Fabra, A. López-Rubio and J. M. Lagaron, Food Hydrocolloids, 2016, 55, 11–18 CrossRef CAS.
- S. Y. Sung, L. T. Sin, T. T. Tee, S. T. Bee, A. R. Rahmat, W. A. W. A. Rahman, A. C. Tan and M. Vikhraman, Trends Food Sci. Technol., 2013, 33, 110–123 CrossRef CAS.
- A. Barbiroli, F. Bonomi, G. Capretti, S. Iametti, M. Manzoni, L. Piergiovanni and M. Rollini, Food Control, 2012, 26, 387–392 CrossRef CAS.
- C. Chai, K. S. Lee and S. W. Oh, Anaerobe, 2015, 34, 24–26 CrossRef CAS PubMed.
- J. Gomez-Estaca, A. Lopez de Lacey, M. E. Lopez-Caballero, M. C. Gomez-Guillen and P. Montero, Food Microbiol., 2010, 27, 889–896 CrossRef CAS PubMed.
- E. F. S. David, M. M. Mischan, M. O. M. Marques and C. S. F. Boaro, Rev. Bras. Plant. Med., 2013, 16, 97–106 CrossRef.
- A. Nostro, R. Scaffaro, M. D'Arrigo, L. Botta, A. Filocamo, A. Marino and G. Bisignano, Appl. Microbiol. Biotechnol., 2012, 96, 1029–1038 CrossRef CAS PubMed.
- H. M. C. Marques, Flavour Fragrance J., 2010, 25, 313–326 CrossRef.
- L. E. Hill, C. Gomes and T. M. Taylor, LWT--Food Sci. Technol., 2013, 51, 86–93 CrossRef CAS.
- L. M. Gomes, N. Petito, V. G. Costa, D. Q. Falcao and K. G. de Lima Araujo, Food Chem., 2014, 148, 428–436 CrossRef CAS PubMed.
- A. Prakash, S. Sen and R. Dixit, Int. J. Pharm. Sci. Rev. Res., 2013, 22, 107–111 Search PubMed.
- P. Maurya and L. Yadav, Food Sci. Res. J., 2015, 6, 375–380 CrossRef.
- W. Huang, H. Xu, Y. Xue, R. Huang, H. Deng and S. Pan, Food Res. Int., 2012, 48, 784–791 CrossRef CAS.
- A. Frenot and I. S. Chronakis, Curr. Opin. Colloid Interface Sci., 2003, 8, 64–75 CrossRef CAS.
- Y. P. Neo, S. Swift, S. Ray, M. Gizdavic-Nikolaidis, J. Jin and C. O. Perera, Food Chem., 2013, 141, 3192–3200 CrossRef CAS PubMed.
- Z. Zhou, W. Lin and X. F. Wu, Colloids Surf., A, 2016, 494, 21–29 CrossRef CAS.
- T. He, J. Wang, P. Huang, B. Zeng, H. Li, Q. Cao, S. Zhang, Z. Luo, D. Y. Deng, H. Zhang and W. Zhou, Colloids Surf., B, 2015, 130, 278–286 CrossRef CAS PubMed.
- A. C. Mendes, C. Gorzelanny, N. Halter, S. W. Schneider and I. S. Chronakis, Int. J. Pharm., 2016, 510, 48–56 CrossRef CAS PubMed.
- J. Bao, W. Lv, Y. Sun and Y. Deng, J. Mater. Sci., 2013, 48, 4223–4232 CrossRef CAS.
- K. A. Rieger and J. D. Schiffman, Carbohydr. Polym., 2014, 113, 561–568 CrossRef CAS PubMed.
- C. Kriegel, K. M. Kit, D. J. McClements and J. Weiss, J. Appl. Polym. Sci., 2010, 118, 2859–2868 CrossRef CAS.
- C. L. S. d. O. Mori, N. A. dos Passos, J. E. Oliveira, T. F. Altoé, F. A. Mori, L. H. C. Mattoso, J. R. Scolforo and G. H. D. Tonoli, J. Nanomater., 2015, 2015, 1–9 CrossRef.
- P. Wen, D. H. Zhu, H. Wu, M. H. Zong, Y. R. Jing and S. Y. Han, Food Control, 2016, 59, 366–376 CrossRef CAS.
- P. Wen, D. H. Zhu, K. Feng, F. J. Liu, W. Y. Lou, N. Li, M. H. Zong and H. Wu, Food Chem., 2016, 196, 996–1004 CrossRef CAS PubMed.
- İ. U. Ünalan, F. Korel and A. Yemenicioğlu, Int. J. Food Sci. Technol., 2011, 46, 1289–1295 CrossRef.
- K. S. Doosh and S. M. Abdul-Rahman, Pak. J. Nutr., 2014, 13, 635–641 CrossRef.
- C. B. Amara, N. Eghbal, P. Degraeve and A. Gharsallaoui, J. Food Eng., 2016, 183, 50–57 CrossRef.
- U. Turaga, V. Singh, A. Gibson, S. Maharubin, C. Korzeniewski, S. Presley, E. Smith, R. J. Kendall and S. S. Ramkumar, J. Eng. Fibers Fabr., 2016, 2, 60–67 Search PubMed.
- L. Ge, Y. S. Zhao, T. Mao, J. R. Li and P. Li, Food Control, 2012, 26, 189–193 CrossRef.
- D. Z. Yang, Y. H. Long and J. Nie, Front. Mater. Sci. China, 2008, 2, 261–265 CrossRef.
- W. Li, X. Li, Q. Wang, Y. Pan, T. Wang, H. Wang, R. Song and H. Deng, Carbohydr. Polym., 2014, 99, 218–225 CrossRef CAS PubMed.
- A. Barra, V. Coroneo, S. Dessi, P. Cabras and A. Angioni, Nat. Prod. Commun., 2010, 5, 329–335 CAS.
- M. M. Bradford, Anal. Chem., 1976, 72, 248–254 CAS.
- M. Rezaei, S. M. Ojagh, S. H. Razavi and S. M. H. Hosseini, J. Biotechnol., 2010, 150, 573 CrossRef.
- S. Shojaee-Aliabadi, H. Hosseini, M. A. Mohammadifar, A. Mohammadi, M. Ghasemlou, S. M. Ojagh, S. M. Hosseini and R. Khaksar, Int. J. Biol. Macromol., 2013, 52, 116–124 CrossRef CAS PubMed.
- J. Nikan and Z. Jafari, J. Nat. Prod. Plant Resour., 2015, 5, 1–5 CAS.
- N. F. Cover, S. Lai-Yuen, A. K. Parsons and A. Kumar, Int. J. Nanomed., 2012, 7, 2411–2419 Search PubMed.
- J. Krisch, Z. Pardi, R. Tserennadmid, T. Papp and C. Vágvölgyi, Acta Biol. (Szeged), 2010, 54, 131–134 Search PubMed.
- M. Mahboubi and M. Mahboubi, J. Essent. Oil-Bear. Plants, 2015, 18, 967–975 CrossRef CAS.
- M. Valero and M. C. Salmerón, Int. J. Food Microbiol., 2003, 85, 73–81 CrossRef CAS PubMed.
- V. V. Panpatil, S. Tattari, N. Kota, C. Nimgulkar and K. Polasa, J. Pharmacogn. Phytochem., 2013, 2, 143–148 Search PubMed.
- S. Nanasombat and P. Wimuttigosol, Food Sci. Biotechnol., 2011, 20, 45–53 CrossRef CAS.
- I. Aiad, M. M. El-Sukkary, E. A. Soliman, M. Y. El-Awady and S. M. Shaban, J. Ind. Eng. Chem., 2014, 20, 3430–3439 CrossRef CAS.
- Z. Jun, H. Q. Hou, A. Schaper and J. H. Wendorff, e-Polym., 2003, 3, 102–110 Search PubMed.
- F. Kayaci, Y. Ertas and T. Uyar, J. Agric. Food Chem., 2013, 61, 8156–8165 CrossRef CAS PubMed.
- B. Zhou, Y. Li, H. Deng, Y. Hu and B. Li, Colloids Surf., B, 2014, 116, 432–438 CrossRef CAS PubMed.
- M. V. D. Weert, R. V. Hof, J. V. D. Weerd, R. M. A. Heeren, G. Posthuma, W. E. Hennink and D. J. A. Crommelin, J. Controlled Release, 2000, 68, 31–40 CrossRef PubMed.
- F. Kayaci and T. Uyar, J. Agric. Food Chem., 2011, 59, 11772–11778 CrossRef CAS PubMed.
- Y. Tsai, H. H. Tsai, C. P. Wu and F. J. Tsai, Food Chem., 2010, 120, 837–841 CrossRef CAS.
- A. O. Gill and R. A. Holley, Food Res. Int., 2000, 33, 83–90 CrossRef CAS.
- Y. Zhang, X. Liu, Y. Wang, P. P. Jiang and S. Y. Quek, Food Control, 2016, 59, 282–289 CrossRef CAS.
- F. Kayaci and T. Uyar, Food Chem., 2012, 133, 641–649 CrossRef CAS.
- Z. Aytac, S. Y. Dogan, T. Tekinay and T. Uyal, Colloids Surf., B, 2014, 120, 125–131 CrossRef CAS PubMed.
Footnote |
| † Electronic supplementary information (ESI) available. See DOI: 10.1039/c6ra25977d |
| This journal is © The Royal Society of Chemistry 2017 |

