
 Open Access Article
 This Open Access Article is licensed under a
 Creative Commons Attribution 3.0 Unported Licence
Simple fluorinated moiety insertion on Aβ 16–23 peptide for stain-free TEM imaging†
Silvia
Sonzini
,
Samuel T.
Jones
,
Zarah
Walsh
and
Oren A.
Scherman
*
Melville Laboratory for Polymer Chemistry, Department of Chemistry, University of Cambridge, Lensfield Road, CB2 1EW, Cambridge, UK. E-mail: oas23@cam.ac.uk
First published on 29th January 2015
Abstract
Peptide aggregation and fibre formation are one of the major underlying causes of several neurodegenerative disorders such as Alzheimer's disease. During the past decades the characterisation of these fibres has been widely studied in an attempt to further understand the nature of the related diseases and in an effort to develop treatments. Transmission electron microscopy (TEM) is one of the most commonly used techniques to identify these fibres, but requires the use of a radioactive staining agent. The procedure we report overcomes this drawback through simple addition of a fluorinated moiety to a short Amyloid β sequence via solid phase peptide synthesis (SPPS). This method is synthetically straightforward, widely applicable to different aggregation-prone sequences and, above all, allows for stain-free TEM imaging with improved quality compared to standard imaging procedures. The presence of the fluorinated moiety does not cause major changes in the fibre structure or aggregation, but rather serves to dissipate the microscope's electron beam, thus allowing for high contrast and straightforward imaging by TEM.
1. Introduction
Several degenerative diseases, such as Alzheimer's,1 Parkinson's,2 Huntington's disease3 and type II diabetes4 are related to an accumulation of amyloid fibrils.5 The proteins composing these fibrils vary in each of the different diseases, but there are substantial similarities in their structural properties. Protein functions are known to be closely related to their three-dimensional structure, therefore the mechanisms of pathogenesis in all these diseases show common features as well.6,7 In particular, the structure of Amyloid β (Aβ) fibrils has been studied with numerous techniques to capture as much information as possible on their aggregation pathway and further understand the development of the related disease.8–15 These fibrils have not only been investigated for their role in Alzheimer's disease, but they have also been gathering increasing interest on account of their mechanical and adhesive properties and their natural propensity to self assemble.16–20One of the more reliable and common methods to study and characterise amyloid fibres, both from a biomedical and a material point of view, is transmission electron microscopy (TEM). Wild-type (WT) peptides are, however, difficult to image with electron microscopy as they do not efficiently dissipate the beam current, resulting in imaging artefacts. The standard procedure for TEM imaging, therefore, consists of staining the fibres with a radioactive uranyl acetate solution,8 which allows the fibres to be imaged as the uranyl acetate helps to dissipate the electron beam. This method, even if widely applied, can be misleading since the microscope images show only regions that interact with the staining solution and not necessarily the peptide itself. Building on previous work from our group21 we report, herein, the incorporation of an N-terminal fluorinated moiety (F) via solid phase peptide synthesis (SPPS) that allows stain-free TEM to be performed on peptide fibres. Importantly, the incorporation of this moiety does not interfere with the aggregation process typical of the amyloid fragment Aβ (16–23). In our case only the material (peptide) containing the fluorine moiety will be seen in the TEM, since no additional staining technique is applied (Fig. 1).
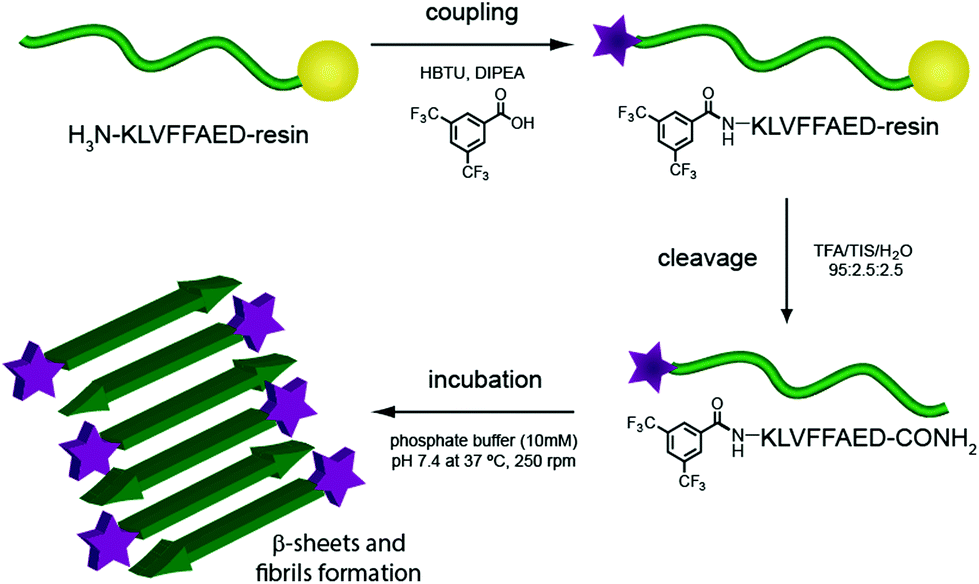 | ||
| Fig. 1 Scheme of F-Aβ (16–23) synthesis and aggregation. | ||
Introducing fluorinated amino acids in peptides and proteins is common practice in bioengineering.22,23 While fluorine is isosteric with hydrogen, the C–F bond is stronger than the C–H bond. Additionally, it is highly dipolar and relatively non-polarisable, which generally helps increase the hydrophobicity but also contributes to fluorine behaving as a hydrogen-bond acceptor; these features all generally improve protein stability.24,25 Moreover, fluorine has a low natural abundance in proteins and can therefore act as a tool for protein analysis in several spectroscopic techniques, such as nuclear magnetic resonance (19F-NMR)26 and positron emission topography (18F-PET).27 Nevertheless, fluorine insertion into peptides has never been applied as an imaging tool in TEM to the best of our knowledge.
2. Experimental section
2.1. Materials
All amino acids used, O-(benzotriazol-1-yl)-N,N,N′,N′-tetramethyluronium hexafluorophosphate (HBTU), dichloromethane (DCM) and dimethyl formamide (DMF) were bought from AGTC Bioproducts. NovaPEG Rink amide resin was purchased from Merck Novabiochem. Diisopropylethylamine (DIPEA), trifluoroacetic acid (TFA), 3,5-bis(trifluoromethyl)benzoic acid, thioflavin T, monobasic potassium phosphate, dibasic sodium phosphate, glutaraldehyde solution and uranyl acetate dihydrate were purchased from Sigma-Aldrich. HPLC-grade acetonitrile and N-methylpyrrolidone (NMP) and analytical grade purity 1,1,1,3,3,3,-hexafluoroisopropanol (HFIP), piperidine and triisopropylsilane (TIS) were bought from Fisher Scientific. The buffer used was a sterile filtered 10 mM phosphate buffer adjusted to pH 7.4 prepared by dilution from a stock solution of 0.5 M phosphate buffer pH 7.4 in ultrapure water (Synergy UV Ultrapure water system).2.2. Peptide preparation
Aβ (16–23) and F-Aβ (16–23) were prepared by SPPS (CEM Liberty Automated Microwave Peptide Synthesiser), the N-terminal coupling with 3,5-bis(trifluoromethyl)-benzoic acid was performed manually under standard HBTU coupling conditions allowing 12 h for the reaction to occur. The peptides were purified by high-performance liquid chromatography (HPLC), using an Agilent 1300, an Agilent Zorbax C18 column and a water–acetonitrile gradient with 0.1% TFA. The gradient ranged from 90![[thin space (1/6-em)]](https://www.rsc.org/images/entities/char_2009.gif) :10 to 10:90 water–acetonitrile over 25 min and it was preceded by a pre-run of 2 min at 90:10 water–acetonitrile for a total run time of 27 min. The final purity was assessed by analytical HPLC (Varian 940-LC system, Agilent Eclipse Plus C18 column and the same water–acetonitrile gradient) and electrospray ionisation mass spectrometry (Thermo Scientific LTQ Orbitrap Velos mass spectrometer) and found to be ≥95% (see ESI†). Fluorine presence in F-Aβ (16–23) was also measured by 19F-NMR (Bruker DPX 400 MHz spectrometer) (see ESI†). After purification, the peptides were lyophilised and stored at −20 °C.
:10 to 10:90 water–acetonitrile over 25 min and it was preceded by a pre-run of 2 min at 90:10 water–acetonitrile for a total run time of 27 min. The final purity was assessed by analytical HPLC (Varian 940-LC system, Agilent Eclipse Plus C18 column and the same water–acetonitrile gradient) and electrospray ionisation mass spectrometry (Thermo Scientific LTQ Orbitrap Velos mass spectrometer) and found to be ≥95% (see ESI†). Fluorine presence in F-Aβ (16–23) was also measured by 19F-NMR (Bruker DPX 400 MHz spectrometer) (see ESI†). After purification, the peptides were lyophilised and stored at −20 °C.
Unless otherwise stated, Aβ (16–23) and F-Aβ (16–23) samples were treated, as follows, prior to each experiment. The peptides were disaggregated by dissolution in TFA at a concentration of 1 mg ml−1, sonicated for 30 s, evaporated to a dry film, redissolved in HFIP and aliquoted; the solvent was then evaporated to dryness as described previously.28 Dry peptide films can be stored at –20 °C until used, but they were usually freshly prepared.
2.3. Circular dichroism (CD) measurements
CD data were recorded on an Applied Photophysics Chirascan spectrometer, measuring from 250 nm to 195 nm at 25 °C. Aβ (16–23) and F-Aβ (16–23) pretreated samples were dissolved (50 μM) in phosphate buffer 10 mM pH 7.4, the concentration checked via UV-vis spectroscopy (see ESI†), and the first data point (time 0 h) collected. The samples were then constantly shaken in an incubator (INFORS HT Multi-tiron II) at 37 °C and 250 rpm and data acquired every 12 h to a total of ∼36 h incubation. Each peptide was analysed as three independent samples and the data averaged.2.4. Thioflavin T (ThT) assay
The assay was performed by recording ThT emission with a Cary Eclipse fluorimeter. The excitation was applied at 452 nm and the emission collected at 490 nm, the temperature was kept at 25 °C. Aβ (16–23) and F-Aβ (16–23) samples were prepared as for the CD analyses. For each data point 50 μl aliquot of each aggregation solution was added to 750 μl of freshly filtered ThT solution (100 μM in phosphate buffer 10 mM pH 7.4) and the emission collected. The samples were then aggregated in the same conditions used for the CD analyses and data points acquired at several time intervals to a total of ∼72 h incubation. The data are reported as mean ± STD of three independent samples.2.5. TEM imaging
TEM images were recorded using a FEI Philips Tecnai 20 transmission electron microscope. Aβ (16–23) and F-Aβ (16–23) samples stored as dry-film were dissolved at a concentration of 0.5 mg ml−1 in phosphate buffer 10 mM pH 7.4 and shaken in an incubator (INFORS HT Multi-tiron II) at 37 °C and 250 rpm for two weeks to allow the fibrillation process to occur. Samples were prepared as previously reported8 on Lacey® Carbon (400 mesh) Cu grids (Agar Scientific) fixing the samples with 2.5% glutaraldehyde solution in water.2.6. Atomic and electrostatic force microscopy (AFM, EFM)
10 μl of Aβ (16–23) and F-Aβ (16–23) as prepared for the TEM measurements were diluted in 990 μl of ultrapure water. The solution was shaken to ensure mixing and drop cast onto highly ordered pyrolytic graphite (HOPG) approximately 1 cm × 1 cm with a roughness of 1 nm (Elektron Technologies, Essex, UK). The HOPG had been previously cleaved in order to remove any extraneous organic matter. Solutions of both Aβ (16–23) and F-Aβ (16–23) were allowed to remain on the freshly cleaved surfaces for 2 min before removing the peptide solution by pipetting and then drying with N2. Topography and electrostatic force images were taken independently on an Agilent 5500 AFM (Santa Clara, CA, USA) in alternating current (ACAFM) and electrostatic force microscopy (EFM) modes. For ACAFM mode, SiN3 OTESPA cantilevers with a resonant frequency of approx. 330 kHz and tip radius of 7 nm were used while EFM was conducted with SPM-PIT Pt-Ir coated SiN3 conductive probes with a resonant frequency of 63.9 kHz and tip radius of 20 nm. Both cantilevers were purchased from Bruker Nano AXS (France). Performing the measurements independently allowed higher resolution topological images in order to better study morphological changes induced by the insertion of the fluorinated moiety. Samples were grounded for EFM measurements using silver wire. Images were taken over an area of approximately 5 μm2 at a rate of 1.02 lines s−1 with a resolution of 256 × 256 or 1024 × 1024 pixels. During measurements the topographic trace in both trace and retrace mode, amplitude, phase, EFM X component and EFM phase were all recorded.3. Results and discussion
Aβ (16–23) is a short peptide, 8 residues long, derived from the Aβ (1–40/42) hairpin. This sequence bears in position 19 and 20 (numbered from the original Aβ (1–40/42) peptide) two Phe residues, which confer a hydrophobic character and render this peptide aggregation prone. On the other hand, the lower molecular weight of this sequence, compared with the full length Aβ (1–40/42), gives rise to a slower rate of fibrillation and higher solubility in buffer solutions. Aβ (16–23) has been referred to as the core structure causing fibrillation of Aβ WT; its aggregation pathway and interactions with the full length sequence have therefore been widely studied.29–32 All these characteristics make Aβ (16–23) a good candidate to study the effect of a small fluorinated moiety on the timescale and aggregation morphology.The fluorinated moiety F, 3,5-bis-(trifluoromethyl)-benzoic acid, was attached at the N-terminal amine through a standard SPPS procedure. The reaction resulted in a high yield and no side products were encountered during the cleavage procedure. This method, introducing some additional orthogonal protective group during the SPPS, can be easily applied on any free amine on a sequence. Aβ (16–23) and F-Aβ (16–23) fibre formation was thus studied through the same techniques and the results obtained compared to evaluate any differences.
A common method to study the timescale of amyloid peptide aggregation is CD.33,34 The change in secondary structure from a disordered to a defined conformation of the peptide backbone such as α-helix or β-sheet can be readily observed in CD spectra. We, therefore, studied the secondary structure changes of Aβ (16–23) and F-Aβ (16–23) to compare their aggregation, as reported in Fig. 2. Up to 12 h of incubation at 37 °C both peptides mainly showed a disordered conformation, characterised by a low intensity signal and a negative broad peak at 195–200 nm. Spectra taken after 24 h of incubation indicated some extent of aggregation, but it was only after 36 h that both samples showed a β-sheet structure characterised by a positive peak at 205 nm and a negative peak around 230 nm. CD spectra of peptides in a β-sheet conformation are usually reported with a positive peak at 198 nm and a negative peak at 215 nm, however, sequences containing several Phe residues in close proximity can induce a shift of 10–15 nm each caused by n–π* interactions between the phenyl side chains, as we observe in this case.34–36 The fluorinated peptide (Fig. 2B) still shows a shoulder peak at 215 nm, indicative of a β-sheet configuration, which might be related to some structural features added by the presence of an additional aromatic ring, far from the two Phe side chains, and thus less involved in any n–π* interactions. The overall CD spectra suggest, nevertheless, that the aggregation propensity of F-Aβ (16–23) is not drastically changed from that of the WT and the rate of the aggregation process is very similar. To support the CD data, we also analysed the aggregation profile for both Aβ (16–23) and F-Aβ (16–23) using the ThT assay. ThT is a low fluorescent molecule whose emission is enhanced upon interaction with hydrophobic pockets, specifically it is usually applied to monitor β-sheet formation in amyloidogenic sequences.28 In Fig. 3 is possible to compare the data for both Aβ (16–23) and F-Aβ (16–23) over a time of 72 h. Both of the sequences showed a lag phase for the first ∼20 h, where the curve was almost flat, than an elongation step between 23 h and 35 h and, finally, a steady phase after ∼40 h, where ThT emission did not increase anymore. Therefore, both Aβ (16–23) and F-Aβ (16–23) not only presented a similar aggregation profile via ThT assay, but these data were also in good agreement with the aggregation timescale obtained by CD analyses (Fig. 2). On the basis of these results it is reasonable to conclude that no dramatic changes to the aggregation process should occur when such a small molecule is added at the N-terminus of longer sequences such as Aβ (1–40/42).
 | ||
| Fig. 2 CD spectra of (A) Aβ (16–23) and (B) F-Aβ (16–23), 50 μM in 10 mM phosphate buffer at pH 7.4. | ||
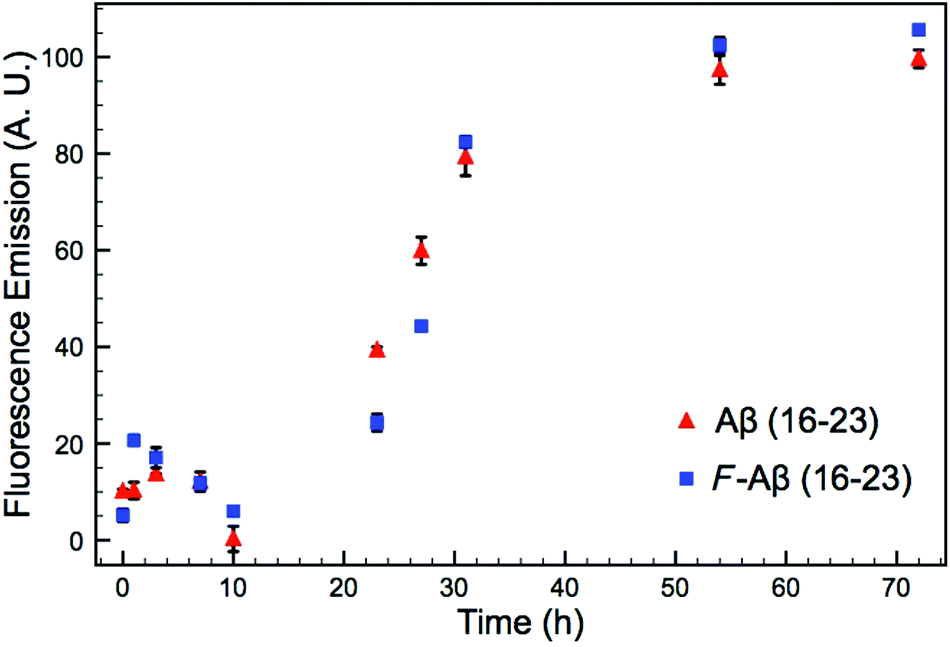 | ||
| Fig. 3 ThT assay of Aβ (16–23) and F-Aβ (16–23), 50 μM in 10 mM phosphate buffer at pH 7.4 diluted 16-fold in fresh filtered ThT solution (100 μM in phosphate buffer 10 mM pH 7.4). The data reported are the mean ± STD of three independent samples for each peptide. | ||
To confirm the similarity in the aggregation behaviour of the fluorinated peptide compared to the WT indicated by CD measurements and ThT assay, two fibres solutions (one for each peptide) were drop cast onto HOPG substrates and imaged using ACAFM. Fig. 4A and B show representative images for the Aβ (16–23) (Fig. 4A) and the F-Aβ (16–23) (Fig. 4B) fibrils. Comparing the images it is clear that no significant differences in morphology are present between the WT and the fluorinated peptide fibres. All fibres are in the region of 10–15 nm wide, 1–2 nm high and several hundred nanometers in length, although some exceptionally long WT fibres were detected (longer than 1 μm) as shown in Fig Aβ (16–23) and (B) F-Aβ (16–23).
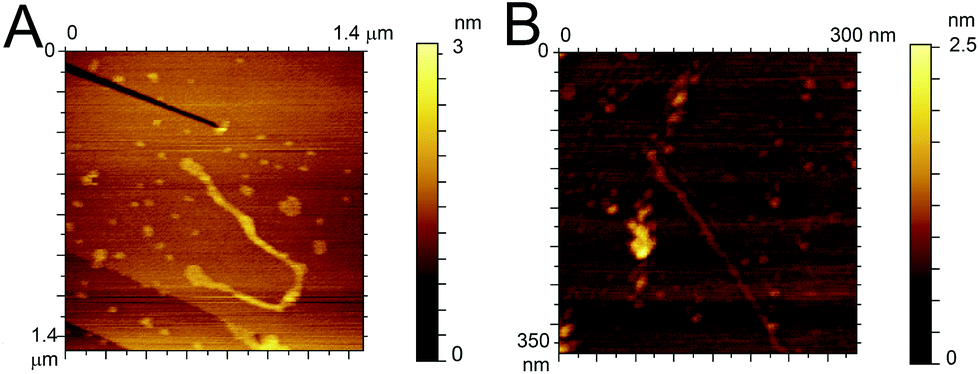 | ||
| Fig. 4 AFM images of (A) Aβ (16–23) and (B) F-Aβ (16–23), 0.5 mg ml−1 in 10 mM phosphate buffer at pH 7.4 diluted 100-fold in ultrapure water cast and imaged on HOPG. | ||
This fibre is of particular interest as, after detailed analysis of its height, cross-over of the fibril is readily evident (see Fig. S6 in ESI†).
After verifying the consistency of aggregation behaviour between the fluorinated and the WT peptide with CD, ThT assay and ACAFM, we proceeded with TEM measurements. Our aim was not only to further analyse the morphology of the fibres originating from both the peptides, but also investigate the ability of the fluorinated moiety to dissipate the beam current, allowing the sample to be imaged without any additional staining. As mentioned previously, the reported procedure to prepare peptides and protein samples for TEM analyses is based on staining the deposits on the grid with a radioactive solution of uranyl acetate. This methodology bears two major drawbacks: the hazard due to the use of a radioactive compound and the need for a conductive material, which is not an integral part of the structure of interest.
The use of the fluorinated moiety F allowed us to address both of these issues. Fig. 5 shows the TEM images of both Aβ (16–23) and F-Aβ (16–23). Aβ (16–23) samples were stained following the common uranyl acetate protocol,8 while F-Aβ (16–23) samples were only treated with an immobilising agent, to prevent any degradation of the sample, but without any additional staining applied.
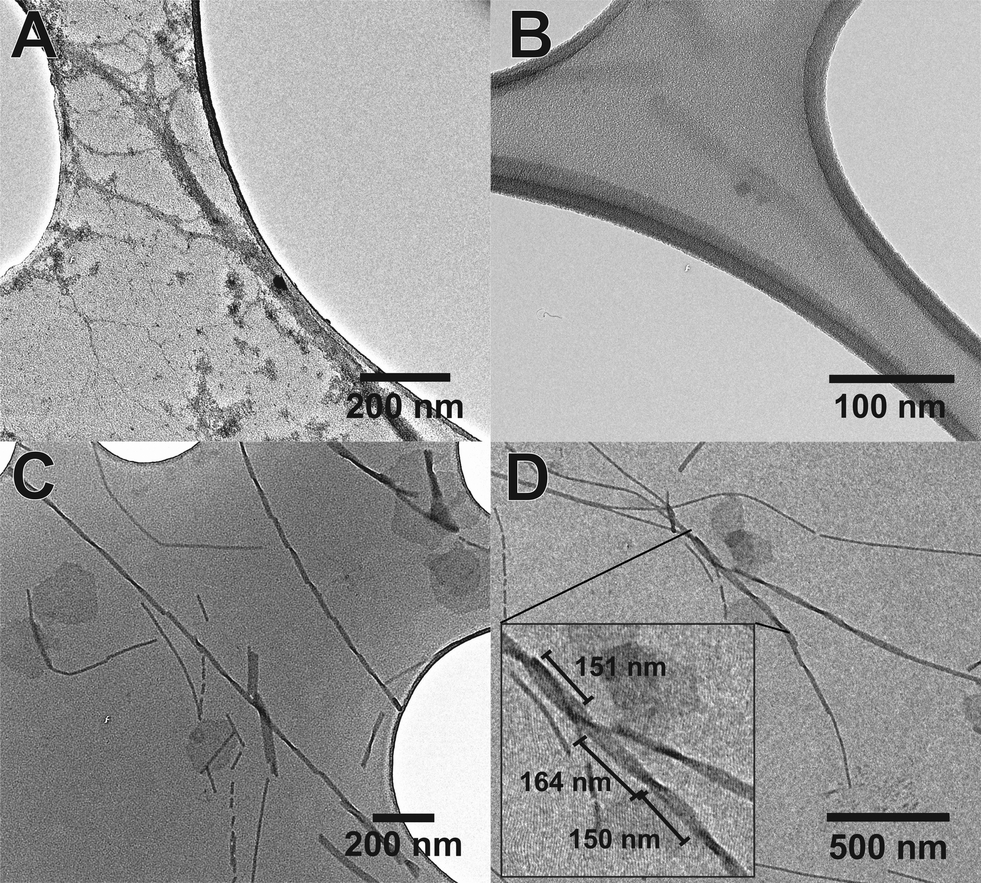 | ||
| Fig. 5 TEM images of the fibres of (A) Aβ (16–23) sample stained with uranyl acetate 2% solution, (B) Aβ (16–23) sample without any type of staining (barely visible), (C) F-Aβ (16–23) sample, presenting particularly regular cross-over and (D) F-Aβ (16–23), reporting some cross-over measurements in the inset. Peptides were 0.5 mg ml−1 solutions in phosphate buffer pH 7.4, the images were taken after 2 weeks of incubation at 37 °C. F-Aβ (16–23) was always imaged without any additional staining. | ||
Significantly-improved images of the amyloid fibres were obtained when the fluorinated moiety F was included in the peptide strand compared to the WT fibres. Both the contrast and the resolution are greatly enhanced, the cross-over of the fibres is clearly visible and, above all, only the fibre-peptide itself is visible (Fig. 5C, D and S5 in ESI†). In addition to these advantages, the morphology of the fibres obtained both from Aβ (16–23) and F-Aβ (16–23) aggregation was very similar and in line with amyloid fibres previously reported in the literature.31,37,38 Moreover, the data obtained from TEM analyses are in close agreement with the AFM results previously mentioned in this section. The width of the fibres is between 10–25 nm in both of the peptides; thinner fibres (filaments) present a width around 8–13 nm, while wider fibres, up to 22 nm in F-Aβ (16–23) and 28 nm in Aβ (16–23), are probably more mature fibrils. The length of the fibres vary significantly for both peptides, they are usually a few 100 nm long, but some of the longest fibres reach 1 μm. Cross-overs are visible for some of the fluorinated fibres and spacing between such points range between 150–200 nm, which is in agreement with what has been previously reported in the literature for WT Aβ (1–40/42).39,40 Taken together such evidence is very supportive of significantly improving standard TEM imaging of peptides, by the sole incorporation of a small fluorinated moiety, without interfering in the natural aggregation pathway.
In an effort to explain why the F-Aβ (16–23) dissipates the beam current more effectively in the TEM than either the unstained or uranyl acetate stained Aβ (16–23), we studied the variations in the charge transport properties of F-Aβ (16–23) fibres compared to those of the WT. Examination of the F-Aβ (16–23) and Aβ (16–23) fibres were carried out using EFM (Fig. 6B, D and S7–8 in ESI†). This technique allows the long range electrostatic forces of the material, rather than the short range van der Waals forces in conventional AFM, to be imaged supplying qualitative information of the surface electrical properties. The results of these experiments, shown in Fig. 6, indicate an increase in electrostatic force of the F-Aβ (16–23) over the Aβ (16–23) fibres. Fig. 6A, C show the lower resolution topographical images obtained during EFM measurements of the WT and the fluorinated peptide, respectively. These experiments verify the presence of fibres at the imaging location. Using the electrostatic force of the highly conductive HOPG as the relative standard, the difference in the electrostatic force of the peptide fibres can be estimated. Looking first at Fig. 6B, the presence of the Aβ 16–23 fibres is quite evident as the long range electrostatic forces of the fibres are significantly weaker than the HOPG background, thus a decrease in the signal is evident where the fibres are located. Comparing this with Fig. 6D, here the distinction between the HOPG substrate and the fluorinated peptide is much less clear, referring particularly to the fibres visible in the right hand side of Fig. 6C. This indicates an increase in the electrostatic forces of the fibres, becoming relatively closer to the signal of the HOPG and thus more difficult to distinguish. In the case of the larger fibre there seems to be a change in the distribution of the electrostatic force along the length of the fibre potentially indicating a difference in distribution of the conducting moiety or a cross-over point in the fibril. This result can explain the peculiar behaviour of F-Aβ (16–23) in the TEM analysis, but it also indicates that simple addition of a fluorinated moiety on an aggregation prone peptide is an effective way to increase charge transport in the fibres.
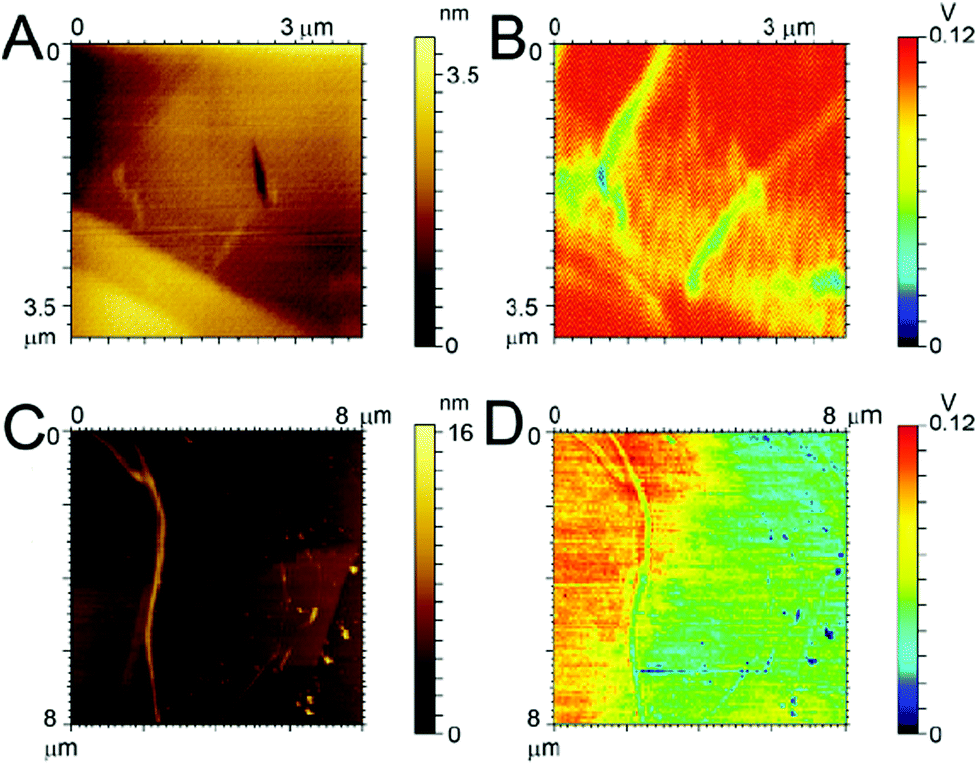 | ||
| Fig. 6 AFM and EFM images. Topography of (A) Aβ (16–23) and (C) F-Aβ (16–23); electrostatic force map of (B) Aβ (16–23) and (D) F-Aβ (16–23). Peptides were 0.5 mg ml−1 solutions in 10 mM phosphate buffer at pH 7.4 diluted 100-fold in ultrapure water and cast on Au-coated Si wafer. | ||
4. Conclusions
A simple synthetic modification on a short amyloidogenic peptide, the 16–23 fragment of Aβ, enabled the recording of TEM images without any further staining procedures. It has been shown, through independent techniques, that the fluorinated moiety inserted at the end of the peptide sequence does not significantly change the aggregation time or the morphology of the fibres, thus suggesting the use of this molecule for imaging of longer and more biologically-relevant peptides, such as the parent Aβ (1–40/42). The ability of F-Aβ (16–23) to dissipate the beam and thus be imaged in the TEM has been supported by a change in conductivity from the WT peptide to the fluorinated variant, which has been quantified by EFM measurements. These preliminary results pave the way to further studies on fibrillogenic peptides by insertion of several fluorinated residues and possible new applications of fluorine in protein stability and conformational studies.Acknowledgements
The authors are grateful for funding from the ERC Starting Investigator grant ASPiRe (no. 240629). The authors are also grateful to Dr Marco Di Antonio for assistance with HPLC purification.References
- J. Hardy and D. J. Selkoe, Science, 2002, 297, 353–356 CrossRef CAS PubMed.
- A. B. Singleton, M. Farrer, J. Johnson, A. Singleton, S. Hague, J. Kachergus, M. Hulihan, T. Peuralinna, A. Dutra, R. Nussbaum, S. Lincoln, A. Crawley, M. Hanson, D. Maraganore, C. Adler, M. R. Cookson, M. Muenter, M. Baptista, D. Miller, J. Blancato, J. Hardy and K. Gwinn-Hardy, Science, 2003, 302, 841 CrossRef CAS PubMed.
- M. DiFiglia, E. Sapp, K. O. Chase, S. W. Davies, G. P. Bates, J. P. Vonsattel and N. Aronin, Science, 1997, 277, 1990–1993 CrossRef CAS.
- S. E. Kahn, S. Andrikopoulos and C. B. Verchere, Diabetes, 1999, 48, 241–253 CrossRef CAS.
- D. J. Selkoe, Nature, 2003, 426, 900 CrossRef CAS PubMed.
- C. G. Glabe, Neurobiol. Aging, 2006, 27, 570–575 CrossRef CAS PubMed.
- C. E. MacPhee and C. M. Dobson, J. Am. Chem. Soc., 2000, 122, 12707–12713 CrossRef CAS.
- D. M. Walsh, A. Lomakin, G. B. Benedek, M. M. Condron and D. B. Teplow, J. Biol. Chem., 1997, 272, 22364–22372 CrossRef CAS PubMed.
- A. T. Petkova, Y. Ishii, J. J. Balbach, O. N. Antzutkin, R. D. Leapman, F. Delaglio and R. Tycko, Proc. Natl. Acad. Sci. U. S. A., 2002, 99, 16742–16747 CrossRef CAS PubMed.
- A. T. Petkova, W.-M. Yau and R. Tycko, Biochemistry, 2006, 45, 498–512 CrossRef CAS PubMed.
- R. Tycko, Annu. Rev. Phys. Chem., 2011, 62, 279–299 CrossRef CAS PubMed.
- W. Qiang, K. Kelley and R. Tycko, J. Am. Chem. Soc., 2013, 135, 6860–6871 CrossRef CAS PubMed.
- G. Bitan, M. D. Kirkitadze, A. Lomakin, S. S. Vollers, G. B. Benedek and D. B. Teplow, Proc. Natl. Acad. Sci. U. S. A., 2003, 100, 330–335 CrossRef CAS PubMed.
- S. I. A. Cohen, S. Linse, L. M. Luheshi, E. Hellstrand, D. A. White, L. Rajah, D. E. Otzen, M. Vendruscolo, C. M. Dobson and T. P. J. Knowles, Proc. Natl. Acad. Sci. U. S. A., 2013, 110, 9758–9763 CrossRef CAS PubMed.
- H. Inouye, P. Fraser and D. Kirschner, Biophys. J., 1993, 64, 502–519 CrossRef CAS.
- F. Chiti and C. M. Dobson, Annu. Rev. Biochem., 2006, 75, 333–366 CrossRef CAS PubMed.
- S. Zhang, Nat. Biotechnol., 2003, 21, 1171–1178 CrossRef CAS PubMed.
- H. Sakai, K. Watanabe, Y. Asanomi, Y. Kobayashi, Y. Chuman, L. Shi, T. Masuda, T. Wyttenbach, M. T. Bowers, K. Uosaki and K. Sakaguchi, Adv. Funct. Mater., 2013, 23, 4881–4887 CrossRef CAS.
- O. Carny, D. E. Shalev and E. Gazit, Nano Lett., 2006, 6, 1594–1597 CrossRef CAS PubMed.
- M. Reches and E. Gazit, Nat. Nanotechnol, 2006, 1, 195–200 CrossRef CAS PubMed.
- P. E. Williams, E. A. Appel, S. T. Jones, J. del Barrio, Y. Lan and O. A. Scherman, J. Polym. Sci., Part A: Polym. Chem., 2015 DOI:10.1002/pola.27517.
- C. Jäckel and B. Koksch, Eur. J. Org. Chem., 2005, 4483–4503 CrossRef.
- H.-P. Chiu, B. Kokona, R. Fairman and R. P. Cheng, J. Am. Chem. Soc., 2009, 131, 13192–13193 CrossRef CAS PubMed.
- J. C. Biffinger, H. W. Kim and S. G. DiMagno, ChemBioChem, 2004, 5, 622–627 CrossRef CAS PubMed.
- H.-J. Böhm, D. Banner, S. Bendels, M. Kansy, B. Kuhn, K. Müller, U. Obst-Sander and M. Stahl, ChemBioChem, 2004, 5, 637–643 CrossRef PubMed.
- J. G. Bann, J. Pinkner, S. J. Hultgren and C. Frieden, Proc. Natl. Acad. Sci. U. S. A., 2002, 99, 709–714 CrossRef CAS PubMed.
- X.-G. Li, M. Haaparanta and O. Solin, J. Fluorine Chem., 2012, 143, 49–56 CrossRef CAS PubMed.
- S. Sinha, D. H. J. Lopes, Z. Du, E. S. Pang, A. Shanmugam, A. Lomakin, P. Talbiersky, A. Tennstaedt, K. McDaniel, R. Bakshi, P.-Y. Kuo, M. Ehrmann, G. B. Benedek, J. A. Loo, F.-G. Klärner, T. Schrader, C. Wang and G. Bitan, J. Am. Chem. Soc., 2011, 133, 16958–16969 CrossRef CAS PubMed.
- J. J. Balbach, Y. Ishii, O. N. Antzutkin, R. D. Leapman, N. W. Rizzo, F. Dyda, J. Reed and R. Tycko, Biochemistry, 2000, 39, 13748–13759 CrossRef CAS PubMed.
- M. M. Pallitto, J. Ghanta, P. Heinzelman, L. L. Kiessling and R. M. Murphy, Biochemistry, 1999, 38, 3570–3578 CrossRef CAS PubMed.
- L. C. Serpell and J. M. Smith, J. Mol. Biol., 2000, 299, 225–231 CrossRef CAS PubMed.
- L. O. Tjernberg, C. Lilliööehk, D. J. E. Callaway, J. Näslund, S. Hahne, J. Thyberg, L. Terenius and C. Nordstedt, J. Biol. Chem., 1997, 272, 12601–12605 CrossRef CAS PubMed.
- S. M. Kelly, T. J. Jess and N. C. Price, Biochim. Biophys. Acta, 2005, 1751, 119–139 CrossRef CAS PubMed.
- V. Castelletto, I. Hamley and P. Harris, Biophys. Chem., 2008, 138, 29–35 CrossRef CAS PubMed.
- I. W. Hamley, D. R. Nutt, G. D. Brown, J. F. Miravet, B. Escuder and F. Rodriguez-Llansola, J. Phys. Chem. B, 2010, 114, 940–951 CrossRef CAS PubMed.
- S. Dehn, V. Castelletto, I. W. Hamley and S. Perrier, Biomacromolecules, 2012, 13, 2739–2747 CrossRef CAS PubMed.
- C. Sachse, M. Fändrich and N. Grigorieff, Proc. Natl. Acad. Sci. U. S. A., 2008, 105, 7462–7466 CrossRef CAS PubMed.
- J. Meinhardt, C. Sachse, P. Hortschansky, N. Grigorieff and M. Fändrich, J. Mol. Biol., 2009, 386, 869–877 CrossRef CAS PubMed.
- M. Fändrich, M. Schmidt and N. Grigorieff, Trends Biochem. Sci., 2011, 36, 338–345 CrossRef PubMed.
- M. Schmidt, C. Sachse, W. Richter, C. Xu, M. Fändrich and N. Grigorieff, Proc. Natl. Acad. Sci. U. S. A., 2009, 106, 19813–19818 CrossRef CAS PubMed.
Footnote |
| † Electronic supplementary information (ESI) available. See DOI: 10.1039/c4an02278e |
| This journal is © The Royal Society of Chemistry 2015 |