 Open Access Article
Thermodynamic study of CsCaCl3 using neutron diffraction†
Craig L.
Bull
 *ab,
Christopher J.
Ridley
 a,
Nicholas P.
Funnell
 a,
Sumit
Konar‡
 b and
James
Cumby
 b
b
aISIS Neutron and Muon Source, Rutherford Appleton Laboratory, Didcot, Oxon OX11 7XN, UK. E-mail: craig.bull@stfc.ac.uk
bSchool of Chemistry, University of Edinburgh, David Brewster Road, Edinburgh EH9 3FJ, Scotland, UK
First published on 13th March 2024
Abstract
The pressure and temperature phase diagram of the halide-based perovskite, CsCaCl3 is investigated using neutron diffraction. At ambient pressure, it undergoes a cubic to tetragonal phase transition at approximately 95 K. The structural evolution is characterised by changes in Cs and Ca coordination, bond lengths, and polyhedral volumes. Heat capacity measurements reveal a discontinuity at the phase transition, where we use a two-term Debye model to show the presence of two distinct contributions. Under pressure, CsCaCl3 exhibits phase transitions from cubic to tetragonal to rhombohedral symmetry, which can be understood when comparing the relative compressibilites of the CaCl6 and CsCln (where n = 12 for the cubic and 8 for the tetragonal and rhombohedral phases). Overall, this study provides experimentally derived thermodynamic properties and a tentative phase diagram of CsCaCl3 as a function of pressure and temperature.
1 Introduction
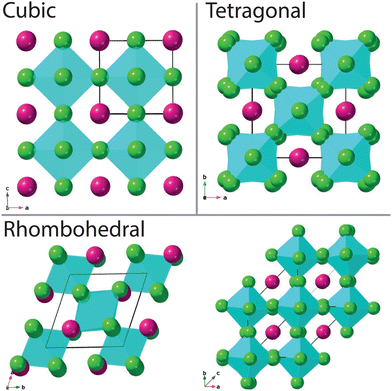
The aristotype perovskite structure is cubic (space group Pm![[3 with combining macron]](https://www.rsc.org/images/entities/char_0033_0304.gif) m) with corner shared BX6 octahedra surrounding a AX12 polyhedron (see Fig. 1). Of particular interest to this manuscript is the case where X represents a halide (F, Cl, Br, I), rather than oxygen. Fernández et al.1 previously demonstrated that materials with the general formula ABCl3 crystallise in this perovskite structure, with a tolerance factor between 0.81 and 0.9.2,3 Halide-based perovskites, as with the oxide analogues, often demonstrate temperature and pressure-driven polymorphism, with crystallographic symmetry deviating from or converging towards the cubic aristotype via octahedral rotation/distortion, or A-site cation displacement. For example, cubic CsSrCl3 transforms to tetragonal then orthorhombic then monoclinic symmetry at 385 K, 375 K and 362 K respectively.1,4 CsPbCl3 is also highly polymorphic, with multiple phase transitions over a very narrow temperature range.5 The application of hydrostatic pressure as a tuning parameter is an efficient way of generating materials with new crystalline structures with intrinsic physical properties.6 Pressure tends to increase the electron density therefore enhancing the repulsive forces within a material, often resulting in unexpected behaviour. The halide based perovskites are good analogues for perovskite oxides under high-pressure conditions, with the advantage of showing greater compressibilities compared to their oxide counterparts.7 For example, the pressure driven isostructural phase transition of CsPbCl3 at room temperature.8
m) with corner shared BX6 octahedra surrounding a AX12 polyhedron (see Fig. 1). Of particular interest to this manuscript is the case where X represents a halide (F, Cl, Br, I), rather than oxygen. Fernández et al.1 previously demonstrated that materials with the general formula ABCl3 crystallise in this perovskite structure, with a tolerance factor between 0.81 and 0.9.2,3 Halide-based perovskites, as with the oxide analogues, often demonstrate temperature and pressure-driven polymorphism, with crystallographic symmetry deviating from or converging towards the cubic aristotype via octahedral rotation/distortion, or A-site cation displacement. For example, cubic CsSrCl3 transforms to tetragonal then orthorhombic then monoclinic symmetry at 385 K, 375 K and 362 K respectively.1,4 CsPbCl3 is also highly polymorphic, with multiple phase transitions over a very narrow temperature range.5 The application of hydrostatic pressure as a tuning parameter is an efficient way of generating materials with new crystalline structures with intrinsic physical properties.6 Pressure tends to increase the electron density therefore enhancing the repulsive forces within a material, often resulting in unexpected behaviour. The halide based perovskites are good analogues for perovskite oxides under high-pressure conditions, with the advantage of showing greater compressibilities compared to their oxide counterparts.7 For example, the pressure driven isostructural phase transition of CsPbCl3 at room temperature.8
At 293 K, CsCaCl3 is cubic and has been shown to transform to tetragonal symmetry upon cooling below 95 K.9 It is an effective scintillator material, and its doped derivatives find applications in fields such as medical imaging and high-energy physics experiments.10–12 More generally, inorganic chloride perovskites also find applications in light-emitting diodes, photodetectors and field effect transistors.13–16 Understanding the structural and thermodynamic/physical property relationships of such materials is key to the design of novel materials with tailored physical properties which can prepared by chemical tuning. The application of pressure allows a clean and rapid determination of structure–property relationships which provides information for materials design suitable for devices with specific physical properties. In this study we have used neutron diffraction to study the structure of CsCaCl3 as a function of temperature and pressure. Isothermal compression of CsCaCl3 at 290 and 190 K reveals two structural phase transitions allowing the determination of a tentative phase diagram.
2 Experimental
2.1 Sample synthesis and characterisation
Calcium chloride (anhydrous, ≥93.0%) and caesium chloride (99.999%) were dried under dynamic vacuum in fused silica tubes at 473 K overnight, and were transferred immediately to a glovebox where an equimolar proportion of each were mixed thoroughly in an agate mortar. The mixture was subsequently inserted into another fused quartz tube, sealed and removed from the glovebox where the tube was encapsulated by flame sealing under vacuum. The sealed quartz tube was placed upright inside a box furnace and annealed at 1273 K for 12 hours, prior to cooling to ambient conditions. The quartz tube was returned to the glovebox for storage. Heat capacity measurements were performed on a 6.5 mg lump of CsCaCl3, taken from the melted sample before grinding the remaining sample into a fine powder for the diffraction measurements. The isobaric heat capacity, cp, was measured using a PPMS (Quantum Design Inc.) using the relaxation method over the temperature range 4–300 K, on heating. The isochoric heat capacity, cv, was calculated using the expression: cv = cp − Tαv2B0Vm. Where αv is the volumetric thermal expansion coefficient, B0 is the bulk modulus (assumed temperature independent), and Vm is the molar volume.2.2 Neutron powder diffraction
All neutron-diffraction measurements were performed on the time-of-flight PEARL diffractometer.17 The ambient pressure data were collected from the sample as-synthesised, loaded and sealed into a 6 mm diameter vanadium canister within a glovebox. The sealed can was loaded into a 50 mm diameter (Abingdon Scientific) vanadium tailed cryostat and then cooled to 5 K. Diffraction patterns were collected step-wise upon warming. For the high-pressure measurements, the sample was loaded in a glove-box into an encapsulated TiZr gasket with a pellet of Pb as a pressure-marker18 and perdeuterated methanol![[thin space (1/6-em)]](https://www.rsc.org/images/entities/char_2009.gif) :
:![[thin space (1/6-em)]](https://www.rsc.org/images/entities/char_2009.gif) ethanol (4
ethanol (4![[thin space (1/6-em)]](https://www.rsc.org/images/entities/char_2009.gif) :
:![[thin space (1/6-em)]](https://www.rsc.org/images/entities/char_2009.gif) 1 by volume) as a pressure-transmitting medium.19 The gasket was sealed between two single-toroidal anvils, machined from zirconia toughened alumina, within a V3 Paris–Edinburgh press.20 Diffraction patterns were obtained in the transverse scattering geometry in approximately 5 tonne steps up to a maximum of 60 tonnes applied load, collected for ∼2 hours per step. The data were focused and corrected for attenuation using Mantid.21 The crystallographic structures were Rietveld-refined against the resulting diffraction patterns using GSAS.22 Fits to the unit-cell data and subsequent determination of equations-of-state were determined using PASCal.23
1 by volume) as a pressure-transmitting medium.19 The gasket was sealed between two single-toroidal anvils, machined from zirconia toughened alumina, within a V3 Paris–Edinburgh press.20 Diffraction patterns were obtained in the transverse scattering geometry in approximately 5 tonne steps up to a maximum of 60 tonnes applied load, collected for ∼2 hours per step. The data were focused and corrected for attenuation using Mantid.21 The crystallographic structures were Rietveld-refined against the resulting diffraction patterns using GSAS.22 Fits to the unit-cell data and subsequent determination of equations-of-state were determined using PASCal.23
3 Results & discussion
3.1 Ambient pressure behaviour
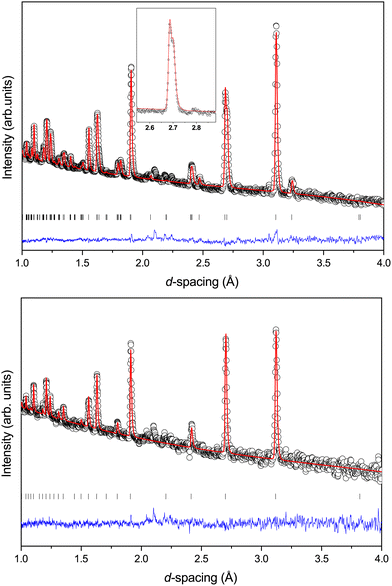
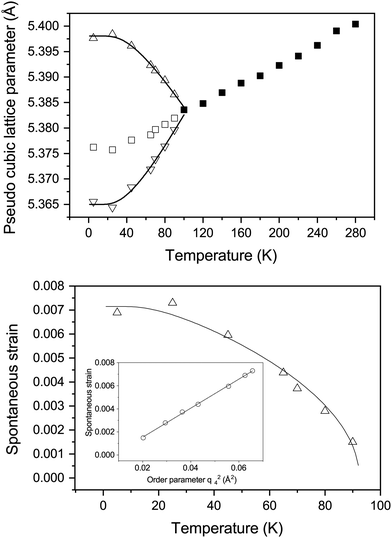
Fig. 2 shows the neutron powder diffraction patterns at 260.0(1) and 5.0(1) K. Upon cooling below ∼95 K a new reflection appears at ∼3.24 Å, which can be indexed as the super-lattice reflection of the pseudo-cubic cell (corresponding to the R-point of the Brillouin zone). The R-point reflection is also accompanied by a splitting of the cubic 400 reflection at ∼2.69 Å which index as the 220 and 004 reflections in the new tetragonal cell (space group I4/mcm, a0a0c+ tilt system24). Our data collections are coarse in temperature steps however, we estimate that the transition from the cubic to tetragonal phase occurs at ∼95 K which is in good agreement with previous experimental results.9Fig. 3 shows the thermal evolution of the pseudo-cubic lattice parameters for the cubic (a = apc) and tetragonal (
 , cpc = ctet/2) phases.
In the tetragonal phase the Cs coordination reduces from 12 to 8 (with an associated point group change from m![[3 with combining macron]](https://www.rsc.org/images/entities/char_0033_0304.gif) m to
m to ![[4 with combining macron]](https://www.rsc.org/images/entities/char_0034_0304.gif) 2m), the CaCl6 polyhedra remain unchanged in coordination number, but there is a change in point group symmetry from m
2m), the CaCl6 polyhedra remain unchanged in coordination number, but there is a change in point group symmetry from m![[3 with combining macron]](https://www.rsc.org/images/entities/char_0033_0304.gif) m to 4/m. In both the cubic and tetragonal phases the derived structural parameters (polyhedral volumes and bond lengths) can be obtained following the parameterisation of Knight et al.,25 a full tabulation of which is provided in the ESI.† These are derived from the lattice parameter (a) in the cubic phase, and the (a, c) lattice parameters, and the order parameter (ϕ) in the tetragonal phase. ϕ is the rotation of the CaCl6 octahedra about [001]. This can be derived from the atomic coordinate of the Cl atom, u (where tan(ϕ) = 4u).26 The refined structural parameters are given in Table 1 for the two data sets shown in Fig. 2, see the ESI,† for further temperatures.
m to 4/m. In both the cubic and tetragonal phases the derived structural parameters (polyhedral volumes and bond lengths) can be obtained following the parameterisation of Knight et al.,25 a full tabulation of which is provided in the ESI.† These are derived from the lattice parameter (a) in the cubic phase, and the (a, c) lattice parameters, and the order parameter (ϕ) in the tetragonal phase. ϕ is the rotation of the CaCl6 octahedra about [001]. This can be derived from the atomic coordinate of the Cl atom, u (where tan(ϕ) = 4u).26 The refined structural parameters are given in Table 1 for the two data sets shown in Fig. 2, see the ESI,† for further temperatures.
![[3 with combining macron]](https://www.rsc.org/images/entities/char_0033_0304.gif) m; Wyckoff positions: Cs 1b, Ca 1a, Cl 3d. For the tetragonal structure the space-group is I4/mcm, Cs 4b, Ca 4c, Cl(1) 4a, Cl(2)
m; Wyckoff positions: Cs 1b, Ca 1a, Cl 3d. For the tetragonal structure the space-group is I4/mcm, Cs 4b, Ca 4c, Cl(1) 4a, Cl(2) 
| Parameter | 5.0(1) K | 260.0(1) K |
|---|---|---|
| Symmetry | Tetragonal | Cubic |
| Space group | I4/mcm |
Pm![[3 with combining macron]](https://www.rsc.org/images/entities/char_0033_0304.gif) m m |
| a (Å) | 7.5880(3) | 5.3991(3) |
| b (Å) | 7.5880(3) | 5.3991(3) |
| c (Å) | 10.7953(5) | 5.3991(3) |
| Unit-cell volume (Å3) | 621.57(7) | 157.38(3) |
| Cl(2) u | 0.0233 | — |
| wRp, Rp (%) | 1.3, 1.5 | 1.46, 1.68 |
| χ 2 | 1.02 | 0.6 |
The temperature evolution of the tetragonal lattice parameters have been fitted to a model related to an Einstein internal energy function;27 the fits are shown as solid lines in Fig. 3. The fit function, and resulting fit parameters are provided in the ESI.† The symmetry-adapted tetragonal strain (detailed in the ESI,† and ref. 25), etz, tends towards 0 upon approaching the phase transition, as the cubic phase is by necessity free of tetragonal-strain. Following the work of Knight et al.,25 it is possible to model the temperature dependence of etz with the following equation:
 | (1) |
 | (2) |
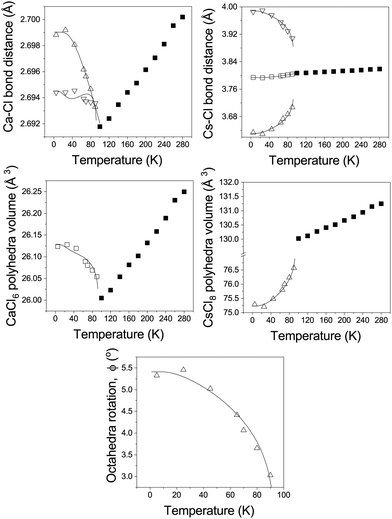
The two distinct Ca–Cl bonds both decrease in length with increasing temperature, while in the cubic phase the single bond-length increases linearly as the temperature is increased, see Fig. 4. This is mirrored in the temperature dependence of the CaCl6 polyhedral volume. This behaviour is analogous to that seen in the structurally-similar system RbCaF3.26 In the tetragonal phase the axial Cs–Cl(1) bond shows only a small variation with temperature, which is in contrast to the shorter bonded Cs–Cl(2) bond which rapidly increases in length with increasing temperature and this behaviour is mirrored by the longer non-bonding Cs–Cl(2) bond which reduces in length. In the cubic phase these three distinct bonds become equivalent and increase in length with increasing temperature. Overall, this results in a non-linear increase in the CsCl8 polyhedral volume with temperature, becoming a linear increase for the CsCl12 polyhedra in the cubic phase. The octahedral tilting (ϕ) is also shown, tending to zero as the phase transition to the cubic phase is approached.
3.2 Heat capacity at ambient pressure
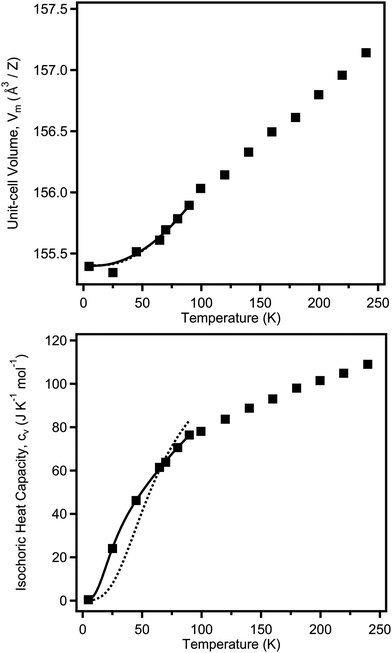
The temperature dependence of the unit-cell volume V(T) can be fitted to a model based on statistical mechanics with the underlying Grüneisen approximation to the ambient pressure equation of state:28V(T) = V0 + (γ/B(T))U(T), where γ is the Grüneisen parameter, B(T) is the bulk modulus, U(T) is the internal energy function of the crystal, and V0 is the unit cell volume at T = 0. As the full temperature dependence of B(T) is unknown, it is hereby assumed to be temperature invariant i.e. B(T) ≈ B0, where B0 is the isothermal bulk modulus. The internal energy can be approximated using a Debye model, the parameters for which can be fitted simultaneously against the volumetric and isochoric heat-capacity data (see ESI,† for details). Such a technique has been used extensively in the literature, for example in the study of BaZrO3.29 The isochoric heat capacity was calculated from the isobaric heat capacity as described in the experimental details, with the number of volume data-points limiting the overall fit. The full isobaric heat capacity dataset is available in the ESI,† and shows a clear discontinuity at the point of the transition to tetragonal symmetry between 90 and 100 K, as expected.The heat capacity and volumetric data were fitted in this way in the tetragonal phase, where the bulk modulus has been assumed to be temperature invariant, fixed at the value determined at ambient temperature for the tetragonal phase (see Table 3). It was found that a single-term Debye model fitted the volumetric data well (giving θD = 267(8) K), but it could not account for the measured temperature dependence in the heat capacity, see Fig. 5. Instead, a two-term Debye model was used, representing separated cation and anion behaviour, significantly improving the fit. Despite the limited number of data points, the fits converged stably; the determined thermodynamic parameters from these fits are summarised in Table 2. The weighted average value for the Debye temperature is θwD = 304 K, which is higher than that predicted recently from ab initio methods (233.7 K,30 225.67 K31). However both of these studies assumed cubic symmetry for the material, which may explain the discrepancy.
| Parameter | |
|---|---|
| V 0 (Å3) | 155.4(3) |
| γ 1 | 6(2) |
| θ D1 (K) | 461(12) |
| γ 2 | 2.0(5) |
| θ D2 (K) | 118(3) |
| Mixing parameter, z | 0.543(14) |
3.3 High pressure behaviour at 290 K
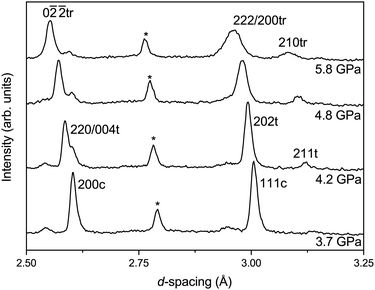
With increasing pressure, at 2.4(1) GPa a new broad but weak feature is observed at ∼3.1 Å in the diffraction pattern. This feature is in the same region as the R-point reflection observed upon cooling at 90 K and can be indexed accordingly. However, there are no other new reflections observed or splitting, within the instrumental resolution limits, suggesting that there is no measurable strain in the material. However, as shown in Fig. 6, at 4.2(1) GPa the reflection significantly sharpens and increases in intensity and is accompanied by a splitting of the pseudo-cubic 200 reflection and no observed splitting of the 111 reflection. This suggests that this phase has tetragonal symmetry and can be indexed on the I4/mcm space group, equivalent to the low-temperature phase discussed above.At the next pressure point measured (4.8(1) GPa), the relative intensity of the 220/004 reflections change and the pseudo-cubic 111 reflection is seen to broaden (suggesting a peak splitting§), indicative of a transition to lower symmetry due to further tilting of the CaCl6 octahedral units. This is caused by the freezing of phonons at the R-point (anti-phase tilt) or M-point (in-phase tilt) in reciprocal space of the cubic Pm![[3 with combining macron]](https://www.rsc.org/images/entities/char_0033_0304.gif) m structure. We do not observe an M-point reflection in the data set at high-pressure, though if it is very weak it could be masked by the background of the pressure–cell. The high sensitivity of neutron diffraction to chlorine would therefore indicate that, if present, an M-point distortion must be extremely small. We proceed assuming only an R-point distortion is present.
m structure. We do not observe an M-point reflection in the data set at high-pressure, though if it is very weak it could be masked by the background of the pressure–cell. The high sensitivity of neutron diffraction to chlorine would therefore indicate that, if present, an M-point distortion must be extremely small. We proceed assuming only an R-point distortion is present.
The pattern can be fitted with a rhombohedral phase, space group R![[3 with combining macron]](https://www.rsc.org/images/entities/char_0033_0304.gif) c (a−a−a−) for which only the R-point reflections are present, with a small fraction of the tetragonal phase coexisting. An attempt to fit the data against a lower-symmetry model, for example with orthorhombic Imma (a−a−c0) symmetry, did not yield a satisfactory fit to the data. The pattern remains mixed phase up to the maximum pressure measured of 6.4(1) GPa. Upon recovery to ambient conditions the R-point reflection is lost, as is the splitting of the pseudo-cubic reflections, showing full reversibility.
c (a−a−a−) for which only the R-point reflections are present, with a small fraction of the tetragonal phase coexisting. An attempt to fit the data against a lower-symmetry model, for example with orthorhombic Imma (a−a−c0) symmetry, did not yield a satisfactory fit to the data. The pattern remains mixed phase up to the maximum pressure measured of 6.4(1) GPa. Upon recovery to ambient conditions the R-point reflection is lost, as is the splitting of the pseudo-cubic reflections, showing full reversibility.
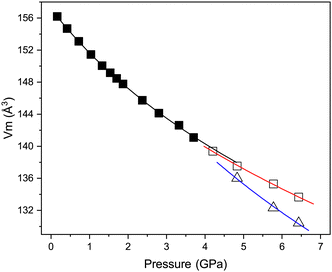
Fig. 7 shows the variation in the unit-cell volume with pressure in each of the three phases described above. Also shown are the derived Birch–Murnaghan equations of state (EoS) for each phase; the fitted EoS parameters are listed in Table 3. The value of B0 for the cubic phase of 25.3(9) GPa is significantly lower than would be expected for oxygen-based inorganic perovskites for example CaTiO3 the bulk modulus is 177 GPa,32 and is not unexpected for halide based inorganic perovskites, for example, CsPbCl3 has a B0 of 45.6 GPa.8 Theoretical prediction of B0 for CsCaCl3 suggest values between 23–32 dependent on the model used.33,34 The value of B0 is also comparable to polymeric halide compounds for example AuI which has a bulk modulus of 18 GPa.35 The bulk modulus determined for the tetragonal phase is greater than that of the cubic phase, as would be expected from a denser phase. However, unusually, the higher-pressure rhombohedral phase has a lower bulk modulus than the cubic phase. The values of B0 determined for the tetragonal and rhombohedral phases are unreliable (and only shown for completeness) as a result of the limited number of data points used for each fit. However, Fig. 7 clearly shows that the transition from cubic to tetragonal phase is close to second order in nature, given the almost continuous behaviour of the unit-cell volume across the phase-boundary and the first order like behaviour of the tetragonal to rhombohedral phase where a clear discontinuity in unit-cell volume is observed in addition to phase co-existence.
| Parameter | Cubic | Tetragonala | Rhombohedrala |
|---|---|---|---|
| a The number of data points available significantly limits the validity of the values determined in the two high pressure phases, and are shown only for completeness. | |||
| Axial compressibility | |||
| a (TPa−1) | 8.98(11) | 6.5 | 9.3(2) |
| b (TPa−1) | — | 6.5 | 8.5(4) |
| c (TPa−1) | — | 3.9 | 8.4(2) |
| EoS order | 3rd | 2nd | 2nd |
| V 0 (Å3) | 157.14(14) | 617.1(19) | 328.4(2) |
| B 0 (GPa) | 25.3(9) | 33.7(10) | 17(2) |
| B′ | 5.9(6) | — | — |
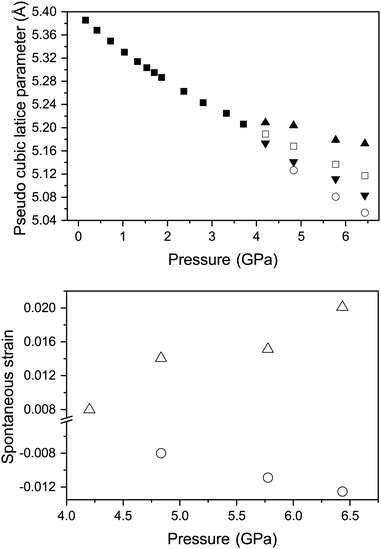
For the determination of tetragonal strain (etz) in the tetragonal high pressure phase it is possible to use the equations described previously. However a0, can be obtained by extrapolation of the cubic-phase EoS. Fig. 8 shows the variation in etz and apc with pressure for the tetragonal phase.
The structure of a rhombohedral symmetry perovskite with the R![[3 with combining macron]](https://www.rsc.org/images/entities/char_0033_0304.gif) c space group, has the atoms sited on Wyckoff positions: Cs 2a, Ca 2b, Cl 6e
c space group, has the atoms sited on Wyckoff positions: Cs 2a, Ca 2b, Cl 6e  . Here, w is the displacement of the Cl atom from the ideal cubic position and gives rise to tilting of the octahedra about the rhombohedral [111] axis. A value of w = 0 is the idealised cubic structure.36 The magnitude of the octahedral tilt in the rhombohedral phase (ω) is given by
  .37 In the rhombohedral phase, the error in lattice parameter determination makes meaningful interpretation of the strains difficult, and hence only the strain tensors e11, e22 and e33 have been calculated. As described by Carpenter et al.38 the definition is valid for the strain as the determined values of the pseudo-cubic cell angle
  is less then 90.5° and hence, can be defined as:
 | (3) |
 . The variation of apc and that of e11 with pressure is shown in Fig. 8. This shows that in both phases, the strains are deviating away from zero, and are becoming more strained/distorted with increasing pressure, however the magnitude of the strain is small.
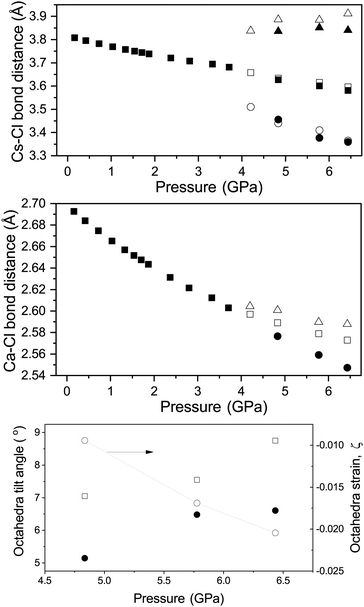
Fig. 9 shows the variation in the Cs–Cl and Ca–Cl bond lengths in all three phases with increasing pressure. In the cubic phase both the Cs–Cl and Ca–Cl bond lengths are decreasing as per the decrease in unit-cell dimensions. In both the tetragonal and rhombohedral phase the Ca–Cl bonds are decreasing overall in length with increasing pressure. In the tetragonal phase it is clear that the octahedra are becoming more distorted as the two distinct Ca–Cl bonds deviate from each other in length with increasing pressure. The same behaviour is seen for the behaviour of the bonds forming the CsCln polyhedra in both phases with increasing pressure. The variation of ω and ϕ for the rhombohedral and tetragonal phases respectively with increasing pressure at 290 K are also shown in Fig. 9. In both the tetragonal and rhombohedral phases the magnitude of octahedra tilt is increasing with increasing pressure. In the rhombohedral phase the octahedra are undistorted, however can homogeneously flatten or elongate along their triad axis of the octahedra and has been previously described by the factor ζ (the octahedral strain, defined following Megaw in the ESI†). The variation of ζ of the CaCl6 octahedra for the rhombohedral phase is shown in Fig. 9 and shows that the octahedra strain increase in value with increasing pressure.
It has been shown that the relative compressibilities of the polyhedral cation sites in the perovskite structure give an indication as to how the octahedra rotate upon compression, either by increase in rotation, tending towards lower symmetry, or a reduction in rotation and an increase in symmetry. A model based upon the bond valence concept for each polyhedra has been developed that predicts the compressibility of the polyhedra.39 The value Mi is the total estimated variation of bond valence in a polyhedral site due to the change of average bond distance.40 The relative values of the values of Mi for the two polyhedra predicts the behaviour upon compression (see ESI†). For CsCaCl3 based upon our current data and reference values elsewhere41 we derive a MCs/MCa ratio of ∼0.4 and predict that the CsCl12 polyhedra will be more compressible than the CaCl6 octahedra and as a result the structure will become more distorted with increasing pressure as is observed experimentally in the current study. The value of the ratio is significantly lower than that observed for oxide perovskites but may well reflect the difference in compressibilties of the oxide and halide polyhedra. Such a low value of the Mi ratio has also been observed for other 1+![[thin space (1/6-em)]](https://www.rsc.org/images/entities/char_2009.gif) :
:![[thin space (1/6-em)]](https://www.rsc.org/images/entities/char_2009.gif) 2+ halide based materials such as KCaF3MK/MCa ratio of ∼0.5 which predicts the structural deformation of KCaF3 should increase with pressure which is also observed experimentally.42
2+ halide based materials such as KCaF3MK/MCa ratio of ∼0.5 which predicts the structural deformation of KCaF3 should increase with pressure which is also observed experimentally.42
3.4 Towards a phase diagram of CsCaCl3
Compression of CsCaCl3 was also performed at 190 K, which permits the determination of tentative phase boundaries for the cubic → tetragonal → rhombohedral phases. Linear extrapolation of the phase boundaries using the two data points for the tetragonal–rhombohedral phase transition suggest that at ambient pressure the rhombohedral phase will not be observed, even as low as 0 K (where the phase boundary tetragonal to rhombohedral phase is expected to occur at ∼0.75 GPa) and the Clapeyron slope for the phase boundary is estimated from the two known points as 13 MPa K−1. The phase boundary of the cubic-tetragonal phase appears to be linear from the three data points (one at ambient pressure and two above) and a Clapeyron slope is estimated to have a value of 22 MPa K−1.4 Conclusion
We have measured by neutron powder diffraction, and heat capacity measurement, the phase behaviour of the perovskite-like material CsCaCl3 as as function of temperature and pressure. Like oxide-based equivalent materials it undergoes a series of phase transitions which show a stepwise change in symmetry. We have derived the bulk modulus at room temperature of the cubic phase and have also determined a tentative phase diagram for the material along with some fundamental thermodynamic properties.Conflicts of interest
The authors declare no conflicts of interest.Acknowledgements
The authors acknowledge the UK's Science and Technology Facilities Council (STFC) for access to the PEARL instrument, and for funding this research.43 We also acknowledge Kevin Knight for the useful discussions.Notes and references
- J. Fernández, M. Tello and M. Arriandiaga, Mater. Res. Bull., 1978, 13, 477–490 CrossRef.
- V. M. Goldschmidt, Naturwissenschaften, 1926, 14, 477–485 CrossRef CAS.
- W. Travis, E. N. K. Glover, H. Bronstein, D. O. Scanlon and R. G. Palgrave, Chem. Sci., 2016, 7, 4548–4556 RSC.
- K. S. Alexandrov, B. V. Besnosikov and L. A. Posdnjakova, Ferroelectrics, 1976, 12, 197–198 CrossRef CAS.
- Y. Fujii, S. Hoshino, Y. Yamada and G. Shirane, Phys. Rev. B: Condens. Matter Mater. Phys., 1974, 9, 4549–4559 CrossRef CAS.
- Y. Shi, Y. Zhou, Z. Ma, G. Xiao, K. Wang and B. Zou, J. Mater. Chem. C, 2020, 8, 12755–12767 RSC.
- F. Aguado, F. Rodriguez1 and A. R. Lennie, J. Alloys Compd., 2012, 541, 210–214 CrossRef.
- L. Zhang, L. Wang, K. Wang and B. Zou, J. Phys. Chem. C, 2018, 122, 15220–15225 CrossRef CAS.
- Y. Vaills, J. Buzaré, A. Gibaud and C. Launay, Solid State Commun., 1986, 60, 139–141 CrossRef CAS.
- M. Tyagi, M. Zhuravleva and C. L. Melcher, J. Appl. Phys., 2013, 113, 203504 CrossRef.
- C. L. Melcher, Nucl. Instrum. Methods Phys. Res. A, 2005, 537, 6–14 CrossRef CAS.
- N. Yedukondalu, K. R. Babu, D. J. Bheemalingam, C. Singh, G. Vaitheeswaran and V. Kanchana, Phys. Rev. B: Condens. Matter Mater. Phys., 2011, 83, 165117 CrossRef.
- S. Zou, Y. Liu, J. Li, C. Liu, R. Feng, F. Jiang, Y. Li, J. Song, H. Zeng and M. Hong, J. Am. Chem. Soc., 2017, 139, 11443 CrossRef CAS PubMed.
- E.-P. Yao, Z. Yang, L. Meng, P. Sun, S. Dong, Y. Yang and Y. Yang, Adv. Mater., 2017, 29, 1606859 CrossRef PubMed.
- L. Lv, Y. Xu, H. Fang, W. Luo, F. Xu, L. Liu, B. Wang, X. Zhang, D. Yang and W. Hu, Nanoscale, 2016, 8, 13589 RSC.
- Q. Wang, X. Zhang, Z. Jin, J. Zhang, Z. Gao, Y. Li and S. F. Liu, ACS Energy Lett., 2017, 2, 1479 CrossRef CAS.
- C. L. Bull, N. P. Funnell, M. G. Tucker, S. Hull, D. J. Francis and W. G. Marshall, High Press. Res., 2016, 36, 493–511 CrossRef.
- A. D. Fortes, RAL Technical Reports, 2019, RAL-TR-2019-002, year.
- S. Klotz, J. C. Chervin, P. Munsch and G. L. Marchand, J. Phys. D: Appl. Phys., 2009, 42, 075413 CrossRef.
- J. M. Besson, R. J. Nelmes, G. Hamel, J. S. Loveday, G. Weill and S. Hull, Phys. B, 1992, 180, 907–910 CrossRef.
- O. Arnold, J. C. Bilheux, J. M. Borreguero, A. Buts, S. I. Campbell, L. Chapon, M. Doucet, N. Draper, R. Ferraz Leal, M. A. Gigg, V. E. Lynch, A. Markvardsen, D. J. Mikkelson, R. L. Mikkelson, R. Miller, K. Palmen, P. Parker, G. Passos, T. G. Perring, P. F. Peterson, S. Ren, M. A. Reuter, A. T. Savici, J. W. Taylor, R. J. Taylor, R. Tolchenov, W. Zhou and J. Zikovsky, Nucl. Instrum. Meth. A, 2014, 764, 156–166 CrossRef CAS.
- B. H. Toby, J. Appl. Crystallogr., 2001, 34, 210–213 CrossRef CAS.
- M. J. Cliffe and A. L. Goodwin, J. Appl. Crystallogr., 2012, 45, 1321–1329 CrossRef CAS.
- A. M. Glazer, Acta Crystallogr., Sect. B: Struct. Sci., 1972, 28, 3384–3392 CrossRef CAS.
- K. S. Knight, W. G. Marshall and P. M. Hawkins, Phys. Chem. Miner., 2014, 41, 461–472 CrossRef CAS.
- K. S. Knight, J. Solid State Chem., 2018, 263, 172–181 CrossRef CAS.
- K. S. Knight, J. Mater. Sci., 2020, 55, 6417–6428 CrossRef CAS.
- D. C. Wallace and H. Callen, Am. J. Phys., 1972, 40, 1718–1719 CrossRef.
- K. Knight, J. Mater. Sci., 2020, 55, 6417–6428 CrossRef CAS.
- Z. Liu, Y. Pan, X. Fu, Y. Ding and L. Li, J. Mater. Chem. C, 2024 10.1039/D3TC04189A.
- M. A. Rahman, F. Mostari, M. Z. Hasan, A. Irfan, M. F. Rahman, M. J. Hosain, S. C. Mouna, I. A. Chowdhury, M. Rasheduzzaman and M. Choudhury, Phys. B, 2023, 669, 415260 CrossRef CAS.
- G. J. Fischer, Z. Wang and S.-I. Karato, Phys. Chem. Miner., 1993, 20, 97 CrossRef CAS.
- A. Verma and A. Kumar, J. Alloys Compd., 2012, 541, 210–214 CrossRef CAS.
- M. Lal and S. Kapila, Int. J. Mater. Sci., 2017, 12, 137–147 Search PubMed.
- V. Monteseguro, D. Errandonea, S. N. Achary, J. A. Sans, F. J. Manjón, S. Gallego-Parra and C. Popescu, Inorg. Chem., 2019, 58, 10665–10670 CrossRef CAS PubMed.
- C. L. Bull and K. S. Knight, Solid State Sci., 2016, 57, 38–43 CrossRef CAS.
- H. D. Megaw and C. N. W. Darlington, Acta Crystallogr., Sect. A: Found. Crystallogr., 1975, 31, 161–173 CrossRef.
- M. A. Carpenter, E. K. Salje and A. Graeme-Barber, Eur. J. Mineral., 1998, 10, 621–691 CrossRef CAS.
- J. Zhao, N. L. Ross and R. J. Angel, Acta Crystallogr., Sect. B: Struct. Sci., 2004, 60, 263–271 CrossRef CAS PubMed.
- I. D. Brown and D. Altermatt, Acta Crystallogr., Sect. B: Struct. Sci., 1985, 41, 244–247 CrossRef.
- N. E. Brese and M. O'Keeffe, Acta Crystallogr., Sect. B: Struct. Sci., 1991, 47, 192–197 CrossRef.
- K. S. Knight, J. Alloys Compd., 2017, 693, 1305–1314 CrossRef CAS.
- C. L. Bull, C. J. Ridley and N. P. Funnell, Compression Behaviour of Tetragonal CsCaCl3, STFC ISIS Neutron and Muon Source, 2020, vol. 14, DOI:10.5286/ISIS.E.RB2010752.
Footnotes |
| † Electronic supplementary information (ESI) available. See DOI: https://doi.org/10.1039/d4tc00592a |
| ‡ Present address: Joseph Banks Laboratories, School of Chemistry, University of Lincoln, Lincoln LN6 7DL, UK. |
§ This follows the assumption that the sample is still under hydrostatic pressure conditions, as evidenced by the fact that the other reflections in the pattern remain sharp, while the absolute pressure remains below the hydrostatic limit for methanol:ethanol (4![[thin space (1/6-em)]](https://www.rsc.org/images/entities/char_2009.gif) : :![[thin space (1/6-em)]](https://www.rsc.org/images/entities/char_2009.gif) 1 by volume). 1 by volume). |
| This journal is © The Royal Society of Chemistry 2024 |

