Simultaneous recognition of dopamine and uric acid in real samples through highly sensitive new electrode fabricated using ZnO/carbon quantum dots: bio-imaging and theoretical studies†
Eduardo D.
Tecuapa-Flores
 b,
Cristian B.
Palacios-Cabrera
 a,
Alan J.
Santiago-Cuevas
 a,
José G.
Hernández
 c,
Jayanthi
Narayanan
 b and
Pandiyan
Thangarasu
 *a
*a
aFacultad de Química, Universidad Nacional Autónoma de México, Ciudad Universitaria, Coyoacán 04510, México D. F., México. E-mail: pandiyan@unam.mx
bDivisión de Ingeniería en Nanotecnología, Universidad Politécnica del Valle de México, Av. Mexiquense s/n esquina Av. Universidad Politécnica, Tultitlán, Estado de México CP 54910, México
cCentro Tecnológico, Facultad de Estudios Superiores (FES-Aragón), Universidad Nacional Autónoma de México (UNAM), Estado de México, CP 57130, México
First published on 2nd November 2023
Abstract
Dopamine (DA) and uric acid (UA), which are vital components in human metabolism, cause several health problems if they are present in altered concentrations; thus, the determination of DA and UA is essential in real samples using selective sensors. In the present study, graphite carbon paste electrodes (CPE) were fabricated using ZnO/carbon quantum dots (ZnO/CQDs) and employed as electrochemical sensors for the detection of DA and UA. These electrodes were fully characterized via different analytical techniques (XRD, SEM, TEM, XPS, and EDS). The electrochemical responses from the modified electrodes were evaluated using cyclic voltammetry, square wave voltammetry, and electrochemical impedance spectroscopy. The results showed that the present electrode has exhibited high sensitivity towards DA, recognizing even at low concentrations (0.12 μM), and no inference was observed in the presence of UA. The ZnO/CQD electrode was applied for the simultaneous detection of co-existing DA and UA in real human urine samples and the peak potential separation between DA and UA was found to be greatly associated with the synergistic effect originated from ZnO and CQDs. The limit of detection (LOD) of the electrode was analyzed, and compared with other commercially available electrodes. Thus, the ZnO/CQD electrode was used to detect DA and UA in real samples, such as Saccharomyces cerevisiae cells.
Introduction
Dopamine (DA) is an essential neurotransmitter in the catecholamine family1,2 and plays a key role in the control/modulation of biological functions.3,4 An imbalance of the DA level in human brains can cause depression and neuro-associated diseases, such as Alzheimer's and Parkinson's disease and schizophrenia.5–7 Uric acid (UA) is an end product of purine metabolism, and also a marker for the clinical diagnosis of cardiovascular, neurological, hypertension, and renal insufficiency diseases.8 Generally, DA and UA are coexistent in the blood, and their rapid recognition is challenging in modern analytical chemistry.9 Thus, the development of new techniques for the determination of the concentration of these analytes is vital, especially for their cost-effective measurement.2,10 In this context, different analytical methods have been applied to improve the simplicity and sensitivity for the detection of DA and UA. For instance, fluorescence spectrometry,11 capillary electrophoresis,12 high-performance liquid chromatography (HPLC),13,14 and chemiluminescence15 are being employed for the recognition of DA and UA. However, the use of these methods is associated with some difficulties, in particular, their high cost, portability problems, consumption of excess solvent, and complicated sample preparation. In this context, owing to the redox activity of DA and UA, some electrochemical techniques have been reported for their detection.16 Recently, electrochemical methods have attracted an attention due to their rapid, reliable, simple, and sensitive nature, which are directly related to the interaction of working electrode with the analyte.17,18 Nevertheless, the electrochemical quantification of analytes by traditional electrodes encounters some issues (electrode fouling upon oxidation and interference from other analytes given that the oxidation potentials of different analytes overlap), resulting in poor selectivity and reproducibility.19 Thus, it is necessary to obtain reliable electrodes, which depends on the type of material employed for their fabrication. Nanomaterials have been demonstrated possessing novel properties (unique electronic, optical, chemical, magnetic, and mechanical) because of the quantum mechanical confinement effect. Consequently, the use of these materials in the fabrication of new electrodes can improve the electrochemical signals, namely, carbon nanotubes, graphene, metal oxides, and metal nanoparticles, which are extremely attractive in electrochemical applications compared to conventional materials.20 This is because nanostructured materials possess a large active surface area, high porosity, high porous volume, and high texture, which can enhance the overall mass transport rate and electron transfer as compared to bulk material-based electrodes.21Thus, carbon nanotubes (CNTs),22 carbon quantum dots,23 metal oxides,24 graphene25 and carbon nanofibers26 have been employed to modify bare electrodes to achieve greater sensitivity towards DA and UA. So, the modified electrodes have possessed good electrical conductivity, large surface area, good catalytic activity, and biocompatibility.27–29 In particular, the modification of the surface of electrodes using carbon quantum dots (CQDs) has increased the electrode selectiveness and sensitiveness.23,30 CQDs exhibit good photoluminescence, low toxicity, and good stability.31 Carbons originating from graphite contains predominantly sp2 and sp3 carbon masses.32 For instance, CQDs were used to modify a glassy carbon electrode to accelerate the electron transfer/redox reactions, and subsequently used to determine letrozole33 and WP6-N-CQD was used to detect trinitrotoluene.34 The coating of poly(alizarin yellow R)/CQDs on a glassy carbon electrode helped to recognize L-cysteine efficiently35 and CQDs/GCE simultaneously detected metanil yellow and curcumin.36 Similarly, reduced graphene oxide (r-GO) and CQD composite films were used to electrochemically determine dopamine.37
It has been shown that composites of metal oxide NPs and carbon nanomaterials have high sensitivity towards DA and UA.38 Thus, the catalytic and hetero nature of metal oxides have decreased the overpotential of some electrochemical reactions and beneficial for electrochemical redox reversibility rather than an irreversible process.39–41 The high conductivity, catalytic activity and biocompatibility of metal oxide NPs are supportive for electrochemical processes when they are composited with carbon nanomaterials.42–45 The use of carbon paste electrodes (CPE) in the electrochemical measurement of organic species (pharmaceutical and biomolecules) has been reported.38,46 These electrodes are highly suitable for the detection of biomolecules through redox reactions. Recently, nanocomposites of carbon and metal oxides have been applied as photocatalysts and electrochemical sensors,47 showing a great synergistic effect and improved the stability of metal oxides.48 ZnO NPs possess good catalytic/photoelectric properties, and can be used for the modification of electrodes, in particular, the combination of ZnO and CQDs can increase the conductivity, porosity and active surface area of the composites, and as a result, it can enhance the sensitivity of electrochemical systems. The presence of CQDs in the composite can improve the conductivity of the sample.49 Thus, herein, a carbon paste electrode was modified using ZnO and CQDs to enhance the electrocatalytic properties of the electrode (CPE/ZnO/CQD), and then applied to detect DA and UA in urine samples. The modified electrode can also be applied in the manufacture of screen-printed electrodes (SPEs). The incorporation of carbon materials in electrocatalytic ink improves its physical chemical and electrochemical properties.50 Consequently, CPE with ZnO/CQDs can function as an ink, improving the electrocatalytic behaviors of SPEs, and as a wearable sensor.
Results and discussion
X-Ray diffraction (XRD) analysis
All the samples were analyzed in the 2θ range of 20°–80° by XRD using Cu Kα radiation (Fig. 1 and Table S1†), and the collected data were compared with that reported in the Joint Committee on Powder Diffraction Standards (JCPDS). The low-intensity peaks appeared for CQDs correspond to the (002) and (101) crystal planes (Fig. S1a†), which are consistent with the reported study.51 The typical XRD pattern was obtained for ZnO NPs (Fig. 1a) at 2θ = 31.75° (100), 34.44° (002), 36.26° (101), 47.57° (102), 56.55° (110), 62.84° (103), 66.30° (200), 67.92° (112), 69° (201), 72.45° (004) and 77.04° (202), which were assigned to the hexagonal crystalline phase (space group P63mc), corresponding to JCPDS 36-1451. In the case of the ZnO/CQDs, there was a slight shift in the signals to higher angles (in particular, the signal for the (101) plane), confirming the integration of CQDs in the ZnO matrix; however, the integration of CQDs with ZnO did not affect the crystal structure of the metal oxide due to the low content of CQDs. The absence of the characteristic peak at 2θ = 24° of CQDs confirmed their presence at a low concentration in the mixture, given that their diffraction intensity was relatively lower than that of ZnO. The approximate crystal size of each sample was calculated to be 26.045 nm for ZnO and 26.196 nm for ZnO/CQDs using the Scherrer equation (eqn (1)), as follows: | (1) |
Similarly, the XRD peaks for the carbon paste or modified electrode (Fig. S1b†) appeared at 2θ as 26.426° (002) and 54.512° (004), matching to the graphite reported in JCPDS 00-008-0415. The crystal lattice parameters (a and c) for the graphite (C) are a = 2.4481 Å and c = 6.7225 Å, suggesting that graphite presented in a hexagonal crystal structure with P63/mc space group. In particular, for CPE/ZnO/CQDs (9![[thin space (1/6-em)]](https://www.rsc.org/images/entities/char_2009.gif) :
:![[thin space (1/6-em)]](https://www.rsc.org/images/entities/char_2009.gif) 1), the peaks corresponding to ZnO in graphite were not clearly observed due to the low impregnation of the metal oxide NPs in the graphite, while for CPE/ZnO/CQDs (8
1), the peaks corresponding to ZnO in graphite were not clearly observed due to the low impregnation of the metal oxide NPs in the graphite, while for CPE/ZnO/CQDs (8![[thin space (1/6-em)]](https://www.rsc.org/images/entities/char_2009.gif) :
:![[thin space (1/6-em)]](https://www.rsc.org/images/entities/char_2009.gif) 2), the characteristic peaks originating from ZnO were detected at 2θ = 31.77° (100), 34.422° (002), 36.253° (101), 47.539° (102), 56.603° (110), 62.864° (103), and 67.92° (112), and the space group of the system was P63/mc, establishing the existence of metal oxide nanoparticles in the sample (Fig. 1b).
2), the characteristic peaks originating from ZnO were detected at 2θ = 31.77° (100), 34.422° (002), 36.253° (101), 47.539° (102), 56.603° (110), 62.864° (103), and 67.92° (112), and the space group of the system was P63/mc, establishing the existence of metal oxide nanoparticles in the sample (Fig. 1b).
SEM and TEM analyses
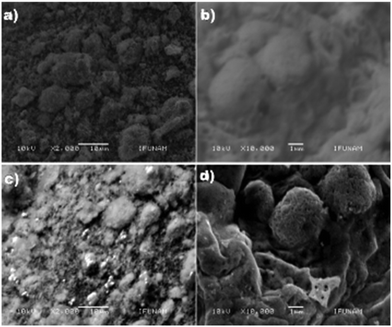
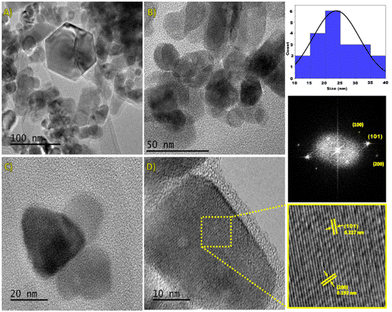
The morphological characteristics of the electrode samples were analyzed by SEM (Fig. 2). The results show that the CQDs (size, 5 ± 1 nm) were uniformly distributed on the surface of ZnO NPs (size: 60 to 100 nm, Fig. 2b), and it seems that ZnO NPs are agglomerated (Fig. 2c). The elemental composition of the samples, which was determined by EDS (energy dispersive X-ray spectroscopy) employing 15 spots on a grid, reveals the presence of Zn, C and O atoms and the values are nearly close to the expected data. The average value was obtained from 15 spots (Table S2†). In the case of ZnO/CQDs, the elemental composition corresponding to ZnO has indicated that the CQDs were deposited on the surface of metal oxide.TEM images were recorded and analyzed, revealing that the ZnO NPs were predominantly in spherical nature with hexagonal shape. It appears that the heterogeneous particles are agglomerated (Fig. 3). The size of the particles was in the range of 10 nm to 40 nm, resulting in an average size of 24 nm, consistent with the histogram (Fig. 3b). The spherical morphology of ZnO NPs, which were uniformly distributed, is consistent with the crystals in the solid state, agreeing with the crystal structure of ZnO.
Furthermore, the HRTEM image revealed the presence of a well-defined crystal structure (Fig. 3c), especially, the high-contrast region corresponding to the (100), (101), and (200) crystal planes of the hexagonal ZnO structure. Moreover, there is an orderly arrangement of atoms in the crystal planes, indicating a high-quality crystalline structure. In addition, the measured interplanar distances for (101) and (200) planes were 0.227 nm and 0.192 nm, respectively, corresponding to hexagonal ZnO (JCPDS 36-1451), and these results are in agreement with the XRD analyses.
TGA and XPS analyses
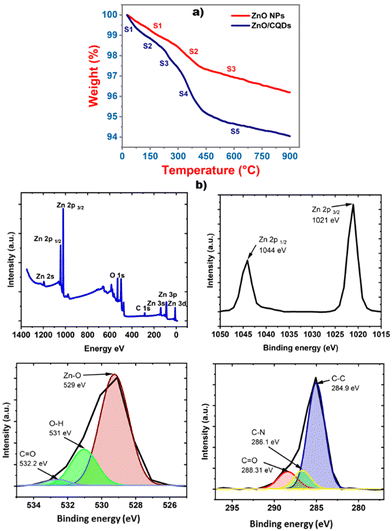
The stability of the samples was analyzed using a TGA analyzer, which was connected to a computer, and the change in the mass with respect to the temperature was monitored (Fig. 4a). The first weight loss was occurred at around 100 °C, which is mainly assigned to the desorption of water. In the case of ZnO, two slopes were observed, which may be due to the decomposition of the carboxy groups of the ZnO precursor, and no significant changes were observed after 430 °C. In the case of ZnO/CQDs, a drastic weight loss was observed compared to that for ZnO, and at 200 °C, the greatest weight loss was observed, indicating the decomposition of the CQDs. The weight loss at 440 °C has indicated the decomposing nature of residual carbon in the sample.XPS studies were performed for the samples at 10−9 Torr after degassing in a chamber at a pressure of 10−6 Torr. A complete scan was registered, covering the full binding energy range of 0 to 1400 eV, and the oxidation state of the elements analyzed (Fig. 4b). In the XPS, the characteristic signals for Zn 2p 1/2 and Zn 2p 3/2 were observed at the binding energies of 1044 and 1021 eV, respectively, showing that the Zn atom was present in the +2 oxidation state. Furthermore, the appearance of Zn–O bonding at 529 eV was assigned to the O2− ions in the Zn–O bonding of the wurtzite structure of ZnO. Similarly, the deconvolution of the spectra resulted in the appearance of the O–H peak at 531 eV, which is related to the OH group absorbed on the surface of the ZnO NPs and the peak at 532.2 eV can be ascribed to the presence of C![[double bond, length as m-dash]](https://www.rsc.org/images/entities/char_e001.gif) O bonding originating from the surface-adsorbed CQDs.52 Finally, the peak corresponding to carbon appearing at 284.9 eV (Fig. 3e) and for C–N at 286.1 eV, together with C
O bonding originating from the surface-adsorbed CQDs.52 Finally, the peak corresponding to carbon appearing at 284.9 eV (Fig. 3e) and for C–N at 286.1 eV, together with C![[double bond, length as m-dash]](https://www.rsc.org/images/entities/char_e001.gif) O at 288.31 eV, are attributed to CQDs in the ZnO crystal lattice. These results prove the presence of CQDs on the surface of ZnO, forming the ZnO/CQDs nanocomposite.
O at 288.31 eV, are attributed to CQDs in the ZnO crystal lattice. These results prove the presence of CQDs on the surface of ZnO, forming the ZnO/CQDs nanocomposite.
Electrochemical studies
The electrochemical characterization of all the electrodes was carried out using the CV and SWV techniques, specifically, the efficiency of the electrodes relating to the anodic currents generated from the CPE or modified CPE including CPE/CQDs, CPE/ZnO NPs, CPE/ZnO/CQDs (9![[thin space (1/6-em)]](https://www.rsc.org/images/entities/char_2009.gif) :
:![[thin space (1/6-em)]](https://www.rsc.org/images/entities/char_2009.gif) 1) or CPE/ZnO/CQDs (8
1) or CPE/ZnO/CQDs (8![[thin space (1/6-em)]](https://www.rsc.org/images/entities/char_2009.gif) :
:![[thin space (1/6-em)]](https://www.rsc.org/images/entities/char_2009.gif) 2) employed as the working electrode. K4[Fe(CN)6] (5.0 mM) was used as substrate and studied in the potential range of −0.3 to 0.7 V in the electrolyte Britton-Robinson (B-R) solution (pH 7.0, 0.04 M). The electrochemical currents (I) were measured with respect to the applied potential (E) at different sweep rates (30, 40, 50, 60, 70, 80, 90, 100, 110, 120, and 130 mV s−1). The electrodes have produced reversible voltammograms due to the fast electron transfer kinetics, and the plotted data agree with anodic or cathodic currents against the square root of the sweeping velocity (Fig. S2a–e†), which were fitted with the Randles–Sevcik equation (see eqn (2)), at the scan rate of 100 mV s−1). The slope of the plot is equal to the surface area of the working electrodes including CPE, CPE/CQDs, CPE/ZnO NPs, CPE/ZnO/CQDs (9
2) employed as the working electrode. K4[Fe(CN)6] (5.0 mM) was used as substrate and studied in the potential range of −0.3 to 0.7 V in the electrolyte Britton-Robinson (B-R) solution (pH 7.0, 0.04 M). The electrochemical currents (I) were measured with respect to the applied potential (E) at different sweep rates (30, 40, 50, 60, 70, 80, 90, 100, 110, 120, and 130 mV s−1). The electrodes have produced reversible voltammograms due to the fast electron transfer kinetics, and the plotted data agree with anodic or cathodic currents against the square root of the sweeping velocity (Fig. S2a–e†), which were fitted with the Randles–Sevcik equation (see eqn (2)), at the scan rate of 100 mV s−1). The slope of the plot is equal to the surface area of the working electrodes including CPE, CPE/CQDs, CPE/ZnO NPs, CPE/ZnO/CQDs (9![[thin space (1/6-em)]](https://www.rsc.org/images/entities/char_2009.gif) :
:![[thin space (1/6-em)]](https://www.rsc.org/images/entities/char_2009.gif) 1) and CPE/ZnO/CQDs (8
1) and CPE/ZnO/CQDs (8![[thin space (1/6-em)]](https://www.rsc.org/images/entities/char_2009.gif) :
:![[thin space (1/6-em)]](https://www.rsc.org/images/entities/char_2009.gif) 2) (Table 1).
2) (Table 1).
| CPE | CPE/ZnO/CQDs (9![[thin space (1/6-em)]](https://www.rsc.org/images/entities/char_2009.gif) : :![[thin space (1/6-em)]](https://www.rsc.org/images/entities/char_2009.gif) 1) 1) |
CPE/ZnO/CQDs (8![[thin space (1/6-em)]](https://www.rsc.org/images/entities/char_2009.gif) : :![[thin space (1/6-em)]](https://www.rsc.org/images/entities/char_2009.gif) 2) 2) |
|
|---|---|---|---|
| E pa | 0.51 | 0.44 | 0.40 |
| E pc | −0.07 | −0.04 | 0.03 |
| ΔEp | 0.57 | 0.48 | 0.37 |
| E 1/2 | 0.29 | 0.24 | 0.175 |
| R CT (Ω) | 741 | 279 | 165 |
| Γ (nM cm2) | 2.65 | 2.50 | 2.21 |
| k app (cm s−1) | 1.02 × 10⁻³ | 2.69 × 10⁻³ | 4.55 × 10⁻³ |
| Area (cm2) | 9.70 × 10⁻² | 5.66 × 10⁻² | 7.05 × 10⁻² |
The effective surface area (cm2) of the electrode was calculated using the Randles–Sevcik equation, resulting to 9.70 × 10⁻² for CPE; 5.66 × 10⁻² for CPE/ZnO/CQDs (9![[thin space (1/6-em)]](https://www.rsc.org/images/entities/char_2009.gif) :
:![[thin space (1/6-em)]](https://www.rsc.org/images/entities/char_2009.gif) 1); and 7.05 × 10⁻² for CPE/ZnO/CQDs (8
1); and 7.05 × 10⁻² for CPE/ZnO/CQDs (8![[thin space (1/6-em)]](https://www.rsc.org/images/entities/char_2009.gif) :
:![[thin space (1/6-em)]](https://www.rsc.org/images/entities/char_2009.gif) 2) after considering the diffusion coefficient of (D) = 3.09 × 10⁻⁶ cm2 s−1 for a one-electron transfer process for K4[Fe(CN)6] (5.0 mM).
2) after considering the diffusion coefficient of (D) = 3.09 × 10⁻⁶ cm2 s−1 for a one-electron transfer process for K4[Fe(CN)6] (5.0 mM).
| Ip = (2.69 × 10⁵)n1.5AC0D00.5v0.5 | (2) |
The electrochemical data for the samples show that among the samples, the charge transfer resistence (Rct) value was the lowest for CPE/ZnO/CQDs (8![[thin space (1/6-em)]](https://www.rsc.org/images/entities/char_2009.gif) :
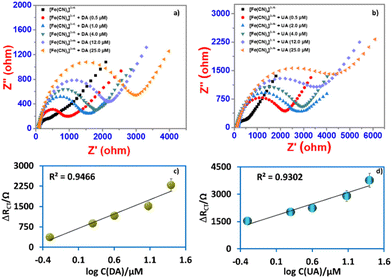
:![[thin space (1/6-em)]](https://www.rsc.org/images/entities/char_2009.gif) 2) (Fig. 5a, Table 1 and Table S8†), showing that the transfer of electrons was the greatest because of the synergistic nature of the sample. In the case of CPE/CQDs, although a noticeable redox peak was seen as compared to the other samples, this peak was not fully defined because of its high capacitive charge, resulting to a low electron transfer.
2) (Fig. 5a, Table 1 and Table S8†), showing that the transfer of electrons was the greatest because of the synergistic nature of the sample. In the case of CPE/CQDs, although a noticeable redox peak was seen as compared to the other samples, this peak was not fully defined because of its high capacitive charge, resulting to a low electron transfer.
In the CPE/ZnO/CQD (8![[thin space (1/6-em)]](https://www.rsc.org/images/entities/char_2009.gif) :
:![[thin space (1/6-em)]](https://www.rsc.org/images/entities/char_2009.gif) 2) electrode, a synergistic effect was expected because of the improved crystalline properties by mixing of ZnO/CQDs with CPE, and as a result, the electrochemical potential window has been increased significantly, enhancing the electro-sensitivity. This means that the increase of the electrical conductivity and porosity of CPE/ZnO/CQDs (8
2) electrode, a synergistic effect was expected because of the improved crystalline properties by mixing of ZnO/CQDs with CPE, and as a result, the electrochemical potential window has been increased significantly, enhancing the electro-sensitivity. This means that the increase of the electrical conductivity and porosity of CPE/ZnO/CQDs (8![[thin space (1/6-em)]](https://www.rsc.org/images/entities/char_2009.gif) :
:![[thin space (1/6-em)]](https://www.rsc.org/images/entities/char_2009.gif) 2) has improved the formation of the redox couple decisively, observing relatively high cathodic and anodic currents for the one-electron process (Fig. 5a). For example, for [Fe(CN)6]3−/4− (5.0 mM), an increase of the current, and amplified potential window were observed for CPE/ZnO/CQDs (8
2) has improved the formation of the redox couple decisively, observing relatively high cathodic and anodic currents for the one-electron process (Fig. 5a). For example, for [Fe(CN)6]3−/4− (5.0 mM), an increase of the current, and amplified potential window were observed for CPE/ZnO/CQDs (8![[thin space (1/6-em)]](https://www.rsc.org/images/entities/char_2009.gif) :
:![[thin space (1/6-em)]](https://www.rsc.org/images/entities/char_2009.gif) 2) (Fig. S2a–c†) as compared to the CPE, resulting in good reversibility for ZnO/CQDs (Table 1). Specifically, ΔEp = 0.37 V, Epa = 0.40 V, and Epc = 0.030 V at 25 °C, which are very close to the ideal value of 0.059 V. This suggests that this system follows the Nernst equation concept at different scan rates (30 to 130 mV s−1) given that the peak current is proportionally equated with the square root of the scan rate, and it adopts the typical diffusion-controlled process and surface-confined redox process.53 The same behavior was observed for the other electrodes at sweep rate of 0.1 V s−1 (see insert graphs in Fig. S2a–S2e†). Comprehensibly, the electron transfer property relies strongly on the nature of the electrode surface, especially with a micro-structural composition.54 This is consistent with the data (Table 1), where obviously a higher electroactive surface area (7.05 × 10⁻² cm2) was observed for CPE/ZnO/CQDs (8
2) (Fig. S2a–c†) as compared to the CPE, resulting in good reversibility for ZnO/CQDs (Table 1). Specifically, ΔEp = 0.37 V, Epa = 0.40 V, and Epc = 0.030 V at 25 °C, which are very close to the ideal value of 0.059 V. This suggests that this system follows the Nernst equation concept at different scan rates (30 to 130 mV s−1) given that the peak current is proportionally equated with the square root of the scan rate, and it adopts the typical diffusion-controlled process and surface-confined redox process.53 The same behavior was observed for the other electrodes at sweep rate of 0.1 V s−1 (see insert graphs in Fig. S2a–S2e†). Comprehensibly, the electron transfer property relies strongly on the nature of the electrode surface, especially with a micro-structural composition.54 This is consistent with the data (Table 1), where obviously a higher electroactive surface area (7.05 × 10⁻² cm2) was observed for CPE/ZnO/CQDs (8![[thin space (1/6-em)]](https://www.rsc.org/images/entities/char_2009.gif) :
:![[thin space (1/6-em)]](https://www.rsc.org/images/entities/char_2009.gif) 2) compared to the unmodified CPE; thus, it produced a high capacitive background current, broadening the peak-to-peak potential separation (ΔEp) considerably. Thus, the density of electronic states is expected to be near the Fermi level.
2) compared to the unmodified CPE; thus, it produced a high capacitive background current, broadening the peak-to-peak potential separation (ΔEp) considerably. Thus, the density of electronic states is expected to be near the Fermi level.
The above-mentioned observation is consistent with the EIS study for the [Fe(CN)6]3−/4− (5.0 mM) redox couple in B-R buffer solution (pH 7.0, 0.04 M) (Fig. 5b). The charge equivalent to oxidation (Q) and surface concentration (Γ) were estimated to determine the efficiency of CPE/ZnO/CQDs (8![[thin space (1/6-em)]](https://www.rsc.org/images/entities/char_2009.gif) :
:![[thin space (1/6-em)]](https://www.rsc.org/images/entities/char_2009.gif) 2) as a working electrode, and also to determine the role of ZnO/CQDs in CPE. The one-electron oxidation process was assumed per monomer in the calculation, as indicated in eqn (3).
2) as a working electrode, and also to determine the role of ZnO/CQDs in CPE. The one-electron oxidation process was assumed per monomer in the calculation, as indicated in eqn (3).
 | (3) |
The average surface coverage area (Γ) was determined to be 2.65, 2.50, and 2.21 nM cm2 for CPE, CPE/ZnO/CQDs (9![[thin space (1/6-em)]](https://www.rsc.org/images/entities/char_2009.gif) :
:![[thin space (1/6-em)]](https://www.rsc.org/images/entities/char_2009.gif) 1) and CPE/ZnO/CQDs (8
1) and CPE/ZnO/CQDs (8![[thin space (1/6-em)]](https://www.rsc.org/images/entities/char_2009.gif) :
:![[thin space (1/6-em)]](https://www.rsc.org/images/entities/char_2009.gif) 2), respectively. Using the Nyquist plot, a simple Randles equivalence circuit was drawn after fitting the data in the plot, where the mass transfer effect was seen at low frequency, given that a linear relationship between Z′′ (Ohm) and Z′ (Ohm) was established. In contrast, in the high frequency region, a semicircle pattern was formed, which is attributed to the charge transfer resistance (RCT) at the electrode–solution interface; it means that a lower RCT was obtained for CPE/ZnO/CQDs (8
2), respectively. Using the Nyquist plot, a simple Randles equivalence circuit was drawn after fitting the data in the plot, where the mass transfer effect was seen at low frequency, given that a linear relationship between Z′′ (Ohm) and Z′ (Ohm) was established. In contrast, in the high frequency region, a semicircle pattern was formed, which is attributed to the charge transfer resistance (RCT) at the electrode–solution interface; it means that a lower RCT was obtained for CPE/ZnO/CQDs (8![[thin space (1/6-em)]](https://www.rsc.org/images/entities/char_2009.gif) :
:![[thin space (1/6-em)]](https://www.rsc.org/images/entities/char_2009.gif) 2) because of its catalytic nature, supporting efficient electron transfer in the electrochemical reaction (Fig. 5b). A lower RCT value (Ohms) represents a faster reaction kinetics, whereas a greater value (Ohms) suggests a slow kinetics process. Thus, our experimental data fitted the plots corresponding to the Randles equivalent circuit (insert in Fig. 5b), as there was a phase shift for the modified electrode. The electron transfer rate constant (kapp) was determined (eqn (4)) to follow the order of CPE (1.02 × 10⁻³ cm s−1) < CPE/ZnO/CQDs (9
2) because of its catalytic nature, supporting efficient electron transfer in the electrochemical reaction (Fig. 5b). A lower RCT value (Ohms) represents a faster reaction kinetics, whereas a greater value (Ohms) suggests a slow kinetics process. Thus, our experimental data fitted the plots corresponding to the Randles equivalent circuit (insert in Fig. 5b), as there was a phase shift for the modified electrode. The electron transfer rate constant (kapp) was determined (eqn (4)) to follow the order of CPE (1.02 × 10⁻³ cm s−1) < CPE/ZnO/CQDs (9![[thin space (1/6-em)]](https://www.rsc.org/images/entities/char_2009.gif) :
:![[thin space (1/6-em)]](https://www.rsc.org/images/entities/char_2009.gif) 1) (2.69 × 10⁻³ cm s−1) < CPE/ZnO/CQDs (8
1) (2.69 × 10⁻³ cm s−1) < CPE/ZnO/CQDs (8![[thin space (1/6-em)]](https://www.rsc.org/images/entities/char_2009.gif) :
:![[thin space (1/6-em)]](https://www.rsc.org/images/entities/char_2009.gif) 2) (4.55 × 10⁻³ cm s−1) (Fig. 5c). This observation is agreement with the CV studies, which showed that the presence of ZnO/CQDs has enhanced the electron transfer capabilities, resulting to a relatively lower RCT, as follows: CPE (741 Ω) > CPE/ZnO/CQDs (9
2) (4.55 × 10⁻³ cm s−1) (Fig. 5c). This observation is agreement with the CV studies, which showed that the presence of ZnO/CQDs has enhanced the electron transfer capabilities, resulting to a relatively lower RCT, as follows: CPE (741 Ω) > CPE/ZnO/CQDs (9![[thin space (1/6-em)]](https://www.rsc.org/images/entities/char_2009.gif) :
:![[thin space (1/6-em)]](https://www.rsc.org/images/entities/char_2009.gif) 1) (279 Ω) > CPE/ZnO/CQDs (8
1) (279 Ω) > CPE/ZnO/CQDs (8![[thin space (1/6-em)]](https://www.rsc.org/images/entities/char_2009.gif) :
:![[thin space (1/6-em)]](https://www.rsc.org/images/entities/char_2009.gif) 2) (165 Ω).
2) (165 Ω).
 | (4) |
The impedance data were fitted neatly with the Randles circuit, corresponding to an equivalent circuit model, where the solution resistance,33,55 capacitance (Cpe), charge transfer resistance (RCT), and Warburg impedance (W0) were circuited electrochemically. A similar equivalent circuit model was obtained for all the modified electrodes, which facilitated the electron transfer due to the improved conducting nature of the electrode.
Electrochemical detection of DA and UA
Using CPE, CPE/CQDs (8![[thin space (1/6-em)]](https://www.rsc.org/images/entities/char_2009.gif) :
:![[thin space (1/6-em)]](https://www.rsc.org/images/entities/char_2009.gif) 2), CPE/ZnO NPs (8
2), CPE/ZnO NPs (8![[thin space (1/6-em)]](https://www.rsc.org/images/entities/char_2009.gif) :
:![[thin space (1/6-em)]](https://www.rsc.org/images/entities/char_2009.gif) 2), CPE/ZnO/CQDs (9
2), CPE/ZnO/CQDs (9![[thin space (1/6-em)]](https://www.rsc.org/images/entities/char_2009.gif) :
:![[thin space (1/6-em)]](https://www.rsc.org/images/entities/char_2009.gif) 1), and CPE/ZnO/CQDs (8
1), and CPE/ZnO/CQDs (8![[thin space (1/6-em)]](https://www.rsc.org/images/entities/char_2009.gif) :
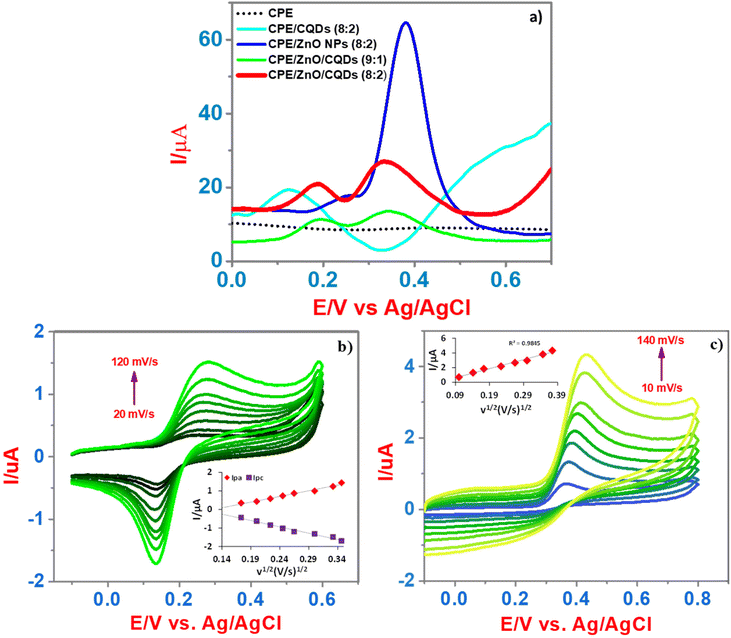
:![[thin space (1/6-em)]](https://www.rsc.org/images/entities/char_2009.gif) 2) as the working electrode, the electrochemical sensing of DA and UA (50 μM and 500 μM, respectively) was studied. In the CV, extremely, a weak oxidation peak at 0.42 V (CPE, black line) was appeared, apparently, due to the weak redox behavior of UA, while for DA, the redox peaks were not detected (Fig. S2f†). Moreover, DA or UA showed an irreversible electrode process and the CPE did not offer an appreciable current for the detection, particularly in CV and SWV at a scan rate of 50 mV s−1 and 100 mV s−1, respectively. In the case of CPE/CQDs (8
2) as the working electrode, the electrochemical sensing of DA and UA (50 μM and 500 μM, respectively) was studied. In the CV, extremely, a weak oxidation peak at 0.42 V (CPE, black line) was appeared, apparently, due to the weak redox behavior of UA, while for DA, the redox peaks were not detected (Fig. S2f†). Moreover, DA or UA showed an irreversible electrode process and the CPE did not offer an appreciable current for the detection, particularly in CV and SWV at a scan rate of 50 mV s−1 and 100 mV s−1, respectively. In the case of CPE/CQDs (8![[thin space (1/6-em)]](https://www.rsc.org/images/entities/char_2009.gif) :
:![[thin space (1/6-em)]](https://www.rsc.org/images/entities/char_2009.gif) 2) (blue light line), a slight peak was observed at 0.40 V; however, it was not well defined, which demonstrates the low affinity between the CQDs and analytes. For CPE/ZnO NPs (8
2) (blue light line), a slight peak was observed at 0.40 V; however, it was not well defined, which demonstrates the low affinity between the CQDs and analytes. For CPE/ZnO NPs (8![[thin space (1/6-em)]](https://www.rsc.org/images/entities/char_2009.gif) :
:![[thin space (1/6-em)]](https://www.rsc.org/images/entities/char_2009.gif) 2) (blue dark line), a prominent peak was detected at 0.42 V, which is attributed to UA, demonstrating the excellent sensitivity towards the detection of UA; however, a significant signal for the oxidation of DA was not detected. Certainly, for CPE/ZnO/CQDs (9
2) (blue dark line), a prominent peak was detected at 0.42 V, which is attributed to UA, demonstrating the excellent sensitivity towards the detection of UA; however, a significant signal for the oxidation of DA was not detected. Certainly, for CPE/ZnO/CQDs (9![[thin space (1/6-em)]](https://www.rsc.org/images/entities/char_2009.gif) :
:![[thin space (1/6-em)]](https://www.rsc.org/images/entities/char_2009.gif) 1) (green line) and CPE/ZnO/CQDs (8
1) (green line) and CPE/ZnO/CQDs (8![[thin space (1/6-em)]](https://www.rsc.org/images/entities/char_2009.gif) :
:![[thin space (1/6-em)]](https://www.rsc.org/images/entities/char_2009.gif) 2) (red line), the oxidation currents (Ipa) have notably increased for DA and UA compared to that observed for the unmodified CPE. This indicates that the presence of ZnO/CQDs significantly impacted the electrocatalytic activities toward the oxidation of DA and UA.
2) (red line), the oxidation currents (Ipa) have notably increased for DA and UA compared to that observed for the unmodified CPE. This indicates that the presence of ZnO/CQDs significantly impacted the electrocatalytic activities toward the oxidation of DA and UA.
The SWV analysis showed that the CPE/ZnO/CQD (8![[thin space (1/6-em)]](https://www.rsc.org/images/entities/char_2009.gif) :
:![[thin space (1/6-em)]](https://www.rsc.org/images/entities/char_2009.gif) 2) has performed better for the recognition of DA and UA than CPE/CQDs (8
2) has performed better for the recognition of DA and UA than CPE/CQDs (8![[thin space (1/6-em)]](https://www.rsc.org/images/entities/char_2009.gif) :
:![[thin space (1/6-em)]](https://www.rsc.org/images/entities/char_2009.gif) 2), CPE/ZnO NPs (8
2), CPE/ZnO NPs (8![[thin space (1/6-em)]](https://www.rsc.org/images/entities/char_2009.gif) :
:![[thin space (1/6-em)]](https://www.rsc.org/images/entities/char_2009.gif) 2) and CPE/ZnO/CQDs (9
2) and CPE/ZnO/CQDs (9![[thin space (1/6-em)]](https://www.rsc.org/images/entities/char_2009.gif) :
:![[thin space (1/6-em)]](https://www.rsc.org/images/entities/char_2009.gif) 1) (Fig. 7a), improving the electro-catalytic reaction through its effective electron transfer reaction. Notably, there was a synergetic effect from the mixture of ZnO/CQDs that presented in the CPE, which was expected to increase the crystalline nature, surface area, and conductive nature of the sample. As anticipated, the anodic current has been increased with the increasing of scan rate (20 mV s−1 to 120 mV s−1 and 10 mV s−1 to 140 mV s−1) for DA (50 μM) and UA (200 μM) (Fig. 7b and c) due to fact that there is a linear relationship between the oxidation current and scan rate, although there was a slight potential shift towards the positive side (insert in Fig. 7b and c), respectively. This suggests that the mass transfer across the electrode is highly associated with the anodic current (Ipa), which is proportional to the scan rate (ν) [Ipaversus ν1/2]. A linear regression was obtained for Ipa (μA) = 6.1448ν1/2 (V s−1)1/2 − 0.7731 with R2 = 0.9828 and Ipc (μA) = −6.8649ν1/2 (V s−1)1/2 − 0.706 with R2 = 0.9821 for DA and Ipa (μA) = 12.325ν1/2 (V s−1)1/2 − 0.4737 with R2 = 0.9845 for UA. The overall detection of DA and UA at CPE/ZnO/CQDs (8
1) (Fig. 7a), improving the electro-catalytic reaction through its effective electron transfer reaction. Notably, there was a synergetic effect from the mixture of ZnO/CQDs that presented in the CPE, which was expected to increase the crystalline nature, surface area, and conductive nature of the sample. As anticipated, the anodic current has been increased with the increasing of scan rate (20 mV s−1 to 120 mV s−1 and 10 mV s−1 to 140 mV s−1) for DA (50 μM) and UA (200 μM) (Fig. 7b and c) due to fact that there is a linear relationship between the oxidation current and scan rate, although there was a slight potential shift towards the positive side (insert in Fig. 7b and c), respectively. This suggests that the mass transfer across the electrode is highly associated with the anodic current (Ipa), which is proportional to the scan rate (ν) [Ipaversus ν1/2]. A linear regression was obtained for Ipa (μA) = 6.1448ν1/2 (V s−1)1/2 − 0.7731 with R2 = 0.9828 and Ipc (μA) = −6.8649ν1/2 (V s−1)1/2 − 0.706 with R2 = 0.9821 for DA and Ipa (μA) = 12.325ν1/2 (V s−1)1/2 − 0.4737 with R2 = 0.9845 for UA. The overall detection of DA and UA at CPE/ZnO/CQDs (8![[thin space (1/6-em)]](https://www.rsc.org/images/entities/char_2009.gif) :
:![[thin space (1/6-em)]](https://www.rsc.org/images/entities/char_2009.gif) 2) is defined as a diffusion-controlled process, obeying one-electron transfer with uniform ohmic drop because of the good electron transfer in the electrodes.
2) is defined as a diffusion-controlled process, obeying one-electron transfer with uniform ohmic drop because of the good electron transfer in the electrodes.
Optimization experiments
The SWV experimental conditions for the detection of DA and UA were optimized after considering the pulse amplitude (50 mV), pulse width (0.01 s), step height (2 mV), and scan rate (100 mV s−1). As shown in Fig. 7b, the strongest peak current with respect to the target analytes was obtained for CPE/ZnO/CQDs (8![[thin space (1/6-em)]](https://www.rsc.org/images/entities/char_2009.gif) :
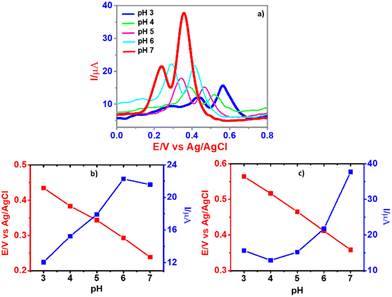
:![[thin space (1/6-em)]](https://www.rsc.org/images/entities/char_2009.gif) 2), acting as the best electrochemical sensor for DA and UA. Furthermore, the influence of pH (3.0, 4.0, 5.0, 6.0 and 7.0) was analyzed in B-R buffer solution for the detection of the substrates, i.e., DA (50 μM) and UA (500 μM), and observed an increase in the anodic current for DA and UA with the use of CPE/ZnO/CQDs (8
2), acting as the best electrochemical sensor for DA and UA. Furthermore, the influence of pH (3.0, 4.0, 5.0, 6.0 and 7.0) was analyzed in B-R buffer solution for the detection of the substrates, i.e., DA (50 μM) and UA (500 μM), and observed an increase in the anodic current for DA and UA with the use of CPE/ZnO/CQDs (8![[thin space (1/6-em)]](https://www.rsc.org/images/entities/char_2009.gif) :
:![[thin space (1/6-em)]](https://www.rsc.org/images/entities/char_2009.gif) 2) as the working electrode (Fig. 6a). In particular, there was a pH effect in the detection of the molecules; for example, when the pH of the solution was increased from 3.0 to 7.0, the recognition of UA has been enhanced significantly, increasing the anodic current to 21.6 μA for DA and 37.9 μA for UA at pH 7.0 (Fig. 6b and c), respectively. This is possibly due to the protonation of dopamine at neutral pH, facilitating electrostatic interactions between the cationic DA and CQDs.
2) as the working electrode (Fig. 6a). In particular, there was a pH effect in the detection of the molecules; for example, when the pH of the solution was increased from 3.0 to 7.0, the recognition of UA has been enhanced significantly, increasing the anodic current to 21.6 μA for DA and 37.9 μA for UA at pH 7.0 (Fig. 6b and c), respectively. This is possibly due to the protonation of dopamine at neutral pH, facilitating electrostatic interactions between the cationic DA and CQDs.
The cumulative effect of this electrostatic attraction, i.e., the π–π interaction, between DA and the graphitic core (in the CQDs) in the modified carbon paste electrode could be responsible for the outstanding performance in the current response at the pH of 7.0.56 Nevertheless, with further increase of pH, the peak potential gradually shifted to a more negative side, indicating that the protons participated in the oxidation reactions of DA and UA on the modified electrode.57
The linear equation for DA and UA was Epa(DA) = −0.0464 pH + 0.561 (R2 = 0.9992) and Epa(UA) = −0.0526 pH + 0.7191 (R2 = 0.9941). The slope was 46.4 mV per pH(DA) and 52.6 mV per pH (UA), and these values were approximately near to the theoretical value of 59 mV per pH, proving that the modified electrode assessed the electrochemical oxidation of DA and UA well, where the transfer of the same number of electrons and protons was occurred.58
Electrochemical selective detection
After determining the ideal conditions for the detection of DA and AU, a new CPE/ZnO/CQDs (8![[thin space (1/6-em)]](https://www.rsc.org/images/entities/char_2009.gif) :
:![[thin space (1/6-em)]](https://www.rsc.org/images/entities/char_2009.gif) 2) electrode was used as a sensor for the detection of DA and UA using the EIS method. The EIS spectra were registered in the open circuit in the range of 10 kHz to 0.1 Hz (AC voltage amplitude of 10 mV). The electrode was immersed in 50 μL of DA or UA with different concentrations or samples for 15 min, followed by a thorough washing with B-R buffer (0.04 M) at pH 7.0.
2) electrode was used as a sensor for the detection of DA and UA using the EIS method. The EIS spectra were registered in the open circuit in the range of 10 kHz to 0.1 Hz (AC voltage amplitude of 10 mV). The electrode was immersed in 50 μL of DA or UA with different concentrations or samples for 15 min, followed by a thorough washing with B-R buffer (0.04 M) at pH 7.0.
The electron transfer resistance was recorded and the concentration of DA or UA was quantified by increasing the electron transfer resistance ΔRCT (ΔRCT = RCT,i − RCT,0), where RCT,0 is the electron transfer resistance in the absence of biomolecules and RCT,i is the electron transfer resistance in the presence of biomolecules. The quantitative behavior of the sensor was assessed by measuring the dependence of ΔRCT on the concentration of DA or UA. The Nyquist plots of the faradaic impedance spectra for the sensor with different concentrations of DA and UA were obtained (Fig. 8a and b) and the relationship between ΔRCT and log concentration (0.5–25 μM for DA and UA) are shown in Fig. 8c and d, respectively. The limit of detection (LOD) was determined based on the calibration curves derived through eqn (5) using DA and UA (0.5–25 μM). The regression equation was ΔRCT = 1029.2![[thin space (1/6-em)]](https://www.rsc.org/images/entities/char_2009.gif) log
log![[thin space (1/6-em)]](https://www.rsc.org/images/entities/char_2009.gif) CDA (μM) + 630.48 with R2 = 0.9466 LOD = 2.13 μM for DA and ΔRCT = 1230.2
CDA (μM) + 630.48 with R2 = 0.9466 LOD = 2.13 μM for DA and ΔRCT = 1230.2![[thin space (1/6-em)]](https://www.rsc.org/images/entities/char_2009.gif) log
log![[thin space (1/6-em)]](https://www.rsc.org/images/entities/char_2009.gif) CUA (μM) + 1758.9 with R2 = 0.9311 LOD = 2.48 μM for UA.
CUA (μM) + 1758.9 with R2 = 0.9311 LOD = 2.48 μM for UA.
 | (5) |
The charge transfer is related to the charge transient resistance, which is associated with the double-layer capacitance of the electrode, the presence of DA or UA in the medium preserves the electrode surface. Thus, the electrochemical system yields a one-time constant corresponding to one semicircle of the depressed capacitive loop without observing the other trace of inductive loop (Fig. 8a and b). This suggests that the rate of corrosion on the electrode has been controlled effectively by the adsorption of biomolecules. In this case, the nitrogen atoms present in the biomolecules donate their lone pair electrons to the metal surface, enhancing the charge-transfer process, which increases the diameter of the impedance loop.59 When the concentration of DA or UA was increased in the medium, the electrochemical nature and character of the semicircle dramatically changed, resulting in the formation of a highly homogeneous coating on the metal surface through a thin biomolecule layer, showing that the frequency dispersion is related to the mass transport resistance.
In the case of CPE/ZnO/CQDs (8![[thin space (1/6-em)]](https://www.rsc.org/images/entities/char_2009.gif) :
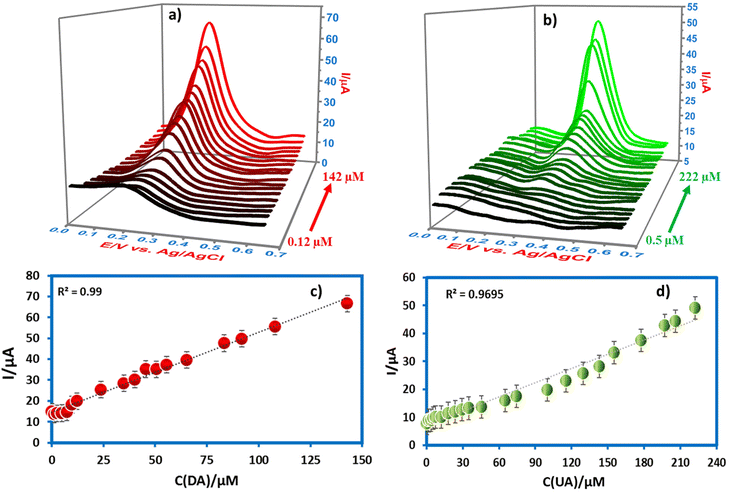
:![[thin space (1/6-em)]](https://www.rsc.org/images/entities/char_2009.gif) 2), the anodic current response with DA and UA in the SWV method was analyzed at different concentrations (Fig. 9a and b) and the results showed that there is a linear relationship between the peak current and concentration (0.12–142 μM and 0.5–222 μM for DA and UA), respectively. This revealed the good sensitivity of the electrode towards DA and UA because of the good catalytic effect caused by the low charge transfer resistance. The LOD was determined after considering the calibration curves derived through eqn (5) using DA (0.12–142 μM) and UA (0.5–222 μM) after applying a wide concentration range (Fig. 9c and d). The linear regression equation was applied to get to Ipa (μA) = 0.238CDA (μM) + 14.467 with R2 = 0.99 LOD with 0.46 μM for DA and Ipa (μA) = 0.170CUA (μM) + 7.078 with R2 = 0.9695 LOD with 0.23 μM for UA, respectively.
2), the anodic current response with DA and UA in the SWV method was analyzed at different concentrations (Fig. 9a and b) and the results showed that there is a linear relationship between the peak current and concentration (0.12–142 μM and 0.5–222 μM for DA and UA), respectively. This revealed the good sensitivity of the electrode towards DA and UA because of the good catalytic effect caused by the low charge transfer resistance. The LOD was determined after considering the calibration curves derived through eqn (5) using DA (0.12–142 μM) and UA (0.5–222 μM) after applying a wide concentration range (Fig. 9c and d). The linear regression equation was applied to get to Ipa (μA) = 0.238CDA (μM) + 14.467 with R2 = 0.99 LOD with 0.46 μM for DA and Ipa (μA) = 0.170CUA (μM) + 7.078 with R2 = 0.9695 LOD with 0.23 μM for UA, respectively.
The improved electrochemical activity obtained for CPE/ZnO/CQDs (8![[thin space (1/6-em)]](https://www.rsc.org/images/entities/char_2009.gif) :
:![[thin space (1/6-em)]](https://www.rsc.org/images/entities/char_2009.gif) 2) was due to the presence of ZnO/CQDs in the carbon paste given that it increases the number of surface active sites in the electrode, accelerating the diffusion of electrons and ions in the sample, which promotes the oxidation of DA.60 This can be explained by the effects in the energy band of the ZnO/CQD interface, described as the Schottky barrier, where the original Schottky barrier height (Φ) is determined by the work function difference between the CQDs and ZnO and the interface state.61 According to this theory, Φ remains in its original state when neutrally charged molecules bind to the ZnO/CQD interface and it decreases when positively charged molecules bind to the ZnO/CQD interface, and it is attributed to the positively charged molecules being adsorbed and inducing negative charges to result a drop in the ZnO conduction band, and depressing the Φ to a lower level. In this case, the electrons cross the lower Schottky barrier than when they are transferred from CQDs to ZnO, exhibiting an increase in the electrode conductance.
2) was due to the presence of ZnO/CQDs in the carbon paste given that it increases the number of surface active sites in the electrode, accelerating the diffusion of electrons and ions in the sample, which promotes the oxidation of DA.60 This can be explained by the effects in the energy band of the ZnO/CQD interface, described as the Schottky barrier, where the original Schottky barrier height (Φ) is determined by the work function difference between the CQDs and ZnO and the interface state.61 According to this theory, Φ remains in its original state when neutrally charged molecules bind to the ZnO/CQD interface and it decreases when positively charged molecules bind to the ZnO/CQD interface, and it is attributed to the positively charged molecules being adsorbed and inducing negative charges to result a drop in the ZnO conduction band, and depressing the Φ to a lower level. In this case, the electrons cross the lower Schottky barrier than when they are transferred from CQDs to ZnO, exhibiting an increase in the electrode conductance.
Moreover, when negatively charged molecules adsorb on the ZnO/CQD interface, Φ will increase, decreasing the number of electrons that are transported across the contact interface, decreasing the electrode conductance.62,63 The results show the excellent selectivity of the CPE/ZnO/CQD (8![[thin space (1/6-em)]](https://www.rsc.org/images/entities/char_2009.gif) :
:![[thin space (1/6-em)]](https://www.rsc.org/images/entities/char_2009.gif) 2) electrode towards the detection of DA. When DA is positively charged at pH = 7.0, its pKa (dissociation constant) is 8.71. Thus, Φ is decreased, causing a significant increase in the current, and consequently, high sensitivity and selectivity towards the detection of the biomolecules are observed even at low concentrations. This is also favored by the synergistic effect between graphite and ZnO/CQDS. Similarly, the CPE/ZnO/CQD electrode also showed a good sensitivity towards the detection of UA (Fig. 9b), which can be attributed to the electrostatic interaction between UA and the ZnO present in CPE/ZnO/CQDs with an isoelectric point of 9.5, indicating that the charge of ZnO may be positive at pH < 9.5. If the pH is greater than the pKa of UA (pKa = 5.8), then it involves anionic speciation.
2) electrode towards the detection of DA. When DA is positively charged at pH = 7.0, its pKa (dissociation constant) is 8.71. Thus, Φ is decreased, causing a significant increase in the current, and consequently, high sensitivity and selectivity towards the detection of the biomolecules are observed even at low concentrations. This is also favored by the synergistic effect between graphite and ZnO/CQDS. Similarly, the CPE/ZnO/CQD electrode also showed a good sensitivity towards the detection of UA (Fig. 9b), which can be attributed to the electrostatic interaction between UA and the ZnO present in CPE/ZnO/CQDs with an isoelectric point of 9.5, indicating that the charge of ZnO may be positive at pH < 9.5. If the pH is greater than the pKa of UA (pKa = 5.8), then it involves anionic speciation.
At neutral pH, UA exists as an anionic moiety, resulting in an electrostatic attraction between UA and CPE/ZnO/CQDs (pH < 9.5), and as a result, a good electrochemical response was obtained for the electrode. Therefore, the graphite structure has increased the conductivity to result a fast and an efficient electron transport, as reported,19,64 achieving the simultaneous detection of both biomolecules, as shown in Fig. 12.
Furthermore, the simultaneous detection of DA and UA on CPE/ZnO/CQDs (8![[thin space (1/6-em)]](https://www.rsc.org/images/entities/char_2009.gif) :
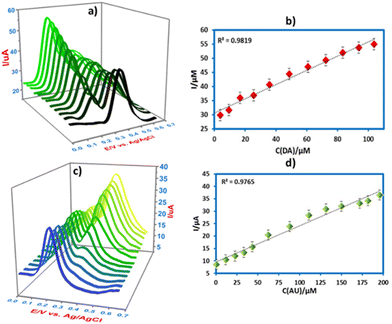
:![[thin space (1/6-em)]](https://www.rsc.org/images/entities/char_2009.gif) 2) was also carried out by SWV in B-R buffer (0.04 M) at pH 7.0. In a mixture of DA and UA, the concentration of one species was varied, while the other remained constant (Fig. 12a). As the concentration of DA is increased (0.5 to 104 μM), the oxidation current is also increased at 0.18 V, while the UA oxidation peak remained constant (500 μM at 0.27 V), yielding a linear regression of Ipa (μA) = 0.2522c (μM) + 30.62 (R2 = 0.9819). The same behavior was observed for UA, as indicated in Fig. 12c, revealing that the current is increased with the increasing concentration of UA (0.5 to 200 μM) in the presence of DA (50 μM at 0.18 V) at 0.27 V, giving a regression of Ipa (μA) = 0.1551c (μM) + 9.6095 (R2 = 0.9763). It was observed that there was no interference between DA and UA in their detection, and both compounds could be detected simultaneously using a new electrode (CPE/ZnO/CQDs (8
2) was also carried out by SWV in B-R buffer (0.04 M) at pH 7.0. In a mixture of DA and UA, the concentration of one species was varied, while the other remained constant (Fig. 12a). As the concentration of DA is increased (0.5 to 104 μM), the oxidation current is also increased at 0.18 V, while the UA oxidation peak remained constant (500 μM at 0.27 V), yielding a linear regression of Ipa (μA) = 0.2522c (μM) + 30.62 (R2 = 0.9819). The same behavior was observed for UA, as indicated in Fig. 12c, revealing that the current is increased with the increasing concentration of UA (0.5 to 200 μM) in the presence of DA (50 μM at 0.18 V) at 0.27 V, giving a regression of Ipa (μA) = 0.1551c (μM) + 9.6095 (R2 = 0.9763). It was observed that there was no interference between DA and UA in their detection, and both compounds could be detected simultaneously using a new electrode (CPE/ZnO/CQDs (8![[thin space (1/6-em)]](https://www.rsc.org/images/entities/char_2009.gif) :
:![[thin space (1/6-em)]](https://www.rsc.org/images/entities/char_2009.gif) 2)).
2)).
It can be seen that the DA redox reaction is almost reversible, involving the electrochemical oxidation of DA, proceeding via the formation of dopamine semiquinone (DSQ), which is converted to dopamine quinone (DQ) by a single-electron and proton transfer, as described in the literature.65 Subsequently, DQ undergoes intramolecular cyclization to form leucodopaminechrome (DAL), which is oxidized to dopaminechrome (DAC), leading to polydopamine.66 In the case of UA, it undergoes a two-electron oxidation to form an unstable anionic quinone, as reported elsewhere67 at pH of ≥6 (Fig. 6), and it is further decomposed to produce allantoin.68
The present results were compared with that reported in the literature and it was observed that the present electrodes show an excellent selectivity and sensitivity towards the simultaneous detection of DA and UA using electrochemical techniques such as SWV and EIS, and their LODs are even lower than the reported electrodes (Table 2). Similarly, we collected the trend of research papers in last 20 years (Fig. 10), showing that the use of CPE as a competent electrochemical sensor is increasing constantly.
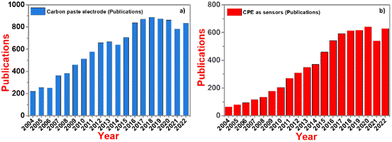 | ||
| Fig. 10 Trend of: (a) CPE research in the last 20 years and (b) research on CPE as sensors in the last 20 years. | ||
| Electrode | Technique | E pa (mV) | Linear range (μM) | LOD (μM) | Ref. | |||
|---|---|---|---|---|---|---|---|---|
| DA | UA | DA | UA | DA | UA | |||
| RGO–ZnO | DPV | N/S | N/S | 1–70 | 3–330 | 0.33 | 1.08 | 69 |
| P-4-ABA/GCE | DPV | 232 | 576 | 5–100 | 1–80 | 1.0 | 0.5 | 70 |
| β-CD/CQDs/GCE | DPV | 160 | 310 | 4–220 | 0.3–200 | 0.14 | 0.01 | 71 |
| GCE modified with CQDs | LSV | 600 | 400 | 0.19–11.81 | 0.21–13.39 | 2.7 | 1.3 | 72 |
| CQD@Fe2O3/MWCNT/GCE | DPV | — | 250 | — | 0.5–120 | — | 0.019 | 73 |
| CQD-SPCE | CV | 220 | — | 1–7 | — | 0.099 | — | 23 |
| CQDs/CuO | SWV | 330 | — | 10–180 | — | 25.40 | — | 56 |
| CQDs-CS/GCE | DPV | 280 | — | 0.1–30 | — | 0.0112 | — | 74 |
| IL-graphene/CQDs/GCE | DPV | — | — | 0.1–600 | — | 0.03 | — | 75 |
| CQDs/GCE | DPV | 213 | — | 0.15–150 | — | 0.026 | — | 76 |
CPE/ZnO/CQDs (8![[thin space (1/6-em)]](https://www.rsc.org/images/entities/char_2009.gif) : :![[thin space (1/6-em)]](https://www.rsc.org/images/entities/char_2009.gif) 2) 2) |
EIS | — | — | 0.5–25 | 0.5–25 | 2.13 | 2.48 | This work |
| SWV | 184 | 334 | 0.12–142 | 0.5–222 | 0.46 | 0.23 | ||
Anti-interference studies
Using CPE/ZnO/CQDs (8![[thin space (1/6-em)]](https://www.rsc.org/images/entities/char_2009.gif) :
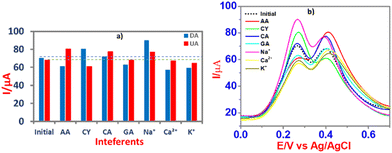
:![[thin space (1/6-em)]](https://www.rsc.org/images/entities/char_2009.gif) 2), anti-interference tests were performed using different coexisting molecules such as ascorbic acid (AA), cysteine (CY), citric acid (CA), and galactose (GA) and some cations such as Na+, K+ and Ca2+ in the determination of DA and UA by the SWV method (Fig. 11). The results showed that there was no significant interference from the coexisting molecules in the recognition of DA and UA, showing that the CPE/ZnO/CQD (8
2), anti-interference tests were performed using different coexisting molecules such as ascorbic acid (AA), cysteine (CY), citric acid (CA), and galactose (GA) and some cations such as Na+, K+ and Ca2+ in the determination of DA and UA by the SWV method (Fig. 11). The results showed that there was no significant interference from the coexisting molecules in the recognition of DA and UA, showing that the CPE/ZnO/CQD (8![[thin space (1/6-em)]](https://www.rsc.org/images/entities/char_2009.gif) :
:![[thin space (1/6-em)]](https://www.rsc.org/images/entities/char_2009.gif) 2) electrode is capable of detecting DA and UA selectively.
2) electrode is capable of detecting DA and UA selectively.
Recognition of DA and UA in human urine samples
Urine samples were collected from different individuals and used for the selective detection of DA and UA using CPE/ZnO/CQDs (8![[thin space (1/6-em)]](https://www.rsc.org/images/entities/char_2009.gif) :
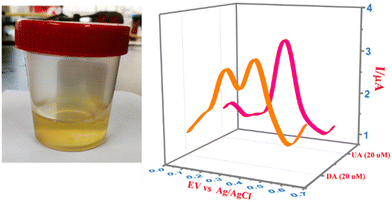
:![[thin space (1/6-em)]](https://www.rsc.org/images/entities/char_2009.gif) 2). The urine samples were spiked with known amounts of analytes (10 and 20 μM) and subjected to the recognition efficiency test. A clear peak at 0.18 V for DA and 0.33 V for UA was obtained (Fig. 13), showing that this electrode can be applied for the simultaneous detection of DA and AU even in complex samples. Furthermore, the recovery percentage was greater than 95% for the target analytes (Table 3), establishing a lower LOD compared to the reported values, and it showed high detection efficiency with high selectivity even at low concentrations.
2). The urine samples were spiked with known amounts of analytes (10 and 20 μM) and subjected to the recognition efficiency test. A clear peak at 0.18 V for DA and 0.33 V for UA was obtained (Fig. 13), showing that this electrode can be applied for the simultaneous detection of DA and AU even in complex samples. Furthermore, the recovery percentage was greater than 95% for the target analytes (Table 3), establishing a lower LOD compared to the reported values, and it showed high detection efficiency with high selectivity even at low concentrations.
| Sample | Spiked (μM) | Found (μM) | Recovery (%) | R.S.D. (%) | ||||
|---|---|---|---|---|---|---|---|---|
| DA | UA | DA | UA | DA | UA | DA | UA | |
| Urine | 10 | 10 | 10.05 | 9.99 | 100.52 | 99.93 | 2.3 | 1.2 |
| 20 | 20 | 19.32 | 21.76 | 96.58 | 108.79 | 1.8 | 3.3 | |
Recognition of DA and UA by ZnO/CQDs in biological samples
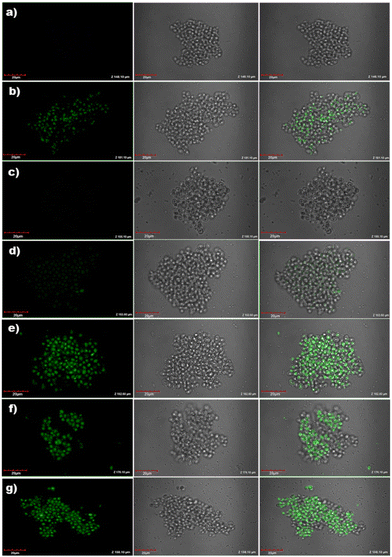
To explore other potential applications of the electrodes, cell images of Saccharomyces cerevisiae were recorded by confocal microscopy during the recognition of DA and UA by ZnO/CQDs. The solutions were prepared and inoculated as described in the Experimental section, and then poured (30 μL) on the surface of a freshly cultured Petri dish and left for 15 min, before adding the compounds (CQDs, ZnO NPs and ZnO/CQDs).The images were taken before and after the addition of the samples. After excitation at 405 nm, as expected, no fluorescent response was observed for the cells (Fig. 14a), showing that the microorganisms have a size of ∼ 5.0 μm with a regular oval shape. However, after the addition of CQDs, ZnO NPs and ZnO/CQDs to the solution, the development of fluorescence dotted images were observed (Fig. 14b). The results also showed that the size of the cells and growth rate in the culture remained the same, implying that there was no toxicity from the samples to Saccharomyces cerevisiae. The fluorescence of CQDs and ZnO/CQDs could be seen in the cells after their incubation with Saccharomyces cerevisiae. This finding indicates the potential to label live cells in culture using these two types of CQDs.
Moreover, ZnO/CQDs were used to detect DA and UA in Saccharomyces cerevisiae cells, which were grown in modified Muller Hinton Agar with sucrose (2.0%) as growth factors. In the case of the cells treated with ZnO/CQDs in the presence of DA or UA, a considerable enhancement in fluorescence was detected in the image (Fig. 14e and f), respectively. The fluorescence images were seen for the cells having ZnO/CQDs + DA + UA, showing that the interaction of ZnO/CQDs with these two biomolecules is essential to produce the fluorescence images (Fig. 14g). The results also show that ZnO/CQDs + DA or ZnO/CQDs + UA was internalized by the yeast cells, which were concentrated in certain cell compartments such as cytoplasm without being toxic to the cell.
DFT studies
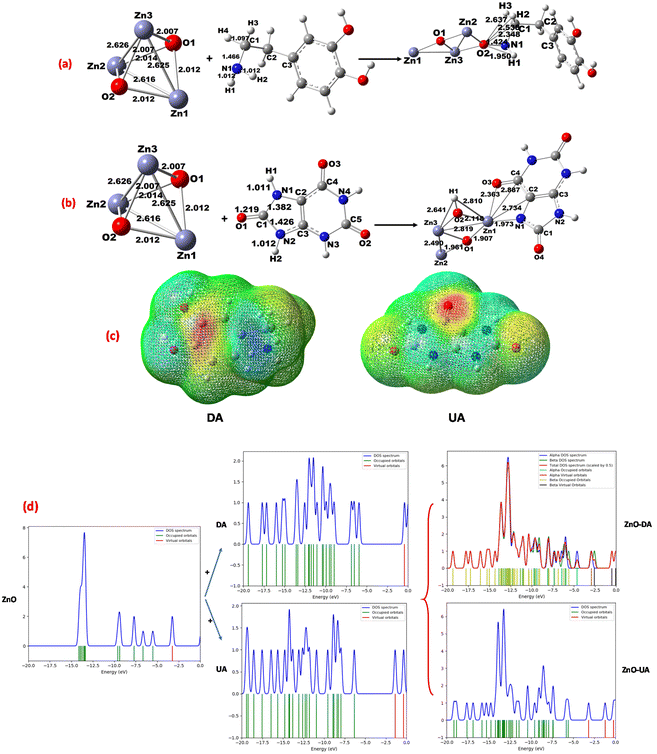
The structural optimization of wurtzite ZnO, dopamine, and uric acid was performed by DFT using Gaussian 0977 at the B3LYP level78,79 with the DGDZVP basis set, and then the interaction of wurtzite ZnO-DA and wurtzite ZnO-UA determined. The geometrical data obtained for DA, UA, and [ZnO-DA; ZnO-UA] are consistent with the reported values.80,81 For example, the bonding of DA with ZnO was seen as N1amine from DA coordinated with an O atom (from ZnO) (Fig. 15a). However, the bond formation between O2(ZnO) and different N, C, and H atoms (from DA) was also observed as (O2)–N1amine (1.424 Å), O2–C1 (2.348 Å), O2–H1(NH) (1.950 Å), O2–H2(C1) (2.536 Å), and O2–H3(C1) (2.637 Å). Thus, the bond formed between the primary N1amine and O2(ZnO) (1.424 Å) and H1(N1amine) and O(2) (1.950 Å) is shorter than the C(1) of DA and O2(ZnO) [C(1)–O(2) = 2.348 Å] and stabilizes the interaction. Moreover, the orbital overlapping of N1amine (DA) with that of O2 (ZnO) was successfully detected, implying that the orbital orientation is essential for the DA interaction with ZnO, destabilizing the bonding of H3(DA) with the O2 (ZnO) [H3(DA)–O2(ZnO) = 2.637 Å] in the corner position (Fig. 15a).This suggests that the adsorption of DA over ZnO is supported by the breaking of the bonds of N1amine–H1 (1.022 Å), C1–H2 (1.096 Å) and C1–H3 (1.104 Å). This is consistent with the charge density and potential electrostatic maps (Fig. 15c), showing that there is a considerable decrease in the charge density for N(1)–H(1) from −0.707 to −0.245 electrons for N(1)amine and 0.310 to 0.342 electrons for H(1), while a considerable increase was found from −0.610 to −0.984 electrons for O2(ZnO).
A high electron density for the primary N1amine and a deficiency of electrons for hydrogen were also noted (see ESI Table S3†). Similarly, several bonds were formed between ZnO and the different atoms in UA including N, C, and H, forming bonds between (Zn1)–N1imidazol (1.973 Å), Zn1–C2 (2.734 Å), Zn1–C4 (2.887 Å), and Zn1–O3 (2.363 Å). Thus, as seen for DA, the N1imidazol and Zn1(ZnO) bond (1.973 Å) is much shorter than Zn1(ZnO) [C4–O3 = 2.363 Å], evidencing the orbital overlapping for N1imidazol (UA) with Zn1(ZnO) (Fig. 15b) and supporting the adsorption of UA on (ZnO). The charge density and potential electrostatic maps (Fig. 15c) are consistent, where an increase in charge density from −0.459 to −0.903 for N1imidazol, −0.365 to −0.607 electrons for O3, and 0.656 to 1.267 electrons for Zn1 (ZnO) was noted (see ESI Table S4†). The binding energy (BE) for Namine (DA) or Nimidazol (UA) with ZnO was determined82,83 to be 6.33 kcal mol−1 for [ZnO-DA] (at parallel position) and 8.12 kcal mol−1 for [ZnO-UA] (at the perpendicular position of ZnO with imidazole N and O). This implies that the binding of DA with ZnO is very weak, favoring the absorption of more DA through the O2(ZnO) atom compared to the absorption of UA through the Zn1(ZnO) atom.
With the assistance of density of states, the interaction of DA with ZnO was analyzed and the mixing of the orbitals (NH or C1H2 and C1H3) with the O2(ZnO) p orbital was observed. Similarly, for the UA–ZnO interaction, the mixing of the N1imidazole, C2, C4, or O3 orbital with Zn1 (ZnO) was shown, and as seen in the DOS, when DA and UA were placed over the surface of the bare ZnO cluster, and the evolution of the DOS signals was observed, revealing that there is a bond between DA and O2(ZnO) through the mixing of the N p orbitals with O2 p orbitals. The bond formed between UA and Zn1 (ZnO) through the mixing of the N or C or O p orbitals with the Zn1 d orbitals generates a signal at the Fermi level of −5.0 eV, corresponding to the sp hybrid orbital, and consequently it yields a stable complex [ZnO-DA] or [ZnO-UA] (Fig. 15c). The Mulliken charge density was also used to prove the hydrogen transformation for NH or HN–CH2, which is consistent with the molecular orbitals (HOMO–LUMO) (see ESI Table S4†).
Natural transition orbitals (NTOs)
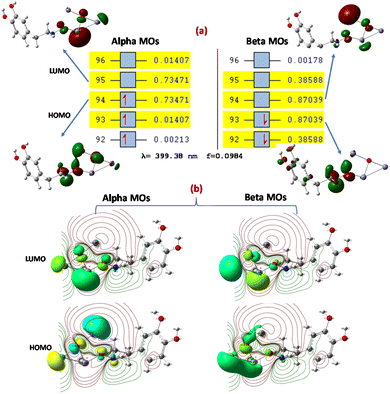
The [ZnO-DA] and [ZnO-UA] interactions were analyzed by NTOs using DFT considering B3LYP/DGDZVP at (S = 0) at the ground state and the delocalization of the bonding nature in [ZnO-DA] or [ZnO-UA]80 identified, through which the transition density matrices were determined. The TDDFT absorption spectra for [ZnO-DA] and [ZnO-UA] were derived to understand the electronic transition nature84 (ESI Fig. S3†). The transition electron density present in the ground and excited states was determined, which showed the complete mixing of the orbitals and allowed us to understand the involvement of hole (unoccupied)–particle (occupied) excitation. The removal of an electron from the ground state (occupied NTO) and its placement in the excited state (virtual NTO, particle density) were observed. We obtained several states of around 40 for [ZnO-DA] and [ZnO-UA], 11 for [ZnO-DA] and 19 for [ZnO-UA], which are suitable given that they have a relatively greater oscillator strength (f = 0.0984, λ = 399.38 nm) for [ZnO-DA] and (f = 0.2987, λ = 230.18 nm) [ZnO-UA] compared to the other states (Fig. 16a, ESI Fig. S4†). This is consistent with the orbital transition from 94 (HOMO) to 95 (LUMO) for the α orbital, and the other orbital transition from 93 (HOMO) to 94 (LUMO) for the β orbital gives the absorption maximum (399.38 nm) for [ZnO-DA]. In the case of [ZnO-UA], the orbital transition was from 96 (HOMO) to 97 (LUMO), deriving an absorption maximum (230.18 nm) assigned to an admixture of intra-ligand charge transfer (ILCT) and MLCT states (charge-transfer). The hole NTOs are precisely localized on the O atoms and Zn center, and the electron NTOs are delocalized over the σ* orbital of DA or π* orbital of the UA moiety (Fig. 16a and ESI Fig. S4†).The α transition was detected for [ZnO-DA] at 0.73471 eV, namely, 94 (HOMO) to 95 (LUMO) (911.04 nm, 461.03 kcal mol−1 orbital energy), resulting in the excited states. For [ZnO-UA], the above-mentioned transition occurred at 0.57621 eV such as 96 (HOMO) to 97 (LUMO) (714.5 nm and 361.57 kcal mol−1). The electron density movement was also studied by DFT at the B3LYP/DGDZVP level in the [ZnO-DA] interaction and the connectivity of the atoms was established by a molecular graph. According to the electronic contour density, the existence of connectivity between (O2, ZnO, and DA (N1, C1, and H atoms) was detected; precisely, the DA interaction at a parallel position to O2(ZnO) (Fig. 16a). Consequently, a negative electron density (−0.245, N1) and (−0.282 C1), a positive electron density (0.342, H1) of N1 amine and (0.217, H2 and 0.182, H3) for the C1 methyl group of DA, and (−0.600) for O2) in ZnO–N1 in the excited state. The above-mentioned observation is also true for the interaction of ZnO with UA (N1, C2, C4, and O atoms), given that the electronic contour density proves the presence of bonding between ZnO and UA (N1, C2, C4, and O atoms) mainly at the corner position of the Zn1(ZnO) surface (ESI Fig. S4†). The negative electron density (−0.377, N1) and (−0.462, O3) from the carbonyl group and (−0.870, O2) in Zn1–O2, positive electron density (0.174, C2) and (0.378, C4) from UA and (0.416) for H1 of the bond formed between O2–H1, and (0.824, Zn1) in ZnO–N1 in both excited states (11 and 19) can be explained by the valence-shell electron-pair repulsion model.
Experimental section
Physical measurements
The crystallinity of all the electrode samples was analyzed by powder X-ray diffraction (XRD) on a Rigaku RU300 diffractometer (Cu Kα radiation, λ = 0.154 nm), and the collected data from the equipment were matched with the American Mineralogist Crystal Structure Database (AMCSD, no. 0002576) to characterize their crystal planes. The crystallite size of the samples was estimated using the Scherrer formula. The morphology of ZnO/CQDs was analyzed in detail by scanning electron microscopy (SEM) using a Quanta 400F field emission on a JEOL-JSM-5600LV, which was connected to an energy dispersive X-ray spectrometer.85 The crystalline planes of the samples were studied on a transmission electron microscope (TEM, JEOL JEM 1011) and the fingering nature was analyzed using HRTEM images obtained from a JEOL JEM-2010 operated at 200 kV. The elemental composition of the ZnO NPs and ZnO/CQDs samples was determined by XPS (K Alpha Thermo-Fisher Scientific Instruments) and the measurements were performed in a chamber having a pressure of 10−9 mbar, equipped with an Al Kα X-ray source (1486.6 eV) to analyze the elemental composition of the components. The electrochemical recognition was studied using a three-electrode configuration, where a potentiostat (Princeton Applied Research Corporation, PARC 263A Model) was connected to three electrodes. Specifically, graphite carbon or modified carbon paste electrodes CPE, CPE/ZnO/CQDs (9![[thin space (1/6-em)]](https://www.rsc.org/images/entities/char_2009.gif) :
:![[thin space (1/6-em)]](https://www.rsc.org/images/entities/char_2009.gif) 1) or CPE/ZnO/CQDs (8
1) or CPE/ZnO/CQDs (8![[thin space (1/6-em)]](https://www.rsc.org/images/entities/char_2009.gif) :
:![[thin space (1/6-em)]](https://www.rsc.org/images/entities/char_2009.gif) 2) acted as the working electrode through which the oxidation or reduction potentials were measured, platinum wire as the auxiliary electrode (measuring the oxidation/reduction currents) and Ag(s)/AgCl as the reference electrode. Britton-Robinson (B-R) buffer solution (pH 7.0, 0.04 M) was used as the supporting electrolyte. Cyclic voltammetry (CV) and square wave voltammetry (SWV) were performed in the potential range of −0.3 to 0.7 V at a scan rate of 30 to 130 mV s−1 on the potentiostat (263A PARC model), which was interfaced with a computer having the Power Suite software. The obtained results were compared with that from the unmodified CPE. Before the above-mentioned experiment, the electrochemical impedance spectroscopy (EIS) behaviour of the electrodes was analyzed on a model ACM instrument guided by the ACM v4 analysis software.
2) acted as the working electrode through which the oxidation or reduction potentials were measured, platinum wire as the auxiliary electrode (measuring the oxidation/reduction currents) and Ag(s)/AgCl as the reference electrode. Britton-Robinson (B-R) buffer solution (pH 7.0, 0.04 M) was used as the supporting electrolyte. Cyclic voltammetry (CV) and square wave voltammetry (SWV) were performed in the potential range of −0.3 to 0.7 V at a scan rate of 30 to 130 mV s−1 on the potentiostat (263A PARC model), which was interfaced with a computer having the Power Suite software. The obtained results were compared with that from the unmodified CPE. Before the above-mentioned experiment, the electrochemical impedance spectroscopy (EIS) behaviour of the electrodes was analyzed on a model ACM instrument guided by the ACM v4 analysis software.
Nanomaterial synthesis
![[thin space (1/6-em)]](https://www.rsc.org/images/entities/char_2009.gif) :
:![[thin space (1/6-em)]](https://www.rsc.org/images/entities/char_2009.gif) 1, 80 mL), stirred for 20 min to form a homogenous solution, and then polyene glycol was added (0.5 g). Then, the whole mixture was transferred to a stainless-steel autoclave and heated at 150 °C for 8 h. The obtained product was washed thoroughly with both deionized water and anhydrous ethanol, and then dried in a vacuum at 80 °C for 12 h.
1, 80 mL), stirred for 20 min to form a homogenous solution, and then polyene glycol was added (0.5 g). Then, the whole mixture was transferred to a stainless-steel autoclave and heated at 150 °C for 8 h. The obtained product was washed thoroughly with both deionized water and anhydrous ethanol, and then dried in a vacuum at 80 °C for 12 h.
Modified carbon paste electrode (CPE/ZnO/CQDs)
Typically, graphite powder having ZnO/CQDs (402.3 mg) was mixed thoroughly with paraffin oil (172.4 mg) for 30 min until it turned to a paste, which was then packed into an electrode tube and employed as a working electrode [depth (3.0 mm), diameter (3.0 mm)]. The CPE was fabricated with different weight proportions (9![[thin space (1/6-em)]](https://www.rsc.org/images/entities/char_2009.gif) :
:![[thin space (1/6-em)]](https://www.rsc.org/images/entities/char_2009.gif) 1 and 8
1 and 8![[thin space (1/6-em)]](https://www.rsc.org/images/entities/char_2009.gif) :
:![[thin space (1/6-em)]](https://www.rsc.org/images/entities/char_2009.gif) 2) for ZnO/CQDs such as electrodes CPE/ZnO/CQDs (9
2) for ZnO/CQDs such as electrodes CPE/ZnO/CQDs (9![[thin space (1/6-em)]](https://www.rsc.org/images/entities/char_2009.gif) :
:![[thin space (1/6-em)]](https://www.rsc.org/images/entities/char_2009.gif) 1) and CPE/ZnO/CQDs (8
1) and CPE/ZnO/CQDs (8![[thin space (1/6-em)]](https://www.rsc.org/images/entities/char_2009.gif) :
:![[thin space (1/6-em)]](https://www.rsc.org/images/entities/char_2009.gif) 2). All the electrodes were gently polished to get a smooth surface with a wet satin cloth before employing them in the electrochemical system (Scheme 1). Similarly, an unmodified CPE electrode was also prepared without ZnO/CQDs for the comparative analysis.
2). All the electrodes were gently polished to get a smooth surface with a wet satin cloth before employing them in the electrochemical system (Scheme 1). Similarly, an unmodified CPE electrode was also prepared without ZnO/CQDs for the comparative analysis.
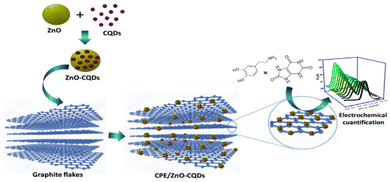 | ||
| Scheme 1 Modified carbon paste electrodes (CPE/ZnO/CQDs) for electrochemical responses to DA and UA. | ||
Electrochemical studies
EIS spectra were recorded under open circuit conditions in the range of 10 kHz to 0.1 Hz (AC voltage amplitude of 10 mV). The voltage frequency interval was divided logarithmically into 50 for better measurement of the equidistant points. The new electrodes were tested using [Fe(CN)6]3−/4− (5.0 mM) as the substrate, and then employed for the detection of DA and UA. After studying the impedance behavior of the electrodes under open-circuit conditions, cyclic voltammetry (CV) and square wave voltammetry (SWV) were carried out on a potentiostat (PARC, model 263A), which was interfaced with a computer having the Power Suite software. The fabricated electrodes including CPE, CPE/ZnO/CQDs (9![[thin space (1/6-em)]](https://www.rsc.org/images/entities/char_2009.gif) :
:![[thin space (1/6-em)]](https://www.rsc.org/images/entities/char_2009.gif) 1), and CPE/ZnO/CQDs (8
1), and CPE/ZnO/CQDs (8![[thin space (1/6-em)]](https://www.rsc.org/images/entities/char_2009.gif) :
:![[thin space (1/6-em)]](https://www.rsc.org/images/entities/char_2009.gif) 2) were assembled as working electrode, while the platinum wire and Ag(s)/AgCl were connected to the potentiostat as the auxiliary and reference electrodes, respectively. The performance of the electrodes was estimated using K4[Fe(CN)6] as a substrate in CV with B-R buffer solution (pH 7.0, 0.04 M) as electrolyte. The results were collected in the potential range of −0.3 to 0.7 V at a scan rate from 30 to 130 mV s−1, and the data were compared with that from the unmodified CPE. The anodic sensing properties of the electrodes were studied for DA and UA (50 and 500 μM, respectively) in the potential range of 0 to 0.65 V. For SWV, the detection of the substrates was carried at 100 mV s−1 and pulse amplitude of 50 mV with a step potential of 2.0 mV.
2) were assembled as working electrode, while the platinum wire and Ag(s)/AgCl were connected to the potentiostat as the auxiliary and reference electrodes, respectively. The performance of the electrodes was estimated using K4[Fe(CN)6] as a substrate in CV with B-R buffer solution (pH 7.0, 0.04 M) as electrolyte. The results were collected in the potential range of −0.3 to 0.7 V at a scan rate from 30 to 130 mV s−1, and the data were compared with that from the unmodified CPE. The anodic sensing properties of the electrodes were studied for DA and UA (50 and 500 μM, respectively) in the potential range of 0 to 0.65 V. For SWV, the detection of the substrates was carried at 100 mV s−1 and pulse amplitude of 50 mV with a step potential of 2.0 mV.
Electrochemical sensing of DA and UA in human urine
A newly fabricated electrode CPE/ZnO/CQDs (8![[thin space (1/6-em)]](https://www.rsc.org/images/entities/char_2009.gif) :
:![[thin space (1/6-em)]](https://www.rsc.org/images/entities/char_2009.gif) 2) was employed as the working electrode to detect DA and UA in urine samples collected from different persons. The collected urine samples were centrifuged and analyzed quantitatively. The B-R buffer solution (pH 7.0, 0.04 M) was mixed with the human urine (50
2) was employed as the working electrode to detect DA and UA in urine samples collected from different persons. The collected urine samples were centrifuged and analyzed quantitatively. The B-R buffer solution (pH 7.0, 0.04 M) was mixed with the human urine (50![[thin space (1/6-em)]](https://www.rsc.org/images/entities/char_2009.gif) :
:![[thin space (1/6-em)]](https://www.rsc.org/images/entities/char_2009.gif) 50), spiked with the DA and UA solution up to 10 and 20 μM levels, and their concentrations determined. The electrochemical responses were analyzed to determine the efficiency of the electrodes. The whole experiment was repeated three times for a better understanding of the results in terms of reproducibility (standard stock solution, n = 3). Human urine samples were obtained from volunteer students from the National Autonomous University of Mexico (UNAM), Mexico. All volunteers were informed about the aim of this study. The collection of urine samples was performed according to our university regulations.
50), spiked with the DA and UA solution up to 10 and 20 μM levels, and their concentrations determined. The electrochemical responses were analyzed to determine the efficiency of the electrodes. The whole experiment was repeated three times for a better understanding of the results in terms of reproducibility (standard stock solution, n = 3). Human urine samples were obtained from volunteer students from the National Autonomous University of Mexico (UNAM), Mexico. All volunteers were informed about the aim of this study. The collection of urine samples was performed according to our university regulations.
Bio-imaging studies
Fluorescence bio-imaging for the recognition of DA and UA using ZnO/CQDs in Saccharomyces cerevisiae cells was studied. In particular, with the cells, the fluorescence intensity of the nanocomposite in the presence and absence of the biomolecules was monitored using an Olympus FV1000 instrument, equipped with a diode laser (405 nm) as the excitation source. Similarly, fluorescence images were obtained for ZnO NPs and CQDs in the absence of DA and UA. The cells were obtained commercially, purified to avoid any interference from other moieties, and grown in modified Muller Hinton Broth (MHB) with sucrose (2.0%) as growing factors. For the inoculation study, seven solutions were prepared separately, as follows: (1) control, the cells (100 μL) were poured into 4.0 mL of MHB, (2) cells (100 μL) + CQDs (200 μL, 0.1 mg mL−1), (3) cells (100 μL) + ZnO NPs (200 μL, 0.1 mg mL−1), (4) cells (100 μL) + ZnO/CQDs (200 μL, 0.1 mg mL−1), (5) cells (100 μL) + ZnO/CQDs (200 μL, 0.1 mg mL−1) treated with DA (200 μL, 0.1 mM), (6) cells (100 μL) + ZnO/CQDs (200 μL, 0.1 mg mL−1) treated with UA (200 μL, 0.1 mM) and (7) cells (100 μL) + ZnO/CQDs (200 μL, 0.1 mg mL−1) treated with DA and UA (100 μL, 0.1 mM, respectively). For each solution, the total volume was 4.0 mL adjusted with MBH. Each inoculated solution (30 μL) was poured on the surface of a freshly cultured Petri dish and left there for 15 min before the cells were observed using a confocal microscope.Conclusions
New CPE/ZnO/CQDs (9![[thin space (1/6-em)]](https://www.rsc.org/images/entities/char_2009.gif) :
:![[thin space (1/6-em)]](https://www.rsc.org/images/entities/char_2009.gif) 1) and CPE/ZnO/CQDs (8
1) and CPE/ZnO/CQDs (8![[thin space (1/6-em)]](https://www.rsc.org/images/entities/char_2009.gif) :
:![[thin space (1/6-em)]](https://www.rsc.org/images/entities/char_2009.gif) 2) electrodes prepared were employed for electrochemical studies, with the area (cm2) of 5.66 × 10⁻² and 7.05 × 10⁻², respectively. The studies showed that the electrodes were very sensitive to DA and UA for their recognition due to the synergic effect generated by ZnO and CQDs in the carbon paste. The impedance analysis exhibited a phase shift, showing that the rate constant (kapp) followed the order of CPE (1.02 × 10⁻³ cm s−1) < CPE/ZnO/CQDs (9
2) electrodes prepared were employed for electrochemical studies, with the area (cm2) of 5.66 × 10⁻² and 7.05 × 10⁻², respectively. The studies showed that the electrodes were very sensitive to DA and UA for their recognition due to the synergic effect generated by ZnO and CQDs in the carbon paste. The impedance analysis exhibited a phase shift, showing that the rate constant (kapp) followed the order of CPE (1.02 × 10⁻³ cm s−1) < CPE/ZnO/CQDs (9![[thin space (1/6-em)]](https://www.rsc.org/images/entities/char_2009.gif) :
:![[thin space (1/6-em)]](https://www.rsc.org/images/entities/char_2009.gif) 1) (2.69 × 10⁻³ cm s−1) < CPE/ZnO/CQDs (8
1) (2.69 × 10⁻³ cm s−1) < CPE/ZnO/CQDs (8![[thin space (1/6-em)]](https://www.rsc.org/images/entities/char_2009.gif) :
:![[thin space (1/6-em)]](https://www.rsc.org/images/entities/char_2009.gif) 2) (4.55 × 10⁻³ cm s−1). This suggests that the presence of ZnO/CQDs in CPE has improved the electron transfer capabilities, which led to a lower RCT in the following order: CPE (741 Ω) > CPE/ZnO/CQDs (9
2) (4.55 × 10⁻³ cm s−1). This suggests that the presence of ZnO/CQDs in CPE has improved the electron transfer capabilities, which led to a lower RCT in the following order: CPE (741 Ω) > CPE/ZnO/CQDs (9![[thin space (1/6-em)]](https://www.rsc.org/images/entities/char_2009.gif) :
:![[thin space (1/6-em)]](https://www.rsc.org/images/entities/char_2009.gif) 1) (279 Ω) > CPE/ZnO/CQDs (8
1) (279 Ω) > CPE/ZnO/CQDs (8![[thin space (1/6-em)]](https://www.rsc.org/images/entities/char_2009.gif) :
:![[thin space (1/6-em)]](https://www.rsc.org/images/entities/char_2009.gif) 2) (165 Ω). Furthermore, CPE/ZnO/CQDs (8
2) (165 Ω). Furthermore, CPE/ZnO/CQDs (8![[thin space (1/6-em)]](https://www.rsc.org/images/entities/char_2009.gif) :
:![[thin space (1/6-em)]](https://www.rsc.org/images/entities/char_2009.gif) 2) was employed as an electrode in the SWV technique, successfully detecting DA and UA in humane urine samples, resulting the LOD of 0.46 and 0.23 μM, respectively. In contrast, the unmodified CPE was unable to detect DA and UA in the absence of the ZnO/CQD components. It was shown that it is possible to detect DA and UA in biological samples such as Saccharomyces cerevisiae cells using ZnO/CQDs as a marker. The presence of ZnO/CQDs in the CPE enhanced the sensitivity and selectivity of the electrode, detecting efficiently both DA and AU. This system can be used to manufacture other types of electrodes such as SPE and it can be considered a portable device to determine DA and UA in situ and real-time in real samples.
2) was employed as an electrode in the SWV technique, successfully detecting DA and UA in humane urine samples, resulting the LOD of 0.46 and 0.23 μM, respectively. In contrast, the unmodified CPE was unable to detect DA and UA in the absence of the ZnO/CQD components. It was shown that it is possible to detect DA and UA in biological samples such as Saccharomyces cerevisiae cells using ZnO/CQDs as a marker. The presence of ZnO/CQDs in the CPE enhanced the sensitivity and selectivity of the electrode, detecting efficiently both DA and AU. This system can be used to manufacture other types of electrodes such as SPE and it can be considered a portable device to determine DA and UA in situ and real-time in real samples.
Author contributions
Eduardo D. Tecuapa-Flores: preparation and characterization of the modified electrodes and sensing studies; Cristian B. Palacios-Cabrera: synthesis of the nanomaterials; Alan J. Santiago-Cuevas: EIS studies and analysis of electrode results; José G. Hernández: DFT calculations of DA and UA over graphite and analysis; Jayanthi Narayanan: SEM and TEM and analytical studies and Pandiyan Thangarasu: analysis of results, and discussion, writing/revision of the manuscript.Conflicts of interest
There are no conflicts to declare.Acknowledgements
The authors gratefully acknowledge Asuntos del Personal Académico (Project PAPIIT No. IN202622) for the support of this work, and USAI (Unidad de Servicios de Apoyo a la Investigación, Facultad de Química, UNAM) for analytical services. The authors also thank DGSCA-UNAM for its computation facilities and the Consejo Mexiquense de Ciencia y Tecnología (COMECYT) for providing a fellowship to Eduardo Daniel Tecuapa Flores (FOLIO: ESYCA2023-11037).References
- P. Gorwood, Y. Le Strat, N. Ramoz, C. Dubertret, J.-M. Moalic and M. Simonneau, Hum. Genet., 2012, 131, 803–822 CrossRef CAS.
- D. Dimić, D. Milenković, J. D. Marković and Z. Marković, Phys. Chem. Chem. Phys., 2017, 19, 12970–12980 RSC.
- R. Cools, Neuroscientist, 2008, 14, 381–395 CrossRef CAS PubMed.
- D. Sulzer, Neuron, 2011, 69, 628–649 CrossRef CAS.
- A. Roychoudhury, S. Basu and S. K. Jha, Biosens. Bioelectron., 2016, 84, 72–81 CrossRef CAS PubMed.
- M. Yang, H. Wang, P. Liu and J. Cheng, Biosens. Bioelectron., 2021, 179, 113082 CrossRef CAS PubMed.
- Z. Pan, H. Guo, L. Sun, B. Liu, Y. Chen, T. Zhang, M. Wang, L. Peng and W. Yang, Colloids Surf., A, 2022, 635, 128083 CrossRef CAS.
- G. Zoppini, G. Targher and E. Bonora, J. Endocrinol. Invest., 2011, 34, 881–886 CrossRef CAS PubMed.
- B. Sriram, S. Kogularasu, S.-F. Wang and J.-K. J. Sheu, ACS Appl. Nano Mater., 2023, 6, 17593–17602 CrossRef CAS.
- H. Maseed, V. M. Reddy Yenugu, S. S. Devarakonda, S. Petnikota, M. Gajulapalli and V. Srikanth, ACS Appl. Nano Mater., 2023, 6, 18531–18358 CrossRef CAS.
- P. Balasubramanian, T. Balamurugan, S.-M. Chen, T.-W. Chen and T. Sathesh, ACS Sustainable Chem. Eng., 2018, 7, 5669–5680 CrossRef.
- Y. Zhao, S. Zhao, J. Huang and F. Ye, Talanta, 2011, 85, 2650–2654 CrossRef CAS PubMed.
- Y. Zhao, L. Liu, Y. Han, J. Bai, G. Du and Q. Gao, Chin. J. Chromatogr., 2011, 29, 146–151 CrossRef CAS.
- G. E. De Benedetto, D. Fico, A. Pennetta, C. Malitesta, G. Nicolardi, D. D. Lofrumento, F. De Nuccio and V. La Pesa, J. Pharm. Biomed. Anal., 2014, 98, 266–270 CrossRef.
- Y. Lan, F. Yuan, T. H. Fereja, C. Wang, B. Lou, J. Li and G. Xu, Anal. Chem., 2018, 91, 2135–2139 CrossRef PubMed.
- M. Stoytcheva, R. Zlatev, Z. Velkova, V. Gochev, G. Montero, L. Toscano and A. Olivas, Curr. Anal. Chem., 2017, 13, 89–103 CrossRef.
- B. Zheng, H. Xu, L. Guo, X. Yu, J. Ji, C. Ying, Y. Chen, P. Shen, H. Han and C. Huang, Engineering, 2020, 12, 90–100 CrossRef.
- S. K. Arumugasamy, S. Govindaraju and K. Yun, Appl. Surf. Sci., 2020, 508, 145294 CrossRef CAS.
- Y. Yang, M. Li and Z. Zhu, Talanta, 2019, 201, 295–300 CrossRef CAS PubMed.
- A. Düzgün, G. A. Zelada-Guillén, G. A. Crespo, S. Macho, J. Riu and F. X. Rius, Anal. Bioanal. Chem., 2011, 399, 171–181 CrossRef.
- P. Hassanzadeh, Gastroenterol. Hepatol. Bed Bench, 2010, 3, 105–107 Search PubMed.
- J.-F. Guan, J. Zou, Y.-P. Liu, X.-Y. Jiang and J.-G. Yu, Ecotoxicol. Environ. Saf., 2020, 201, 110872 CrossRef CAS.
- N. R. Devi, T. V. Kumar and A. K. Sundramoorthy, J. Electrochem. Soc., 2018, 165, G3112 CrossRef.
- M. Baniasadi, S. Jahani, H. Maaref and R. Alizadeh, Anal. Bioanal. Electrochem., 2017, 9, 718–728 CAS.
- P. Aiswaria, S. N. Mohamed, D. L. Singaravelu, K. Brindhadevi and A. Pugazhendhi, Chemosphere, 2022, 296, 133983 CrossRef PubMed.
- J. Kozak, K. Tyszczuk-Rotko, I. Sadok, K. Sztanke and M. Sztanke, Int. J. Mol. Sci., 2022, 23, 2429 CrossRef CAS.
- S. E. Elugoke, O. E. Fayemi, A. S. Adekunle, P.-S. Ganesh, S.-Y. Kim and E. E. Ebenso, J. Electroanal. Chem., 2023, 929, 117120 CrossRef CAS.
- J. P. Brenes, L. E. Arroyo-Mora and M. Barquero-Quirós, Sens. Bio-Sens. Res., 2022, 38, 100515 CrossRef.
- D. Mohanadas and Y. Sulaiman, J. Power Sources, 2022, 523, 231029 CrossRef CAS.
- N. Baig, M. Sajid and T. A. Saleh, TrAC, Trends Anal. Chem., 2019, 111, 47–61 CrossRef CAS.
- M. Sajid, M. K. Nazal, M. Mansha, A. Alsharaa, S. M. S. Jillani and C. Basheer, TrAC, Trends Anal. Chem., 2016, 76, 15–29 CrossRef CAS.
- S. Y. Lim, W. Shen and Z. Gao, Chem. Soc. Rev., 2015, 44, 362–381 RSC.
- S. Borna, R. E. Sabzi and S. Pirsa, J. Mater. Sci.: Mater. Electron., 2021, 32, 10866–10879 CrossRef CAS.
- X. Ran, Q. Qu, X. Qian, W. Xie, S. Li, L. Li and L. Yang, Sens. Actuators, B, 2018, 257, 362–371 CrossRef CAS.
- N. Amini, M. Shamsipur, M. B. Gholivand and A. Barati, Microchem. J., 2017, 131, 9–14 CrossRef CAS.
- R. M. Shereema, T. P. Rao, V. S. Kumar, T. Sruthi, R. Vishnu, G. Prabhu and S. S. Shankar, Mater. Sci. Eng., C, 2018, 93, 21–27 CrossRef CAS.
- S. Hua, Q. Huang, Y. Lin, C. Wei, Z. Ha, W. Zhang, Z. Guo, X. Bao, J. Shi and A. Hao, Electrochim. Acta, 2014, 130, 805–809 CrossRef.
- N. G. Mphuthi, A. S. Adekunle, O. E. Fayemi, L. O. Olasunkanmi and E. E. Ebenso, Sci. Rep., 2017, 7, 43181 CrossRef PubMed.
- F. Wang and S. Hu, Microchim. Acta, 2009, 165, 1–22 CrossRef CAS.
- Z. Arham and K. Kurniawan, Korean J. Chem. Eng., 2022, 1–6 Search PubMed.
- L. Yuan-Yuan, C. Meng-Ni, G. Yi-Li, Y. Jian-Mao, M. Xiao-Yu and L. Jian-Yun, Chin. J. Anal. Chem., 2015, 43, 1395–1401 Search PubMed.
- S. Mallakpour and E. Khadem, Chem. Eng. J., 2016, 302, 344–367 CrossRef CAS.
- V. Ribić, A. Rečnik, M. Komelj, A. Kokalj, Z. Branković, M. Zlatović and G. Branković, Acta Mater., 2020, 199, 633–648 CrossRef.
- S. E. Elugoke, O. E. Fayemi, A. S. Adekunle, B. B. Mamba, T. T. Nkambule and E. E. Ebenso, FlatChem, 2022, 100372 CrossRef CAS.
- H. Bagheri, N. Pajooheshpour, B. Jamali, S. Amidi, A. Hajian and H. Khoshsafar, Microchem. J., 2017, 131, 120–129 CrossRef CAS.
- T. A. Saleh, K. M. AlAqad and A. Rahim, J. Mol. Liq., 2018, 256, 39–48 CrossRef CAS.
- J. Yin, X. Chen and Z. Chen, Microchem. J., 2019, 145, 295–300 CrossRef CAS.
- Y. Li, R. Li, Z. Zhu, J. Liu, P. Pan, Y. Qi and Z. Yang, Microchem. J., 2022, 183, 108073 CrossRef CAS.
- Y. Li, B.-P. Zhang, J.-X. Zhao, Z.-H. Ge, X.-K. Zhao and L. Zou, Appl. Surf. Sci., 2013, 279, 367–373 CrossRef CAS.
- R. M. Silva, A. D. da Silva, J. R. Camargo, B. S. de Castro, L. M. Meireles, P. S. Silva, B. C. Janegitz and T. Silva, Biosensors, 2023, 13, 453 CrossRef CAS PubMed.
- H. Safardoust-Hojaghan, O. Amiri, M. Salavati-Niasari, M. Hassanpour, H. Khojasteh and L. K. Foong, J. Mol. Liq., 2020, 301, 112413 CrossRef CAS.
- R. Al-Gaashani, S. Radiman, A. Daud, N. Tabet and Y. Al-Douri, Ceram. Int., 2013, 39, 2283–2292 CrossRef CAS.
- B. Wu, L. Xiao, M. Zhang, C. Yang, Q. Li, G. Li, Q. He and J. Liu, J. Solid State Chem., 2021, 296, 122023 CrossRef CAS.
- S. Zhang, P. Ling, Y. Chen, J. Liu, C. J. D. Yang and R. Materials, Diamond Relat. Mater., 2023, 135, 109811 CrossRef CAS.
- J. Liu, L. Sun, G. Li, J. Hu and Q. J. He, Mater. Res. Bull., 2021, 133, 111050 CrossRef.
- S. E. Elugoke, O. E. Fayemi, A. S. Adekunle, B. B. Mamba, T. T. Nkambule and E. E. Ebenso, FlatChem, 2022, 33, 100372 CrossRef CAS.
- Z. L. Pan, H. Guo, L. Sun, B. Q. Liu, Y. Chen, T. T. Zhang, M. Y. Wang, L. P. Peng and W. Yang, Colloids Surf., A, 2022, 635, 128083 CrossRef CAS.
- Y. Wu, P. Deng, Y. Tian, F. Magesa, J. Liu, G. Li and Q. He, J. Food Compos. Anal., 2019, 84, 103280 CrossRef CAS.
- D. Tecuapa-Flores, J. G. Hernández, I. A. R. Domínguez, D. Turcio-Ortega, J. Cruz-Borbolla and P. Thangarasu, J. Mol. Liq., 2022, 358, 119204 CrossRef CAS.
- M. Eryiğit, B. K. Urhan, H. Ö. Doğan, T. Ö. Özer and Ü. Demir, IEEE Sens. J., 2022, 22, 5555–5561 Search PubMed.
- Y. Hu, J. Zhou, P. H. Yeh, Z. Li, T. Y. Wei and Z. L. Wang, Adv. Mater., 2010, 22, 3327–3332 CrossRef CAS.
- C. Pan, R. Yu, S. Niu, G. Zhu and Z. L. Wang, ACS Nano, 2013, 7, 1803–1810 CrossRef CAS.
- X. Wang, M. Zhao, H. Li, Y. Song and S. Chen, Electrochimica Acta, 2017, 249, 173–178 CrossRef CAS.
- E. D. Tecuapa-Flores, J. G. Hernández, P. Roquero-Tejeda, J. A. Arenas-Alatorre and P. Thangarasu, Analyst, 2021, 146, 7653–7669 RSC.
- R. R. Poolakkandy, A. R. Neelakandan, M. F. Puthiyaparambath, R. G. Krishnamurthy, R. Chatanathodi and M. M. Menamparambath, J. Mater. Chem., 2022, 10, 3048–3060 CAS.
- M. Salomäki, L. Marttila, H. Kivelä, T. Ouvinen and J. Lukkari, J. Phys. Chem. B, 2018, 122, 6314–6327 CrossRef PubMed.
- K. Shang, S. Wang, S. Chen and X. Wang, Biosensors, 2022, 12, 588 CrossRef CAS PubMed.
- D. Lakshmi, M. J. Whitcombe, F. Davis, P. S. Sharma and B. B. Prasad, Electroanalysis, 2011, 23, 305–320 CrossRef CAS.
- X. Zhang, Y.-C. Zhang and L.-X. Ma, Sens. Actuators, B, 2016, 227, 488–496 CrossRef CAS.
- X. Zheng, X. Zhou, X. Ji, R. Lin and W. Lin, Sens. Actuators, B, 2013, 178, 359–365 CrossRef CAS.
- J. Chen, P. He, H. Bai, S. He, T. Zhang, X. Zhang and F. Dong, Sens. Actuators, B, 2017, 252, 9–16 CrossRef CAS.
- M. Algarra, A. González-Calabuig, K. Radotić, D. Mutavdzic, C. Ania, J. M. Lázaro-Martínez, J. Jimenez-Jimenez, E. Rodríguez-Castellón and M. Del Valle, Talanta, 2018, 178, 679–685 CrossRef CAS PubMed.
- M. Ganesan, K. D. Ramadhass, H.-C. Chuang and G. Gopalakrishnan, J. Mol. Liq., 2021, 331, 115768 CrossRef CAS.
- Q. Huang, S. Hu, H. Zhang, J. Chen, Y. He, F. Li, W. Weng, J. Ni, X. Bao and Y. Lin, Analyst, 2013, 138, 5417–5423 RSC.
- X. Zhuang, H. Wang, T. He and L. Chen, Microchim. Acta, 2016, 183, 3177–3182 CrossRef CAS.
- Q. Li, Z. Xu, W. Tang and Y. Wu, Anal. Lett., 2015, 48, 2040–2050 CrossRef CAS.
- W. Yang and W. J. Mortier, J. Am. Chem. Soc., 1986, 108, 5708–5711 CrossRef CAS PubMed.
- A. D. Becke, Phys. Rev. A, 1988, 38, 3098–3100 CrossRef CAS PubMed.
- C. T. Lee, W. T. Yang and R. G. Parr, Phys. Rev. B: Condens. Matter Mater. Phys., 1988, 37, 785–789 CrossRef CAS PubMed.
- V. Ribic, A. Recnik, M. Komelj, A. Kokalj, Z. Brankovic, M. Zlatovic and G. Brankovic, Acta Mater., 2020, 199, 633–648 CrossRef CAS.
- L. M. G. Rojas, C. A. Huerta-Aguilar, E. D. Tecuapa-Flores, D. S. Huerta-José, P. Thangarasu, J. S. Sidhu, N. Singh and M. d. l. L. C. Téllez, J. Mol. Liq., 2020, 319, 114107 CrossRef.
- Y. Wu, D. B. Zhang, Z. Zhao, J. Pei and B. P. Zhang, J. Eur. Ceram. Soc., 2021, 41, 1324–1331 CrossRef CAS.
- R. Borgohain, R. Das, B. Mondal, V. Yordsri, C. Thanachayanont and S. Baruah, IEEE Sens. J., 2018, 18, 7203–7208 CAS.
- R. L. Martin, J. Chem. Phys., 2003, 118, 4775–4777 CrossRef CAS.
- F. Ianesko, C. Alves de Lima, C. Antoniazzi, E. R. Santana, J. V. Piovesan, A. Spinelli, A. Galli and E. Guimarães de Castro, Electroanalysis, 2018, 30, 1946–1955 CrossRef CAS.
- C. A. Huerta-Aguilar, V. Palos-Barba, P. Thangarasu and R. T. Koodali, Chemosphere, 2018, 213, 481–497 CrossRef CAS PubMed.
- W. Cai, T. Zhang, M. Xu, M. Zhang, Y. Guo, L. Zhang, J. Street, W.-J. Ong and Q. Xu, J. Mater. Chem. C, 2019, 7, 2212–2218 RSC.
- S. Sharma, A. Umar, S. K. Mehta, A. O. Ibhadon and S. K. Kansal, New J. Chem., 2018, 42, 7445–7456 RSC.
Footnote |
| † Electronic supplementary information (ESI) available. See DOI: https://doi.org/10.1039/d3an01467c |
| This journal is © The Royal Society of Chemistry 2024 |


