A nanozyme-reinforced injectable photodynamic hydrogel for combating biofilm infection†
Junqing
Zhang
a,
Shuang
Zhao
a,
Shen
Zhang
a,
Hao
Zhu
a,
Yaoxin
Zhang
a,
Linpei
Li
a,
Chaoqun
Liu
 *ab and
Jiahua
Shi
 *a
*a
aSchool of Pharmacy, Key Laboratory of Natural Medicine and Immune-Engineering of Henan Province, Henan University, Kaifeng, 475004, P. R. China. E-mail: cqliu@henu.edu.cn; sjiahua@henu.edu.cn
bDepartment of Pharmacy, The First Affiliated Hospital of Henan University, Kaifeng, 475001, P. R. China
First published on 4th October 2023
Abstract
Bacterial biofilm-associated infectious diseases remain serious menaces to human health. Recently, photodynamic therapy (PDT) has become a prospective strategy for combating biofilm infection. However, anaerobic conditions in a biofilm greatly inhibit its therapeutic efficacy. Here, a nanozyme-reinforced injectable hydrogel is prepared using Ca2+-crosslinked sodium alginate incorporated with photosensitizer-loaded MnO2 nanosheets and CaO2 nanoparticles for O2 self-sufficient PDT to eradicate biofilm infection. In our design, CaO2 reacts with water to produce locally concentrated H2O2, which could be catalyzed by MnO2 nanosheets (catalase-mimic nanozymes) to generate O2 and greatly relieve the hypoxic conditions in the biofilm, thus significantly strengthening PDT efficacy. In vitro assays confirmed that the hybrid hydrogel not only exhibits high-performance bactericidal activity in combating both Gram-positive Staphylococcus aureus and Gram-negative Escherichia coli but also shows great efficacy in eliminating biofilm infection. Moreover, benefiting from its good syringeability, the hybrid hydrogel is prone to fit irregular wounds and exhibits high efficiency in promoting wound healing in a biofilm-infected mice model. Besides, no obvious toxicity is detected in the hybrid hydrogel. Overall, we envision that our designed hydrogel could provide a prospective solution for combating biofilm-associated infections.
Introduction
Bacterial infection is increasingly becoming an international security issue and endangering the health of human beings.1–5 Antibiotics are still the most widely recognized treatment for bacterial infections in clinics.6,7 However, the formation of bacterial biofilms intensifies the drug resistance tendency.8,9 A biofilm is a dense and sticky membranoid substance formed by bacteria and extracellular polymer substance (EPS), including extracellular DNA, proteins, and exopolysaccharides.10,11 The EPS can not only serve as a shielded parclose to restrain antibiotics’ infiltration but also make antibiotics ineffective through specific enzymes.12,13 Hence, bacteria in biofilms can resist antibiotics 1000 times better than planktonic bacteria.14,15 Consequently, there is an urgent need to develop promising therapeutic strategies to combat biofilm infection.Photodynamic therapy (PDT) is a novel therapeutic strategy for treating bacterial biofilm infection.16,17 This strategy utilizes light-irradiated photosensitizers to produce potent reactive oxygen species (ROS) with the assistance of oxygen (O2) for oxidizing and killing bacteria,18,19 offering more advantages such as spatiotemporal controllability, strong specificity and little drug resistance compared to antibiotic therapy.20 However, PDT efficiency is severely limited due to the anaerobic microenvironment of the bacterial biofilm.21 Recently, nanozymes have attracted growing interest on account of their excellent stability against harsh environments, low-cost synthesis and adjustable catalytic activities compared to natural enzymes.22 Notably, catalase-mimic MnO2 nanozymes have emerged as prominent nanodrugs for supplying O2 for enhanced PDT, and exhibit good enzymatic activity and benign biocompatibility.23 Unfortunately, the H2O2 concentration in biofilms is too low to supply enough O2.24 Although exogenous H2O2 could be added to the biofilm to increase the H2O2 amount, superfluous H2O2 tends to cause injury to healthy tissues.25,26 Recently, glucose oxidase has been applied to boost the H2O2 amount; however, the complex preparation procedure and high-cost limited its further application.27,28 Hence, there is an urgent need to construct a facile and efficacious O2 self-sufficient nanozyme-based nanoplatform for improving PDT efficacy in combating biofilm infection.
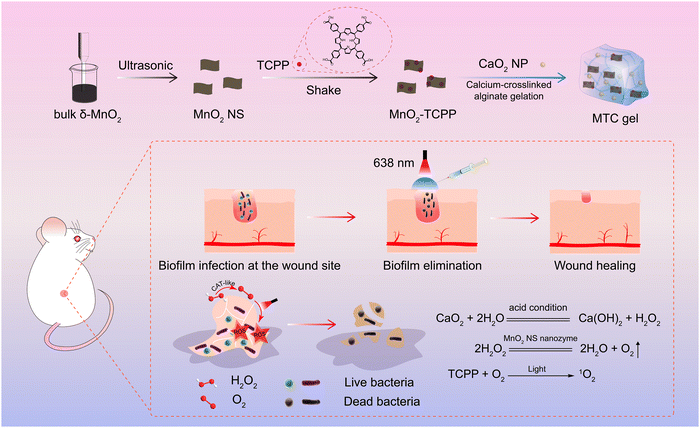
Here, a nanozyme-reinforced injectable hydrogel is constructed using Ca2+-crosslinked sodium alginate incorporated with photosensitizer (meso-tetra (4-carboxyphenyl) porphine) (TCPP)-loaded MnO2 nanosheets (MnO2-TCPP) and CaO2 nanoparticles (CaO2 NP) for O2 self-sufficient PDT to eliminate biofilm infection. Herein, Ca2+-crosslinked sodium alginate is selected as the matrix of the injectable hydrogel for storing MnO2-TCPP and CaO2 NP due to its easy preparation, good syringeability and excellent biocompatibility, which can be utilized to filling and adhering on various biofilm-infected sites.29,30 As illustrated in Scheme 1, CaO2 NPs are hydrolyzed by water to H2O2 under acidic conditions, thus supplying enough H2O2 as a substrate of the MnO2 nanosheet (MnO2 NS) nanozyme for generating O2, thereby greatly strengthening PDT efficacy. Of note, the hybrid hydrogel (MTC gel) exhibits high-performance in combating bacteria and biofilm infections both in vitro and in a biofilm-infected mice model. Meanwhile, the confined environment of our designed hydrogel makes it easy to remove all the components from the wound after treatment, thereby reducing potential residual toxicity created by the ingredients. Taken together, our designed MTC gel shows huge potential in treating biofilm infection.
Experimental section
Materials
Tetramethyl ammonium pentahydrate (TMAOH·5H2O), manganese chloride anhydrous (MnCl2), photosensitizer (meso-tetra (4-carboxyphenyl) porphine) (TCPP), PEG-200, H2O2 solution, ammonia solution and crystal violet were provided by Sinopharm (Beijing, China). Nutrient agar, trypticase soy broth (TSB) and Dulbecco's modified eagle medium (DMEM) were obtained from Aoboxing Biotechnology (Beijing, China). H2O2 test kits, catalase activity test kits, CaCl2 and alginate were acquired from Macklin Biochemical (Shanghai, China). Fluorescent diacetate (FDA), propidium iodide (PI) and 2′, 7′-dichlorofluorescein diacetate (DCFH-DA) were provided by Solarbio (Beijing, China). Enzyme-linked immunosorbent assay (ELISA) kits of interleukin 6 (IL-6) and tumor necrosis factor-α (TNF-α) were purchased from Enzyme-linked Biotechnology (Shanghai, China). Staphylococcus aureus (S. aureus) (ATCC 25923) and Escherichia coli (E. coli) (ATCC 25922) strains were obtained from Chuanxiang Biotechnology (Shanghai, China). All the reagents were used without further purification.Preparation of MnO2 NS and MnO2-TCPP
The MnO2 NS was synthesized by chemical oxidation of Mn2+ ions based on a previous method with minor modifications.31–33 Briefly, TMAOH·5H2O (2.2 g) was dissolved in H2O2 (20 mL, 3 wt%). Next, the above solution was quickly transferred into MnCl2 solution (10 mL, 0.3 M) with fast stirring at 1000 rpm. Subsequently, the above solution was reacted at 500 rpm for 0.5 day at 25 °C. Dark brown solution was collected by centrifuging at 2000 rpm for 300 s to obtain a black sediment, which was then rinsed with H2O 3 times and ethanol 2 times, and then dried by lyophilization for 12 h to obtain bulk δ-MnO2. To synthesize the MnO2 NS, bulk δ-MnO2 was dissolved in deionized water (10 mg mL−1) and sonicated in a probe sonicator (VCX 800, 20 kHz) for 120 min. Finally, the above mixture was centrifuged at 5000 rpm for 600 s to discard the un-exfoliated products at the bottom. The MnO2 NS in the supernatants was lyophilized and kept in a refrigerator.For preparing MnO2-TCPP, MnO2 NS (10 mg) and TCPP (5 mg) were dissolved in a mixed solution of DMF and water (40 mL, V![[thin space (1/6-em)]](https://www.rsc.org/images/entities/char_2009.gif) :
:![[thin space (1/6-em)]](https://www.rsc.org/images/entities/char_2009.gif) V = 1
V = 1![[thin space (1/6-em)]](https://www.rsc.org/images/entities/char_2009.gif) :
:![[thin space (1/6-em)]](https://www.rsc.org/images/entities/char_2009.gif) 1) and stirred at 25 °C under dark conditions overnight. The dark-purple precipitate (MnO2-TCPP) was collected via centrifugal separation (6000 rpm, 600 s) and rinsed with water and EtOH, separately. After collecting the washing solutions, TCPP loading efficacy was determined via UV-Vis spectroscopy.
1) and stirred at 25 °C under dark conditions overnight. The dark-purple precipitate (MnO2-TCPP) was collected via centrifugal separation (6000 rpm, 600 s) and rinsed with water and EtOH, separately. After collecting the washing solutions, TCPP loading efficacy was determined via UV-Vis spectroscopy.
Synthesis of CaO2 NP
To prepare CaO2 NPs,34 PEG-200 (40 mL) was added to the CaCl2 solution (10 mL, 100 mg mL−1) and stirred for 10 min. Next, H2O2 (1.5 mL, 30%) and ammonia solution (1.5 mL, 28%) were added in sequence to the above solution and stirred at 25 °C for 120 min. Finally, CaO2 NPs were acquired by centrifuging the above mixture and washing with methanol several times. The obtained CaO2 NP was kept at 4 °C before use.Synthesis of MTC gel
CaCl2 solution (0.1 M, 0.4 mL) was blended with sodium alginate solution (3 wt%, 5 mL) with gentle manual stirring at room temperature to prepare a colorless Ca-alginate hydrogel (Blank gel).35 Sodium alginate solution incorporated with MnO2-TCPP and CaO2 NPs was blended with CaCl2 solution to acquire a hybrid Ca-alginate hydrogel mixed with MnO2-TCPP and CaO2 NPs, named MTC gel. Similarly, MnO2 gel (Ca-alginate hydrogel only blended with MnO2 gel), MT gel (Ca-alginate hydrogel only blended with MnO2-TCPP), CaO2 gel (Ca-alginate hydrogel only blended with CaO2 NP) and MC gel (Ca-alginate hydrogel blended with MnO2 NS and CaO2 NP) were acquired in the same manner, respectively. The concentrations of MnO2 NS, MnO2-TCPP and CaO2 were 100 μg/ mL−1.Characterization
Scanning electron microscopy (SEM) images and energy dispersive spectrometry (EDS) spectra were obtained on a Hitachi S-4800 FESEM. Transmission electron microscopy (TEM) images were acquired with a FEI Tecnai G2 F20 with an accelerating voltage of 100 keV. X-Ray diffraction (XRD) analysis was carried out using a Bruker D8 Advance diffractometer with Cu Kα radiation. Atomic force microscopy (AFM) analysis was conducted at Oxford Instruments Asylum Research Inc. The zeta potential was measured using a Malvern Zetasizer Nano ZS90. The UV-Vis spectra were obtained from a Shimadzu UV-2600 UV-Vis spectrophotometer. X-Ray photoelectron spectroscopy (XPS) plots were recorded on a VG Scientific ESCALab 220i-XL electron spectrometer. The O2 amount was measured using a commercial JPB-607A portable dissolved oxygen meter. Fluorescence images were captured on an Olympus BX-51 fluorescence microscope.Rheological analysis of MTC gel
The rheological properties of MTC gel were detected by employing a DHR-2 rheometer. Strain sweep and frequency sweep tests were conducted to estimate the storage modulus (G′) and loss modulus (G′′). More specifically, the strain sweep test was conducted over a strain range from 0.1 to 1000% with a frequency of 10 rad s−1. The frequency sweep experiments were conducted within a frequency range of 1–100 rad s−1 under a strain of 1%.Swelling ratio of MTC gel
MTC gel was immersed in PBS at 37 °C for 10 min and subsequently dried in a vacuum oven at 37 °C for 24 h. Subsequently, swollen MTC gel was taken out and excess water was eliminated using filter paper. The swelling ratio of the hydrogel could be determined based on the following formula:where Wt and Wi represent the weight of the swollen MTC gel and the weight of the initial MTC gel, respectively.
H2O2 generation from CaO2 NPs
CaO2 NPs can be hydrolyzed to H2O2 under slightly acidic conditions. To evaluate the H2O2 amount, CaO2 NPs (100 μg mL−1) were placed in PBS (pH 5.3 or 7.4) solution and the H2O2 level was detected using a H2O2 test kit following the manufacturer's instructions.Determination of O2 generation
To evaluate the O2 generation ability, MnO2 NS (1 mL, 200 μg mL−1) or MnO2 gel (1 mL, containing 200 μg mL−1 MnO2 NS) was added to the H2O2 solution (1 mL, 1 M) in a centrifuge tube. Oxygen solubility (mg L−1) was continuously monitored using a commercial oxygen meter following the manufacturer's instructions. The O2 generation ability of the MTC gel (1 mL) was monitored in the same way by replacing the H2O2 solution with PBS (1 mL, pH 5.3).CAT-like activity and kinetics study of MnO2 NS
H2O2 could be decomposed to H2O and O2 with the assistance of MnO2 NS in a dose-dependent manner. The maximum initial velocity (Vmax) and Michealis–Menten constant (Km) of MnO2 NS were then evaluated using a Lineweaver–Burk plot:where V represents the initial velocity and [S] represents the concentration of the substrate, respectively.
Determination of ROS generation
2′,7′-Dichlorofluorescein diacetate (DCFH-DA) was utilized to evaluate the ROS production capacity of MTC gel. Specifically, the NaOH solution (2 mL, 0.01 M) was blended with DCFH-DA (0.5 mL) in DMSO to hydrolyze DCFH-DA to DCFH in the dark for 0.5 h at 25 °C. After that, the PBS (10 mL, pH 7.4) was added to the above solution to obtain a DCFH stock solution. Subsequently, MTC gel was mixed with DCFH (10 μM) and incubated in the dark at 37 °C for 0.5 h. Then, the mixture was irradiated with or without visible light (638 nm, 0.65 W cm−2, 600 s). Subsequently, the solution was centrifuged, and the supernatant fluorescence intensity was measured using a fluorescence spectrophotometer.Intracellular ROS detection of MTC gel
Intracellular ROS generation in bacteria was assessed using DCFH-DA as a fluorescent probe. Bacterial solution (1 mL, 106 CFU mL−1) was stained with DCFH-DA (10 mM) in the dark at 37 °C for 0.5 h. Then, the bacterial suspension was rinsed three times with PBS. After that, the above suspensions were treated with blank gel, MnO2 gel, MT gel, CaO2 gel, MC gel, and MTC gel with or without light illumination (638 nm, 0.65 W cm−2, 600 s), respectively. Finally, bacterial suspensions were spread on glass substrates and imaged using a fluorescence microscope.Antibacterial assays
The antibacterial efficiency of the MTC gel was evaluated by selecting Gram-positive S. aureus and Gram-negative E. coli as model bacteria. Bacteria were cultivated in LB medium to restore their proliferative and metabolic capacity. Subsequently, bacteria were harvested by centrifugation, and the bacterial concentration was adjusted with PBS (pH 5.3). Then the above bacterial suspensions (1 mL, 106 CFU mL−1) were treated with Blank gel, MnO2 gel, MT gel, CaO2 gel, MC gel, and MTC gel with or without laser illumination (638 nm, 0.65 W cm−2, 10 min), respectively. Next, the above suspensions were cultivated at 37 °C before testing the OD600![[thin space (1/6-em)]](https://www.rsc.org/images/entities/char_2009.gif) nm. Finally, bacterial suspensions (100 μL) were evenly spread on the agar plate and cultured at 37 °C for 12 h, and the formed bacterial colonies were counted and photographed.
nm. Finally, bacterial suspensions (100 μL) were evenly spread on the agar plate and cultured at 37 °C for 12 h, and the formed bacterial colonies were counted and photographed.
Live/dead staining analysis was conducted to evaluate the bacterial condition. FDA (live, green) and PI (dead, red) were added to the above bacterial suspensions and kept for 0.5 h. Subsequently, the stained bacteria were obtained by centrifugal separation and rinsed with PBS 3 times.
In vitro biofilm inhibition assay
To culture biofilms, S. aureus was incubated in liquid tryptic soy broth (TSB) culture medium (20 mL) and grown overnight at 37 °C by shaking. The diluted S. aureus solution (1 mL, 106 CFU mL−1) was placed in 24 well plates and cultivated for 1 day at 37 °C by shaking to acquire a biofilm. The medium was removed and replaced with new medium every 24 h, and each well was rinsed with sterile PBS buffer (1 mL, pH 5.3) to eliminate unbound bacteria.To determine the antibiofilm activity of MTC gel in vitro, a bacterial biofilm was treated with various hydrogels with or without laser illumination (638 nm, 0.65 W cm−2, 600 s). Subsequently, the bacteria were separated from various treatments via slight sonication for 30 min, diluted 100 times and cultured on agar plates at 37 °C overnight to count colonies.
To measure the biomass of the biofilm, 1 mL of crystal violet dye (0.2%) was added to the biofilm-seeded 24 well plate containing various hydrogels. After 10 min of irradiation, the medium was abandoned and the biofilm was rinsed with PBS. After diluting with 0.5 mL of 95% ethanol, biofilm biomass was quantified at OD590![[thin space (1/6-em)]](https://www.rsc.org/images/entities/char_2009.gif) nm.
nm.
A live/dead staining assay was conducted to visually observe the bacterial condition in the biofilm. After treatment with various groups, the remaining biofilm was rinsed 3 times with PBS and stained with FDA (10 μg mL−1) and PI (1 μg mL−1) in the dark for 30 min. Finally, the biofilm rinsed with PBS to eliminate dye and monitored using a fluorescence microscope.
To study the changes of bacterial morphology, after treatment with various groups, the biofilm was fixed by 2.5% glutaraldehyde solution at 4 °C overnight and dehydrated with 30%, 50%, 70%, 80%, 90% and 100% ethanol in turn. Afterwards, SEM was conducted to detect the bacterial morphology.
Hemolysis assay
For evaluating the blood compatibility of the hydrogel, fresh mice blood samples were collected and red blood cells (RBC) were harvested by centrifugal separation (2000 rpm, 600 s). Next, RBCs were dispersed in PBS, and then MTC gel (containing various concentrations of MnO2-TCPP) was incubated with 2 mL of RBC suspensions at 37 °C for 4 h and then centrifuged at 2000 rpm for 10 min. Finally, the supernatant absorbance was recorded at OD540![[thin space (1/6-em)]](https://www.rsc.org/images/entities/char_2009.gif) nm. The hemolysis ratio of blood cells was obtained according to the formula below:
nm. The hemolysis ratio of blood cells was obtained according to the formula below:where AM (MTC gel group), AC (control group) and AP (positive group) are the absorbance values of RBC samples treated with MTC gel, PBS and deionized water, respectively.
Cytotoxicity assay
For estimating the cytotoxicity of MTC gel, gel leachate was obtained first by incubating MTC gel (containing various concentrations of MnO2-TCPP) with DMEM (1 mL) at 37 °C overnight. Next, L929 cells were seeded on a 96 well cell plate with 1 × 10⁴ cells per well overnight, followed by replacing it with the above medium. After incubating for 24 h, the medium was discarded and the cells were rinsed several times with PBS. Subsequently, MTT solution (10%) in DMEM was added to each well and incubated for 4 h. Then, the supernatant was abandoned and DMSO (100 μL) was added. Finally, a microplate reader was utilized to detect the absorbance value with a detection wavelength of 570 nm and a reference wavelength of 630 nm.In vivo anti-biofilm infection experiments
Kunming mice (about 20 g) were purchased from the Medical Animal Center of Zhengzhou University (Zhengzhou, China). All animal experiments approved by the Animal Care and Use Committee of Henan University (Kaifeng, China). To assess whether 638 nm was enough to penetrate the skin tissue biofilm for generating ROS, pork tissue (1 mm) was placed above the MTC gel solution (containing ROS probe DCFH), and subsequently, the pork tissue was irradiated with or without visible light (638 nm, 0.65 W cm−2, 600 s). The supernatant fluorescence intensity was measured using a fluorescence spectrophotometer. As for the treatment process, mice were first randomly divided into 14 groups (n = 5): (I) PBS, (II) Blank gel, (III) MnO2 gel, (IV) MT gel, (V) CaO2 gel, (VI) MC gel, (VII) MTC gel, (VIII) PBS + Light, (IX) Blank gel + Light, (X) MnO2 gel + Light, (XI) MT gel + Light, (XII) CaO2 gel + Light, (XIII) MC gel + Light and (XIV) MTC gel + Light. Next, full-thickness skin wounds with a diameter of 6 mm were created on mice back and inoculated with S. aureus suspension (100 μL, 106 CFU mL−1) for 1 day to establish the S. aureus-biofilm-infected wound model. After that, all above wounds were treated with various groups and covered with gauzes for 1 day. The wound sites for light-irradiated groups were subjected to irradiation (638 nm, 0.65 W cm−2, 10 min). During the treatments, wound areas were photographed on day 0, 3, 6, 9 and 12 to evaluate wound healing efficiency. Mice weights were also measured daily. Lastly, to assess the antibiofilm efficacy of MTC gel, all mice were sacrificed on day 12 and the wound tissues were separated, immersed in PBS and bacterial growth was evaluated using a plate coating method. Moreover, wound tissues were stained with crystal violet, rinsed with ethanol and placed into a 24 well plate. To observe the inflammation and epidermal regeneration in the wound area, wound tissues were subjected to hematoxylin and eosin (H & E) and Masson staining for histology analysis, and immunohistochemical staining of IL-6 and TNF-α. Finally, the levels of inflammatory factors (IL-6 and TNF-α) were quantified through commercial ELISA kits.To evaluate the biosafety of hydrogels, major organs of mice were harvested and the collected tissues were fixed with 4% paraformaldehyde and embedded in paraffin, sectioned, and stained with H&E for further histology analysis. Moreover, blood samples of various groups were collected to conduct a blood routine test and blood biochemical analysis.
Statistical analysis
All data in this article were reported as mean result ± standard deviation. Statistical evaluation was conducted via analysis of variance (Student's t-test) using Origin 8.0 software. A p-value < 0.05 was considered statistically significant.Results and discussion
Fabrication and characterization of MnO2 NS, MnO2-TCPP and CaO2 NPs
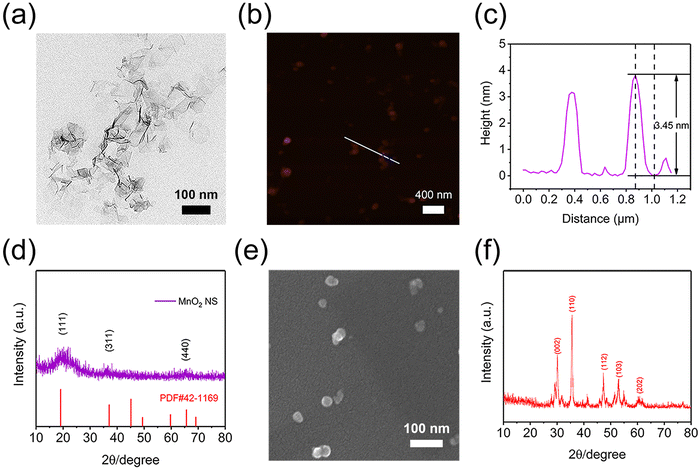
A two-dimensional MnO2 NS was prepared according to the previous report.32 As revealed by TEM, DLS and AFM, MnO2 NS exhibited a typical sheet structure with a hydrodynamic diameter of about 300 nm, while the thickness was around 3–4 nm (Fig. 1a–c and Fig. S1, S2, ESI†). Moreover, X-ray diffractometry (XRD) spectra and high-resolution TEM (HRTEM) images were further used to gain insight into the phase structures of the MnO2 NS powder sample (Fig. S3a, ESI†). The typical peaks of birnessite type of bulk δ-MnO2 and MnO2 NS were detected (Fig. 1d and Fig. S4, ESI†), and the lattice spacing of 0.24 nm in the HRTEM image (Fig. S5, ESI†) could be attributed to the (311) facet of the cubic phase MnO2 NS (JCPDS card no. 42-1169), which was in accordance with the related XRD pattern. Moreover, the MnO2 NS showed an absorption peak at 380 nm (Fig. S6, ESI†), this could be assigned to the d–d transition of Mn ions in MnO6 octahedra of the MnO2 NS.32,36 The above results confirmed the successful preparation of MnO2 NS. To load TCPP, MnO2 NS and TCPP were dispersed in a DMF/H2O mixed solution, stirred at 25 °C under dark conditions overnight and lyophilized to obtain MnO2-TCPP powder (Fig. S3b, ESI†). The TCPP loading efficacy was calculated to be 8.5% based on the standard curve of TCPP (Fig. S7, ESI†). The successful loading of TCPP was further confirmed by EDS and XPS. As shown in Fig. S8 and S9 (ESI†), a distinct enhancement of the N element was observed both in EDS and XPS spectra, which could be attributed to the inherent N element obtained from TCPP. Herein, it should be noted that a small amount of N element in MnO2 NS originated from tetramethylammonium hydroxide pentahydrate during the synthesis process. These results collectively proved that TCPP can effectively bind to MnO2 NS. Moreover, no obvious change in morphology was detected before and after TCPP binding (Fig. S10, ESI†), indicating that the loading of TCPP did not affect the sheet structure of MnO2 NS. As for CaO2 NPs (Fig. S3c, ESI†), the synthesized CaO2 NPs exhibited a consistent size distribution around 30 nm with a patchily spherical morphology (Fig. 1e). The XRD pattern of CaO2 indicated representative diffraction peaks at 30.3°, 35.5°, 47.2°, 47.2° and 60.3° (Fig. 1f), which was consistent with the reported literature studies,37 confirming that CaO2 NPs were successfully prepared.Preparation and characterization of injectable MTC gel
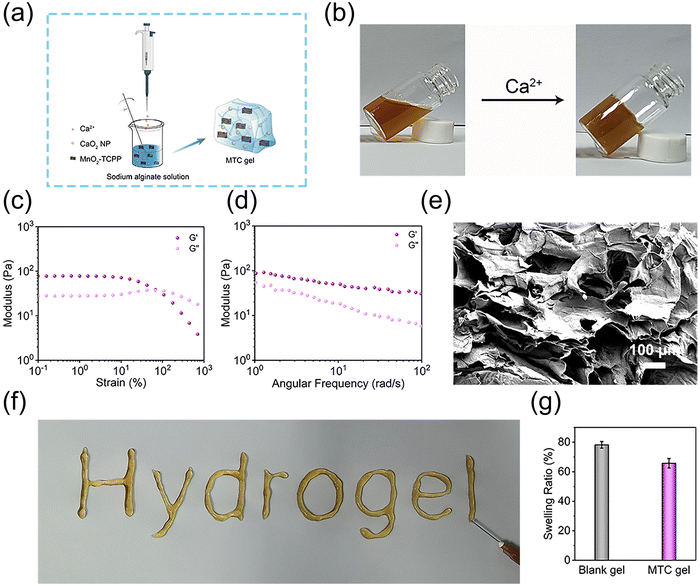
Injectable MTC gel was constructed using a Ca2+ crosslinked alginate solution incorporated with MnO2-TCPP and CaO2 NP (Fig. 2a). Here, a vial tilt test was utilized to evaluate the formation of MTC gel and the results showed that MTC gel exhibited a homogenous solid form (Fig. 2b and Fig. S11, ESI†). Subsequently, to evaluate the rheological performance and mechanical strength property of MTC gel, G′ and G′′ were assessed using the strain sweep test and frequency scanning test. As shown in Fig. 2c, at the beginning of measurement, G′ was larger than G′′, and with an increase in strain, G′ and G′′ converged at various points, signifying a transition from gel state to sol state, indicating that MTC gel was formed and its structure was intact and could bear relatively large deformations. Meanwhile, a liquid-like state hydrogel exhibited once the strain beyond 67.5% (G′′ > G′), indicating that MTC gel was suitable for injection. To further evaluate the rheological properties of MTC gel, G′ and G′′ were measured across a range of strain values (Fig. 2d), and the broad linear viscosity region confirmed the stability of the three-dimensional network in MTC gel. MTC gel with good mechanical properties could adapt to the stretch of irregular wound tissues. The characters “Hydrogel” could be smoothly written using a syringe equipped with a 21-gauge needle, which could visually prove the good injectable nature of MTC gel (Fig. 2f). Moreover, SEM images of the hybrid hydrogel presented in Fig. 2e clearly displayed its three-dimensional porous morphology. As the swelling feature of hydrogel is essential for the superficial wound healing process, the swelling ratio of MTC gel was evaluated after immersing it into PBS for 1 day, and the result was determined to be 65.75% (Fig. 2g), confirming that it owned some level of moisture absorption capacity.Generation of H2O2, O2 and ROS of MTC gel
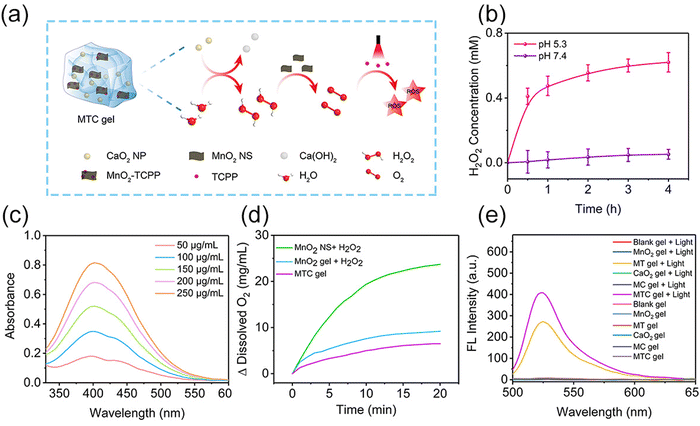
In MTC gel, CaO2 NPs could be hydrolyzed into H2O2 under slightly acidic conditions, and H2O2 could be served as the substrate of MnO2 nanozymes to produce O2 for enhancing the PDT efficiency, which is vividly described in Fig. 3a. Next, colorimetry was conducted to measure the H2O2 production behavior. As shown in Fig. 3b, c and Fig. S12 (ESI†), much more H2O2 was produced in PBS at pH 5.3 (simulating pH of biofilm-infected tissue) than that in PBS at pH 7.4 (simulating pH of healthy tissue), indicating that CaO2 NPs could induce H2O2 generation efficaciously at weak acid biofilm-infected tissue. Subsequently, a dissolved oxygen analyzer was utilized to evaluate the amount of O2 generation from MTC gel. As shown in Fig. 3d and Fig. S13 (ESI†), O2 could be effectively produced from MnO2 NS + H2O2, MnO2 gel + H2O2 and MTC gel, suggesting that the MnO2 NS kept its nanozyme activity in MTC gel. The detailed mechanism of MnO2 NS as a catalase-mimic is shown in Fig. S14 (ESI†), which was realized by the transformation of valence states in manganese.38,39 Next, an ammonium molybdate method was conducted to further evaluate the catalase mimic activity of MnO2 NS, as shown in Fig. S15 (ESI†), and the Michealis–Menten constant (Km) and maximum initial velocity (Vmax) were calculated by utilizing the Lineweaver–Burk plot, resulting in values of 70.76 μmol L−1 and 0.03384 μmol s−1, respectively. Finally, DCFH-DA was utilized to assess the ROS production ability of MTC gel. As shown in Fig. 3e, the light-irradiated MTC gel possessed better ROS generation property than light-irradiated MT gel, suggesting that O2 self-sufficient MTC gel may be useful for improving the PDT efficacy in treating hypoxic biofilm infection.Antibacterial activity in vitro
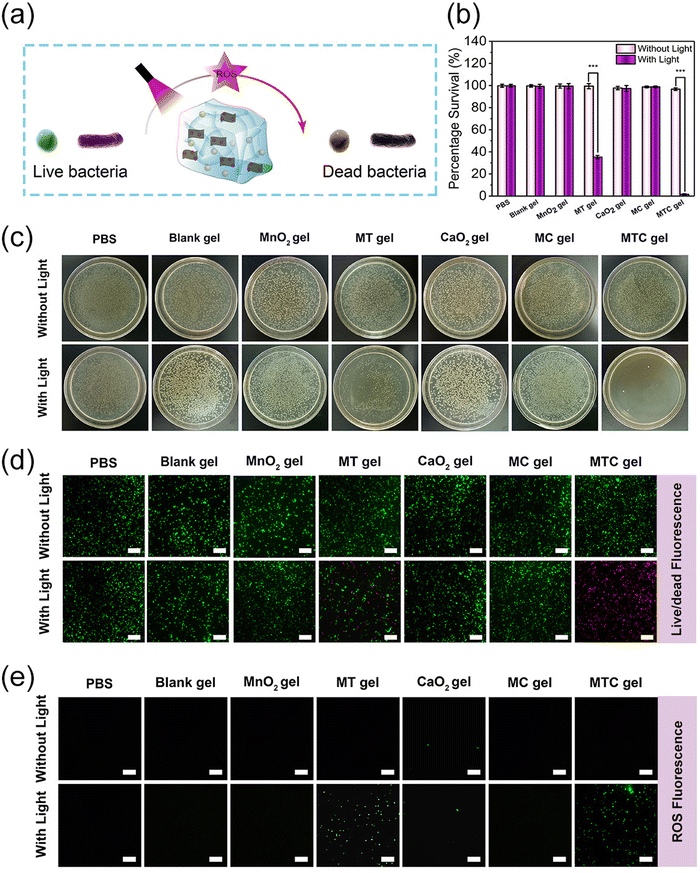
Having confirmed the good ROS production ability, the antibacterial properties of MTC gel against S. aureus and E. coli were evaluated through the growth inhibition assay, spread plate method, live/dead staining assay and intracellular ROS level analysis, and the antibacterial process is illustrated in Fig. 4a. The experimental groups were divided into 14 groups, including PBS, Blank gel, MnO2 gel (hydrogel doped only with MnO2 NS), MT gel (hydrogel doped with MnO2-TCPP), CaO2 gel (hydrogel doped only with CaO2 NP), MC gel (hydrogel doped with MnO2 NS and CaO2 NP) and MTC gel (hydrogel doped with MnO2-TCPP and CaO2 NP). Groups treated with light irradiation were expressed as PBS + Light, Blank gel + Light, MnO2 gel + Light, MT gel + Light, CaO2 gel + Light, MC gel + Light and MTC gel + Light, respectively. We first evaluated the antimicrobial ability of MTC gel on S. aureus, as shown in Fig. 4b, and no distinct bacterial-killing phenomenon was detected for PBS, PBS + Light, Blank gel, Blank gel + Light, MnO2 gel, MnO2 gel + Light, MT gel, MT gel + Light, CaO2 gel, CaO2 gel + Light, MC gel, MC gel + Light and MTC gel groups, indicating that all hydrogel groups possessed negligible activity. Moreover, for the MT gel + Light group, bacterial viability decreased to 52.3%, which was attributed to the photodynamic effect of TCPP. Remarkably, a strong bacterial inhibition behavior (99.2%) was detected for the MTC gel + Light group, confirming that the self-generation of O2 could greatly enhance the photodynamic effect of MTC gel by utilizing the catalase mimic property of MnO2 NS and H2O2 generation ability of CaO2. Furthermore, the spread plate method displayed similar results (Fig. 4c), suggesting that the light irradiation of MTC gel led to the lowest bacterial count. Additionally, a live/dead staining assay was conducted to further investigate the status of S. aureus. Green fluorescence represented live bacteria, while the red fluorescence indicated dead bacteria. As illustrated in Fig. 4d, in the MTC gel + Light group, nearly all bacteria showed red fluorescence, on the contrary, other groups displayed obvious green fluorescence, demonstrating that light illuminated MTC gel possessed best antimicrobial activity. Finally, DCFH-DA was utilized to evaluate the intracellular ROS level in S. aureus. As depicted in Fig. 4e, evident green fluorescence was detected for the MT gel + Light and MTC gel + Light group, and the MTC gel + Light group possessed stronger fluorescence, which was consistent with cell-free ROS detection results shown in Fig. 4e, confirming that the MTC gel + Light group showed excellent photodynamic effects. Similar bactericidal results could also be detected for E. coli (Fig. S16–S19, ESI†). Consequently, our designed O2 self-sufficient photodynamic MTC gel demonstrated superior broad-spectrum bactericidal ability upon light illumination.Anti-biofilm activity in vitro
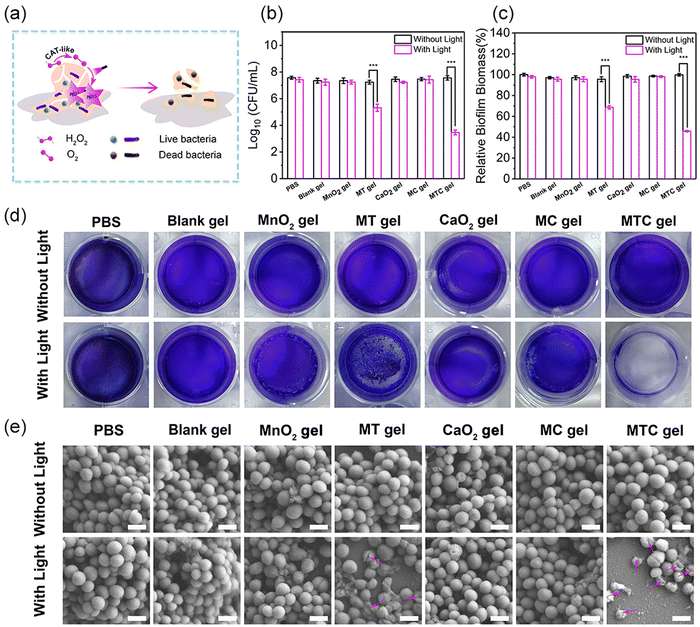
As light-irradiated MTC gel showed remarkable antibacterial efficiency in eliminating planktonic bacteria, we next evaluated the feasibility of MTC gel for combating biofilm infection in vitro. Herein, S. aureus and E. coli biofilms were chosen as two models to investigate the in vitro anti-biofilm behavior of MTC gel. The detailed antibiofilm process is shown in Fig. 5a. For S. aureus, first, a plate count assay was performed to assess the bacterial viability in the biofilm. As shown in Fig. 5b, no distinct changes in the colony-forming units (CFUs) were detected after coincubation with PBS, Blank gel, MnO2 gel, CaO2 gel and MC gel without or with light, respectively, indicating that these groups showed inappreciable antibiofilm activity. However, least CFUs were detected after coincubation with the MTC gel + Light group, and this could be attributed to the generation of a large amount of toxic ROS through an O2 self-sufficient PDT process. Furthermore, a live/dead bacterial cell staining assay was conducted to further assess the bacterial status in the biofilm (Fig. S20, ESI†). The results demonstrated that the MTC gel + Light group exhibited the most notable red fluorescent signal, which was consistent with the spread plate method results. To appraise the antibiofilm activity of MTC gel, biofilm biomass was quantified using a crystal violet stained colorimetric method. As depicted in Fig. 5c, S. aureus biofilm biomass was enormously reduced after coincubation with the MTC gel + Light group; also, Fig. 5d shows the photographs of the crystal violet stained biofilm and the results indicated that the biofilm color for the MTC gel + Light group was much lighter than the other groups, further confirming that light illuminated MTC gel could greatly improve in vitro antibiofilm potency. Finally, SEM characterization was employed to explore the bactericidal mechanism of MTC gel on S. aureus in the biofilm. As illustrated in Fig. 5e, no change in distinct bacterial morphology was observed for PBS, PBS + Light, Blank gel, Blank gel + Light, MnO2 gel, MnO2 gel + Light, MT gel, MT gel + Light, CaO2 gel, CaO2 gel + Light, MC gel, MC gel + Light and MTC gel groups, confirming that all hydrogel groups exhibited negligible toxicity toward S. aureus in the biofilm. Conversely, the morphology of S. aureus in the biofilm changed to a slightly rough and wrinkled morphology. However, treated with the MTC gel + Light group, the cells were seriously wrinkled and even collapsed, which might be attributed to the enhanced generated ROS that dramatically oxidize the S. aureus membrane. Similar biofilm elimination ability of MTC gel could be found for the E. coli-formed biofilm (Fig. S21–24, ESI†). These results demonstrated that MTC gel exhibited significant in vitro anti-biofilm ability toward both Gram-positive and Gram-negative bacteria-formed biofilms.In vivo treatment of biofilm infections
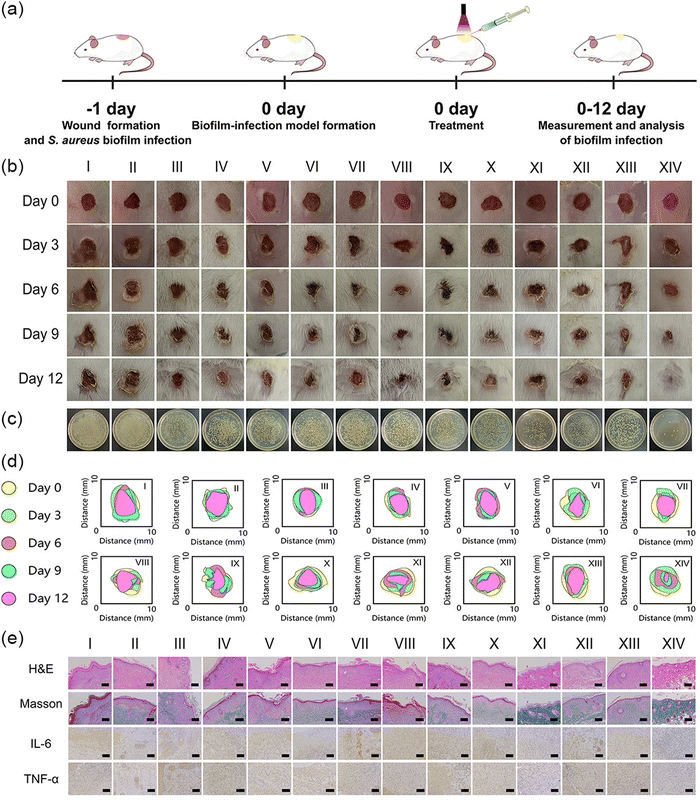
The distinguished anti-biofilm performance of MTC gel in vitro encouraged us to investigate its application as a biofilm eliminator in vitro. In this design, we first established a 6 mm diameter full-thickness S. aureus biofilm-infected mice wound model. The whole treatment process is depicted in Fig. 6a. Mice were randomly divided into 14 groups, containing PBS, Blank gel, MnO2 gel, MT gel, CaO2 gel, MC gel, MTC gel, PBS + Light, Blank gel + Light, MnO2 gel + Light, MT gel + Light, CaO2 gel + Light, MC gel + Light and MTC gel + Light. All hydrogels were wiped away 1 day after various treatments. We first assessed whether 638 nm was enough for skin wound biofilm penetration by applying pork tissue (1 mm) as a model. As shown in Fig. S25 (ESI†), the MTC gel + Light group showed much higher ROS fluorescence intensity than the other groups, indicating 638 nm was enough for biofilm penetration in our study. Next, mice wound conditions were evaluated. As illustrated in Fig. 6b, in control groups, mice wounds exhibited distinct skin inflammation and epidermal thickening, while the MTC gel + Light groups exhibited a minimum wound area with no significant ulcerative inflammation. Moreover, the treatment effect of MTC gel was also assessed by measuring the real-time variety of wound areas. As illustrated in Fig. 6c and Fig. S26 (ESI†), the MTC gel + Light group possessed the smallest wound area of 5.45%, confirming that the MTC gel + Light group exhibited superior wound closure effect. To appraise the antibiofilm ability of MTC gel, after 12 days treatment, mice wound tissues of various groups were harvested and a spread plate assay was conducted to assess the bacterial amount. As shown in Fig. 6c and Fig. S27 (ESI†), the MTC gel + Light group possessed least number of bacteria, while still plenty of bacteria could be detected for the other groups. Moreover, the antibiofilm ability of MTC gel in vivo was further evaluated by staining the wound tissue biofilm with crystal violet, rinsing with ethanol and placing it into a 24 well plate. As shown in Fig. S28 (ESI†), dark violet solutions could be found for control groups, while the color was very light for the MTC gel + Light group. These results were in accordance with in vitro biofilm biomass assays (Fig. 5c), showing that the MTC gel + Light group possessed best antibiofilm activity. At the same time, skin tissues were also stained by H&E to further investigate the skin regeneration ability of MTC gel. As depicted in Fig. 6e, following a 12-day treatment, H&E staining results indicated that the MTC gel + Light group-treated mice showed typical morphological features with healthy hair follicles and few inflammatory cells and granulation tissue edemas, demonstrating its good tissue reconstruction ability. Nevertheless, the other groups still presented distinct skin morphological characteristics of inflammatory cells’ infiltration and epithelial structure thickening, indicating poor wound healing ability. To gain more insight into the wound healing process of mice after treatments, inflammatory factors’ levels (IL-6 and TNF-α) in wound tissues were further evaluated by immumohistochemical staining and by using the ELISA kit. As illustrated in Fig. 6e and Fig. S29 (ESI†), much fewer inflammatory cells were observed and the release of proinflammatory mediators had shifted down obviously in light irradiated MTC gel, suggesting that the MTC gel + Light group could effectively control wound inflammation. Finally, Masson staining was conducted to assess collagen deposition in regenerated skin wound tissues (Fig. 6e). The highest collagen fiber content was disclosed in the MTC gel + Light treated wound skin, illustrating that the MTC gel + Light group possessed densely structured and organized collagen fibers. Conversely, collagen fibers in other groups appeared disorganized and had lower density. Based on the comprehensive analysis above, MTC gel as a moist dressing can provide a wet and healthy environment to effectively eliminate biofilm infection and accelerate wound healing in vivo.Biosafety evaluation
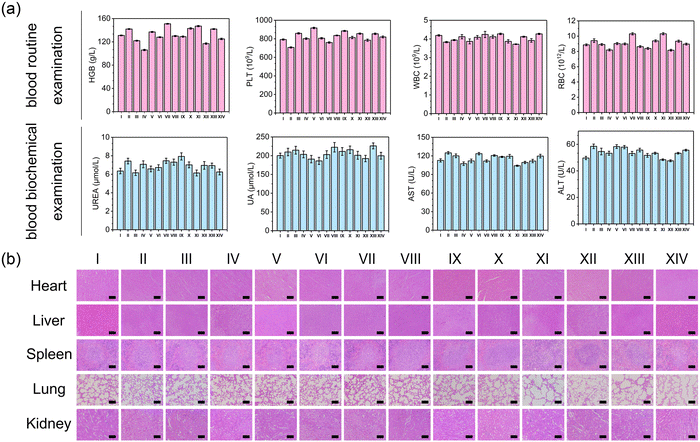
To assess the in vitro and in vivo biocompatibility of MTC gel, we conducted several experiments including hemolysis assay, cytotoxicity assay, weight monitoring, blood analysis and histological analysis. As depicted in Fig. S30 and S31 (ESI†), no significant hemolysis or cell toxicity was detected, indicating that MTC gel exhibited excellent cytocompatibility. For in vivo biocompatibility experiments, no notable change in body weight was observed (Fig. S32, ESI†), confirming that MTC gel did not influence mice growth. Moreover, blood routine examination, blood biochemistry and H&E staining were performed to assess the biosafety of MTC gel. As shown in Fig. 7, no apparent difference was detected between the MTC gel + Light treated group and other control groups, demonstrating that MTC gel exhibited negligible toxicity both in vitro and in vivo.Conclusions
In summary, an oxygen self-supplying nanozyme-based injectable hydrogel was constructed for reinforced PDT against biofilm infection. The results indicated that the MTC gel possess good mechanical properties and benign injectability. Moreover, benefitting from the good H2O2 generation ability of CaO2 NPs and benign catalase mimic properties of MnO2 NSs, MTC gel shows enhanced ROS production upon illumination. Both in vitro and in vivo results indicate that the MTC gel has excellent antibiofilm ability with no side effects on normal tissues. Overall, our designed injectable hydrogel may afford tremendous potential for treating bacterial infections.Author contributions
Junqing Zhang: conceptualization, methodology, investigation, validation, and writing-original draft. Shuang Zhao: validation, funding acquisition. Shen Zhang: investigation. Hao Zhu: investigation. Yaoxin Zhang: methodology. Linpei Li: methodology. Chaoqun Liu: conceptualization, supervision, writing review, editing, and funding acquisition. Jiahua Shi: conceptualization, supervision, editing, and funding acquisition.Conflicts of interest
The authors declare no conflicts of interest.Acknowledgements
This work was financially supported by the National Natural Science Foundation of China (grant no. 22307033, C. L.), the Medical Science and Technology Research Project of Henan Province (grant no. SBGJ202302090, C. L.), the China Postdoctoral Science Foundation (Grant no. 2021M701082, S. Z.), the Key Technologies R&D Program of Henan Province (grant no. 212102310231, C. L.; 222102310209, S. Z.) and the Open Project Program of Key Laboratory for Analytical Science of Food Safety and Biology, Ministry of Education (grant no. FS2204, C. L.).Notes and references
- C. Liu, S. Feng, L. Ma, M. Sun, Z. Wei, J. Wang, Z. Chen, Y. Guo, J. Shi and Q. Wu, ACS Appl. Mater. Interfaces, 2021, 13, 38029–38039 CrossRef CAS PubMed.
- S. Zhang, K. Guan, Y. Zhang, J. Zhang, H. Fu, T. Wu, D. Ouyang, C. Liu, Q. Wu and Z. Chen, Nano Res., 2023, 16, 5346–5356 CrossRef CAS.
- L. D. Blackman, Y. Qu, P. Cass and K. E. S. Locock, Chem. Soc. Rev., 2021, 50, 1587–1616 RSC.
- A. S. C. Gonçalves, M. M. Leitão, M. Simões and A. Borges, Nat. Prod. Rep., 2023, 40, 595–627 RSC.
- H. Zhu, X. Cheng, J. Zhang, Q. Wu, C. Liu and J. Shi, J. Mater. Chem. B, 2023, 11, 618–630 RSC.
- T. M. Uddin, A. J. Chakraborty, A. Khusro, B. M. R. M. Zidan, S. Mitra, T. B. Emran, K. Dhama, M. K. H. Ripon, M. Gajdács, M. U. K. Sahibzada, M. J. Hossain and N. Koirala, J. Infect. Public Heal., 2021, 14, 1750–1766 CrossRef PubMed.
- M. I. Hutchings, A. W. Truman and B. Wilkinson, Curr. Opin. Microbiol., 2019, 51, 72–80 CrossRef CAS PubMed.
- O. Ciofu, C. Moser, P. Ø. Jensen and N. Høiby, Nat. Rev. Microbiol., 2022, 20, 621–635 CrossRef CAS PubMed.
- T. F. Mah, Future Microbial., 2012, 7, 1061–1072 CrossRef CAS PubMed.
- A. Penesyan, I. T. Paulsen, S. Kjelleberg and M. R. Gillings, npj Biofilms Microbi., 2021, 7, 80 CrossRef CAS PubMed.
- A. Banerjee, P. Chowdhury, K. Bauri, B. Saha and P. De, Biomater. Sci-UK., 2023, 11, 11–36 RSC.
- A. K. Abdalla, M. M. Ayyash, A. N. Olaimat, T. M. Osaili, A. A. Al-Nabulsi, N. P. Shah and R. Holley, Front. Microbiol., 2021, 12, 664395 CrossRef PubMed.
- H. Huang, A. Ali, Y. Liu, H. Xie, S. Ullah, S. Roy, Z. Song, B. Guo and J. Xu, Adv. Drug Deliver. Rev., 2023, 192, 114634 CrossRef CAS PubMed.
- A. K. Tripathi, P. Thakur, P. Saxena, S. Rauniyar, V. Gopalakrishnan, R. N. Singh, V. Gadhamshetty, E. Z. Gnimpieba, B. K. Jasthi and R. K. Sani, Front. Microbio., 2021, 12, 754140 CrossRef PubMed.
- S. Qayyum and A. U. Khan, MedChemComm, 2016, 7, 1479–1498 RSC.
- M. Li, Y. Shao, J. H. Kim, Z. Pu, X. Zhao, H. Huang, T. Xiong, Y. Kang, G. Li, K. Shao, J. Fan, J. W. Foley, J. S. Kim and X. Peng, J. Am. Chem. Soc., 2020, 142, 5380–5388 CrossRef CAS PubMed.
- X. Sun, J. Sun, Y. Sun, C. Li, J. Fang, T. Zhang, Y. Wan, L. Xu, Y. Zhou, L. Wang and B. Dong, Adv. Funct. Mater., 2021, 31, 2101040 CrossRef CAS.
- F. F. Sperandio, Y. Y. Huang and M. R. Hamblin, Recent Pat. Antiinfect. Drug Discov., 2013, 8, 108–120 CrossRef CAS PubMed.
- P. P. Kalelkar, M. Riddick and A. J. García, Nat. Rev. Mater., 2022, 7, 39–54 CrossRef CAS PubMed.
- K. Villa, H. Sopha, J. Zelenka, M. Motola, L. Dekanovsky, D. C. Beketova, J. M. Macak, T. Ruml and M. Pumera, Small, 2022, 18, 2106612 CrossRef CAS PubMed.
- M. Wu, C. Chen, Z. Liu, J. Tian and W. Zhang, Acta Biomater., 2022, 142, 242–252 CrossRef CAS PubMed.
- Z. Wang, Y. Zhang, E. Ju, Z. Liu, F. Cao, Z. Chen, J. Ren and X. Qu, Nat. Commun., 2018, 9, 3334 CrossRef PubMed.
- Y. Dai, Y. Ding and L. Li, Chin. Chem. Lett., 2021, 32, 2715–2728 CrossRef CAS.
- A. Wang, G. Fan, H. Qi, H. Li, C. Pang, Z. Zhu, S. Ji, H. Liang, B.-P. Jiang and X.-C. Shen, Biomaterials, 2022, 289, 121798 CrossRef CAS PubMed.
- X. Liu, Z. Yan, Y. Zhang, Z. Liu, Y. Sun, J. Ren and X. Qu, ACS Nano, 2019, 13, 5222–5230 CrossRef CAS PubMed.
- H. Cui, M. Liu, W. Yu, Y. Cao, H. Zhou, J. Yin, H. Liu, S. Que, J. Wang, C. Huang, C. Gong and G. Zhao, ACS Appl. Mater. Interfaces, 2021, 13, 26800–26807 CrossRef CAS PubMed.
- D. Jiang, D. Ni, Z. T. Rosenkrans, P. Huang, X. Yan and W. Cai, Chem. Soc. Rev., 2019, 48, 3683–3704 RSC.
- H. Wang, W. Yang, X. Wang, L. Huang, Y. Zhang and S. Yao, Sens. Actuators, B, 2020, 304, 127389 CrossRef CAS.
- J. Saroia, W. Yanen, Q. Wei, K. Zhang, T. Lu and B. Zhang, Bio-Des. Manuf., 2018, 1, 265–279 CrossRef CAS.
- E. M. Ahmed, J. Adv. Res., 2015, 6, 105–121 CrossRef CAS PubMed.
- S. Wang, H. Zheng, L. Zhou, F. Cheng, Z. Liu, H. Zhang and Q. Zhang, Biomaterials, 2020, 260, 120314 CrossRef CAS PubMed.
- L. Yang, S.-T. D. Chueng, Y. Li, M. Patel, C. Rathnam, G. Dey, L. Wang, L. Cai and K.-B. Lee, Nat. Commun., 2018, 9, 3147 CrossRef PubMed.
- J. Zheng, W. Wang, X. Gao, S. Zhao, W. Chen, J. Li and Y.-N. Liu, Small, 2022, 18, 2205252 CrossRef CAS PubMed.
- S. Dong, Y. Chen, L. Yu, K. Lin and X. Wang, Adv. Funct. Mater., 2020, 30, 1907071 CrossRef CAS.
- J. Zhao, J. Li, C. Zhu, F. Hu, H. Wu, X. Man, Z. Li, C. Ye, D. Zou and S. Wang, ACS Appl. Mater. Interfaces, 2018, 10, 3392–3404 CrossRef CAS PubMed.
- K. Kai, Y. Yoshida, H. Kageyama, G. Saito, T. Ishigaki, Y. Furukawa and J. Kawamata, J. Am. Chem. Soc., 2008, 130, 15938–15943 CrossRef CAS PubMed.
- Y. Liu, S. Chi, Y. Cao and Z. Liu, ACS Appl. Nano Mater., 2022, 5, 2592–2602 CrossRef CAS.
- C. Tu, H. Lu, T. Zhou, W. Zhang, L. Deng, W. Cao, Z. Yang, Z. Wang, X. Wu, J. Ding, F. Xu and C. Gao, Biomaterials, 2022, 286, 121597 CrossRef CAS PubMed.
- A. Y. Sychev and V. Isak, Russ. Chem. Rev., 1993, 62, 279 CrossRef.
Footnote |
| † Electronic supplementary information (ESI) available. See DOI: https://doi.org/10.1039/d3tb01688a |
| This journal is © The Royal Society of Chemistry 2023 |

