 Open Access Article
Photoelectrochemical water oxidation by a MOF/semiconductor composite†
Bradley
Gibbons
 ,
Daniel R.
Cairnie
 ,
Benjamin
Thomas
 ,
Xiaozhou
Yang
 ,
Stefan
Ilic
 and
Amanda J.
Morris
 *
*
Department of Chemistry, Virginia Polytechnic Institute and State University, Virginia 24060, USA. E-mail: ajmorris@vt.edu; bgibbons@vt.edu; dcairnie@vt.edu; bthom7@vt.edu; xzyang@vt.edu; silic4@vt.edu
First published on 23rd March 2023
Abstract
Artificial photosynthesis is one of the most promising forms of renewable fuel production, due to the abundance of water, carbon dioxide, and sunlight. However, the water oxidation reaction remains a significant bottleneck due to the high thermodynamic and kinetic requirements of the four-electron process. While significant work has been done on the development of catalysts for water splitting, many of the catalysts reported to date operate at high overpotentials or with the use of sacrificial oxidants to drive the reaction. Here, we present a catalyst embedded metal–organic framework (MOF)/semiconductor composite that performs photoelectrochemical oxidation of water at a formal underpotential. Ru-UiO-67 (where Ru stands for the water oxidation catalyst [Ru(tpy)(dcbpy)OH2]2+ (tpy = 2,2′:6′,2′′-terpyridine, dcbpy = 5,5-dicarboxy-2,2′-bipyridine)) has been previously shown to be active for water oxidation under both chemical and electrochemical conditions, but here we demonstrate, for the first time, incorporation of a light harvesting n-type semiconductor as a base photoelectrode. Ru-UiO-67/WO3 is active for photoelectrochemical water oxidation at a thermodynamic underpotential (η ≈ 200 mV; Eonset = 600 mV vs. NHE), and incorporation of a molecular catalyst onto the oxide layer increases efficiency of charge transport and separation over bare WO3. The charge-separation process was evaluated with ultrafast transient absorption spectroscopy (ufTA) and photocurrent density measurements. These studies suggest that a key contributor to the photocatalytic process involves a hole transfer from excited  to Ru-UiO-67. To our knowledge, this is the first report of a MOF-based catalyst active for water oxidation at a thermodynamic underpotential, a key step towards light-driven water oxidation.
Introduction
With increasing global energy demand, interest in developing forms of alternative, and renewable, energy remains high. One significant source of potential energy is through the absorption of sunlight, which provides an average of ∼120![[thin space (1/6-em)]](https://www.rsc.org/images/entities/char_2009.gif) 000 TW of energy per hour, well over the current global energy demands.1 When coupled with oxidation of water and reduction of carbon dioxide this approach, known as artificial photosynthesis, provides a method of storing solar energy in the form of chemical bonds, which can be used when solar energy is not available, or in applications where direct absorption of sunlight would be difficult.1–3 While plants have developed complex pathways for absorption of light, oxidation of water and carbon utilization, there remains a significant need to develop new catalysts and photosensitizers to drive this chemistry in an artificial approach. In particular, water oxidation is the bottleneck in artificial photosynthesis approaches, and significant attention has been given to the development of new water oxidation catalysts.4–6 One of the most popular family of water oxidation catalysts have been ruthenium polypyridyl based catalysts, due to their simple structures, high activities, and significant tunability to access multiple Ru oxidation states.7–10 These benefits are often offset by the high cost of Ru, need for sacrificial oxidants, stability issues, and difficulty of recycling molecular catalysts.11,12
000 TW of energy per hour, well over the current global energy demands.1 When coupled with oxidation of water and reduction of carbon dioxide this approach, known as artificial photosynthesis, provides a method of storing solar energy in the form of chemical bonds, which can be used when solar energy is not available, or in applications where direct absorption of sunlight would be difficult.1–3 While plants have developed complex pathways for absorption of light, oxidation of water and carbon utilization, there remains a significant need to develop new catalysts and photosensitizers to drive this chemistry in an artificial approach. In particular, water oxidation is the bottleneck in artificial photosynthesis approaches, and significant attention has been given to the development of new water oxidation catalysts.4–6 One of the most popular family of water oxidation catalysts have been ruthenium polypyridyl based catalysts, due to their simple structures, high activities, and significant tunability to access multiple Ru oxidation states.7–10 These benefits are often offset by the high cost of Ru, need for sacrificial oxidants, stability issues, and difficulty of recycling molecular catalysts.11,12
Recently, a new class of materials has been investigated to address some of the drawbacks to homogeneous molecular catalysts. Metal–organic frameworks (MOFs), which are composed of metal nodes and organic linkers that form crystalline 2D or 3D structures with high porosity and surface area, provide a unique platform for molecular catalyst immobilization.13 MOF-based catalysis has been demonstrated by trapping molecular catalysts into the pores, appending molecular catalysts onto MOF nodes, or through substitution of molecular catalysts for the organic linkers. These approaches successfully transform homogeneous catalysts into a heterogenous construct, often while maintaining or improving the catalytic properties compared to solution. Incorporation of molecular catalysts into MOFs also provides over 100 times the active site coverage compared to monolayers on a heterogenous surface, since MOFs provide another dimension for catalyst incorporation.14 In fact, MOF-based examples for water oxidation have demonstrated significant improvements over the species in solution with regards to catalyst loading, recyclability, and stability.14–20
Ultimately, if the water oxidation reaction is going to be part of a larger artificial photosynthetic assembly, it is important to utilize photoenergy to drive the reaction, rather than applied potential or sacrificial oxidants. Recently, a number MOF/semiconductor composite films have been studied, with some eye towards water oxidation.21–23 However, the previously studied approaches utilize MOFs as a doping agent, catalyst, or host for an encapsulated species rather than an incorporated molecular catalyst platform.24–38 To our knowledge, the work presented herein, is the first to explore MOF-incorporated molecular-catalysts semiconductor composites, including detailed work of the operative charge transfer pathways.
Here, we report the combination of the light harvesting WO3 with a ruthenium water oxidation catalyst ([Ru(tpy)(dcbpy)OH2]2+ (tpy = 2,2′:6′,2′′-terpyridine, dcbpy = 5,5-dicarboxy-2,2′-bipyridine)) loaded into the Zr-based framework UiO-67. Previously, our group demonstrated the catalytic activity of Ru-UiO-67 for water oxidation, driven both chemically and electrochemically.14,39 In this work, Ru-UiO-67 was grown on a WO3 layer for photoelectrochemical water oxidation. Through deposition on WO3, the potential required to drive water oxidation by Ru-UiO-67 is reduced by over 1 V vs. NHE, and catalytic activity was observed at potentials as low at 600 mV vs. NHE. While catalysis at an underpotential should be the rule for photoelectrocatalysis, this is not always the case. To the best or our knowledge Ru-UiO-67/WO3 is the first example of a MOF-based water oxidation catalyst active for photoelectrochemical water oxidation at a thermodynamic underpotential. Incorporation of the Ru catalyst into the MOF structure provides significant enhancement in catalytic performance compared to a monolayer adsorbed directly onto WO3, highlighting the advantages of catalyst-loaded MOF films.
Experimental
General materials and methods
All chemicals used were purchased from commercial suppliers and used without additional purification. WO3 was prepared by a spin coating method onto fluorine-doped tin oxide (FTO) glass slides (Hartford Glass). A precursor solution was prepared by adding WCl6 (Sigma Aldrich) (2.15 g, 5.4 mmol) and carbowax (675 mg, MW = 600) to a Schlenk flask under an N2 atmosphere. Ethanol (54 mL) was added, and the reaction stirred under N2 overnight. The following day, the precursor solution was coated on the FTO slide by applying 0.5 mL of the precursor solution to FTO, followed by 30 s of spinning at 3000 rpm. This was repeated 3×, for a total of 2 mL of precursor solution added to each FTO slide. The films were dried under ambient conditions overnight and annealed at 450 °C for 1 h to produce WO3 films on FTO. Photoelectrochemical measurements were measured using a Xe arc lamp with a 390 nm cut on filter at 1 sun intensity.[Ru(tpy)(dcbpy)Cl]PF6 synthesis
[Ru(tpy)(dcbpy)Cl]PF6 (where tpy = 2,2′;6′,2′′-terpyridine and dcbpy = 2,2′-bipyridine-5,5′-dicarboxylic) acid was synthesized from literature procedures.14,40 First, RuCl3 (156.8 mg, 0.7 mol) was mixed with 2,2′;6′,2′′-terpyridine (172.8 mg, 0.7 mmol) in 50 mL of ethanol. The mixture was refluxed for 4 h and a brown solid was collected by filtration to give Ru(tpy)Cl3. Ru(tpy)Cl3 (1 g, 2.27 mmol) was then added to 2,2′-bipyridine-5,5′-dicarboxylic acid (509 mg, 2.08 mmol), LiCl (100 mg, 2.35 mmol) and triethylamine (1 mL, 7.12 mmol) in 3![[thin space (1/6-em)]](https://www.rsc.org/images/entities/char_2009.gif) :
:![[thin space (1/6-em)]](https://www.rsc.org/images/entities/char_2009.gif) 1 ethanol
1 ethanol![[thin space (1/6-em)]](https://www.rsc.org/images/entities/char_2009.gif) :
:![[thin space (1/6-em)]](https://www.rsc.org/images/entities/char_2009.gif) water (200 mL). The reaction was refluxed for 16 h and filtered hot. The filtrate volume was reduced to 25 mL by rotary evaporation and 10 mL of a saturated aqueous NH4PF6 was added. 1 M HCl was added dropwise until [Ru(tpy)(dcbpy)Cl]PF6 was precipitated. The purple solid was dried overnight under vacuum at 60 °C and characterized by 1H NMR (ESI, Fig. S1†).
water (200 mL). The reaction was refluxed for 16 h and filtered hot. The filtrate volume was reduced to 25 mL by rotary evaporation and 10 mL of a saturated aqueous NH4PF6 was added. 1 M HCl was added dropwise until [Ru(tpy)(dcbpy)Cl]PF6 was precipitated. The purple solid was dried overnight under vacuum at 60 °C and characterized by 1H NMR (ESI, Fig. S1†).
Ru-UiO-67/WO3 synthesis
Ru-UiO-67 synthesis was adapted from previous literature procedures.14 ZrCl4 (58.25 mg, 0.25 mmol), biphenyl dicarboxylic acid (50.8 mg, 0.21 mmol), and [Ru(tpy)(dcbpy)Cl]PF6 (32.6 mg, 0.043 mmol) were added to a 6-dram vial along with DMF (10 mL) and glacial acetic acid (465 μL). The vial was sonicated briefly before the WO3 films were added with the WO3 facing the bottom of the vial. The vials were heated at 120 °C for 48 h. After heating, the films were removed, rinsed with water, and stored in fresh water for 24 h before use to remove the Cl ligand and form the active catalyst [Ru(tpy)(dcbpy)(H2O)]PF6.Results and discussion
Physical characterization
WO3 films were characterized by PXRD, XPS and UV-VIS spectroscopy to confirm the identity and crystallinity of the metal oxide layer (Fig. 1). Film X-ray diffraction shows a broad peak at 24.2° 2θ, which matches well with three predicted peaks at 23.3, 23.8 and 24.6° 2θ for monoclinic WO3 (Fig. 1A). Electronic absorption spectroscopy (Fig. 1B) displays an onset of band-gap excitation at ∼600 nm. Analysis of the adsorption edge reveals an approximate band gap of 2.8 eV, consistent with the literature.41 XPS of the native WO3 films show a doublet in the W 4f region, with peaks at 37.7 and 35.6 eV, consistent with WO3 standards (Fig. S2†). No peak appears at 36 eV, indicating complete conversion of WCl6 starting material.42 While many n-type semiconductors have been studied for PEC water splitting, we chose WO3 for this approach for two main reasons. First, the relatively small band gap of WO3 compared to TiO2 or ZnO pushes the absorption of light into the visible region which significantly increases the amount of absorbed solar light.41 Second, the stability of WO3 to the acidic conditions of Zr-based MOF synthesis make it an ideal candidate for solvothermal MOF growth conditions.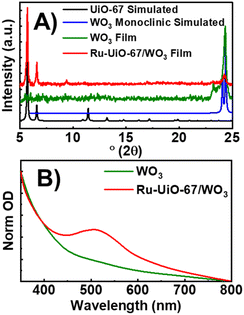 | ||
| Fig. 1 (A) PXRD patterns of simulated UiO-67 (black), monoclinic WO3 (red), WO3 film (blue), and Ru-UiO-67/WO3 (orange). (B) Ground-state absorption spectra of WO3 (black), and Ru-UiO-67/WO3 (red). | ||
After the deposition of WO3 was confirmed, the films were used as a substrate for solvothermal MOF film growth. Commonly reported on FTO, MOF film growth on metal oxides has been well documented as a simple method for depositing MOFs on conductive surfaces.14,43 After synthesis, MOF film crystallinity was confirmed by PXRD with primary peaks occurring at 5.7° and 6.6° 2θ.14 Ru-UiO-67/WO3 still exhibits characteristic peaks for WO3, indicating that WO3 is stable during the MOF synthesis process. Electronic absorption spectroscopy confirmed the retention of the broad band due to WO3, with the addition of a new peak at 510 nm due to the metal-to-ligand charge transfer (MLCT) band of the incorporated [Ru(tpy)(dcbpy)OH2]2+.44 Scanning electron microscopy shows the native WO3 film is characterized by small, spherical particles approximately 214 ± 112 nm in diameter (Fig. S3†). After MOF growth, WO3 particles are completely covered by a thick layer of intergrown MOF film (Fig. S4†), consistent with UiO-type films.14,39,45 Film thickness and roughness was measured by atomic force microscopy (Fig. S5†). The WO3 film is approximately 150 nm thick, and the thickness increases to 395 nm for Ru-UiO-67/WO3.
Determination of Ru -catalyst loading via ICP
To measure the amount of ruthenium loaded into UiO-67, inductively coupled plasma mass spectrometry (ICP-MS) was used. Films were digested in concentrated nitric acid and heated for 1 hour at 70 °C to ensure digestion of the MOF. The digested sample was then diluted 1![[thin space (1/6-em)]](https://www.rsc.org/images/entities/char_2009.gif) :
:![[thin space (1/6-em)]](https://www.rsc.org/images/entities/char_2009.gif) 10 in DI water prior to analysis. Three films were digested by this method and averaged to get 7.80 × 10⁻⁸ mol of Ru catalyst per film. Unfortunately, analysis of Zr and W concentration is not as straightforward. Tungsten oxide is particularly stable to acidic conditions and is not digested in nitric acid, while zirconium requires stabilization by HF for accurate analysis.
10 in DI water prior to analysis. Three films were digested by this method and averaged to get 7.80 × 10⁻⁸ mol of Ru catalyst per film. Unfortunately, analysis of Zr and W concentration is not as straightforward. Tungsten oxide is particularly stable to acidic conditions and is not digested in nitric acid, while zirconium requires stabilization by HF for accurate analysis.
Previous reports of Ru-UiO-67 demonstrated that the pore size of UiO-67 does not allow for enough catalyst incorporation to promote complete redox hopping oxidation of the framework.14,46 To determine the amount of electrochemically active ruthenium loaded in a MOF film, chronoamperometry is typically used. However, since the WO3 layer provides additional resistance for charge transfer to the ruthenium centers, this experiment is not possible on Ru-UiO-67/WO3. Instead, Ru-UiO-67 was grown on FTO under the same conditions used to prepare Ru-UiO-67/WO3. Assuming that the same amount of ruthenium is active in the MOF, regardless of the substrate it is deposited on, ∼50% of the ruthenium is active for water oxidation in the MOF film.
Electrochemical behavior of Ru-UiO-67/WO3
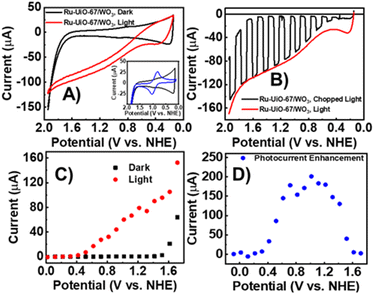
The electrochemical properties of Ru-UiO-67/WO3 films were examined by cyclic voltammetry (CV) and linear sweep voltammetry (LSV) under illumination and dark conditions (Fig. 2). A small, reversible peak at E1/2 = 0.875 V vs. NHE can be seen in the dark CV, corresponding to RuII/III oxidation of [Ru(tpy)(dcbpy)OH2]2+, followed by takeoff of catalytic current at 1.7 V vs. NHE (Fig. 2A), as seen in previous studies for the catalysts in solution and incorporated into UiO-67.14,44 The small RuII/III peak compared to a sample of Ru-UiO-67 on FTO (Fig. 2A, inset) is likely due to deposition onto WO3 rather than conductive FTO. In the dark, the wide band gap of WO3 acts as an insulating layer, and the valence band edge (1.82 V vs. NHE) is resistive to oxidation at lower applied potentials, preventing electron removal from the ruthenium centers. The observed peak for RuII/III therefore is likely due to a small amount of Ru-UiO-67 deposited directly onto FTO due to incomplete coverage of the FTO slide by WO3. However, upon illumination, significant photocurrent enhancement was observed starting at 0.55 V vs. NHE. Ru-UiO-67/WO3 displays a steady increase in photocurrent from 0.55–2 V vs. NHE. The photocurrent enhancement is completely reversible after removal of light, indicating Ru-UiO-67/WO3 is stable to illumination and the current enhancement observed in the CV is due to illumination of the electrode (Fig. 2B). To better establish an onset for enhanced photocurrent, the steady state current at various potentials was measured for the Ru-UiO-67/WO3 film in the light and dark (Fig. 2C and D). Photocurrent enhancement starts at 400 mV and reaches a maximum of 200× increase at 1 V vs. NHE.Photoenergy to electrical energy conversion efficiency
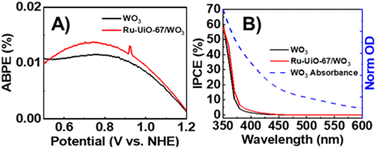
To measure the efficiency of converting photoenergy to electrical energy, the photo-response efficiency for Ru-UiO-67/WO3 compared to bare WO3 was analyzed as a function of applied bias (applied bias photo-to-current efficiency, or ABPE) and plotted in Fig. 3A.47,48 Ru-UiO-67/WO3 shows a slight improvement in the efficiency of photoenergy conversion at all measured potentials. Similarly, a slight improvement the incident photon-to-current conversion efficiency (IPCE) was observed for the Ru-UiO-67/WO3 film compared to bare WO3 (Fig. 3B). In ideal systems, IPCE measurements are proportionally equal to the absorption value of the photoanode, however at high wavelengths (>400 nm), the IPCE of Ru-UiO-67/WO3 is lower than expected when compared to the absorption spectrum of WO3 (Fig. 3B, dashed blue line). The discrepancy between the IPCE and absorption spectrum is likely attributed to slow charge transport to a relatively small concentration of active ruthenium centers throughout the MOF, in turn causing a reduction in the observed efficiency.14,49,50 Taken together, the small changes in ABPE or IPCE suggest that the addition of Ru-UiO-67 does not substantially change the light absorption properties of the photoanode, consistent with previous reports that show very short emission lifetimes (∼37 ns) for photoexcited [Ru(tpy)(dcbpy)OH2]2+, therefore making it a poor photosensitizer.45Photocurrent density measurements
While the absorption properties of Ru-UiO-67/WO3 do not substantially change compared to WO3, significant improvement can be observed in other photoelectrochemical (PEC) properties. In general, the photocurrent density observed during water oxidation (JH2O) can be split into four components and described by the equation:| JH2O = Jmax × ηabs × ηsep × ηtrans | (1) |
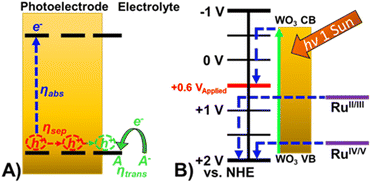 | ||
| Fig. 4 (A) Schematic of oxidation occurring at a photoelectrode demonstrating the efficiencies that govern observed photocurrent. (B) Energy diagram of Ru-UiO-67/WO3 at pH 6. | ||
To examine the efficiency of charge separation, J–V curves of WO3 and Ru-UiO-67/WO3 were collected in 0.25 M Na2SO3, which acts as a rapid hole scavenger.48 With Na2SO3, the rate of charge transfer to SO32− is very fast (ηtrans ≈ 100%), and the photocurrent density (JSO3) can be described by the following equation:
| JSO3 = Jmax × ηabs × ηsep | (2) |
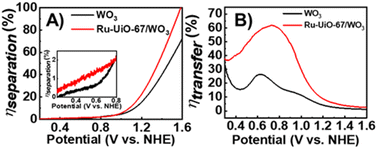
From eqn (1) and (2), both ηsep and ηtrans were calculated for both WO3 and Ru-UiO-67/WO3 and are plotted in Fig. 5 (see ESI† for full equations and calculations).52
Starting at low applied potential (300 mV vs. NHE), Ru-UiO-67/WO3 exhibits a slight enhancement in charge separation (ηsep) (Fig. 5A, inset), with significant take off at higher potentials, reaching 100% at 1.6 V vs. NHE. Enhancement in charge separation at high applied bias has been observed spectroscopically in WO3 films, due to band bending at the surface interface.53 Introduction of [Ru(tpy)(dcbpy)OH2]2+ sites at the WO3 surface amplify the effects of band bending by raising the Fermi level of the surface state, resulting in greater ηsep for Ru-UiO-67/WO3 at the same applied potential.54 A much larger improvement is observed in ηtrans, even at low applied potential, nearly doubling the efficiency of bare WO3 at the maximum (800 mV vs. NHE) (Fig. 5B). One major limitation of WO3 as a catalyst for water oxidation is the slow charge transfer between the surface and electrolyte, causing charge recombination rather than oxidation of water.55,56
Addition of a Ru-UiO-67 to the surface of WO3 provides a more efficient pathway for photogenerated hole removal to occur, greatly improving ηtrans. Oxidation of RuII by photoexcited WO3 is thermodynamically favorable with nearly 1 V difference in the valence band of WO3 (1.82 V) and the oxidation potential of RuII/III (0.875 V) as shown in Fig. 4B. From these results, it is likely that the observed photocurrent enhancement is largely due to improved charge transfer from the electrode to the electrolyte (ηtrans) through oxidation of [Ru(tpy)(dcbpy)OH2]2+, and band bending assisted by the deposition of Ru-UiO-67 to promote longer lived charge separated states.
Probing photoinduced charge transfer processes in Ru-UiO-67/WO3
If hole (h+) transfer from to [Ru(tpy)(dcbpy)OH2]2+ sites in Ru-UiO-67/WO3 occurs, as proposed by the mechanism in Fig. 4, then a decrease in the excited-state lifetimes associated with WO3 holes should be observable in Ru-UiO-67/WO3 compared to WO3 alone. To assess the above mechanism in the Ru-UiO-67/WO3 films, ultrafast transient absorption spectroscopy (ufTA) was employed. Pump-probe techniques like transient absorption spectroscopy characterize the excited state behaviors within a photoactive system. Typically, these behaviors are presented as a ΔOD (or ΔAbs) spectrum because the changes in the excited state are quite minute:
| ΔOD(t) = ODt − OD0 | (3) |
Shown in Fig. 6 below are the ufTA spectra of WO3 and Ru-UiO-67/WO3 films deposited on a glass slide. An excitation wavelength of 320 nm was chosen as it significantly excites both WO3 and Ru-UiO-67 as evidenced from their ground-state absorption spectra (Fig. S8†). Upon light excitation, WO3 exhibits a strong positive absorption that shifts from long to short wavelengths as a function of time (Fig. 6, top) and peaks ca. 640 nm, similar to prior studies by Durrant53 and Kamat et al.,57 indicative of free and trapped carriers. The spectral broadening and hypsochromic shifts are typical for the relaxation of hot traps and carriers into deeper trap sites (O–Mvac5+, O–M6+–O˙+, Mvac = oxygen-vacant transition metal).58–63 By the end of the instrument time window (8 ns), there is a residual positive absorption extending over the probe range that is attributed to deeply trapped carriers, which recombine on or beyond the nanosecond time scale.53
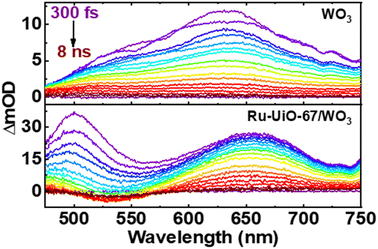 | ||
| Fig. 6 Ultrafast transient absorption spectral mappings (purple to red) of WO3 (top) and Ru-UiO-67/WO3 (bottom) films on glass under an Ar atmosphere. λex = 320 nm, ∼200 μJ cm−2. | ||
The ufTA spectrum of Ru-UiO-67/WO3 (Fig. 6, bottom) presents a broad absorption feature from 600–700 nm ascribed to both absorptions from WO3 and Ru-UiO-67 (Fig. S9†). Over time, Ru-UiO-67/WO3 exhibits typical characteristics of a triplet metal-to-ligand charge transfer state (3MLCT*), with a GSB ca. 520 nm, and excited state absorptions on either side of the bleach (500 nm and 650 nm), both similar to the features observed in the TA spectrum of Ru-UiO-67 without WO3. Ruthenium complexes like the [Ru(tpy)(dcbpy)OH2]2+ species studied here are known for their MLCT transitions in the visible wavelength region.64–66 As the name suggests, when the MLCT transition is photoexcited, an electron from the Ru metal center is transferred to one of the coordinating ligands to generate an 1MLCT* excited state. Consequently, the overall TA spectrum exhibits features from both oxidized ruthenium and reduced ligand. From spectroelectrochemistry measurements, oxidized Ru complexes show a loss in absorption at the 1MLCT transition, whereas reduced Ru complexes exhibit higher absorptions on both sides of the 1MLCT transition.67,68 Based on prior literature, we attribute the negative GSB feature at ∼520 nm to oxidized RuIII and the positive ESA features on either side of the GSB to dcbpy˙−.69–71
Intriguingly, at early times, there is a strong absorption ca. 500 nm that hypsochromically shifts and decays with a lifetime limited by the instrumental response function at this region (∼200 fs). As both Ru-UiO-67 and Ru-UiO-67/WO3 exhibit this initial short-lived excited state absorption, we attribute such behavior to excited-state dynamics on [Ru(tpy)(dcbpy)OH2]2+. In the solution-state photochemistry of RuII complexes, when both an excitation wavelength higher in energy than the 1MLCT transition is used and the RuII is heteroleptic, as is the case here, these factors give rise to excess vibrational energy and excitations of interligand charge-transfer bands (among other ligand- and metal-centered transitions), all of which have similar lifetimes to the sub-ps component observed in this work.72,73 Moreover, control experiments with Ru-UiO-67/WO3 using a 500 nm excitation wavelength (direct 1MLCT excitation) did not provide the early time (<5 ps) kinetic component that 320 nm excitation provided (Fig. S10†). Therefore, the 200 fs component is attributed to a mix of the aforementioned processes (vibrational relaxation and interligand transfer) and does not impact the key findings of these spectroscopic measurements. Further assessment of such early-time behavior is outside the scope of this paper.
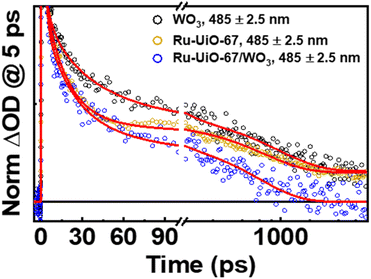
Prior literature on metal-oxide photophysics dictates that trapped holes show a typical absorption predominately between 400–550 nm.58,61,63,74–78 Therefore, to examine how hole relaxation times change in WO3 films when Ru-UiO-67 is grown on them, the kinetics in this window were probed (Fig. 7) and the fits are provided in Table 1 below. We specifically analyzed kinetics between 480–490 nm, because this region overlaps with both the excited-state absorptions of [Ru(tpy)(dcbpy)OH2]2+ and WO3. The decay kinetics of the films were adequately fit to a multiexponential model convoluted with IRF:
 | (4) |
 | (5) |
| Sample | τ 1 (ns), A1 (%) | τ 2 (ns), A2 (%) | τ 3 (ns), A3 (%) | τ 4 (ns), A4 (%) | τ 5 (ns), A5 (%) |
|---|---|---|---|---|---|
| a The kinetics at 485 nm were averaged over a 5 nm window and the associated errors are standard deviations in amplitude and lifetime. b Lifetimes are overlapped with IRF at the given wavelength (tIRF = 190 fs). | |||||
| WO3 | — | 4 ± 2 ps (34 ± 5%) | 40 ± 20 ps (35 ± 6%) | 1000 ± 200 ps (20 ± 1%) | >8 ns (11 ± 2%) |
| Ru-UiO-67 | 0.22 ± 0.2 psb (61 ± 3%) | 1.6 ± 0.2 ps (17 ± 1%) | 16 ± 1 ps (14 ± 2%) | 690 ± 20 ps (5 ± 1%) | >8 ns (2.9 ± 0.4%) |
| Ru-UiO-67/WO3 | 0.17 ± 0.03 psb (81 ± 2%) | 1.5 ± 0.4 ps (13 ± 1%) | 30 ± 10 ps (4 ± 1%) | 600 ± 30 ps (2.0 ± 0.5%) | — |
The lifetime components associated with hole-relaxation and recombination in WO3 at 485 nm were: 4 ± 2 ps, 40 ± 20 ps, 1000 ± 200 ps and >8 ns. The relaxation lifetimes are quite similar to those observed in TiO2 systems, with lifetimes <500 ps typical of traps cooling and lifetimes >500 ps generally due to recombination.58,60–62,76 The relaxation times of Ru-UiO-67/WO3 at 485 nm, excluding the early time decays (<5 ps, see above), were: 1.5 ± 0.4 ps, 30 ± 10 ps, and 600 ± 30 ps. The shortening of excited-state lifetimes in Ru-UiO-67/WO3 compared to WO3 alone is generally reflective of a charge-transfer process occurring within the MOF-semiconductor composite.45 Additionally, the residual excited-state absorptions that are present in WO3 and Ru-UiO-67 alone are gone by 2 ns in the Ru-UiO-67/WO3 film. Together, the decrease in the hole lifetimes of WO3 and the loss of the 3MLCT excited state absorption in the Ru-UiO-67/WO3 film are strong indicators that hole transfer is a valid step in the mechanism for the photocatalysis occurring in these MOF-semiconductor films.
Water oxidation at an underpotential
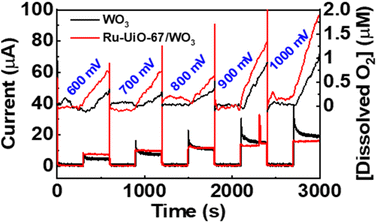
The catalytic properties of the Ru-UiO-67/WO3 film were tested for water oxidation in 0.1 M aqueous LiClO4 solution, adjusted to pH 6 prior to electrolysis. Since a significant photocurrent enhancement was observed starting at very low potentials (500 mV vs. NHE), the rate of oxygen production was tested at different potentials from 600 mV–1000 mV vs. NHE (Fig. 8). At each potential, the film was held in the dark for 5 minutes before starting illumination of 1 sun at the given potential to observe the initial rate. At potentials as low as 600 mV vs. NHE, O2 production was clearly observed upon illumination of the Ru-UiO-67/WO3 films. The initial rate of O2 production increased for Ru-UiO-67/WO3 as the applied potential is increased, likely driven by increased band-bending in the WO3 photoanode. The initial faradaic efficiency remained largely unchanged at ∼66% for 600–900 mV but jumps to 84% at 1 V applied potential.To probe prolonged catalytic activity, Ru-UiO-67/WO3 was held at 600 mV vs. NHE for 1 h and the production of O2 was measured. Ru-UiO-67/WO3 demonstrated steady O2 production with a faradaic efficiency of 40 ± 3% (Fig. 9). After 1 hour, no peroxide formation was detected and O2 production was confirmed by GC (Fig. S11†). At the same potential, WO3 produces very little oxygen, confirming [Ru(tpy)(dcbpy)OH2]2+ as the active catalytic species (Fig. 9, black). The corresponding TON as a function time plot is provided in Fig. S14.† The work demonstrates one of the first examples of photoelectrochemical water oxidation at a thermodynamic underpotential (∼200 mV) and a significant decrease in required potential for the MOF-based catalyst in a purely electrochemical approach. Even at 1 V vs. NHE, the film is not active in the dark, and only produces O2 upon applied potential and illumination (Fig. S12†). Compared to directly depositing a monolayer of the ruthenium catalyst onto WO3, Ru-UiO-67 should be more active, because incorporation of the catalyst within the MOF will extend the working electrode in a third dimension versus a 2D deposition on a nonporous surface. A monolayer of [Ru(tpy)(dcbpy)OH2]2+ was deposited onto WO3 by soaking the film in a 1 × 10⁻⁴ M ethanol solution overnight, followed by washing with water. Similar to Ru-UiO-67, the electrochemical active site coverage was calculated by chronoamperometry experiments of the same monolayer deposited on FTO. An electroactive coverage of 1.5 × 10⁻¹⁰ mol cm−2 was measured for the catalyst monolayer, consistent with previous literature on densely packed monolayers.75 Based on the concentration of Ru in the MOF film and the monolayer, the O2 production for the monolayer of Ru catalyst is expected to be below the limit of detection for the probe (0.3 μM) and, indeed, no significant O2 production was observed at 600 mV applied potential for the [Ru(tpy)(dcbpy)OH2]2+ monolayer on WO3 (Fig. 9 blue).
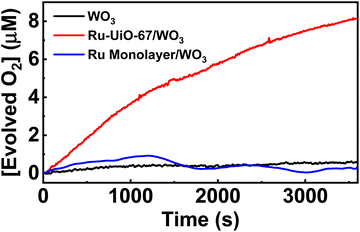 | ||
| Fig. 9 Oxygen production of Ru-UiO-67/WO3 over time, compared to bare WO3. Ru-UiO-67/WO3 activity was averaged across three different films (Fig. S13†). | ||
We then calculated the turn-over number (TON) and turn-over frequency (TOF) based on the electrochemically active ruthenium, rather than the total amount of ruthenium observed by ICP-MS. A TON after 1 hour for the electrochemically active ruthenium sites was calculated to be 16 and gives a TOF, calculated by dividing the TON over the time of the reaction, of 0.004 s−1.
Post-catalysis stability characterization
Ru-UiO-67/WO3 was analyzed post-catalysis to examine the stability of the film to illumination and electrocatalysis (Fig. S13 and S14†). PXRD and SEM of the film show no significant changes from the as-synthesized film, suggesting the MOF crystal structure remains intact during catalysis. However, these experiments alone are not enough to determine total catalytic stability because any changes in the Ru catalyst may not result in crystallographic changes to the MOF particle. Changes in the Ru catalyst were measured by XPS, which does not show any indication of oxidation state change (Fig. S17†). Additional ICP leaching experiments shows only ∼2% of the total ruthenium concentration leached into solution. Catalysis from any leached material was tested with a blank WO3 electrode in previously used electrolyte solution and found no production of O2 over the course of an hour, indicating all observed activity can be attributed to the Ru-UiO-67/WO3 film (Fig. S18†). Finally, Ru-UiO-67/WO3 can be reused in fresh solution with no loss in catalytic activity (Fig. S19†), strongly suggesting the film is stable to the applied catalytic conditions. Together, these results suggest that most of the ruthenium centers remain bound to the MOF linkers and account for all the observed catalytic activity for water oxidation.Conclusions
A MOF-semiconductor composite film was synthesized to utilize the light harvesting properties of WO3 and the catalytic activity of MOF-incorporated molecular Ru-based catalysts. Specifically, [Ru(tpy)(dcbpy)OH2]2+ was incorporated into the backbone of UiO-67 and solvothermally grown onto the WO3 layer. The composite film displayed significant photocurrent enhancement starting at 200 mV vs. NHE, with a 200% increase when 1 V was applied. Ru-UiO-67/WO3 was active for photoelectrochemical water oxidation at 600 mV vs. NHE, over 1 V lower than previous reports of the same catalyst loaded film on FTO. Ru-UiO-67 does not enhance the light harvesting ability of WO3, but rather provides a more efficient pathway for charge separation at the WO3/MOF interface, and consequently, more efficient water oxidation. To our knowledge, this work is the first example of a MOF-based catalyst driving water oxidation at a thermodynamic underpotential, a significant step towards purely photo-driven reactivity.Data availability
All data supporting the findings of this study, including experimental procedures and compound characterization, are available within the paper and its ESI files,† or from the corresponding authors on request.Author contributions
The manuscript was written through contributions of all authors.Conflicts of interest
There are no conflicts to declare.Acknowledgements
This work was supported by the Department of Energy under Grant DE-SC0012445. This work used shared facilities at the Nanoscale Characterization and Fabrication Laboratory, which is funded and managed by Virginia Tech’s Institute for Critical Technology and Applied Science. Additional support for these facilities is provided by the Virginia Tech National Center for Earth and Environmental Nanotechnology Infrastructure (NanoEarth), a member of the National Nanotechnology Coordinated Infrastructure (NNCI), supported by NSF (ECCS 1542100 and ECCS 2025151).Notes and references
- D. Gust, T. A. Moore and A. L. Moore, Acc. Chem. Res., 2009, 42, 1890–1898 CrossRef PubMed.
- V. Kumaravel, J. Bartlett and S. C. Pillai, ACS Energy Lett., 2020, 5, 486–519 CrossRef CAS.
- T. R. Cook, D. K. Dogutan, S. Y. Reece, Y. Surendranath, T. S. Teets and D. G. Nocera, Chem. Rev., 2010, 110, 6474–6502 CrossRef CAS PubMed.
- B. You and Y. Sun, Acc. Chem. Res., 2018, 51, 1571–1580 CrossRef CAS PubMed.
- S. Ye, C. Ding, M. Liu, A. Wang, Q. Huang and C. Li, Adv. Mater., 2019, 31, e1902069 CrossRef PubMed.
- D. G. H. Hetterscheid and J. N. H. Reek, Angew. Chem., Int. Ed. Engl., 2012, 51, 9740–9747 CrossRef CAS PubMed.
- R. Zong and R. P. Thummel, J. Am. Chem. Soc., 2005, 127, 12802–12803 CrossRef CAS PubMed.
- L. Tong and R. P. Thummel, Chem. Sci., 2016, 7, 6591–6603 RSC.
- J. J. Concepcion, J. W. Jurss, M. R. Norris, Z. Chen, J. L. Templeton and T. J. Meyer, Inorg. Chem., 2010, 49, 1277–1279 CrossRef CAS PubMed.
- J. J. Concepcion, J. W. Jurss, M. K. Brennaman, P. G. Hoertz, A. O. T. Patrocinio, N. Y. Murakami Iha, J. L. Templeton and T. J. Meyer, Acc. Chem. Res., 2009, 42, 1954–1965 CrossRef CAS PubMed.
- T. G. Ulusoy Ghobadi, E. Akhuseyin Yildiz, M. Buyuktemiz, S. Sadigh Akbari, D. Topkaya, Ü. İsci, Y. Dede, H. G. Yaglioglu and F. Karadas, Angew. Chem., Int. Ed. Engl., 2018, 57, 17173–17177 CrossRef CAS PubMed.
- J. Li, C. A. Triana, W. Wan, D. P. Adiyeri Saseendran, Y. Zhao, S. E. Balaghi, S. Heidari and G. R. Patzke, Chem. Soc. Rev., 2021, 50, 2444–2485 RSC.
- Q. Wang and D. Astruc, Chem. Rev., 2020, 120, 1438–1511 CrossRef CAS PubMed.
- S. Lin, Y. Pineda-Galvan, W. A. Maza, C. C. Epley, J. Zhu, M. C. Kessinger, Y. Pushkar and A. J. Morris, ChemSusChem, 2017, 10, 514–522 CrossRef CAS PubMed.
- C. Wang, Z. Xie, K. E. deKrafft and W. Lin, J. Am. Chem. Soc., 2011, 133, 13445–13454 CrossRef CAS PubMed.
- L. Wu, M. Eberhart, A. Nayak, M. K. Brennaman, B. Shan and T. J. Meyer, J. Am. Chem. Soc., 2018, 140, 15062–15069 CrossRef CAS PubMed.
- B. M. Klepser and B. M. Bartlett, J. Am. Chem. Soc., 2014, 136, 1694–1697 CrossRef CAS PubMed.
- W. Jiang, X. Yang, F. Li, Q. Zhang, S. Li, H. Tong, Y. Jiang and L. Xia, Chem. Commun., 2019, 55, 1414–1417 RSC.
- B. A. Johnson, A. Bhunia and S. Ott, Dalton Trans., 2017, 46, 1382–1388 RSC.
- A. Bhunia, B. A. Johnson, J. Czapla-Masztafiak, J. Sá and S. Ott, Chem. Commun., 2018, 54, 7770–7773 RSC.
- R. Wang, Y. Kuwahara, K. Mori and H. Yamashita, ChemCatChem, 2021, 13, 5058–5072 CrossRef CAS.
- G. Paille, M. Gomez-Mingot, C. Roch-Marchal, B. Lassalle-Kaiser, P. Mialane, M. Fontecave, C. Mellot-Draznieks and A. Dolbecq, J. Am. Chem. Soc., 2018, 140, 3613–3618 CrossRef CAS PubMed.
- W. A. Shah, A. Waseem, M. A. Nadeem and P. Kögerler, Appl. Catal., A, 2018, 567, 132–138 CrossRef CAS.
- K. Wang, Y. Liu, K. Kawashima, X. Yang, X. Yin, F. Zhan, M. Liu, X. Qiu, W. Li, C. B. Mullins and J. Li, Adv. Sci., 2020, 7, 2002563 CrossRef CAS PubMed.
- F. Xiao, R. Guo, X. He, H. Chen, W. Fang, W. Li, H. Wang, Z. Sun, P. Tian and L. Zhao, Int. J. Hydrogen Energy, 2021, 46, 7954–7963 CrossRef CAS.
- Z. Lionet, Y. Kamata, S. Nishijima, T. Toyao, T.-H. Kim, Y. Horiuchi, S. W. Lee and M. Matsuoka, Res. Chem. Intermed., 2018, 44, 4755–4764 CrossRef CAS.
- W. M. A. El Rouby, M. Antuch, S.-M. You and P. Millet, Electrochim. Acta, 2020, 339, 135882 CrossRef CAS.
- N. Karjule, C. Singh, J. Barrio, J. Tzadikov, I. Liberman, M. Volokh, E. Palomares, I. Hod and M. Shalom, Adv. Funct. Mater., 2021, 31, 2101724 CrossRef CAS.
- S. Kim, T. A. Dela Pena, S. Seo, H. Choi, J. Park, J.-H. Lee, J. Woo, C. H. Choi and S. Lee, Appl. Surf. Sci., 2021, 563, 150357 CrossRef CAS.
- L. Wang, F. Wu, X. Chen, J. Ren, X. Lu, P. Yang and J. Xie, ACS Appl. Energy Mater., 2021, 4, 13199–13207 CrossRef CAS.
- H. Wang, X. He, W. Li, H. Chen, W. Fang, P. Tian, F. Xiao and L. Zhao, Chem. Commun., 2019, 55, 11382–11385 RSC.
- C. Liu, H. Luo, Y. Xu, Z. Zhang, Q. Liang, W. Wang and Z. Chen, Chem. Eng. J., 2020, 384, 123333 CrossRef CAS.
- W. Li, K. Wang, X. Yang, F. Zhan, Y. Wang, M. Liu, X. Qiu, J. Li, J. Zhan, Q. Li and Y. Liu, Chem. Eng. J., 2020, 379, 122256 CrossRef CAS.
- Z. Peng, S. C. Abbas, J. Lv, R. Yang, M. Wu and Y. Wang, Int. J. Hydrogen Energy, 2019, 44, 2446–2453 CrossRef CAS.
- W. Zhang, R. Li, X. Zhao, Z. Chen, A. W.-K. Law and K. Zhou, ChemSusChem, 2018, 11, 2710–2716 CrossRef CAS PubMed.
- Y.-J. Dong, J.-F. Liao, Z.-C. Kong, Y.-F. Xu, Z.-J. Chen, H.-Y. Chen, D.-B. Kuang, D. Fenske and C.-Y. Su, Appl. Catal., B, 2018, 237, 9–17 CrossRef CAS.
- Y.-N. Gong, T. Ouyang, C.-T. He and T.-B. Lu, Chem. Sci., 2016, 7, 1070–1075 RSC.
- S. Zhou, K. Chen, J. Huang, L. Wang, M. Zhang, B. Bai, H. Liu and Q. Wang, Appl. Catal., B, 2020, 266, 118513 CrossRef CAS.
- S. Lin, A. K. Ravari, J. Zhu, P. M. Usov, M. Cai, S. R. Ahrenholtz, Y. Pushkar and A. J. Morris, ChemSusChem, 2018, 11, 464–471 CrossRef CAS PubMed.
- T. Kajiwara, M. Fujii, M. Tsujimoto, K. Kobayashi, M. Higuchi, K. Tanaka and S. Kitagawa, Angew. Chem., Int. Ed. Engl., 2016, 55, 2697–2700 CrossRef CAS PubMed.
- J. Y. Zheng, G. Song, J. Hong, T. K. Van, A. U. Pawar, D. Y. Kim, C. W. Kim, Z. Haider and Y. S. Kang, Cryst. Growth Des., 2014, 14, 6057–6066 CrossRef CAS.
- A. V. Naumkin, A. Kraut-Vass, S. W. Gaarenstroom and C. J. Powell, NIST X-ray Photoelectron Spectroscopy Database, 2012, https://srdata.nist.gov/xps/ Search PubMed.
- G. Genesio, J. Maynadié, M. Carboni and D. Meyer, New J. Chem., 2018, 42, 2351–2363 RSC.
- D. J. Wasylenko, C. Ganesamoorthy, B. D. Koivisto, M. A. Henderson and C. P. Berlinguette, Inorg. Chem., 2010, 49, 2202–2209 CrossRef CAS PubMed.
- S. Lin, D. R. Cairnie, D. Davis, A. Chakraborty, M. Cai and A. J. Morris, Faraday Discuss., 2021, 225, 371–383 RSC.
- S. Lin, P. M. Usov and A. J. Morris, Chem. Commun., 2018, 54, 6965–6974 RSC.
- H. Dotan, N. Mathews, T. Hisatomi, M. Grätzel and A. Rothschild, J. Phys. Chem. Lett., 2014, 5, 3330–3334 CrossRef CAS PubMed.
- H. Wang, Y. Xia, H. Li, X. Wang, Y. Yu, X. Jiao and D. Chen, Nat. Commun., 2020, 11, 3078 CrossRef CAS PubMed.
- F. Li, J. R. Jennings, N. Mathews and Q. Wang, J. Electrochem. Soc., 2011, 158, B1158 CrossRef CAS.
- A. J. Haring, M. E. Pomatto, M. R. Thornton and A. J. Morris, ACS Appl. Mater. Interfaces, 2014, 6, 15061–15067 CrossRef CAS PubMed.
- X. Shi, I. Y. Choi, K. Zhang, J. Kwon, D. Y. Kim, J. K. Lee, S. H. Oh, J. K. Kim and J. H. Park, Nat. Commun., 2014, 5, 4775 CrossRef CAS PubMed.
- Z. Wang, X. Zong, Y. Gao, J. Han, Z. Xu, Z. Li, C. Ding, S. Wang and C. Li, ACS Appl. Mater. Interfaces, 2017, 9, 30696–30702 CrossRef CAS PubMed.
- S. Corby, E. Pastor, Y. Dong, X. Zheng, L. Francàs, M. Sachs, S. Selim, A. Kafizas, A. A. Bakulin and J. R. Durrant, J. Phys. Chem. Lett., 2019, 10, 5395–5401 CrossRef CAS PubMed.
- Z. Zhang and J. T. Yates Jr, Chem. Rev., 2012, 112, 5520–5551 CrossRef CAS PubMed.
- J. Zhang, H. Ma and Z. Liu, Appl. Catal., B, 2017, 201, 84–91 CrossRef CAS.
- W. Lin, Y. Yu, Y. Fang, J. Liu, X. Li, J. Wang, Y. Zhang, C. Wang, L. Wang and X. Yu, Langmuir, 2021, 37, 6490–6497 CrossRef CAS PubMed.
- I. Bedja, S. Hotchandani and P. V. Kamat, J. Phys. Chem., 1993, 97, 11064–11070 CrossRef CAS.
- Y. Tamaki, A. Furube, M. Murai, K. Hara, R. Katoh and M. Tachiya, Phys. Chem. Chem. Phys., 2007, 9, 1453–1460 RSC.
- R. Qian, H. Zong, J. Schneider, G. Zhou, T. Zhao, Y. Li, J. Yang, D. W. Bahnemann and J. H. Pan, Catal. Today, 2019, 335, 78–90 CrossRef CAS.
- A. Piccioni, D. Catone, A. Paladini, P. O'Keeffe, A. Boschi, A. Kovtun, M. Katsikini, F. Boscherini and L. Pasquini, J. Phys. Chem. C, 2020, 124, 26572–26582 CrossRef CAS.
- Y. Tamaki, A. Furube, R. Katoh, M. Murai, K. Hara, H. Arakawa and M. Tachiya, C. R. Chim., 2006, 9, 268–274 CrossRef CAS.
- J. Sun, Y. Yang, J. I. Khan, E. Alarousu, Z. Guo, X. Zhang, Q. Zhang and O. F. Mohammed, ACS Appl. Mater. Interfaces, 2014, 6, 10022–10027 CrossRef CAS PubMed.
- T. Yoshihara, R. Katoh, A. Furube, Y. Tamaki, M. Murai, K. Hara, S. Murata, H. Arakawa and M. Tachiya, J. Phys. Chem. B, 2004, 108, 3817–3823 CrossRef CAS.
- D. M. Roundhill, in Photochemistry and Photophysics of Metal Complexes, ed. D. M. Roundhill, Springer US, Boston, MA, 1994, pp. 165–215 Search PubMed.
- J. P. Sauvage, J. P. Collin, J. C. Chambron, S. Guillerez, C. Coudret, V. Balzani, F. Barigelletti, L. De Cola and L. Flamigni, Chem. Rev., 1994, 94, 993–1019 CrossRef CAS.
- N. H. Damrauer, G. Cerullo, A. Yeh, T. R. Boussie, C. V. Shank and J. K. McCusker, Science, 1997, 275, 54–57 CrossRef CAS PubMed.
- A. M. Brown, C. E. McCusker and J. K. McCusker, Dalton Trans., 2014, 43, 17635–17646 RSC.
- C. E. McCusker and J. K. McCusker, Inorg. Chem., 2011, 50, 1656–1669 CrossRef CAS PubMed.
- C.-C. Hou, T.-T. Li, S. Cao, Y. Chen and W.-F. Fu, J. Mater. Chem. A, 2015, 3, 10386–10394 RSC.
- Y. Song, Z. Li, Y. Zhu, X. Feng, J. S. Chen, M. Kaufmann, C. Wang and W. Lin, J. Am. Chem. Soc., 2019, 141, 12219–12223 CrossRef CAS PubMed.
- S. C. Rasmussen, S. E. Ronco, D. A. Mlsna, M. A. Billadeau, W. T. Pennington, J. W. Kolis and J. D. Petersen, Inorg. Chem., 1995, 34, 821–829 CrossRef CAS.
- A. M. Brown, C. E. McCusker, M. C. Carey, A. M. Blanco-Rodríguez, M. Towrie, I. P. Clark, A. Vlček and J. K. McCusker, J. Phys. Chem. A, 2018, 122, 7941–7953 CrossRef CAS PubMed.
- C. W. Stark, W. J. Schreier, J. Lucon, E. Edwards, T. Douglas and B. Kohler, J. Phys. Chem. A, 2015, 119, 4813–4824 CrossRef CAS PubMed.
- P. Zawadzki, J. Phys. Chem. C, 2013, 117, 8647–8651 CrossRef CAS.
- G. Rossi, L. Pasquini, D. Catone, A. Piccioni, N. Patelli, A. Paladini, A. Molinari, S. Caramori, P. O'Keeffe and F. Boscherini, Appl. Catal., B, 2018, 237, 603–612 CrossRef CAS.
- L. Triggiani, A. Brunetti, A. Aloi, R. Comparelli, M. L. Curri, A. Agostiano, M. Striccoli and R. Tommasi, J. Phys. Chem. C, 2014, 118, 25215–25222 CrossRef CAS.
- M. Sachs, E. Pastor, A. Kafizas and J. R. Durrant, J. Phys. Chem. Lett., 2016, 7, 3742–3746 CrossRef CAS PubMed.
- Á. Morales-García, R. Valero and F. Illas, J. Phys. Chem. C, 2020, 124, 11819–11824 CrossRef.
Footnote |
| † Electronic supplementary information (ESI) available. See DOI: https://doi.org/10.1039/d2sc06361a |
| This journal is © The Royal Society of Chemistry 2023 |

