 Open Access Article
Creative Commons Attribution 3.0 Unported Licence
In vitro antitumor activity, molecular dynamics simulation, DFT study, ADME prediction, and Eg5 binding of enastron analogues†
Abdeslem Bouzina *a,
Yousra Ouafa Bouonea,
Omar Sekioub,
Mohamed Aissaouia,
Tan-Sothea Oukc,
Abdelhak Djemelde,
Rachida Mansourib,
Malika Ibrahim-Ouali
 f,
Zihad Bouslamab and
Nour-Eddine Aoufa
aLaboratory of Applied Organic Chemistry, Bioorganic Chemistry Group, Department of Chemistry, Sciences Faculty, Badji Mokhtar Annaba University, Box 12, 23000 Annaba, Algeria. E-mail: abdeslem.bouzina@univ-annaba.dz; bouzinaabdeslem@yahoo.fr
bEnvironmental Research Center (CRE), 23000 Annaba, Algeria
cLaboratoire Peirene, EA7500 Université de Limoges, 123 Avenue Albert Thomas, 87000, Limoges Cedex, France
dResearch Unit in Medicinal Plants, URPM, 3000 Laghouat, Algeria
eResearch Center of Biotechnology, CRBt, 25000 Constantine, Algeria
fAix Marseille Univ, CNRS, Centrale Marseille, iSm2, Marseille F-13397, France
First published on 28th June 2023
Abstract
The objective of this study is to evaluate a series of molecules based on cyclosulfamide as potential anticancer agents. Additionally, the study aims to analyze the obtained results through in silico studies; by conducting experiments and utilizing theoretical methods. In this context, we investigated the cytotoxic activity of enastron analogues on three human cell lines PRI (lymphoblastic cell line) derived from B-cell lymphoma. JURKAT (ATCC TIB-152) acute T cell leukaemia and K562 (ATCC CLL-243) is a chronic myelogenous leukaemia. Most of the tested compounds showed good inhibitory activity compared with the reference ligand (chlorambucil). The 5a derivative demonstrated the strongest effect against all cancer cells used. Furthermore, molecular docking simulations of the Eg5–enastron analogue complex revealed that studied molecules have the ability to inhibit the Eg5 enzyme, as evidenced by their calculated docking score. Following the promising results from the molecular docking study, the complex Eg5–4a underwent a 100 ns molecular dynamics simulation using Desmond. During the simulation, the receptor-ligand pairing demonstrated substantial stability after the initial 70 ns. In addition, we used DFT calculations to analyze the electronic and geometric characteristics of the studied compounds. The HOMO and LUMO band gap energies, and the molecular electrostatic potential surface were also deducted for the stable structure of each compound. Also, we studied the prediction of absorption, distribution, metabolism and excretion (ADME) of the compounds.
Introduction
Cancerous diseases represent one of the biggest issues threatening global health, and are the second leading causes of mortality worldwide after cardiovascular diseases, accounting for 10 million deaths in 2020.1Cancer is a disease occurring in different parts of the body by changes in cell functions caused by successive genes mutations that lead to abnormal cell growth, which generally results in the formation of a solid mass of cells called a tumor.2,3 In the past, the main ways to manage cancers were essentially radiotherapy and surgery.2,4 Then chemotherapy emerged as an important tool to face cancer cell proliferation especially after the effectiveness showed by nitrogen mustards in the treatment of malignant lymphoma in the 1940s.5 Afterward, a large number of chemotherapeutic agents were developed and proved their role against cancerous diseases with different mechanisms of actions citing alkylating agents, antimetabolites, antimicrotubular agents, DNA-interactive agents, molecular targeting agents, hormones, monoclonal antibodies and other biological agents.6,7 Despite the fact that there are several anticancer drugs effectively used in cancer treatment, the drug development in cancer chemotherapy is still an ongoing necessity in order to overcome the existing treatments harmful side effects.
One of the human enzymes that are considered as interesting targets for drug development of cancer chemotherapy the kinesin spindle protein (KSP); a member of kinesin superfamily present in many tissues including testis, thymus, tonsils, and bone marrow.8 KSP also known as Eg5 plays a key role during the mitotic phase of cell division by forming bipolar spindles.9 An overexpression of this enzyme is observed in solid tumors and leukemia. Eg5 inhibition can result in stopping mitosis and causing apoptosis of cancer cell lines.10 The first small molecule showing inhibitory activity against Eg5 was the pyrimidine-based compound known as monastrol. Since its identification by Mayer et al. in 1999, Monastrol was considered as the prototype of KSP/Eg5 inhibitors and the research for new molecules targeting the mitotic kinesin Eg5 has emerged.11 Subsequently, a great number of heterocyclic-based Eg5 inhibitors were reported as anticancer and antitumor agents including other DHPMs such as enastron,12 quinazolines such as ispinesib,13 thiadiazoles such as filanesib,14 thiazolopyrimidines, isoquinolines, and many others (Fig. 1).15
On the other hand, benzothiadiazinone dioxides (also called cyclosulfamides) are important heterocyclic-based compounds bearing the sulfamide moiety that is recognized as a remarkable pharmacophore with a high number of applications in the fields of medicinal chemistry and drug development.16 Different pharmacological activities of cyclic sulfamides were reported in the literature comprising antibacterial,17 antiviral,18 anti-inflammatory,19 and anticancer activities.20 Further, the high capacity of cyclosulfamides in inhibiting many enzymes and target proteins such as phosphodiesterase 7 (PDE7),21 aspartic proteases,22 and serine proteases23 turned interest of scientists to conceive more molecules containing this scaffold.
In this context, our study focused on the evaluation of a series of cyclosulfamide-based derivatives exclusively as antitumor agents with the aim of developing new candidate molecules against cancer disease. To analyze the obtained results from the biological activities, in silico investigations against Eg5 enzyme were also performed to verify the antitumor activities. In addition, we studied the chemical reactivity of studied compounds using DFT. Furthermore, ADME analyses have been executed to evaluate the performance of physico-chemical properties of tested compounds.
Materials and methods
Chemistry
![[thin space (1/6-em)]](https://www.rsc.org/images/entities/char_2009.gif) :
:![[thin space (1/6-em)]](https://www.rsc.org/images/entities/char_2009.gif) 10, v/v) with 0.1% of formic acid to H2O/CH3CN (10
10, v/v) with 0.1% of formic acid to H2O/CH3CN (10![[thin space (1/6-em)]](https://www.rsc.org/images/entities/char_2009.gif) :
:![[thin space (1/6-em)]](https://www.rsc.org/images/entities/char_2009.gif) 90, v/v) with 0.1% of formic acid at a flow rate of 0.5 mL min−1, with UV monitoring at the wavelength of 254 nm with a run time of 10 min. Microanalysis spectra were performed by Elementar Analyzer (Euro E.A. 3000-V3.0-single-2007) and the determined values were within the acceptable limits of the calculated values. Melting points were recorded on a Büchi B-545 apparatus in open capillary tubes. Microwave assisted reactions were carried out using a Biotage Initiator Microwave Synthesizer 2.0 with a nominal power of 400 W. The reactions were carried out in a reactor to MW (volume: 10 mL) under pression at room temperature.
90, v/v) with 0.1% of formic acid at a flow rate of 0.5 mL min−1, with UV monitoring at the wavelength of 254 nm with a run time of 10 min. Microanalysis spectra were performed by Elementar Analyzer (Euro E.A. 3000-V3.0-single-2007) and the determined values were within the acceptable limits of the calculated values. Melting points were recorded on a Büchi B-545 apparatus in open capillary tubes. Microwave assisted reactions were carried out using a Biotage Initiator Microwave Synthesizer 2.0 with a nominal power of 400 W. The reactions were carried out in a reactor to MW (volume: 10 mL) under pression at room temperature.In a reactor MW (volume: 10 mL) taken a mixture of aldehyde (1 mmol), sulfamide (1 mmol), and cyclohexane-1,3-dione (1 mmol) in the presence of H2SO4 (0.1 mmol)/CH3COOH (0.9 mmol) as catalyst under solvent-free at room temperature. The reaction mixture was subjected to microwave irradiation for appropriate time. After completion of the reaction (5–10 min), as indicated by TLC, silica gel; dichloromethane![[thin space (1/6-em)]](https://www.rsc.org/images/entities/char_2009.gif) :
:![[thin space (1/6-em)]](https://www.rsc.org/images/entities/char_2009.gif) methanol (9
methanol (9![[thin space (1/6-em)]](https://www.rsc.org/images/entities/char_2009.gif) :
:![[thin space (1/6-em)]](https://www.rsc.org/images/entities/char_2009.gif) 1), mixture of ethanol and acetone (9
1), mixture of ethanol and acetone (9![[thin space (1/6-em)]](https://www.rsc.org/images/entities/char_2009.gif) :
:![[thin space (1/6-em)]](https://www.rsc.org/images/entities/char_2009.gif) 1) or mixture of ethyl acetate and n-hexane (5/5) was added to the reaction and pure product was crystallized to 6 °C overnight. The products were finally filtered and dried.
1) or mixture of ethyl acetate and n-hexane (5/5) was added to the reaction and pure product was crystallized to 6 °C overnight. The products were finally filtered and dried.
4-Phenyl-4,6,7,8-tetrahydro-1H-benzo[c][1,2,6]thiadiazin-5(3H)-one 2,2-dioxide (1a, C13H14N2O3S). Cristal; 92% yield; Rf = 0.20 (CH2Cl2/CH3OH:85/15); 1H NMR (400 MHz, DMSO-d6): δ = 1.95–2.02 (m, 2H, CH2), 2.20–2.29 (m, 1H, CH2), 2.38–2.43 (m, 1H, CH2), 2.43–2.50 (m, 2H, CH2), 5.35 (d, J = 6.0 Hz, 1H, CH*), 7.20–7.24 (m, 5H, H–Ar), 7.93 (d, J = 4.4 Hz, 1H, NH–CH*), 10.84 (brs, 1H, NH) ppm; 13C NMR (100 MHz, DMSO-d6): δ = 22.98, 27.55, 36.99, 55.69, 107.90, 126.78, 127.45, 127.81, 139.36, 156.00, 194.42 ppm; IR (KBr): ν = 3286 (NH), 3121 (NH), 1632 (C
![[double bond, length as m-dash]](https://www.rsc.org/images/entities/char_e001.gif) O), 1598 (C
O), 1598 (C![[double bond, length as m-dash]](https://www.rsc.org/images/entities/char_e001.gif) C), 1356 and 1171 (SO2) cm−1; MS: (m/z) = 279.0 (M + 1); anal. calc. for C13H14N2O3S: C, 56.10; H, 5.07; N, 10.07; found: C, 56.13; H, 5.02; N, 10.03.
C), 1356 and 1171 (SO2) cm−1; MS: (m/z) = 279.0 (M + 1); anal. calc. for C13H14N2O3S: C, 56.10; H, 5.07; N, 10.07; found: C, 56.13; H, 5.02; N, 10.03.
4-(2-Fluorophenyl)-4,6,7,8-tetrahydro-1H-benzo[c][1,2,6]thiadiazin-5(3H)-one 2,2-dioxide (2a, C13H13FN2O3S). White powder; 91% yield; Rf = 0.19 (CH2Cl2/CH3OH:85/15); 1H NMR (400 MHz, DMSO-d6): δ = 1.93–2.05 (m, 2H, CH2), 2.21–2.29 (m, 1H, CH2), 2.30–2.40 (m, 1H, CH2), 2.52–2.65 (m, 2H, CH2), 5.60 (d, J = 8.0 Hz, 1H, CH*), 7.02 (t, J = 8.0 Hz, 1H, H–Arortho), 7.13 (t, J = 12.0 Hz, 2H, H–Arpara,meta), 7.27 (q, J = 8.1 Hz, 1H, H–Armeta), 8.01 (d, J = 8.0 Hz, 1H, NH–CH*), 10.91 (brs, 1H, NH) ppm; 13C NMR (100 MHz, DMSO-d6): δ = 20.75, 27.83, 36.30, 49.75, 106.45, 115.13, 113.11, 126.31, 129.04, 129.65, 158.78, 164.73, 195.92 ppm; IR (KBr): ν = 3261 (NH), 3108 (NH), 1606 (C
![[double bond, length as m-dash]](https://www.rsc.org/images/entities/char_e001.gif) O), 1488 (C
O), 1488 (C![[double bond, length as m-dash]](https://www.rsc.org/images/entities/char_e001.gif) C), 1353 and 1171 (SO2) cm−1; MS: (m/z) = 297.1 (M + 1); anal. calc. for C13H13FN2O3S: C, 52.69; H, 4.42; N, 9.45; found: C, 52.60; H, 4.37; N, 9.49.
C), 1353 and 1171 (SO2) cm−1; MS: (m/z) = 297.1 (M + 1); anal. calc. for C13H13FN2O3S: C, 52.69; H, 4.42; N, 9.45; found: C, 52.60; H, 4.37; N, 9.49.
4-(3-Fluorophenyl)-4,6,7,8-tetrahydro-1H-benzo[c][1,2,6]thiadiazin-5(3H)-one 2,2-dioxide (3a, C13H13FN2O3S). White powder; 92% yield; Rf = 0.18 (CH2Cl2/CH3OH:85/15); 1H NMR (400 MHz, DMSO-d6): δ = 1.92–2.03 (m, 2H, CH2), 2.21–2.27 (m, 1H, CH2), 2.29–2.38 (m, 1H, CH2), 2.50–2.57 (m, 2H, CH2), 5.59 (d, J = 7.01 Hz, 1H, CH*), 7.02 (td, J1 = 7.60, J2 = 1.0 Hz, 1H, H–Armeta), 7.02–7.22 (m, 2H, H–Arortho,para), 7.28 (ddd, J1 = 15.2, J2 = 5.4, J3 = 1.8 Hz, 1H, H–Armeta), 8.05 (d, J = 7.20 Hz, 1H, NH–CH*), 10.98 (brs, 1H, NH) ppm; 13C NMR (100 MHz, DMSO-d6): δ = 20.99, 28.05, 38.60, 49.96, 106.66, 114.93, 123.33, 126.53, 129.29, 129.99, 158.94, 161.46, 196.19 ppm; IR (KBr): ν = 3429 (NH), 3268 (NH), 1632 (C
![[double bond, length as m-dash]](https://www.rsc.org/images/entities/char_e001.gif) O), 1606 (C
O), 1606 (C![[double bond, length as m-dash]](https://www.rsc.org/images/entities/char_e001.gif) C), 1340 and 1168 (SO2) cm−1; MS: (m/z) = 297.0 (M + 1); anal. calc. for C13H13FN2O3S: C, 52.69; H, 4.42; N, 9.45; found: C, 52.64; H, 4.48; N, 9.52.
C), 1340 and 1168 (SO2) cm−1; MS: (m/z) = 297.0 (M + 1); anal. calc. for C13H13FN2O3S: C, 52.69; H, 4.42; N, 9.45; found: C, 52.64; H, 4.48; N, 9.52.
4-(4-Hydroxyphenyl)-4,6,7,8-tetrahydro-1H-benzo[c][1,2,6]thiadiazin-5(3H)-one 2,2-dioxide (4a, C13H14N2O4S). White powder; 90% yield; Rf = 0.20 (CH2Cl2/CH3OH:85/15); 1H NMR (400 MHz, DMSO-d6): δ = 1.92–2.05 (m, 2H, CH2), 2.24–2.26 (m, 1H, CH2), 2.28–2.30 (m, 1H, CH2), 2.40–2.54 (m, 2H, CH2), 5.42 (d, J = 6.8 Hz, 1H, CH*), 6.38 (s, 1H, OH), 7.40 (d, J = 8.4 Hz, 2H, H–Ar), 7.60 (d, J = 8.0 Hz, 2H, H–Ar), 8.11 (d, J = 6.8 Hz, 1H, NH–CH*), 11.01 (brs, 1H, NH) ppm; 13C NMR (100 MHz, DMSO-d6): δ = 20.01, 28.07, 36.49, 55.17, 107.03, 124.40, 124.44, 125.72, 127.31, 128.69, 144.33, 193.69 ppm; IR (KBr): ν = 3475 (OH), 3261 (NH), 1702 (C
![[double bond, length as m-dash]](https://www.rsc.org/images/entities/char_e001.gif) O), 1639 (C
O), 1639 (C![[double bond, length as m-dash]](https://www.rsc.org/images/entities/char_e001.gif) C), 1356 and 1171 (SO2) cm−1; MS: (m/z) = 311.1 (M + H2O); anal. calc. for C13H14N2O4S: C, 52.05; H, 4.79; N, 9.52; found: C, 52.12; H, 4.84; N, 9.49.
C), 1356 and 1171 (SO2) cm−1; MS: (m/z) = 311.1 (M + H2O); anal. calc. for C13H14N2O4S: C, 52.05; H, 4.79; N, 9.52; found: C, 52.12; H, 4.84; N, 9.49.
4-(4-(Trifluoromethyl)phenyl)-4,6,7,8-tetrahydro-1H-benzo[c][1,2,6]thiadiazin-5(3H)-one 2,2-dioxide (5a, C14H13F3N2O3S). White powder; 88% yield; Rf = 0.21 (CH2Cl2/CH3OH:85/15); 1H NMR (400 MHz, DMSO-d6): δ = 1.68–1.82 (m, 2H, CH2), 1.83–1.86 (m, 1H, CH2), 1.89–2.02 (m, 1H, CH2), 2.15–2.48 (m, 2H, CH2), 5.07 (s, 1H, CH*), 6.75–7.08 (m, 3H, H–Ar), 7.10–7.13 (m, 1H, H–Ar), 7.14–7.21 (m, 1H, NH–CH*), 10.47 (brs, 1H, NH) ppm; 13C NMR (100 MHz, DMSO-d6): δ = 20.40, 27.26, 36.67, 48.11, 101.16, 111.58, 115.52, 121.38, 124.24, 129.27, 150.12, 166.99, 196.00 ppm; IR (KBr): ν = 3225 (NH), 3116 (NH), 1702 (C
![[double bond, length as m-dash]](https://www.rsc.org/images/entities/char_e001.gif) O), 1598 (C
O), 1598 (C![[double bond, length as m-dash]](https://www.rsc.org/images/entities/char_e001.gif) C), 1354 and 1170 (SO2) cm−1; MS: (m/z) = 324.0 (M + 1); anal. calc. for C13H13N3O5S: C, 48.55; H, 3.78; N, 8.09; found: C, 48.62; H, 3.84; N, 8.13.
C), 1354 and 1170 (SO2) cm−1; MS: (m/z) = 324.0 (M + 1); anal. calc. for C13H13N3O5S: C, 48.55; H, 3.78; N, 8.09; found: C, 48.62; H, 3.84; N, 8.13.
4-(2-Hydroxy-4-nitrophenyl)-4,6,7,8-tetrahydro-1H-benzo[c][1,2,6]thiadiazin-5(3H)-one 2,2-dioxide (6a, C13H13N3O6S). Colorless powder: insoluble. 88% yield; Rf = 0.29 (CH2Cl2/CH3OH:85/15), IR (KBr): ν = 3435 (NH), 3267 (NH), 1640 (C
![[double bond, length as m-dash]](https://www.rsc.org/images/entities/char_e001.gif) O), 1606 (C
O), 1606 (C![[double bond, length as m-dash]](https://www.rsc.org/images/entities/char_e001.gif) C), 1341 and 1172 (SO2) cm−1; anal. calc. for C13H13N3O6S: C, 46.02; H, 3.86; N, 12.38; found: C, 46.09; H, 3.89; N, 12.33.
C), 1341 and 1172 (SO2) cm−1; anal. calc. for C13H13N3O6S: C, 46.02; H, 3.86; N, 12.38; found: C, 46.09; H, 3.89; N, 12.33.
4-(4-Bromophenyl)-4,6,7,8-tetrahydro-1H-benzo[c][1,2,6]thiadiazin-5(3H)-one 2,2-dioxide (7a, C13H13BrN2O3S). Yellow powder; 90% yield; Rf = 0.20 (CH2Cl2/CH3OH:85/15); 1H NMR (400 MHz, DMSO-d6): δ = 1.92–2.15 (m, 2H, CH2), 2.27–2.30 (m, 1H, CH2), 2.37–2.43 (m, 1H, CH2), 2.50–2.57 (m, 2H, CH2), 5.32 (d, J = 6.4 Hz, 1H, CH*), 7.14 (d, J = 8.4 Hz, 2H, H–Ar), 7.42 (d, J = 7.2 Hz, 2H, H–Ar), 8.02 (d, J = 6.8 Hz, 1H, NH–CH*), 10.97 (brs, 1H, NH) ppm; 13C NMR (100 MHz, DMSO-d6): δ = 21.16, 27.06, 36.28, 55.08, 107.32, 119.97, 130.14, 130.39, 139.03, 156.60, 193.73 ppm; IR (KBr): ν = 3253 (NH), 3128 (NH), 1703 (C
![[double bond, length as m-dash]](https://www.rsc.org/images/entities/char_e001.gif) O), 1602 (C
O), 1602 (C![[double bond, length as m-dash]](https://www.rsc.org/images/entities/char_e001.gif) C), 1354 and 1170 (SO2) cm−1; MS: (m/z) = 357.0 (M + 1), 359.0 (M + 2); anal. calc. for C13H13BrN2O3S: C, 43.71; H, 3.67; N, 7.84; found: C, 43.67; H, 3.70; N, 7.86.
C), 1354 and 1170 (SO2) cm−1; MS: (m/z) = 357.0 (M + 1), 359.0 (M + 2); anal. calc. for C13H13BrN2O3S: C, 43.71; H, 3.67; N, 7.84; found: C, 43.67; H, 3.70; N, 7.86.
4-(4-Chlorophenyl)-4,6,7,8-tetrahydro-1H-benzo[c][1,2,6]thiadiazin-5(3H)-one 2,2-dioxide (8a, C13H13ClN2O3S). White powder; 92% yield; Rf = 0.20 (CH2Cl2/CH3OH:85/15); 1H NMR (400 MHz, DMSO-d6): δ = 1.92–2.03 (m, 2H, CH2), 2.22–2.24 (m, 1H, CH2), 2.25–2.30 (m, 1H, CH2), 2.37–2.57 (m, 2H, CH2), 5.31 (d, J = 6.8 Hz, 1H, CH*), 7.14 (d, J = 8.4 Hz, 2H, H–Arortho), 7.42 (d, J = 8.4 Hz, 2H, H–Armeta), 8.02 (d, J = 6.8 Hz, 1H, NH–CH*), 10.97 (brs, 1H, NH) ppm; 13C NMR (100 MHz, DMSO-d6): δ = 20.99, 28.04, 36.54, 55.08, 107.32, 119.57, 130.14, 130.39, 139.02, 156.35, 193.72 ppm; IR (KBr): ν = 3431 (NH), 3254 (NH), 1701 (C
![[double bond, length as m-dash]](https://www.rsc.org/images/entities/char_e001.gif) O), 1601 (C
O), 1601 (C![[double bond, length as m-dash]](https://www.rsc.org/images/entities/char_e001.gif) C), 1352 and 1169 (SO2) cm−1; MS: (m/z) = 313.0 (M + 1); anal. calc. for C13H13ClN2O3S: C, 49.92; H, 4.19; N, 8.96; found: C, 49.84; H, 4.23; N, 8.88.
C), 1352 and 1169 (SO2) cm−1; MS: (m/z) = 313.0 (M + 1); anal. calc. for C13H13ClN2O3S: C, 49.92; H, 4.19; N, 8.96; found: C, 49.84; H, 4.23; N, 8.88.
4-(2-Chlorophenyl)-4,6,7,8-tetrahydro-1H-benzo[c][1,2,6]thiadiazin-5(3H)-one 2,2-dioxide (9a, C13H13ClN2O3S). White powder; 91% yield; Rf = 0.19 (CH2Cl2/CH3OH:85/15); 1H NMR (400 MHz, DMSO-d6): δ = 1.91–2.07 (m, 2H, CH2), 2.27–2.32 (m, 1H, CH2), 2.34–2.40 (m, 1H, CH2), 2.53–2.64 (m, 2H, CH2), 5.58 (d, J = 6.4 Hz, 1H, CH*), 7.02 (td, J1 = 7.5, J2 = 1.1 Hz, 2H, H–Ar), 7.11 (ddd, J1 = 16.4, J2 = 8.5, J3 = 1.3 Hz, 1H, H–Ar), 7.27 (ddd, J1 = 15.3, J2 = 5.4, J3 = 1.8 Hz, 1H, H–Ar), 8.02 (d, J = 6.8 Hz, 1H, NH–CH*), 10.97 (brs, 1H, NH) ppm; 13C NMR (100 MHz, DMSO-d6): δ = 20.98, 28.04, 36.53, 49.89, 106.52, 114.68, 114.90, 123.30, 126.38, 126.51, 129.25, 129.88, 158.98, 193.85 ppm; IR (KBr): ν = 3272 (NH), 3126 (NH), 1702 (C
![[double bond, length as m-dash]](https://www.rsc.org/images/entities/char_e001.gif) O), 1606 (C
O), 1606 (C![[double bond, length as m-dash]](https://www.rsc.org/images/entities/char_e001.gif) C), 1353 and 1171 (SO2) cm−1; MS: (m/z) = 313.0 (M + 1); anal. calc. for C13H13ClN2O3S: C, 49.92; H, 4.19; N, 8.96; found: C, 49.97; H, 4.25; N, 8.89.
C), 1353 and 1171 (SO2) cm−1; MS: (m/z) = 313.0 (M + 1); anal. calc. for C13H13ClN2O3S: C, 49.92; H, 4.19; N, 8.96; found: C, 49.97; H, 4.25; N, 8.89.
Antitumor activity
Cells (3 × 10⁴ cells per mL) were grown on microtiter plates (200 mL of cell suspension per well) in 96 well microplates with serial dilutions of the compounds. 48 h later, 10 mL of a MTT solution (5 mg mL−1 in PBS) were added in each well. The plate was incubated for 4 h at 37 °C in a CO2 incubator. Then, 180 mL of medium were removed from each well and 180 mL of DMSO were added to each sample. When all the crystals were dissolved, absorbance was measured at 570 nm with a microplate reader (Elx 800 microplate reader).
Computational methods
The final prepared PDB file of the protein and synthesized analogues were submitted in order to run docking process. Docking studies were performed by Glide software28 at extra precision.29 Output files of docked analogues along with Eg5 protein were visualised on Chimera software.30
Regarding this part of the work, we used the SwissADME web tool via the link: https://www.swissadme.ch, which provides free access to a pool of quick yet reliable predictive models for physicochemical properties, pharmacokinetics, drug-likeness, and medicinal chemistry friendliness, including in-house effective techniques like the BOILED-Egg, iLOGP, and Bioavailability Radar.36
The Drug Likeness Score (DLS) results were determined using the Molsoft web tool via the link: https://www.molsoft.com/.37
Results and discussion
Chemistry
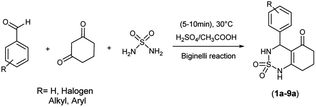
The used compounds in this study were described by our team previously.24A single step of the Biginelli cyclo-condensation reaction was used to create the investigated benzothiadiazinone dioxides.
The reaction involved combining different aromatic aldehydes, cyclohexanedione, and sulfamide with a catalytic amount of H2SO4/CH3COOH (1/9) under microwave irradiation and solvent-free conditions at room temperature to produce the desired derivatives (Scheme 1).
Table 1 displays the structures of synthesized benzothiadiazinone dioxides (1a–9a).
Mechanistic proposal
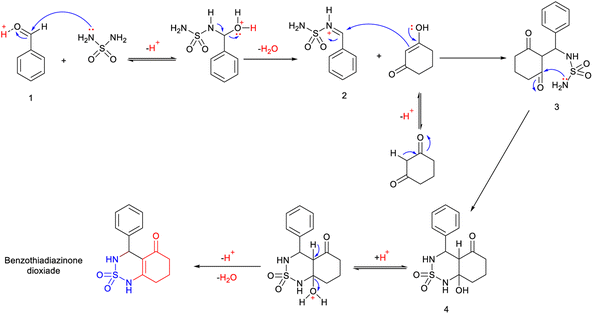
A possible mechanism for this reaction is presented in Scheme 2. The reaction begins with the aldehyde being protonated and the formation of benzylideneoxonium cation 1, facilitated by the exchange of its proton with H2SO4/CH3COOH. Furthermore, microwave irradiation assists in accelerating this process and renders the carbonyl group more susceptible to nucleophilic attack by the sulfamide. This step is succeeded by the formation of activated N-iminium ion intermediate 2. Subsequently, the latter undergoes nucleophilic attack by the tautomer of cyclohexane-1,3-dione on the double bond of N-iminium ion 2, resulting in the formation of open-chain intermediate 3. Eventually, intermediate 3 cyclizes to yield hydrobenzothiadiazinone dioxide 4. The final benzothiadiazinone dioxide product is obtained through acid-catalyzed and microwave irradiation-induced elimination of water.Antitumor results
Antimitotic drugs have the potential to be an interesting target for medicinal chemists due to their possible therapeutic use in cancer chemotherapy. These drugs prevent the proliferation of cancer cells by interfering with the polymerization or depolymerization of microtubules.38 Several families of compounds have been described in the literature showing potent cytotoxic activity against human cancer cell lines which include diarylisoxazole,39 sulfonamide40 and benzothiadiazine.41In this context and to develop new active antimitotic agents, we evaluated a series of benzothiadiazinone dioxide against human cancer cell lines, including LCL B cells (PRI), chronic myelogenous leukaemia cells (K562) and T-lymphoma cells (JURKAT) using MTT assay.42 Chlorambucil (CLB) was used as a reference.
The biological activity of studied derivatives was determined as IC50 values (μM) and was calculated by logistic regression analysis of dose response curves plotting between the percentage of viability and the concentration of the tested compounds.
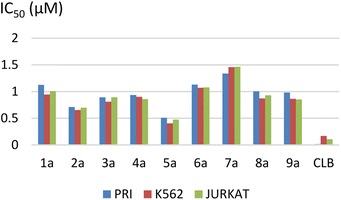
The results are summarized in Table 2 and Fig. 2.
| Code | IC50 (μM) ± SD | ||
|---|---|---|---|
| PRI | K562 | JURKAT | |
| 1a | 1.123 ± 0.157 | 0.943 ± 0.095 | 1.004 ± 0.264 |
| 2a | 0.708 ± 0.054 | 0.652 ± 0.075 | 0.697 ± 0.121 |
| 3a | 0.891 ± 0.108 | 0.810 ± 0.115 | 0.891 ± 0.108 |
| 4a | 0.934 ± 0.150 | 0.901 ± 0.131 | 0.858 ± 0.097 |
| 5a | 0.510 ± 0.064 | 0.404 ± 0.045 | 0.474 ± 0.089 |
| 6a | 1.131 ± 0.198 | 1.071 ± 0.121 | 1.079 ± 0.099 |
| 7a | 1.337 ± 0.210 | 1.456 ± 0.307 | 1.464 ± 0.271 |
| 8a | 1.003 ± 0.207 | 0.871 ± 0.173 | 0.930 ± 0.133 |
| 9a | 0.982 ± 0.133 | 0.864 ± 0.274 | 0.851 ± 0.133 |
| CLB | 0.015 ± 0.001 | 0.167 ± 0.073 | 0.106 ± 0.065 |
The IC50 ranged from 0.51 ± 0.06 to 1.33 ± 0.21 μM for the PRI cell, from 0.40 ± 0.04 to 1.45 ± 0.30 μM for the K562 cell, and from 0.47 ± 0.08 to 1.46 ± 0.27 μM for the JURKAT cell.
We observed that the activity of compounds against the three human cancer cell lines was somewhat influenced by the structural diversity of the radicals on the aromatic ring.
The basic compound 1a showed moderate activity (IC50 = 1.12 ± 0.15 μM) compared with the reference drug CLB (IC50 = 0.015 ± 0.001 μM). In addition, the compounds bearing a fluorine atom on the aromatic ring in different positions (2a, 3a, and 5a) showed the best activities against PRI and K562 cancer cells. Further, best JURKAT cells growth inhibition was found in compounds 2a, 5a, and 9a.
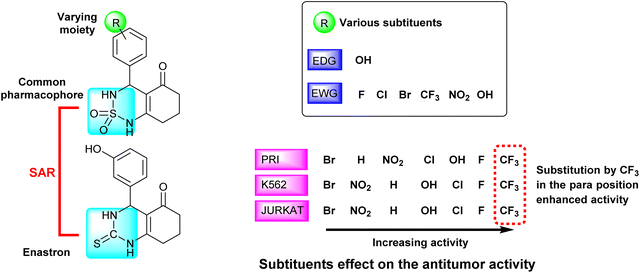
The obtained results of the biological activity on the three cells used is most effectively demonstrated by derivative 5a (PRI: IC50 = 0.51 ± 0.06 μM, K562: IC50 = 0.40 ± 0.04 μM, and JURKAT: IC50 = 0.47 ± 0.08 μM), which can be attributed to the presence of a trifluoromethyl group substituting three fluorine atoms in the para position of the aromatic ring.
Among the tested compounds, both compound 4a with a hydroxyl group substitution in the para position of the aromatic ring and compound 9a with a chlorine group substitution in the ortho position exhibited satisfactory cytotoxicity, demonstrating an IC50 below 1 μM against all three tested cells.
Derivatives substituted by a bulky group in the para position 6a, 7a, and 8a are the least active, especially the derivative 7a (PRI: IC50 = 1.33 ± 0.21 μM, K562: IC50 = 1.45 ± 0.307 μM, and JURKAT: IC50 = 1.46 ± 0.27 μM) which is substituted by a bromine atom.
In silico study
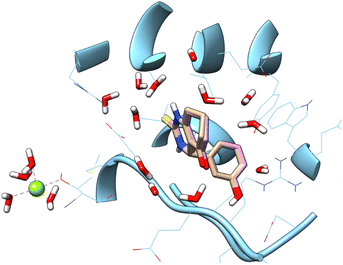
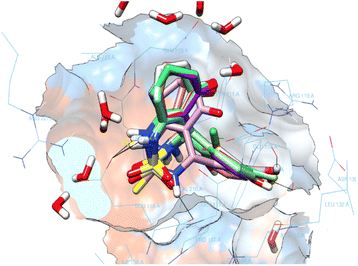
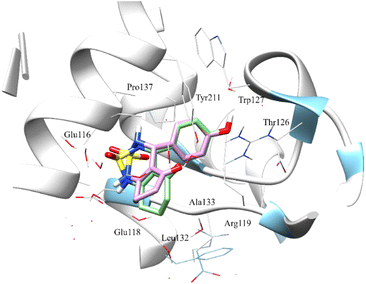
![[double bond, length as m-dash]](https://www.rsc.org/images/entities/char_e001.gif) S) group has been replaced with sulfonyl group (SO2), moreover other substitution on the phenyl ring. In the aim to achieve the interaction on the active site, a docking study was carried out. Accuracy of docking protocol was examined by re-docking of enastron in the active site of Eg5 enzyme (self-docking). Fig. 3 shows docked enastron and co-crystallized one in almost same position among the receptor (RMSD = 0.22 Å) that confirmed validation of docking protocol using extra precision glide (XP) scoring function, in presence of water molecules that are not beyond 5 Å from reference ligand.
S) group has been replaced with sulfonyl group (SO2), moreover other substitution on the phenyl ring. In the aim to achieve the interaction on the active site, a docking study was carried out. Accuracy of docking protocol was examined by re-docking of enastron in the active site of Eg5 enzyme (self-docking). Fig. 3 shows docked enastron and co-crystallized one in almost same position among the receptor (RMSD = 0.22 Å) that confirmed validation of docking protocol using extra precision glide (XP) scoring function, in presence of water molecules that are not beyond 5 Å from reference ligand.
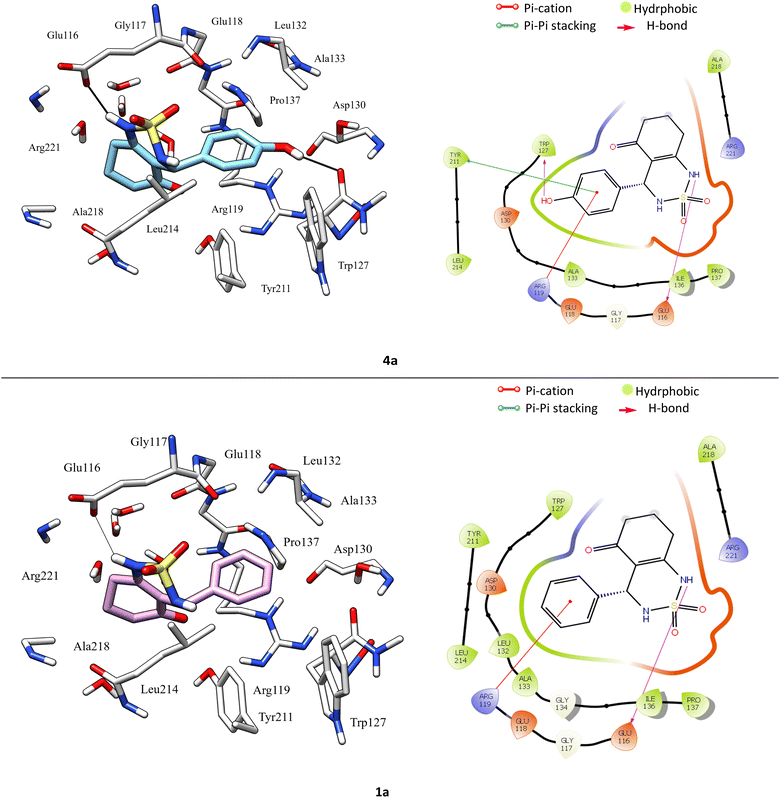
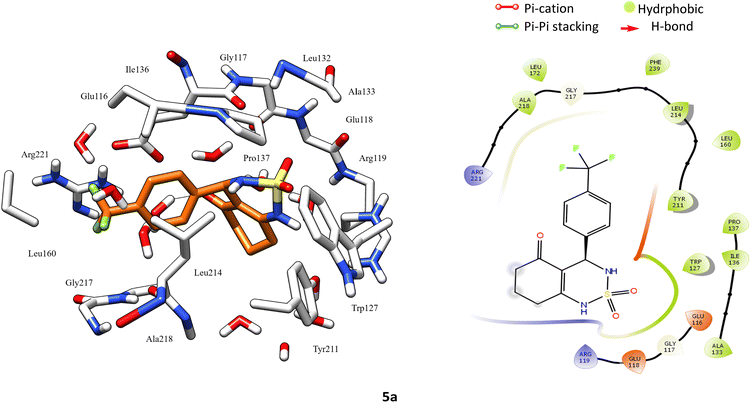
All enastron derivatives were docked into the active site of Eg5, and most studied compounds proved interesting stability inside the cavity (Fig. 4) with a glide score close to the one corresponding to the co-crystallized ligand, as shown in Table 3. Therefore, we were interested in studying the interaction of compounds that maintain hydrogen bonds, as well as hydrophobic interactions with residues of the active site.
| Ligands | Glide score |
|---|---|
| 4a | −6.95 |
| 9a | −6.64 |
| 1a | −6.58 |
| 3a | −6.58 |
| 2a | −6.56 |
| 5a | −6.54 |
| 6a | −6.30 |
| 8a | −5.30 |
| 7a | −5.27 |
| Enastron | −9.448 |
According to protein ligand interaction after visual check, the most consistent interaction is H-bond donor between side chain of Glu116 and nitrogen atom on cyclosulfamide ring. Synthesized ligands have shown mentioned interactions such as the co-crystallized ligand (figure ESI data†), and a backbone H-bond donor interaction was also detected between Trp127 and oxygen atom in the phenyl ring of compound 4a (Fig. 5). Due to this last interaction, the phenyl ring is inserted into a lipophilic cavity mainly delimited by Trp127, Ala133, Leu132, Tyr211 in which this group made Pi–Pi stacking interaction with the latter, which explains its great value of glide score. Therefore, we were interested in studying the interaction of these compounds.
After analyzing the other compounds, we distinguish that the substituent type on the phenyl ring plays a crucial role in the stability within the active site, in which compounds with a steric substituent at position para on the aromatic ring provoke medium stability compared with enastron inside the pocket, as is the case of 6a, 7a, and 8a compounds with NO2, Br, Cl substituent (Fig. 6).
Docking analysis revealed that the synthesized compounds interact with Eg5 in good manner and confirms the importance of H-bond donor group in cyclosulfamide ring, moreover the nature and position of substituent on the phenyl ring.
The results of the molecular docking studies support and provide an explanation for the biological test results.
The studied derivatives share the sulfonamide group as the common pharmacophore, the latter is linked to a cyclic system. The different positions and substituents on the aromatic ring have a notable influence on the biological activity and docking scores. Based on the obtained results, it was observed that the incorporation of a fluoride substituent enhanced the inhibition of all three tested cell lines. Fig. 7 effectively illustrates the effect of substituents on the biological activity.
![[thin space (1/6-em)]](https://www.rsc.org/images/entities/char_2009.gif) 689 TIP3 water molecules and 46
689 TIP3 water molecules and 46![[thin space (1/6-em)]](https://www.rsc.org/images/entities/char_2009.gif) 353 atoms. The Na+ replaced five water molecules to neutralize the net charge of the complex system 4a–Eg5. All protein atoms were maintained at a distance equal to 1.0 nm from the solvate box edges. The solvated system was subjected to energy minimization of 50
353 atoms. The Na+ replaced five water molecules to neutralize the net charge of the complex system 4a–Eg5. All protein atoms were maintained at a distance equal to 1.0 nm from the solvate box edges. The solvated system was subjected to energy minimization of 50![[thin space (1/6-em)]](https://www.rsc.org/images/entities/char_2009.gif) 000 steps. After that, the minimized system was equilibrated for 100 ps at 310 K. Following equilibration, the system was subjected to a final production run of 100 ns MD simulations at 310 K temperatures. Periodic boundary conditions were applied under isothermal and isobaric conditions with a relaxation time of 0.2 ps.46 MD simulation contributes to identifying the regions of the protein influenced by the presence of the ligand. These methods explicitly consider the whole protein–ligand system as flexible and can therefore be used for the validation of poses obtained by docking.47
000 steps. After that, the minimized system was equilibrated for 100 ps at 310 K. Following equilibration, the system was subjected to a final production run of 100 ns MD simulations at 310 K temperatures. Periodic boundary conditions were applied under isothermal and isobaric conditions with a relaxation time of 0.2 ps.46 MD simulation contributes to identifying the regions of the protein influenced by the presence of the ligand. These methods explicitly consider the whole protein–ligand system as flexible and can therefore be used for the validation of poses obtained by docking.47To this end, we carried out a MD simulation to confirm the previous mode of binding predicted by the molecular docking for compound 4a fitted in the active site of the kinesin spindle Eg5.
Thus, we evaluated the stability of the system by the variations of the RMSD values, the number of hydrogen bonds between the ligand 4a and the kinesin spindle Eg5, the root mean square fluctuation (RMSF) and monitoring the protein secondary structure elements (SSE) like alpha-helices and beta-strands throughout the simulation. In the literature, MD stability can be also analyzed by the radius of gyration and DSSP.48
The Fig. 8 shows the superimposition of the conformation resulting from the docking of the complex (4a–Eg5) before and after 100 ns of MD simulation. Analysis of the results shows that the ligand 4a retained the same binding site (before and after the MD simulation). In addition, the hydrogen bonds between Glu116, Tyr211, Glu118, Asp130 and residues, as well as all hydrophobic interactions with Leu132, Ala218, Pro137, and Ala133 residues, are retained.
Root mean square deviation (RMSD). The structural changes, specifically the deviation between the two compositions, can be best interpreted by measuring the protein and ligand PL-RMSD (Protein and Ligand Root Mean Square Deviation) obtained from the MD simulation trajectories. Changes in the order of 1–3 Å are perfectly acceptable for small molecules.49 The PL-RMSD measures the scale of distance between the protein and its ligand throughout the simulation time. All protein frames (1000 frames) are first aligned on the reference frame backbone (frame 0), and then the RMSD is calculated based on the C-alpha. Monitoring the RMSD of the protein can provide insights into the structural conformations throughout the simulation. It can indicate if the simulation is equilateral, and its fluctuations throughout the simulation are around some thermal average. Thus, a high RMSD value indicates the instability of the protein system. The comparative RMSD pattern analysis between the ligand 4a bound to the Eg5 protein demonstrates that both compositions showed a comparable RMSD value from the first nanosecond of the MD simulation trajectory. It's well established in MD literature that simulation time could extend until the system reached its equilibrium or when its main properties achieve stability.50 From the protein and ligand root-mean square deviation PL-RMSD data, we noted that all the systems have reached a plateau and equilibrated after 70 ns (Fig. 9). Then, we defined our productive phase into time intervals from 70 to 100 ns for all the simulations. After 70 ns of MD simulation, the ligand-RMSD values observed are significantly the same as the RMSD of the protein, indicating how stable the ligand is with respect to the protein and its binding pocket. The result of the PL-RMSD values indicated that has periodic backbone stability throughout the MD simulation while bound with the ligand 4a.
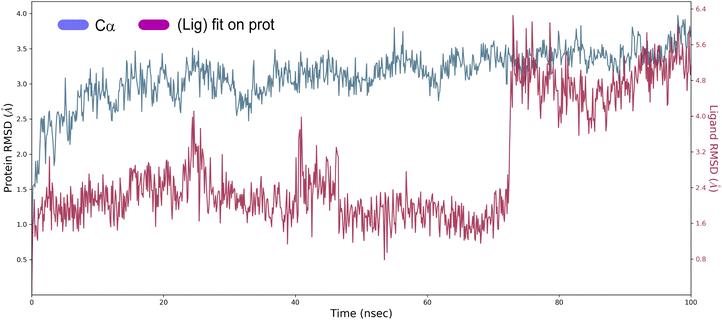 | ||
| Fig. 9 Protein and ligand root mean square deviation (PL-RMSD) obtained from the MD simulation trajectories. | ||
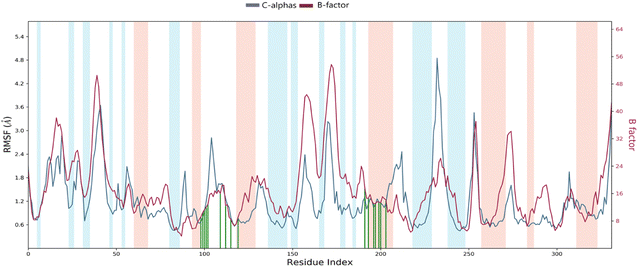
Root mean square fluctuation (RMSF). The RMSF is a crucial result for measuring the deviation from a reference position of a ligand atom during the simulation time. This parameter represents the average deviation for each residue compared to the same atoms of the reference structure. Indeed, Fig. 10 shows the RMSF diagram of the amino acids of Eg5 protein in the system studied 4a–Eg5. The results were compared with the atomic displacement factor “B factor” of the Cα atoms of each protein residue. On this plot, peaks indicate areas of the protein that fluctuate the most during the simulation. In addition, we observe that the tails (N- and C-terminal) fluctuate more than any other part of the protein. Secondary structure elements like alpha helices and beta strands (highlighted in red and blue backgrounds, respectively) are usually more rigid than the unstructured protein part and thus fluctuate less than the loop regions (white backgrounds). The RMSF monitoring revealed that the residues: Leu30 (2.33 Å), Ala37 (2.42 Å), Asp59 (3.91 Å), Ala74 (2.06 Å), Thr107 (1.97 Å), Asn122 (2.82 Å), Ser178 (2.39 Å), Pro188 (3.88 Å), Ala230 (2.45 Å), Ile250 (4.85 Å), and Asn271 (3.45 Å) have higher RMSF values of alpha carbons (Cα). Therefore, the comparison of the RMSF curve of the alpha carbons (Cα) of the complex with the curve of the atomic displacement factor “B-factor” indicates a good simulation since the curve is parallel to that “B-factor” throughout the 100 ns MD simulation.
Protein–ligand contacts analysis. Protein–ligand interactions or ‘contacts’ are categorized into four types: hydrogen bonds, hydrophobic interactions, ionic, and water bridges.
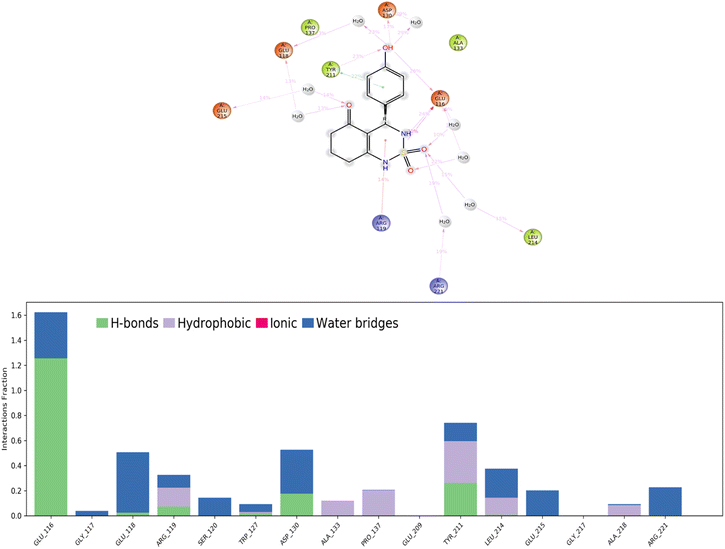
Hydrogen bonds. (H-bonds) play a critical role in ligand binding. Therefore, consideration of hydrogen-bonding properties in drug design is essential because of their strong influence on drug specificity, metabolization, and adsorption.51 In our study, hydrogen bonds formed between the 4a ligand and the Eg5 enzyme during the 100 ns of MD simulation are presented in Fig. 11.
The results show that the ligand formed 3 to 5 hydrogen bonds on average during the 100 ns of MD simulation which can be broken down into four subtypes: backbone acceptor (Glu116 128%); backbone donor (Tyr211 25.6%); side-chain acceptor (Asp130 17.7%).
Thus, supporting the results already obtained by the molecular docking, having predicted three hydrogen bonds formed between the 4a ligand with residues in the active site of the Eg5 enzyme.
Hydrophobic contacts. Fall into three subtypes: π–cation, π–π stacking, and other non-specific interactions. Generally, these types of interactions involve a hydrophobic amino acid and an aromatic or aliphatic group on the ligand. The results show that the ligand formed six hydrophobic contacts on average during the 100 ns of MD simulation, which can be broken down into three subtypes: π–cation (Arg119 15.10%), π–π stacking (Tyr211 22.1%), and other non-specific interactions (Ala133, Pro137, Tyr211, Leu214, Ala218).
Ionic interactions. Polar interactions are between two oppositely charged atoms within 3.7 Å of each other and do not involve a hydrogen bond. The obtained results of this study revealed that there are no ionic interactions between the ligand and the protein.
Water bridges. These are hydrogen-bonded protein–ligand interactions mediated by a water molecule. The hydrogen-bond geometry is slightly relaxed from the standard H-bond definition. The results show that the ligand formed multiple water bridges, especially between the Glu116, Glu118, Asp130, Leu214, and Glu215 amino acids and the 4a ligand.
A timeline representation of interactions and contacts (H-bonds, hydrophobic, ionic, and water bridges) is summarized in the Fig. 12. The top panel shows the total number of specific interactions the Eg5 protein makes with the ligand 4a over the 100 ns MD simulation trajectory. The bottom panel shows which residues interact with the ligand in each trajectory frame. Some residues, specifically: Glu166, Glu118, Asp130, Tyr211, Leu214 and Glu215, make more than one specific interaction with the ligand, which is represented by a darker orange shade, according to the scale to the right of the plot.
 | ||
| Fig. 12 Timeline representation of the interactions and contacts (H-bonds, hydrophobic, ionic, and water bridges) obtained from the MD simulation trajectories. | ||
Protein secondary structure elements (SSE) analysis. Protein secondary structure elements (SSE) like alpha-helices and beta-strands are monitored throughout the simulation. It is observed that the secondary structure elements (helix and beta-sheets) remained conserved throughout the simulation process (Fig. 13), which highlights the stability and reliability of the Eg5 after binding to the ligand. A bit of fluctuation is observed in the loop regions, but structurally, no significant changes have been seen. It has been also observed that the ligand is permanently attached to the active site without any structural modification, which implies that the ligand is highly stable. The secondary structural analysis has shown no significant overall conformational change in the complex.
The theoretical DFT calculations were performed in gas phase using B3LYP/6-31G(d,p) basis set method. All optimum compounds are stable, and this is approved in terms of the absence of the imaginary frequency (Fig. 14).
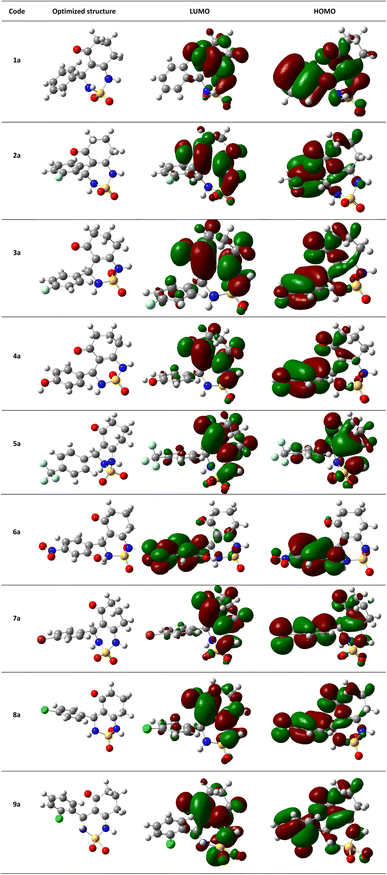 | ||
| Fig. 14 (HOMO, LUMO) orbitals and optimized structures (1a–9a) at B3LYP/6-31G(d,p) level using a contour threshold of 0.02 a.u in gas phase. | ||
The highest occupied molecular orbital (HOMO) and the lowest unoccupied molecular orbital (LUMO) are collectively referred to as frontier molecular orbitals (FMOs). The HOMO is occupied by electrons and has the highest energy level, making it an electron donor, while the LUMO is unoccupied and has the lowest energy level, allowing it to accept electrons, making it an electron acceptor. These FMOs are crucial in determining how ligands interact with their receptors. By providing qualitative information on the susceptibility of electrons in the HOMO to transfer to the LUMO, FMOs can aid in understanding the nature of these interactions. HOMO and LUMO are important quantum chemical parameters that determine the reactivity of molecules and are used to calculate various chemical reactivity descriptors.
All necessary parameters to study the chemical reactivity of synthesized compounds including energy gap, kinetic stability, chemical softness, chemical hardness (η), electronic chemical potential (μ), electronegativity (χ), electrophilicity index (ω), and hydrophobicity coefficient (Log![[thin space (1/6-em)]](https://www.rsc.org/images/entities/char_2009.gif) P) were calculated and listed in Table 4. Additionally, Fig. 14 shows the frontier molecular orbital HOMO and LUMO for the investigated compounds in gas phase.
P) were calculated and listed in Table 4. Additionally, Fig. 14 shows the frontier molecular orbital HOMO and LUMO for the investigated compounds in gas phase.
| Molecular descriptors | 1a | 2a | 3a | 4a | 5a | 6a | 7a | 8a | 9a |
|---|---|---|---|---|---|---|---|---|---|
Log![[thin space (1/6-em)]](https://www.rsc.org/images/entities/char_2009.gif) P P |
−0.07 | 0.08 | 0.08 | −0.046 | 0.85 | −0.39 | 0.75 | 0.48 | 0.48 |
| αtot (bohr3) | 165.36 | 167.95 | 167.95 | 210.13 | 178.93 | 214.13 | 196.88 | 181.19 | 185.16 |
| μ (D) | 4.8852 | 5.0287 | 4.0705 | 3.1712 | 5.7000 | 7.3096 | 4.9334 | 4.4620 | 5.1925 |
| EHOMO (eV) | −0.2382 | −0.2367 | −0.2361 | −0.2191 | −0.2470 | −0.2439 | −0.2379 | −0.2384 | −0.2367 |
| ELUMO (eV) | −0.0483 | −0.0517 | −0.0521 | −0.0477 | −0.0544 | −0.0873 | −0.0523 | −0.0535 | −0.0530 |
| ΔEgap (eV) | 0.1899 | 0.1850 | 0.1841 | 0.1714 | 0.1926 | 0.1566 | 0.1856 | 0.1850 | 0.1837 |
| (η) | 0.0949 | 0.0925 | 0.0920 | 0.0857 | 0.0963 | 0.0783 | 0.0928 | 0.0925 | 0.0919 |
| (S) | 10.5330 | 10.8091 | 10.8666 | 11.6713 | 10.3853 | 12.7747 | 10.7770 | 10.8120 | 10.8867 |
| (μ) | −0.1433 | −0.1442 | −0.1441 | −0.1334 | −0.1507 | −0.1656 | −0.1451 | −0.1460 | −0.1449 |
| (χ) | 0.1433 | 0.1442 | 0.1441 | 0.1334 | 0.1507 | 0.1656 | 0.1451 | 0.1460 | 0.1449 |
| (ω) | 0.1081 | 0.1124 | 0.1128 | 0.1039 | 0.1179 | 0.1752 | 0.1134 | 0.1152 | 0.1142 |
Based on the study, it appears that most of the compounds being analyzed have moderate lipophilicity with a Log![[thin space (1/6-em)]](https://www.rsc.org/images/entities/char_2009.gif) P range of [−0.39 to 0.75]. However, one derivative, 5a, has the highest value of Log
P range of [−0.39 to 0.75]. However, one derivative, 5a, has the highest value of Log![[thin space (1/6-em)]](https://www.rsc.org/images/entities/char_2009.gif) P at 0.85.
P at 0.85.
In terms of dipole moment, the range observed is [3.17–7.30], with compound 6a showing the highest value at 7.30. This is likely due to the presence of NO2 and OH substituents on the aromatic ring.
The polarizability depends on how the susceptibility of the molecular system electron cloud is affected by the approaching of a charge. Molecules of large size are more polarizable compounds. It is worth noting that compound 1a is the smallest in size and has the least polarizability (165.36 bohr3), however, 6a of the highest complexity is predicted to have the highest polarizability, 214.13 bohr3.
The results of the FMOs energy analysis revealed that the energies of compounds 6a and 4a are lower compared with the other compounds. However, the destabilization of the LUMO level is found to be higher in 6a than in the others.
The compound 5a showed the highest energy gap ΔEgap = 0.1926 eV, it is the most stable of all studied compounds.
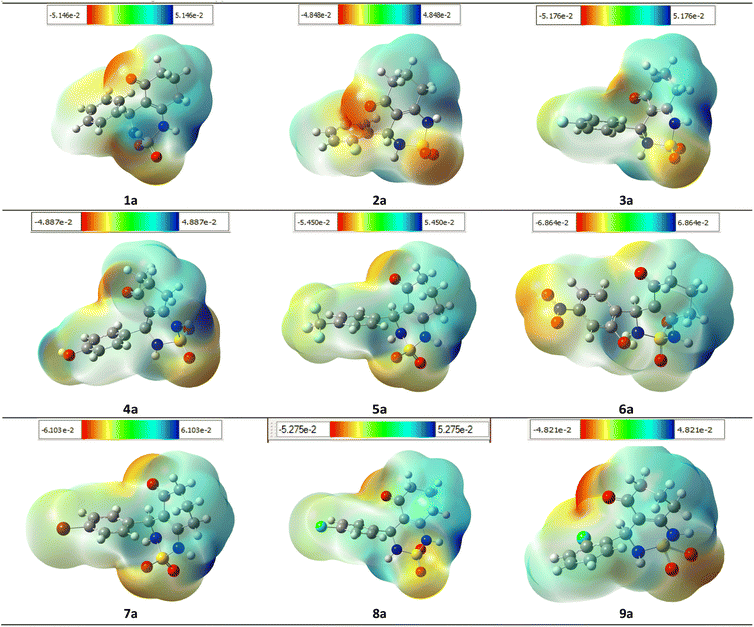
To ensure the validity of the evidence regarding the inhibitory properties of compounds, it is important to calculate the 3D plot molecular electrostatic potential (MEP). The MEP can provide insight into the size and shape of the electrostatic potential of a molecule, and can help predict physicochemical properties based on the molecular structure of the compounds being studied. Additionally, the MEP is a useful tool to explain hydrogen bonding and estimating a drug's reactivity towards electrophilic and nucleophilic attacks.
The MEP of compounds (1a–9a) was calculated using the same method and base sets. The MEP shows that the maximum negative region is the preferred site for electrophilic attacks, indicated by the red color. This means that an electrophile will be attracted to the negatively charged sites of the molecule. The opposite is true for the blue regions, where electrophiles will be repelled.
The mapping of the electrostatic potential around the compounds varied according to the type of atoms and their electronic nature. This variation can be responsible for differences in binding affinity with the active site receptor. Therefore, the MEP can be a useful tool in predicting a compound's inhibitory properties (Fig. 15).
The ability of a drug to reach the site of action is determined by its pharmacokinetic process, while the pharmacodynamic process assesses whether the drug can produce the desired pharmacological effect.
The Lipinski rule, also known as the rule of five, utilizes basic molecular descriptors formulated by Lipinski et al. to determine drug-likeness. According to this rule, most drug-like molecules possess a Log![[thin space (1/6-em)]](https://www.rsc.org/images/entities/char_2009.gif) P value less than or equal to 5, a molecular weight less than or equal to 500 Da, and no more than 10 hydrogen bond acceptors and 5 hydrogen bond donors. Molecules that violate more than one of these criteria may face challenges with bioavailability. Physicochemical parameters play a vital role in generation and escalation of bioactivity of chemical entity.
P value less than or equal to 5, a molecular weight less than or equal to 500 Da, and no more than 10 hydrogen bond acceptors and 5 hydrogen bond donors. Molecules that violate more than one of these criteria may face challenges with bioavailability. Physicochemical parameters play a vital role in generation and escalation of bioactivity of chemical entity.
The pharmacokinetic parameters of synthetic compounds are given in Table 5. Studied compounds (1a–9a) have molecular weight in the range of 278–357 (<500). Low molecular weight drug molecules (<500) are easily transported, diffused, and absorbed as compared to heavy molecules. Molecular weight is an important aspect in therapeutic drug action, if it increases correspondingly, it effects the drug action. Number of hydrogen bond acceptor and number of hydrogen bond donor in the tested compounds were found to be within Lipinski limit. H-bond acceptor ranged from 2 to 7 (<10) H-bond donor ranged from 1 to 3 (<5).
| Properties | 1a | 2a | 3a | 4a | 5a | 6a | 7a | 8a | 9a | CLB |
|---|---|---|---|---|---|---|---|---|---|---|
| Molecular weight (g per mole) | 278.33 | 296.32 | 296.32 | 294.33 | 346.32 | 339.32 | 357.22 | 312.77 | 312.77 | 304.21 |
| Rotatable bonds | 1 | 1 | 1 | 1 | 1 | 2 | 1 | 1 | 1 | 9 |
| H-bond donor | 2 | 2 | 2 | 3 | 2 | 3 | 2 | 2 | 2 | 1 |
| H-bond acceptor | 4 | 5 | 5 | 5 | 7 | 7 | 4 | 4 | 4 | 2 |
| Violations | 0 | 0 | 0 | 0 | 0 | 0 | 0 | 0 | 0 | 0 |
Log![[thin space (1/6-em)]](https://www.rsc.org/images/entities/char_2009.gif) Po/w iLOGP Po/w iLOGP |
1.17 | 1.47 | 1.29 | 1.03 | 1.61 | 0.51 | 1.87 | 1.67 | 1.57 | 4.62 |
Log![[thin space (1/6-em)]](https://www.rsc.org/images/entities/char_2009.gif) S ESOL S ESOL |
−2.10 | −2.26 | −2.26 | −1.97 | −2.97 | −2.04 | −3.02 | −2.70 | −2.70 | −2.44 |
| GI | High | High | High | High | High | High | High | High | High | High |
| BBB | No | No | No | No | No | No | No | No | No | No |
Log![[thin space (1/6-em)]](https://www.rsc.org/images/entities/char_2009.gif) Kp Kp |
−7.59 | −7.62 | −7.62 | −7.93 | −7.37 | −8.33 | −7.57 | −6.79 | −7.35 | −6.95 |
| Bioavailability score | 0.55 | 0.55 | 0.55 | 0.55 | 0.55 | 0.55 | 0.55 | 0.55 | 0.55 | 0.85 |
| TPSA (Å) | 83.65 | 83.65 | 83.65 | 103.88 | 107.64 | 149.70 | 83.65 | 83.65 | 83.65 | 40.54 |
| DLS | −0.78 | −0.49 | −0.46 | −0.16 | −0.66 | 0.07 | −0.66 | −0.27 | −0.025 | −0.66 |
Most compounds have one rotatable bond except compound 6a has two rotatable bonds (<10). Additionally, they showed good lipophilicity, as indicated by iLOGP values ranging from 0.51 to 1.87, which are less than <5 and they exhibited good water solubility, as indicated by Log![[thin space (1/6-em)]](https://www.rsc.org/images/entities/char_2009.gif) S ESOL values ranging from −1.97 to −3.02.
S ESOL values ranging from −1.97 to −3.02.
The skin permeability coefficient Kp values were found ranged from −8.33 to −6.79. Kp is an important parameter in the development of topical drug formulations and is linearly correlated with molecular size and lipophilicity. The more negative the Log![[thin space (1/6-em)]](https://www.rsc.org/images/entities/char_2009.gif) Kp (with Kp in cm s−1), the less skin permeant the molecule.
Kp (with Kp in cm s−1), the less skin permeant the molecule.
The ADME study revealed that none of the compounds violate the Lipinski's rule of five, which is a set of criteria used to assess the drug-likeness of a chemical compound based on its physicochemical properties, including molecular weight, lipophilicity, hydrogen bonding capacity, and solubility.
The possibility that a chemical compound possesses characteristics that make it an appropriate medication candidate is determined also by the drug likeness score (DLS). It is typically based on the compound's similarity to known drugs and their physicochemical properties. A high DLS indicates that a compound is more likely to have favorable pharmacokinetic and pharmacodynamic properties, and therefore more likely to be successful in clinical trials as a drug candidate.
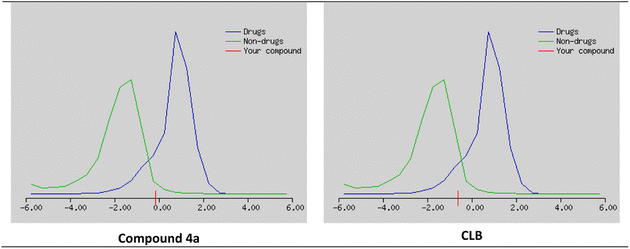
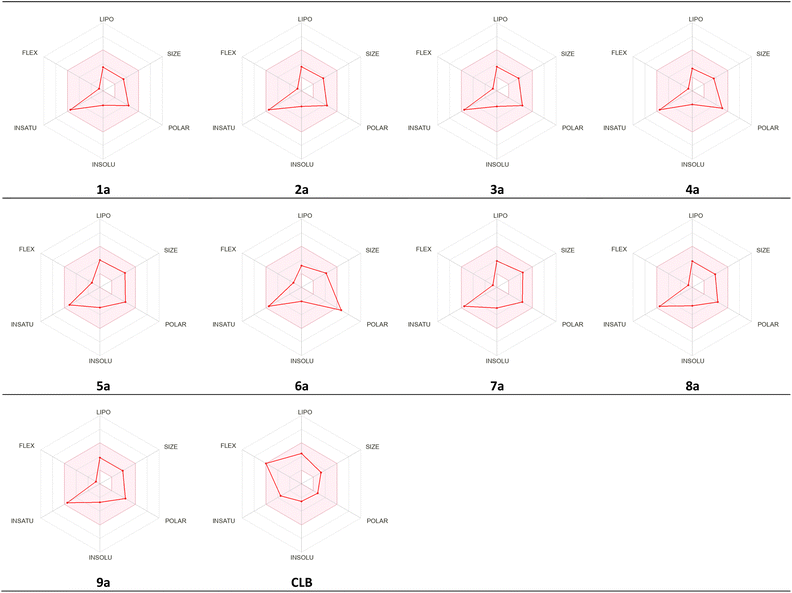
The studied compounds present a remarkable DLS in the range of [−0.78 to 0.07] (Table 5). It was observed that compound 4a, which demonstrated the highest stability in the active site of the Eg5 enzyme (docking score: −6.95) exhibited a good drug likeness score value (DLS: 0.07) and the compound 6a showed the best DLS score 0.07. The bioavailability radar enables a rapid evaluation of a compound's drug-likeness by considering six physicochemical attributes: lipophilicity, size, polarity, solubility, flexibility, and saturation. The radar plot of the molecule had to fall totally within a specific physicochemical range on each axis, which was represented by a pink area, in order to be deemed drug-like.
This pink area represents the optimal range for each properties (lipophilicity: XLogP3 between −0.7 and +5.0, size: MW between 150 and 500 g mol−1, polarity: TPSA between 20 and 130 Å2, solubility: Log![[thin space (1/6-em)]](https://www.rsc.org/images/entities/char_2009.gif) S) not higher than 6, saturation: fraction of carbons in the sp3 hybridization not less than 0.25, and flexibility: no more than 9 rotatable bonds (Fig. 16).
S) not higher than 6, saturation: fraction of carbons in the sp3 hybridization not less than 0.25, and flexibility: no more than 9 rotatable bonds (Fig. 16).
As shown in Fig. 17, all studied molecules presented physico-chemical profiles which make them suitable for oral administration except the derivative 6a not orally bioavailable; because it showed a higher polarity (TPSA 149.7).
Conclusions
In summary, a series of cyclosulfamide derivatives were evaluated for their antitumor activity against three human cell lines (PRI, K562, and JURKAT). The findings of the in vitro tests demonstrated that compound 5a displayed a significant inhibitory effect on the growth of these cancerous cell lines. The molecular docking study of the compounds in the active site of the Eg5 enzyme revealed high docking scores and good stability in the cavity for most of the compounds. These results suggest that the studied compounds could be potential candidates for inhibiting the Eg5 enzyme. Based on the positive results of the molecular docking study, we were motivated to confirm the predicted binding mode of compound 4a using MD simulation. The results of the MD simulation indicate that compound 4a maintained its binding site even after 100 ns, and the hydrogen bonds and hydrophobic interactions with the residues remained unchanged. DFT study enabled us to understand the electronic effects of the different substituted compounds. The MEP analysis allowed us to predict the most reactive sites for nucleophilic and electrophilic attacks. Furthermore, the analysis of the FMOs indicated that compound 5a had the highest energy gap, ΔEgap = 0.1926 eV, making it the most stable among all compounds studied. All compounds were also evaluated based on the Lipinski rule of five for their bioactivity, molecular descriptors, and drug likeness and all of them exhibited favorable oral bioavailability.Author contributions
Abdeslem Bouzina: responsible for the principal idea and the synthesis of compounds. Yousra Ouafa Bouone: DFT study. Omar Sekiou: follow the calculation of MD simulation. Mohamed Aissaoui and Rachida Mansouri: studies for the molecular docking. Tan-Sothea Ouk: carried out the in vitro study. Abdelhak Djemel: in silico pharmacokinetics analysis. Noureddine Aouf, Zihad Bouslama and Malika Ibrahim-Ouali: editing and performing the manuscript preparation.Conflicts of interest
There are no conflicts to declare.Acknowledgements
This work was supported financially by The General Directorate for Scientific Research and Technological Development (DG-RSDT), Algerian Ministry of Scientific Research, Applied Organic Chemistry Laboratory (FNR 2000).Notes and references
- J. Ferlay, M. Colombet, I. Soerjomataram, D. M. Parkin, M. Piñeros, A. Znaor and F. Bray, Int. J. Cancer, 2021, 149, 778 CrossRef CAS PubMed.
- D. S. Shewach and R. D. Kuchta, Chem. Rev., 2009, 9, 2859 CrossRef PubMed.
- K. Aizawa, C. Liu, S. Tang, S. Veeramachaneni, K. Q. Hu, D. E. Smith and X. D. Wang, Int. J. Cancer, 2016, 139, 1171 CrossRef CAS PubMed.
- V. T. DeVita Jr and E. Chu, Cancer Res., 2008, 68, 8643 CrossRef PubMed.
- L. Falzone, S. Salomone and M. Libra, Front. Pharmacol., 2018, 9, 1300 CrossRef CAS PubMed.
- R. A. Sikes, Br. J. Cancer, 2007, 97, 1713 CrossRef.
- M. T. Amjad, A. Chidharla and A. Kasi, Cancer Chemotherapy, 2023, PMID: 33232037, Bookshelf ID: NBK564367 Search PubMed.
- L. Ferhat, C. Cook, M. Chauviere, M. Harper, M. Kress, G. E. Lyons and P. W. Baas, J. Neurosci., 1998, 18, 7822 CrossRef CAS PubMed.
- (a) K. W. Wood and G. Bergnes, Annu. Rep. Med. Chem., 2004, 39, 173 CAS; (b) R. D. Vale, Cell, 2003, 112, 467 CrossRef CAS PubMed.
- V. Sarli and A. Giannis, ChemMedChem, 2006, 1, 293 CrossRef CAS PubMed.
- T. U. Mayer, T. M. Kapoor, S. J. Haggarty, R. W. King, S. L. Schreiber and T. J. Mitchison, Science, 1999, 286, 971 CrossRef CAS PubMed.
- M. Gartner, N. Sunder-Plassmann, J. Seiler, M. Utz, I. Vernos, T. Surrey and A. Giannis, Chembiochem, 2005, 6, 1173–1177 CrossRef CAS PubMed.
- L. Lad, L. Luo, J. D. Carson, K. W. Wood, J. J. Hartman, R. A. Copeland and R. Sakowicz, Biochem, 2008, 47, 3576 CrossRef CAS PubMed.
- R. Woessner, B. Tunquist, C. Lemieux, E. Chlipala, S. Jackinsky, W. Dewolf Jr, W. Voegtli, A. Cox, S. Rana, Pa. Lee and D. Walker, Anticancer Res., 2009, 29, 4373 CAS.
- S. S. Rosenfeld, J. Rich, M. Venere and Cleveland Clinic Foundation, Mitotic Kinesin Eg5 Inhibiting Anticancer Agents, US Pat., US14/678310, 2015 Search PubMed.
- (a) L. Terrab, C. J. Rosenker, L. Johnstone, L. K. Ngo, L. Zhang, N. F. Ware, B. Miller, A. Z. Topacio, S. Sannino, J. L. Brodsky and P. Wipf, ACS Med. Chem. Lett., 2020, 11, 984 CrossRef CAS PubMed; (b) T. Sparey, D. Beher, J. Best, M. Biba, J. L. Castro, E. Clarke, J. Hannam, T. Harrison, H. Lewis, A. Madin, M. Shearman, B. Sohal, N. Tsou, C. Welch and J. Wrigley, Bioorg. Med. Chem. Lett., 2005, 15, 4212 CrossRef CAS PubMed; (c) J. H. Lee, J. H. Bok, S. B. Park, H. S. Pagire, Y.-J. Na, E. Rim, W. H. Jung, J. S. Song, N. S. Kang, H. W. Seo, K.-Y. Jung, B. H. Lee, K. Y. Kim and J. H. Ahn, Bioorg. Med. Chem. Lett., 2020, 30, 126787 CrossRef CAS PubMed.
- (a) S. J. Kim, H. B. Park, J. S. Lee, N. H. Jo, K. H. Yoo, D. Baek, B. W. Kang, J. H. Cho and C. H. Oh, Eur. J. Med. Chem., 2007, 42, 1176 CrossRef CAS PubMed; (b) Z. Aouf, S. Bouacida, C. Benzaid, A. Amira, H. K'tir, M. Mathé-Allainmat, J. Lebreton and N. E. Aouf, ChemistrySelect, 2021, 6, 9722 CrossRef CAS; (c) C. Başkan, A. G. Ertürk, B. Aydın and B. Sırıken, Bioorg. Chem., 2022, 119, 105517 CrossRef PubMed.
- A. I. Esteban, O. Juanes, S. Conde, P. Goya, E. De Clercq and A. Martínez, Bioorg. Med. Chem., 1995, 3, 1527 CrossRef CAS PubMed.
- M. A. Ilies, C. T. Supuran and A. Scozzafava, Expert Opin. Ther. Pat., 2002, 12, 1181 CrossRef CAS.
- J. J. Jun, D. Duscharla, R. Ummanni, P. R. Hanson and S. V. Malhotra, ACS Med. Chem. Lett., 2021, 12, 202 CrossRef CAS PubMed.
- A. Martínez, A. Castro, C. Gil, M. Miralpeix, V. Segarra, T. Doménech, J. Beleta, J. M. Palacios, H. Ryder, X. Miró, C. Bonet, J. M. Casacuberta, F. Azorín, B. Piña and P. Puigdoménech, J. Med. Chem., 2000, 43, 683 CrossRef PubMed.
- (a) J. Hultén, N. M. Bonham, U. Nillroth, T. Hansson, G. Zuccarello, A. Bouzide, J. Åqvist, B. Classon, U. H. Danielson, A. Karlén, I. Kvarnström, B. Samuelsson and A. Hallberg, J. Med. Chem., 1997, 40, 885 CrossRef PubMed; (b) T. Sparey, D. Beher, J. Best, M. Biba, J. L. Castro, E. Clarke, J. Hannam, T. Harrison, H. Lewis, A. Madin, M. Shearman, B. Sohal, N. Tsou, C. Welch and J. Wrigley, Bioorg. Med. Chem. Lett., 2005, 15, 4212 CrossRef CAS PubMed.
- J. Y. Winum, A. Scozzafava, J. L. Montero and C. T. Supuran, Med. Res. Rev., 2006, 26, 767 CrossRef CAS PubMed.
- A. Bouzina, M. Berredjem, B. Belhani, S. Bouacida, C. Marminon, M. Le Borgne, Z. Bouaziz and M. Aissaoui, Res. Chem. Intermed., 2021, 47, 1359–1376 CrossRef CAS.
- (a) A. L. Niles, R. A. Moravec and T. L. Riss, Expert Opin. Drug Discovery, 2008, 3, 655 CrossRef CAS PubMed; (b) J. Hatok, E. Babusikova, T. Matakova, D. Mistuna, D. Dobrota and P. Racay, Clin. Exp. Med., 2009, 9, 1 CrossRef CAS PubMed.
- H. Y. Kaan, V. Ulaganathan, O. Rath, H. Prokopcová, D. Dallinger, C. O. Kappe and F. Kozielski, J. Med. Chem., 2010, 53, 5676 CrossRef CAS PubMed.
- Release S, 2 (2015) LigPrep, version 3.4, Schrödinger, LLC, New York, NY, 2015, p. 26400175 Search PubMed.
- R. A. Friesner, J. L. Banks, R. B. Murphy, T. A. Halgren, J. J. Klicic, D. T. Mainz, M. P. Repasky, E. H. Knoll, M. Shelley, J. K. Perry, D. E. Shaw, P. Francis and P. S. Shenkin, J. Med. Chem., 2004, 47, 1739 CrossRef CAS PubMed.
- R. A. Friesner, R. B. Murphy, M. P. Repasky, L. L. Frye, J. R. Greenwood, T. A. Halgren, P. C. Sanschagrin and D. T. Mainz, J. Med. Chem., 2006, 49, 6177 CrossRef CAS PubMed.
- E. F. Pettersen, T. D. Goddard, C. C. Huang, G. S. Couch, D. M. Greenblatt, E. C. Meng and T. E. Ferrin, J. Comput. Chem., 2004, 25, 1605 CrossRef CAS PubMed.
- Schrödinger, LLC, Schrödinger Release 2015-4: Desmond molecular dynamics system, Maestro-Desmond interoperability tools, DE Shaw Research, Schrödinger, New York, NY, 2015 Search PubMed.
- (a) A. D. Becke, J. Chem. Phys., 1993, 98, 5648 CrossRef CAS; (b) M. M. Francl, W. J. Pietro, W. J. Hehre, J. S. Binkley, M. S. Gordon, D. J. DeFrees and J. A. Pople, J. Chem. Phys., 1982, 77, 3654 CrossRef CAS.
- M. J. Frisch, Gaussian-09 Revision A.02, Gaussian Inc, Wallingford CT, 2009 Search PubMed.
- G. Zhang and C. B. Musgrave, J. Phys. Chem. A, 2007, 111, 1554 CrossRef CAS PubMed.
- C. A. Lipinski, F. Lombardo, B. W. Dominy and P. J. Feeney, Adv. Drug Delivery Rev., 2001, 46, 3 CrossRef CAS PubMed.
- (a) A. Daina, O. Michielin and V. Zoete, Sci. Rep., 2017, 7, 42717 CrossRef PubMed; (b) https://www.swissadme.ch/.
- https://www.molsoft.com/.
- A. Jordan, J. A. Hadfield, N. J. Lawrence and A. T. McGown, Med. Res. Rev., 1998, 18, 259–296 CrossRef CAS PubMed.
- C. M. Sun, L. G. Lin, H. J. Yu, C. Y. Cheng, Y. C. Tsai, C. W. Chu, Y. H. Din, Y. P. Chau and M. J. Don, Bioorg. Med. Chem. Lett., 2007, 17, 1078 CrossRef CAS PubMed.
- (a) C. T. Supuran, A. Casini and A. Scozzafava, Med. Res. Rev., 2003, 23, 535 CrossRef CAS PubMed; (b) A. Casini, A. Scozzafava, A. Mastrolorenzo and C. T. Supuran, Curr. Cancer Drug Targets, 2002, 2, 55 CrossRef CAS PubMed.
- B. I. Huwaimel, M. Bhakta, C. A. Kulkarni, A. S. Milliken, F. Wang, A. Peng, P. S. Brookes and P. C. Trippier, ChemMedChem, 2021, 16, 1143 CrossRef CAS PubMed.
- L. Tolosa, M. T. Donato and M. J. Gómez-Lechón, Methods Mol. Biol., 2015, 1250, 333 CrossRef CAS PubMed.
- A. Blangy, H. A. Lane, P. d'Hérin, M. Harper, M. Kress and E. A. Nigg, Cell, 1995, 83, 1159 CrossRef CAS PubMed.
- (a) G. A. Patani and E. J. LaVoie, Chem. Rev., 1996, 96, 3147 CrossRef CAS PubMed; (b) H. Kagechika, E. Kawachi, Y. Hashimoto and K. Shudo, Chem. Pharm. Bull., 1986, 34, 2275 CrossRef CAS PubMed.
- (a) M. L. Vazquez, M. L. Bryant, M. Clare, G. A. DeCrescenzo, E. L. Doherty, J. N. Freskos, D. P. Getman, K. A. Houseman, J. A. Julien, G. P. Kocan, R. A. Mueller, H. S. Shieh, W. C. Stallings, R. A. Stegman and J. J. Talley, J. Med. Chem., 1995, 38, 581 CrossRef CAS PubMed; (b) D. A. Adsmond and D. J. Grant, J. Pharm. Sci., 2001, 90, 2058 CrossRef CAS PubMed.
- R. V. Krems, Phys. Chem. Chem. Phys., 2019, 21, 13392 RSC.
- H. Alonso, A. A. Bliznyuk and J. E. Gready, Med. Res. Rev., 2006, 26, 531 CrossRef CAS PubMed.
- L. R. Lima, R. S. Bastos, E. F. B. Ferreira, R. P. Leão, P. H. F. Araújo, S. S. d. R. Pita, H. F. De Freitas, J. M. Espejo-Román, E. L. V. S. Dos Santos, R. d. S. Ramos, W. J. C. Macêdo and C. B. R. Santos, Int. J. Mol. Sci., 2022, 23, 9927 CrossRef CAS PubMed.
- A. Kuzmanic and B. Zagrovic, Biophys. J., 2010, 98, 861 CrossRef CAS PubMed.
- (a) D. Young, Computational chemistry: a practical guide for applying techniques to real world problems, John Wiley & Sons, 2004 Search PubMed; (b) J. I. Choe and B. Kim, Bull. Korean Chem. Soc., 2000, 21, 419 CAS; (c) H. Ode, M. Nakashima, S. Kitamura, W. Sugiura and H. Sato, Front. Microbiol., 2012, 3, 258 CAS; (d) G. R. Bowman, J. Comput. Chem., 2016, 37, 558 CrossRef CAS PubMed; (e) R. C. Silva, H. F. Freitas, J. M. Campos, N. M. Kimani, C. H. T. P. Silva, R. S. Borges, S. S. R. Pita and C. B. R. Santos, Int. J. Mol. Sci., 2021, 22, 11739 CrossRef CAS PubMed.
- M. J. Yunta, American Journal of Modeling and Optimization, 2017, 5, 24 CrossRef.
Footnote |
| † Electronic supplementary information (ESI) available. See DOI: https://doi.org/10.1039/d3ra02904b |
| This journal is © The Royal Society of Chemistry 2023 |


