Does it mix? Insights and attempts to predict the formability of single phase mixed A-cation lead iodide perovskites†
Fernando Brondani
Minussi
 *a,
Rogério Marcos
da Silva
Jr.
 b and
Eudes Borges
Araújo
 a
a
aDepartment of Physics and Chemistry, São Paulo State University, 15385-000 Ilha Solteira, São Paulo, Brazil. E-mail: f.minussi@unesp.br
bDepartment of Electrical Engineering, São Paulo State University, 15385-000 Ilha Solteira, São Paulo, Brazil
First published on 31st August 2023
Abstract
Current literature lacks simple ways to predict whether a given halide perovskite solid solution forms a single-phase system. Examining existing data suggests that single-phase A-site solid solutions are preferably formed when substituent cations are larger and have more N–H bonds than the host cation.
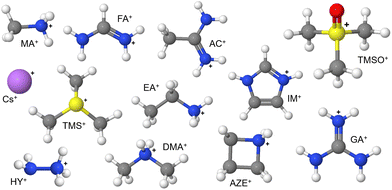
One of the reasons behind the plethora of different applications of halide perovskites (HPs) is the fascinating vastness of compositions and structures for these compositions.1–10 It derives from choosing appropriate constituents at A, B and X sites of the typical perovskite ABX3 composition, which permits extensive customization of the properties of the perovskite materials. In choosing suitable constituents, including solid solutions, a common goal has been the development of A-site substituted compositions that form three-dimensional perovskites.11,12 A wide range of A-site cations have been used to form A-site solid solutions, some of which are shown in Fig. 1.
 | ||
| Fig. 1 Possible A-site cations used in the formulation of halide perovskites. Complete information of these cations are given in ESI Note 1.† White, grey, blue, pink, red and yellow spheres represent hydrogen, carbon, nitrogen, cesium, oxygen and sulphur atoms, respectively. | ||
Solid solutions can generally be formed when one or more host ions are substituted by other ions, occupying the host site and keeping a homogeneous phase rather than forming a new compound. Initial structural predictions in halide perovskites can be made based on the well-known Goldschmidt tolerance factor, given by t = (rA + rX)/√2(rB + rX), where rA, rB and rX are the ionic radii of the cations at the A, B, and X sites, respectively.13–15 Three-dimensional perovskites are expected for 0.8 < t < 1.0, and the degree of tilt of the BX6 octahedra will be lower the larger the value of t, such that a cubic perovskite is formed for t = 1. Although of great appeal for its simplicity, predictions based on the Goldschmidt tolerance factor are often accurate to about 50% or less for halide perovskites.16 This low predictive capacity, combined with the growing need to use fewer inputs and time in a random synthesis of new materials, motivated the development of other methodologies with better accuracy.16,17 Among other factors, including different physical and chemical descriptors instead of solely the radii of cations and anions in a given composition resulted in better capabilities for predicting perovskite formation. The tolerance factor proposed by Bartel16τ = rX/rB − NA[NA − (rA/rB)/ln(rA/rB)] is one of these, where NA is the oxidation number of the A-site cation. In this case, the formation of three-dimensional perovskites is expected when τ < 4.18, and its use proves to be much more accurate in predicting compositions with halides of 90% or more.
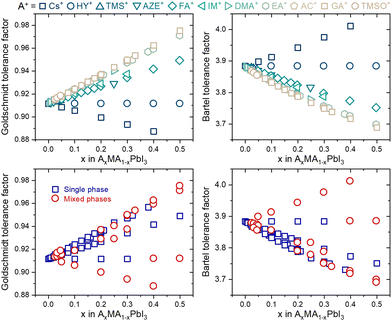
Despite this enormous gain, one fact draws attention: none of the tolerance factors can predict whether a three-dimensional perovskite solid solution will be single-phase. Even though several segregated phases can be formed in HPs, we focus solely on possible A-site-related compounds. As shown in Fig. 2, there is no numerical value or tendency capable of predicting whether monophasic solid solutions can be experimentally formed, for example, in compositions of the type AxMA1−xPbI3, in which MA+ represents the methylammonium cation and A+ represents a substituent monovalent cation. In fact, there is no simple expression in the literature or even a proposal of which specific physical and chemical factors control the solubility limit in a given system of compositions, from which secondary A-site cation-related phases will be segregated. These secondary phases have major, often detrimental, effects on the properties and performance of devices manufactured with HPs.18 One predictive approach was based on considerations that cations are spherical and that changes in unit cell volume are directly proportional to the number of substituents and estimated solubility limit of 22% of azetidinium (AZ+) cations in the MAPbI3 matrix.19 However, it is verified experimentally that with about 5% of substitution, a non-perovskite phase of AZPbI3 starts to be segregated.20 It is an example that factors other than cation sizes must be taken into account to predict solubility limits.
 | ||
| Fig. 2 Tolerance factors of AxMA1−xPbI3 compositions distinguished by their A-site substituent (top) and phase purity (bottom). Complete data used to construct the graphs are given in ESI Note 2.† | ||
A possible reason for the difficulty in generalizing the relationships between composition and solubility limit consists of the fact that thermodynamic aspects of mixtures must be taken into account when dealing with single-phase solid solutions and their relative stabilities when compared to equimolar analogs containing secondary phases. In experimental and theoretical approaches, accessing this information and all the factors that control it is quite complex, if not impossible. Although the increase in configurational entropy is always favorable for solid solution formation, rotational and vibrational entropy effects are challenging to account for. In turn, the enthalpy term must have contributions associated with differences in size (strain/stress enthalpy, possibly endothermic) and changes in the intensity of the interactions due, for example, to different dipole moments and the capability of forming hydrogen bonds of A-site cations (either endo or exothermic). These enthalpy contributions are mutually dependent and can also be affected by the possible existence of composition-dependent tetragonal-to-cubic phase transitions.
Despite such an intricate scenario, we hypothesized that it might be possible to describe lead halide perovskites based on some physical descriptors and predict if a given HP composition would form a single-phase system. To test this hypothesis, we here used compositions of the type AxMA1−xPbI3 because they are the ones for which more experimental data are available. Other than that, these compositions can be differentiated only based on physical and chemical descriptors related to the A-site cations. This simplifies the approach and makes it sufficiently diverse for a first analysis without additional complications arising in systems of mixed B-site cations (mixed Pb/Sn, for example) and X-site halide anions. Among the several of these descriptors that can be associated with the A-site cations, we use here only three of the simplest ones that have already been mentioned earlier, namely, the radius, dipole moment, and ability to form hydrogen bonds. In the latter's case, the descriptor used was the number of N–H bonds contained in the cation. It is evident that not all hydrogen bonds to be formed between the A-site cation and the iodide in the PbI6 octahedra are the same; rather, the degree of interaction, i.e., the energy of these bonds, will depend on other factors of the cation itself and its arrangement within the perovskite cell. For simplicity, none of these factors are considered here.
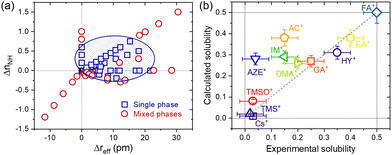
To convert the compositions into their descriptors, we start with weighted averages by mole fractions (x), aka the Vegard's law, of each cation characteristic of the A-site, such that reff = xrA + (1 − x)rMA, μ = xμA + (1 − x)μMA and nNH = xnA + (1 − x)nMA, where reff, μ and nNH are the average values for the effective ionic radius, dipole moment and number of N–H bonds, respectively. Evidently, rA, μA and nA, as well rMA, μMA and nMA, these are the same characteristics for the substituent A+ and MA+ cations. That done, the descriptors effectively used in the analysis were the differences between the average values and the MA+ cation values of the matrix (pure composition, x = 0), such that Δreff = reff − rMA, Δμ = μ − μMA and ΔnNH = nNH − nMA. The data were dispersed on Cartesian axes (Δreff, Δμ), (ΔnNH, Δμ) and (Δreff, ΔnNH), to facilitate visual inspection, as shown in ESI Note 3.† An interesting aspect observed is that the descriptor Δμ seems to exert little or no differentiation between the compositions that lead to single or mixed-phase systems. On the other hand, descriptors Δreff and ΔnNH have a marked influence on this differentiation. As shown in Fig. 3a, it is evident that single-phase systems tend to be formed when both descriptors are positive and close to the origin. One interpretation of this would be that, in terms of ΔnNH, the reduction in the number of N–H bonds is reflected in fewer hydrogen bonds and a consequent increase (less negative value) in the total interaction energy. In theory, this must be associated with an endothermic process, which makes solubilization less favorable. Analogously, the substitution in ΔnNH would be exothermic and would favor the formation of a solid solution. In terms of Δreff, any substitution in which the effective radius difference is non-zero must result in an endothermic process by increasing the elastic energy of deformation of the crystals. However, according to estimates made via machine learning methods,21 the enthalpy of mixing when the A+ cation solutes are smaller than the MA+ of the MAPbI3 matrix tends to be more positive than when these substituent cations are greater than the MA+. It agrees with the general trend of larger ions occupying smaller sites in host structures, in contrast to smaller ions not being able to occupy sites exceeding their radius in ionic compounds.22 According to this reasoning, substituents smaller than MA+ are more unfavorable to forming a solid solution than substituents larger than MA+. It should also be noted that solutes greater than MA+ increase the tolerance factor and reduce the distortion caused by the tilting of the PbI6 octahedra, which may be an additional factor favoring the formation of solid solutions.
An interesting aspect of how the data corresponding to the single-phase compositions were distributed in this plot of ΔnNHvs. Δreff follows from the fact that they can be relatively well grouped in an ellipse that separates them from the data of mixed-phase compositions. Unfortunately, the statistically calculated confidence ellipses have not yielded good results (see ESI Note 4†). However, it was possible to visually establish an ellipse to make this grouping of the equation given by 0.0063(x − 10.5)2 + 2.9(y − 0.30)2 = 1, as also shown in Fig. 3a. From this equation, we propose a parameter δ = 0.0063(Δreff − 10.5)2 + 2.9(ΔnNH − 0.30)2 to be used as an empirical criterion to predict the formability of single-phase AxMA1−xPbI3 compositions. For compositions where δ < 1, a single phase system should be observed, whereas for compositions where δ > 1, a mixed phase system would be expected. A composition for which δ = 1 would be at the solubility limit. To first test this approach, we tried to recover the experimental solubility limits of studied compositions available in the literature. The results are given in Fig. 3b, from which we observed a good correspondence between empirically estimated (calculated) solubility limits using the δ parameter and experimental values for most compositions. Notably, the approach fails heavily for the substitution of MA+ by acetamidinium (AC+), azetidinium (AZE+), and imidazolium (IM+). The reasons for such are not quite clear yet, but for AZE+ and IM+, there might be a relation with the fact that both cations are cyclic and, consequently, more rigid. In this case, the spatial restrictions to form several directional hydrogen bonds cannot be fulfilled, thus possibly leading to an anomalous enthalpy of mixing compared to non-cyclic cations. The ionic radii inaccuracies, where their true size might spam over quite a large range,23 the actual compositions differing from nominal ones, method of synthesis, architecture/morphology of the materials under study, and method of determining the solubility limit (most experimental results are based on X-ray diffraction measurements, which is not the most sensible for such) are other potential sources of errors. Note also that the segregation of secondary phases of A-site cations can be time-dependent and occur even below the solubility limit.24 It is also important to notice that some A+ cations can be located at grain boundaries and interfaces instead of occupying the regular position inside the perovskite lattice. Lastly, there is still very little data for a solubility limit for some of the substituent cations, which increases any inaccuracy related to the above reasons. Having that in mind, predicted solubility limits for two not yet synthesized solid solutions with methylhydrazinium (rA = 264 pm,25nA = 4) and iso-propylammonium (rA = 317 pm,26nA = 3) in AxMA1−xPbI3 are of x = 0.38 and x = 0.21 respectively.
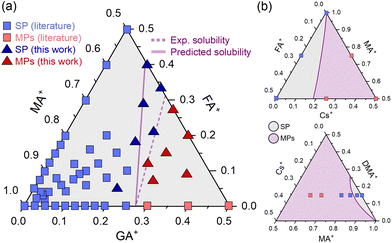
To continue testing the approach, we estimated a solubility limit for GAxFAyMA1−x−yPbI3 compositions, where GA+ and FA+ are guanidinium and formamidinium, respectively. The result is shown in Fig. 4a. There is a good amount of experimental data available in the literature, which allowed us to compare our δ-based estimations to an approximate experimental solubility limit. We used existing literature data and additional experimental XRD results (ESI Note 5†) to construct a solubility diagram. The results are also given in Fig. 4a.
 | ||
| Fig. 4 (a) Predicted and experimental solubility limits for compositions of the type GAxFAyMA1−x−yPbI3. Dots are of SP: single phase and MPs: mixed phases. Data of double cation compositions are the same given in ESI Note 1.† Data of triple cation compositions from ref. 27–29. (b) Predicted solubility diagrams for CsxFAyMA1−x−yPbI3 (top) and CsxDMAyMA1−x−yPbI3 (bottom) compositions. Dots are literature data from ref. 30 and 31 respectively. | ||
As can be seen, there is a fairly reasonable agreement between the predictions and experimental results. The deviations between predicted and experimental solubilities increase as one moves from a GAxMA1−xPbI3 double-cation composition to a triple-cation system with FA+ substitution. A likely reason for this is that triple-cation compositions have a higher (configurational) entropy of mixing than double-cation systems containing the same degree of substitution (see ESI Note 6†). This entropic term favors the formation of the monophasic solid solution and should cause an additional increase in the solubility of the substituents beyond the expected. Note that the parameter δ used in our estimates was determined using solid solutions of two cations from the A site, for which the configurational entropies of mixtures are lower than in the three-cation analogs. Future developments should consider an explicit entropy term to account for these differences. Despite these limitations and considering the approach's simplicity, the results are quite close. Other two ternary diagrams with some experimental data are of the compositions CsxFAyMA1−x−yPbI3 and CsxDMAyMA1−x−yPbI3 (DMA+ is the dimethylammonium cation). Following the same procedure, we estimated the solubility lines (Fig. 4b), which are in reasonable agreement with experimental observations. More data should be obtained to determine the solubility limits and allow a better comparison.
To finish, we want to emphasize that the obtained δ empirical parameter is not to be used as a general tool to determine solubility limits in halide perovskite compositions. Instead, we only wanted to start the discussion regarding if the prediction of solubility limits is feasible or not. Our approach might serve as a good starting point, and the obtained results suggest that solubility limits can be roughly estimated using δ in mixed cation MAPbI3-based materials. However, this parameter cannot be used to estimate solubility limits in other HPs, including the common FAPbI3-based systems. Having all that said, we foresee that the used approach can be refined and expanded soon to include FA-based lead iodide compositions. Also, considering, for example, that DMA+ and GA+ can be used as substituents in Cs-based lead iodide materials,32 we expect that a generalization to any mixed A-site combination can be achieved while more data is obtained. In addition, HP compositions with mixed B- and X-site ions can also be included using diverse structural descriptors, potentially leading to accurate predictions of phase-pure halide perovskites of any composition, which might be achieved by using machine learning approaches.
Conclusions
In summary, using a simple approach based only on the sizes and number of N–H bonds of A-site cations, it was possible to estimate and predict the solubility limits in compositions based on methylammonium lead iodide. The results suggest a rule of thumb that single-phase solid solutions can be formed at a higher extent when the substituent cations are larger and have more N–H bonds than the host methylammonium cations. Naturally, the desired HP solid solution compositions should be inside the restrictions imposed by the common tolerance factors.Author contributions
F. B. Minussi: conceptualization, methodology, investigation, writing – original draft, writing – review, and editing. R. M. Silva Jr.: investigation, writing – review, and editing. E. B. Araújo: conceptualization, methodology, investigation, writing – review, editing, and project administration.Conflicts of interest
There are no conflicts to declare.Acknowledgements
This research was supported by the Fundação de Amparo à Pesquisa do Estado de São Paulo (FAPESP Project: 2017/13769-1), the Coordenação de Aperfeiçoamento de Pessoal de Nível Superior (CAPES-PRINT Project: 88881.310513/2018-01) and the Conselho Nacional de Desenvolvimento Científico e Tecnológico (151319/2023-5).Notes and references
- M. M. Byranvand, C. Otero-Martínez and J. Ye, et al. , Adv. Opt. Mater., 2022, 10, 2200423 CrossRef CAS.
- W. Gao, C. Chen and C. Ran, et al. , Adv. Funct. Mater., 2020, 30, 2000794 CrossRef CAS.
- S. Wang, A. Wang and F. Hao, iScience, 2022, 25, 103599 CrossRef CAS PubMed.
- S. J. Adjogri and E. L. Meyer, Molecules, 2020, 25, 5039 CrossRef CAS PubMed.
- D. Saikia, A. Betal and J. Bera, et al. , Mater. Sci. Semicond. Process., 2022, 150, 106953 CrossRef CAS.
- M. D. Smith, E. J. Crace and A. Jaffe, et al. , Annu. Rev. Mater. Res., 2018, 48, 111 CrossRef CAS.
- H. F. Zarick, N. Soetan and W. R. Erwin, et al. , J. Mater. Chem. A, 2018, 6, 5507 RSC.
- H. Choe, D. Jeon and S. J. Lee, et al. , ACS Omega, 2021, 6, 24304 CrossRef CAS PubMed.
- L. Mao, C. C. Stoumpos and M. G. Kanatzidis, J. Am. Chem. Soc., 2019, 141, 1171 CrossRef CAS PubMed.
- B. Ehrler and E. M. Hutter, Matter, 2020, 2, 800 CrossRef.
- S. Jin, ACS Energy Lett., 2021, 6, 3386 CrossRef CAS.
- J.-W. Lee, S. Tan and S. I. Seok, et al. , Science, 2022, 375, eabj1186 CrossRef CAS PubMed.
- G. Kieslich, S. Sun and A. K. Cheetham, Chem. Sci., 2014, 5, 4712 RSC.
- G. Kieslich, S. Sun and A. K. Cheetham, Chem. Sci., 2015, 6, 3430 RSC.
- W. Travis, E. N. K. Glover and H. Bronstein, et al. , Chem. Sci., 2016, 7, 4548 RSC.
- C. J. Bartel, C. Sutton and B. R. Goldsmith, et al. , Sci. Adv., 2019, 5, eaav069 Search PubMed.
- S. Gholipour, A. M. Ali and J.-P. Correa-Baena, et al. , Adv. Mater., 2017, 29, 1702005 CrossRef PubMed.
- L. Liu, J. Lu and H. Wang, et al. , Mater. Rep.: Energy, 2021, 1, 100064 CAS.
- R. Panetta, G. Righini and M. Colapietro, et al. , J. Mater. Chem. A, 2018, 6, 10135 RSC.
- S. R. Pering, W. Deng and J. R. Troughton, et al. , J. Mater. Chem. A, 2017, 5, 20658 RSC.
- H. Park, A. Ali and R. Mall, et al. , Mach. Learn.: Sci. Technol., 2021, 2, 025030 Search PubMed.
- A. R. West, Solid State Chemistry and its Applications, John Wiley & Sons, 2nd edn, 2014 Search PubMed.
- J. Gebhardt and A. M. Rappe, Adv. Mater., 2019, 31, 1802697 CrossRef CAS PubMed.
- F. B. Minussi, E. M. Bertoletti and J. A. Eiras, et al. , Sustainable Energy Fuels, 2022, 6, 4925 RSC.
- M. Mączka, M. Ptak and A. Gągor, et al. , Chem. Mater., 2020, 32, 1667 CrossRef.
- N. T. P. Hartono, Interplay of Optoelectronic Properties and Solar Cell Performance in Multidimensional Perovskites, Master of Science, Massachusetts Institute of Technology, 2018 Search PubMed.
- F. B. Minussi, R. M. da Silva Jr. and E. B. Araújo, J. Phys. Chem. C, 2023, 127, 8814 CrossRef CAS.
- F. B. Minussi, R. M. da Silva Jr. and E. B. Araújo, Composition-property relations for GAxFAyMA1−x−yPbI3 perovskites, Small, 2023 Search PubMed , manuscript under review.
- F. B. Minussi, L. A. Silva and E. B. Araújo, Phys. Chem. Chem. Phys., 2022, 24, 4715 RSC.
- S. Sun, A. Tiihonen and F. Oviedo, et al. , Matter, 2021, 4, 1305 CrossRef CAS.
- A. Ali, H. Park and R. Mall, et al. , Chem. Mater., 2020, 32, 2998 CrossRef CAS.
- W. Ke, I. Spanopoulos and C. C. Stoumpos, et al. , Nat. Commun., 2018, 9, 4785 CrossRef PubMed.
Footnote |
| † Electronic supplementary information (ESI) available. See DOI: https://doi.org/10.1039/d3qi01615c |
| This journal is © the Partner Organisations 2023 |

