DOI:
10.1039/D3NJ00665D
(Paper)
New J. Chem., 2023,
47, 8200-8213
Optimization of phosphorus-loaded Ni–ZnO crosslinked carboxy methyl cellulose-based biodegradable nanocomposite hydrogel beads for the slow release of P, Ni and Zn: a kinetic approach†
Received
11th February 2023
, Accepted 27th March 2023
First published on 27th March 2023
Abstract
Nutrient (macro and micro) deficiency retards and restricts plant growth whereas over use of certain fertilizers is not only detrimental to growing plants but also to the environment. To address the two associated problems, the present study decerns a novel synthetic protocol for the preparation of nickel–zinc oxide (plant micronutrients) crosslinked carboxy methyl cellulose (CMC) nanocomposite hydrogel beads loaded with phosphorus (P) as a slow release phosphatic fertilizer. A 1![[thin space (1/6-em)]](https://www.rsc.org/images/entities/char_2009.gif) :0.15 ratio of 4% CMC solution and zinc chloride (ZnCl2) was found to be optimum for the formation of stable spherical hydrogel beads when added dropwise in nickel chloride (NiCl2) solution (3 g in 10 mL). For the phosphate loading and release study, CMC (2 g) was introduced into disodium hydrogen phosphate solution (4%) during the synthesis process keeping the rest of the procedure the same. The prepared composite beads having P, Ni and Zn were characterized using Fourier-transform infrared spectroscopy (FTIR), thermogravimetric analysis (TGA), scanning electron microscopy (SEM), and SEM-energy dispersive X-Ray (SEM-EDX) mapping analysis. Rheological parameters such as the storage modulus (G′) and loss modulus (G′′) value indicate that the visco-elastic properties of the hydrogel were closely associated with the CMC concentration. The swelling kinetics of the hydrogels followed Schotts’ second order kinetic model with a high connection co-efficient (R2 = 0.99). Under the optimized conditions, the hydrogel beads showed the maximum swelling ratio of 185%, 3770% and 5552% in distilled water, pH 7 buffer and pH 9.2 buffer, respectively. The prepared composite beads were found to be a potential slow-release phosphatic fertilizer for agricultural delivery within a time span of 21 days. The degradability of the composite hydrogel beads at low indicative soil pH of 4.5 was also evaluated. After degradation, the hydrogel beads potentially release the cross-linker Zn and Ni in the form of plant available micronutrients. The findings coincide with other slow-release studies for sustainable nutrient release for agricultural applications.
:0.15 ratio of 4% CMC solution and zinc chloride (ZnCl2) was found to be optimum for the formation of stable spherical hydrogel beads when added dropwise in nickel chloride (NiCl2) solution (3 g in 10 mL). For the phosphate loading and release study, CMC (2 g) was introduced into disodium hydrogen phosphate solution (4%) during the synthesis process keeping the rest of the procedure the same. The prepared composite beads having P, Ni and Zn were characterized using Fourier-transform infrared spectroscopy (FTIR), thermogravimetric analysis (TGA), scanning electron microscopy (SEM), and SEM-energy dispersive X-Ray (SEM-EDX) mapping analysis. Rheological parameters such as the storage modulus (G′) and loss modulus (G′′) value indicate that the visco-elastic properties of the hydrogel were closely associated with the CMC concentration. The swelling kinetics of the hydrogels followed Schotts’ second order kinetic model with a high connection co-efficient (R2 = 0.99). Under the optimized conditions, the hydrogel beads showed the maximum swelling ratio of 185%, 3770% and 5552% in distilled water, pH 7 buffer and pH 9.2 buffer, respectively. The prepared composite beads were found to be a potential slow-release phosphatic fertilizer for agricultural delivery within a time span of 21 days. The degradability of the composite hydrogel beads at low indicative soil pH of 4.5 was also evaluated. After degradation, the hydrogel beads potentially release the cross-linker Zn and Ni in the form of plant available micronutrients. The findings coincide with other slow-release studies for sustainable nutrient release for agricultural applications.
1. Introduction
Plant development, growth, and production are directly related to nutrient availability and water retention properties of the soil.1 The deficiency of plant macro and micronutrients might lead to retardation in growth and lower production. Macronutrients such as phosphorous (P) are primarily responsible for converting solar energy into food packages in the form of ATP, which plays a prominent role in cell division, photosynthesis, and reproduction in plants. Therefore, it's deficiency critically deters crop yield and creates a global food security threat.2 To meet this ever-growing demand for nutrients, fertilizers are extensively applied to the soil. Disodium hydrogen phosphate is the major fertilizer commonly used to supply P to crops.3,4 A major portion of applied P fertilizer in soil is lost to the environment leading to eutrophication and environmental pollution. P leaching depends on the type of soil and environment. In clayey soils, leaching is lower and the losses by runoff are higher. In sandy soils, the losses by leaching are more extensive. Slow-release fertilizers (SRFs) could be a sustainable solution to prevent the leaching of nutrients into the environment and there has been an attempt in research to develop slow nutrient delivery technology in modern agriculture in recent decades.5–9
On the other hand, micronutrients such as zinc (Zn) and nickel (Ni) are also essential for proper plant physiological functioning.10 Zinc is present in the active center of more than 200 enzymes including lyases, carbonic anhydrases, ligases, dehydrogenases, and isomerases.11 Many Zn-containing metalloenzymes are required for the regulation of gene expression as it take part in the synthesis of DNA, RNA, and protein. Furthermore, Zn maintains the plant adaptability to cope with environmental stress through its active participation in plant defensive mechanisms as reported by Page et al.12 and Coleman et al.13 Unlike Zn, Ni is also known as an important micronutrient involved in biological nitrogen fixation as well as plant metabolism. Nickel is present as a cofactor in the plant urease enzyme, which catalyzes the hydrolytic cleavage of urea into the plant available form of nitrogen.14 Zinc deficiency in plants hampers the developmental cascades causing a substantial reduction in crop yield.15 The deficiency of Ni in plants can disrupt the organic and amino acid metabolisms resulting in marginal chlorosis of leaves, premature senescence, and decreased seed germination rate.14,16,17 Besides micronutrient deficiency in soil, lower moisture content in soil is also detrimental towards soil health leading to a decrease in crop production. To solve the problem of water scarcity in soil, the application of hydrogels is getting top priority in the scientific frontiers.18–20 The inherent flexibility, biodegradability, biocompatibility, and permeability of hydrogels certainly offer an excellent opportunity for their application in the agricultural field to solve the water crisis.21–27 The water retention capacity in the hydrogel network could be due to the presence of several hydrophilic groups such as carboxylic, amino, sulphonic, and hydroxylic in its structure.28 Cross-linkers in the hydrogel matrix act as a bridge to link between polymer chains within the three-dimensional network polymers, improving the thermal and mechanical stability.29 Based on preparation techniques, hydrogel could be made as a thin film or bead.30 Many natural bio-polymers have been used for the synthesis of hydrogels, mainly cellulose-based materials due to their unique biocompatibility, renewability, and biodegradable properties.18,31 Among natural bio-polymers, carboxymethyl cellulose (CMC) is a well known biodegradable polymer extracted from different unutilized agricultural wastes, viz. barley straw, ears of corn, flax fibers, rice hull, sago waste, sugar cane bagasse, wheat straw, etc.32 For several decades, CMC has been used in ceramic foam, drilling fluid, film-former, food, paper, pharmaceutics, suspension aids, textiles, thickeners, water binders, etc.32,33 The hydrogel matrix of CMC with nanocellulose and montmorillonite via cross-linking with 3% citric acid shows effective loading and controlled release of NPK fertilizer.34 Polyurethane-modified CMC-based hydrogel cross-linking with 4,4′-diphenylmethane diisocyanate has been recently documented by Wang et al. for its sustainable use as a slow release nitrogen amendment in agriculture production.35
The properties of hydrogels can be modulated by selecting different cross linkers as sources of micronutrients like Ni and Zn.36–38 Interaction of anionic carboxylic groups of CMC coupled with positively charged Zn2+ and/or Ni2+ creates ionomer-like structures of hydrogel having hydrophilic macro molecular networks increasing its affinity towards water molecules.39,40 Zn2+ also acts as a solubilizer via the breaking of intramolecular hydrogen bonding among the cellulose networks through electrostatic interaction that are responsible for strong bonding structure.41 Many methods have also been developed for the preparation of CMC/ZnO nanocomposite hydrogels. Gholamali et al.42 prepared nanocomposite hydrogel beads by combining CMC and starch with ZnO nanoparticle (NP)s and physically cross-linked them with ferric chloride. CMC/ZnO nanocomposites by cross-linking with malic, succinic, or citric acid were also reported by Hashem et al.43 Yadollahi et al. synthesized CMC/ZnO nanocomposites by in situ oxidation of Zn2+ ions by using 3% w/v sodium hydroxide.44
Even though there is a bundle of literature available in connection with slow-release N and K nanocomposite fertilizers, the availability of research data for phosphorus (P) coupled with micronutrients is very much limited even in dearth. In continuation of our previous work related to slow-release fertilizers,45 herein a kind of Ni–ZnO cross-linked CMC based hydrogel bead was fabricated, characterized, and then used as a delivery material for the slow release of P. Notably, the prepared hydrogel beads exhibited excellent water retention capacity. The swelling kinetics were studied and fitted with different models. The P loaded carrier composite was used as a sustainable slow-release P fertilizer. The degradability of the composite hydrogel beads was evaluated and a potential release of plant available Zn and Ni micronutrients was considered to occur upon degradation of the polymer composite.
2. Experimental
2.1 Materials
Sodium carboxymethyl cellulose (CMC) was purchased from TCI (TCI Chemicals India Pvt. Ltd, Mumbai, India). Zinc chloride hexahydrate (ZnCl2·6H2O) was obtained from Finar, (Ahmedabad, Gujrat, India). Reagent grade disodium hydrogen phosphate (Na2HPO4), ammonium molybdate tetrahydrate, sodium hydroxide and nickel chloride hexahydrate (NiCl2·6H2O) were procured from Merck KGaA, Darmstadt, Germany. Sodium sulfide was obtained from Loba Chemie Pvt. Ltd (Mumbai, India). Milli-Q water (18.2 MΩ cm resistivity at 25 °C) was used as a solvent for fabricating the hydrogels.
2.2 Preparation of hydrogel beads
Carboxymethyl cellulose-based hydrogel beads were prepared by the ionic cross-linking method using ZnCl2·6H2O as a cross-linker. A series of different types of hydrogels were prepared, as shown in Table 1. For the preparation of hydrogel beads, 1%, 2.5%, and 4% CMC were prepared in Milli-Q water. Cross-linking was performed by mixing 10 mL ZnCl2 solution in various concentrations tabulated in Table 1 with CMC (40 mL) solution to achieve homogeneity. In each of the CMC/ZnCl2 blend solutions of 50 mL, 0.679 g NaOH was added to oxidize the Zn2+ ions. The above CMC/ZnCl2/NaOH blend (of 50 mL) homogeneous solution was added dropwise in nickel chloride solution (3 g in 10 mL) with a pipette while being stirred at 500 rpm for 2 hours giving green colored beads. The resulting solution was filtered to obtain the beads, which were then washed several times with Milli-Q water to remove the unbound Ni2+ ions. The biopolymer beads were dried for 10 h in a vacuum desiccator and finally oven dried at 30 °C to constant weight, then removed and kept for use in subsequent experiments.
Table 1 Crosslinking of varied concentrations of ZnCl2 solution with 4% CMC at different ratios
| Sample code |
Zinc chloride (M) (in 10 mL) |
Ratio of CMC and zinc chloride (50 mL) |
|
In this case, disodium phosphate was added in water as a source of P.
|
| NH-1 |
0.07 |
1.0:0.005 |
| NH-2 |
0.15 |
1.0:0.010 |
| NH-3 |
0.37 |
1.0:0.025 |
| NH-4 |
0.59 |
1.0:0.040 |
| NH-5 |
0.73 |
1.0:0.050 |
| NH-6 |
2.20 |
1.0:0.150 |
| NH-7 |
7.33 |
1.0:0.500 |
| NH-8a |
2.20 |
1.0:0.150 |
2.3 Preparation of phosphate loaded hydrogel beads (PHBs)
The same procedure was applied for the preparation of phosphate-loaded hydrogel beads as stated in Section 2.2. Here, 4% CMC solution was prepared by dissolving 2 g CMC in 4% disodium hydrogen phosphate solution instead of Milli-Q water.
2.4 Characterization
2.4.1 Rheological studies.
The rheological behavior of hydrogel beads was studied using an Anton Paar Rheometer Mcr (Model no-72). Both the strain and frequency sweep experiment were performed at room temperature. In strain sweep measurements, the storage modulus (G′) and loss modulus (G′′) were recorded over a frequency range of 0.1–100 rad s−1.
2.4.2 FTIR, XRD, TGA, SEM and SEM-EDX analysis.
Fourier Transform Infrared (FTIR; FTIR Agilent Model no: Cary 630, USA; SL. No. MY20192018) spectra of the prepared hydrogels were recorded in KBr pallets ranging between 4000 and 400 cm−1. The XRD pattern of the hydrogel was obtained using PXRD at room temperature. The sample was scanned at 2θ angles in the range of 5° to 80° at a speed of 2° per min. Thermogravimetric analysis (TGA) was recorded under a nitrogen atmosphere (PerkinElmer model no. JSI, within a temperature range of 10 °C to 600 °C and heating rate 10 °C min−1). The surface morphology of the prepared hydrogel as well as the phosphate-loaded hydrogel was examined in order to investigate the effect of Ni and Zn on the surface of CMC. To confirm the presence of Ni and Zn ions, EDX-mapping (Make: Zeiss, Model: Sigma, Japan) was carried out and their elemental compositions were determined by EDX.
2.5 Swelling study
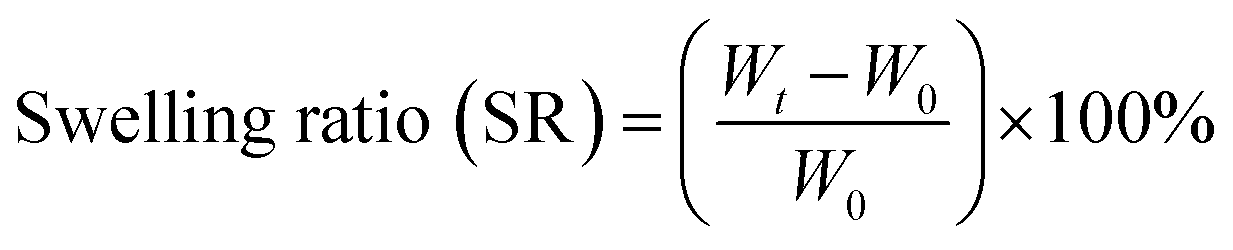
Swelling capacity was studied under different environmental conditions. A dried sample of hydrogel beads (HB; sample ID: NH-6) and PHB (sample ID: NH-8) was weighed and immersed in a beaker containing an excess amount of Milli-Q water. After definite time interval, the beads were removed from the beaker, their swollen weight was measured, and the beads were reimmersed into the beaker. This was done repeatedly until a constant weight was attained. The swelling ratio of HB and PHB was calculated using the following eqn (1),| |  | (1) |
where W0 is the initial weight and Wt is the weight of hydrogel at time t.46
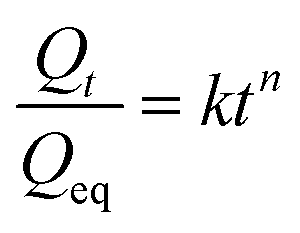
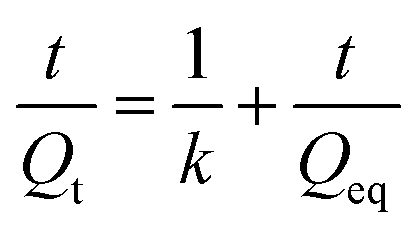
2.6 Swelling kinetics
The absorption behaviour of different hydrogels follows different kinetic models. To understand the kinetics of the swelling behaviour of the prepared hydrogels, an attempt was made to fit the kinetics data with Fickian diffusion (eqn (2)) and the second order kinetic models proposed by Schott (eqn (3)) to analyze the experimental data.47| |  | (2) |
| |  | (3) |
The Qt is the degree of swelling ratio at time t and Qeq is the equilibrium or maximum swelling ratio of the hydrogel and k is the swelling rate constant (% h−1).
2.7 Slow-release behavior of PHB
For release experiments, 0.196 g of NH-8 was soaked in 500 mL Milli-Q water at room temperature. One (1) mL aliquot of the dissolution medium was taken at fixed time intervals. The spectrophotometric molybdenum blue method was used to study the release of phosphate ions from HB using a SHIMADZU UV-Visible Spectrometer at 715 nm. The percentage of P in HB was calculated by the ICP-AES technique (Make: SPECTRO Analytical Instruments GmbH, Germany, Model: ARCOS simultaneous ICP spectrometer). The cumulative release rate (Cr) of phosphate was determined using eqn (4).48| | 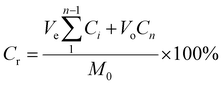 | (4) |
where n represents the time of aliquot collection and 0 < i < n. Cn is the concentration of phosphate in the volumetric flask after the removal of the nth sample. V0 is the total volume of release medium, whereas Ve is the volume of solution collected at time i, and M0 is mass of phosphate in the PHB.
2.8 Phosphate release kinetics
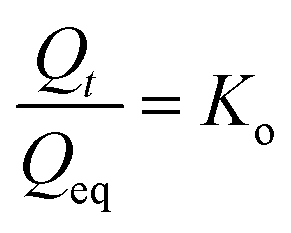
In order to study the release kinetics of P from PHB, the data were fitted into zero-order, first order, Higuchi, and Korsmeyer–Peppas models.48
1. Zero-order release kinetics: this refers to the process of constant release of nutrients from hydrogel, where release rate is independent of concentration. It is represented as-
| |  | (5) |
where
Qt is the amount of nutrients released at time
t,
Qeq is the maximum amount of measured nutrients of interest and
K0 is the zero-order release constant.
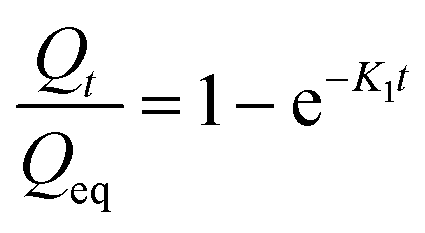
2. First order release kinetics: the first order equation describes the released system, where the release rate is dependent on concentration. The equation is represented as
| |  | (6) |
where
Qt is the amount of nutrients released at time
t,
Qeq is the maximum amount of nutrients released and
K1 is the first order constant.
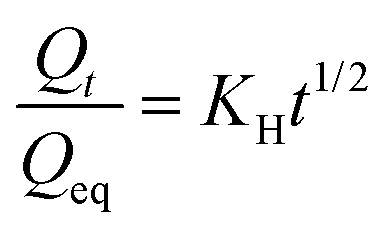
3. Higuchi model: this model can be written as,
| |  | (7) |
where
Qt is the amount of nutrients released at time
t,
Qeq is the maximum amount of nutrients released and
KH is the dissolution constant.
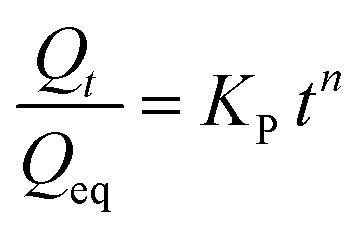
4. Korsmeyer–Peppas model: this model is described as,
| |  | (8) |
where
Qt is the cumulative release of nutrients at time
t,
Qeq is the maximum cumulative release and
KP is the Korsmeyer–Peppas model rate constant and
n is the diffusion index.
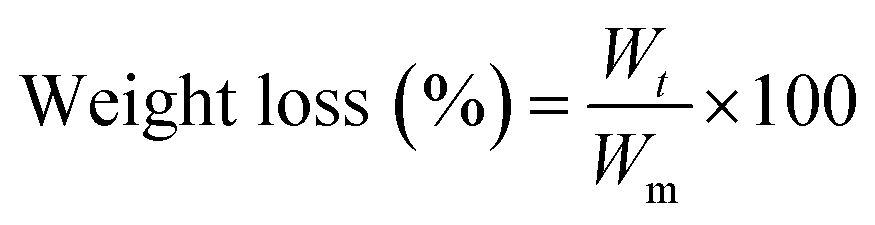
2.9 Degradation study
A degradation test of the hydrogel was performed at pH = 4.5. Our preliminary study revealed that the average pH of dryland soil is 4.50 (n = 7300, data not shown);49 therefore, the degradation study was performed at pH 4.5. The degradability test of the hydrogel was measured using the tea bag method.50 Tea bags containing a definite amount of HB and PHB were immersed in a solution of pH 4.5 and allowed to swell for 10 h. The mass erosion percentage is determined by measuring the weight of hydrogel in its maximum swollen state at a definite interval of time. Thereafter, the maximum swollen gel was placed into the same media and continuously weighed at regular intervals of time until the hydrogel was completely degraded. The degradation test is explained in terms of weight loss-| | 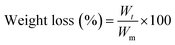 | (9) |
where Wm is the weight of the hydrogel in a swollen state, and Wt is the weight of the hydrogel at time t.51
2.10 Release pattern of Zn and Ni
Like P, the release of Zn and Ni from the prepared beads after degradation was also carried out at pH = 4.5. To monitor the release experiment, both HB and PHB were immersed in corresponding media. After a definite interval of time, 1 mL aliquot of the release medium was taken and analyzed for Ni and Zn by atomic absorption spectroscopy (AAS; Model: AA240, Agilent Pvt. Ltd, USA).
In the present study, all of the analyses for each experiment were performed in triplicate, and the values reported as the mean of three replications with standard error.
3. Results and discussion
3.1 Effect of CMC, Zn2+ and Ni2+ on the formation of Zn–Ni–CMC HBs
It has been observed that the clear solutions of 4% CMC with different concentrations of Zn2+ (Table 1) changed to white by the addition of 0.679 g of NaOH in 50 mL of CMC/ZnCl2 solution (Fig. 1(a)). This difference in colour could arise due to the change in the molecular structure of CMC under the influence of solvent and sodium hydroxide. A milky white color is formed due to the formation of ZnO nanoparticles (NPs) in the hydrogel network. Yadollahi et al. reported that sodium hydroxide acts as an oxidizing agent to convert Zn2+ ions into ZnO NPs.44 Dropwise addition of CMC/ZnCl2/NaOH solution with 1%, and 2.5% CMC into NiCl2 solution having 3 g NiCl2 in 10 mL Milli-Q water formed unstable beads (Fig. 1(b) and (c)), whereas only the 4.0% CMC concentration (Fig. 1(d)) led to the formation of stable Ni2+ cross-linked hydrogel beads. In situ formation of ZnO NPs in the CMC network (in CMC/ZnCl2/NaOH blend) results in the formation of well-developed Ni2+ cross-linked hydrogel beads. Interestingly, direct drop-wise addition of only CMC solution (without ZnCl2) into nickel chloride solution does not form Ni2+ cross-linked hydrogel beads.
 |
| | Fig. 1 (a) CMC and NaOH with increasing ZnCl2 concentration. Hydrogel bead formation after addition of NiCl2 to (b) 1%, (c) 2.5%, and (d) 4% CMC solution, respectively. | |
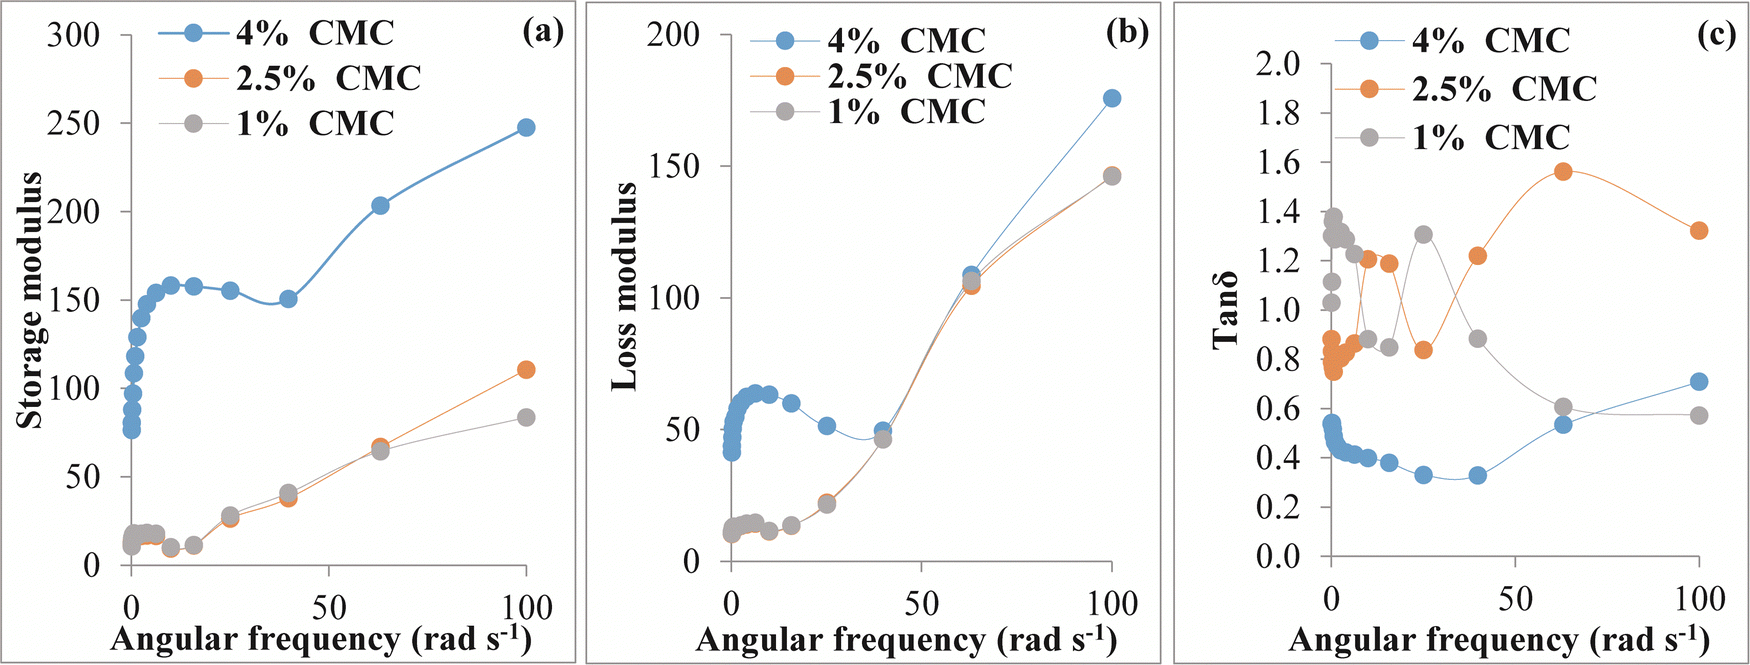
3.2 Rheological analysis
The freshly prepared hydrogel beads (before drying) were characterized by rheological measurements to confirm their hydrogel nature. The visco-elastic behavior of the hydrogel was investigated with the help of a frequency sweep test. Fig. 2(a) and (b) depict the storage modulus and loss modulus of HBs that are plotted against angular frequency (rad s−1). G′ indicates the elastic behavior and G′′ symbolizes viscous behavior. It was observed that the G′ was in the order of 4% CMC > 2.5% CMC > 1% CMC. A continuous increase in G′and G′′ was observed for the entire sample with an increase in frequency. The large G′ value corresponding to 4% CMC suggests the positive influence of CMC concentration on the elasticity of the beads. Fig. 2(c) displays the loss tangent (tanδ) of the native HBs versus frequency. The 4% CMC sample achieved a tanδ (ratio of G′ to G′′) value less than 1, demonstrating that at this concentration, the hydrogel had good elasticity. Furthermore, the tanδ value for both 1% and 2.5% CMC was more than 1, representing a dominant viscous behavior.52–54
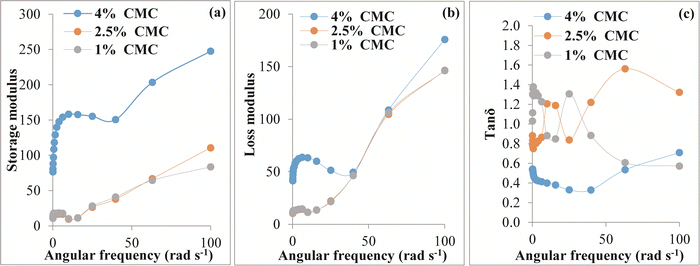 |
| | Fig. 2 (a) Storage modulus of the hydrogel beads as a function of angular frequency; (b) loss modulus of the hydrogel beads as a function of angular frequency and (c) tanδ of the hydrogel beads as a function of angular frequency in 1%, 2.5% and 4% CMC, respectively. | |
3.3 Structural characterization
3.3.1 FTIR analysis.
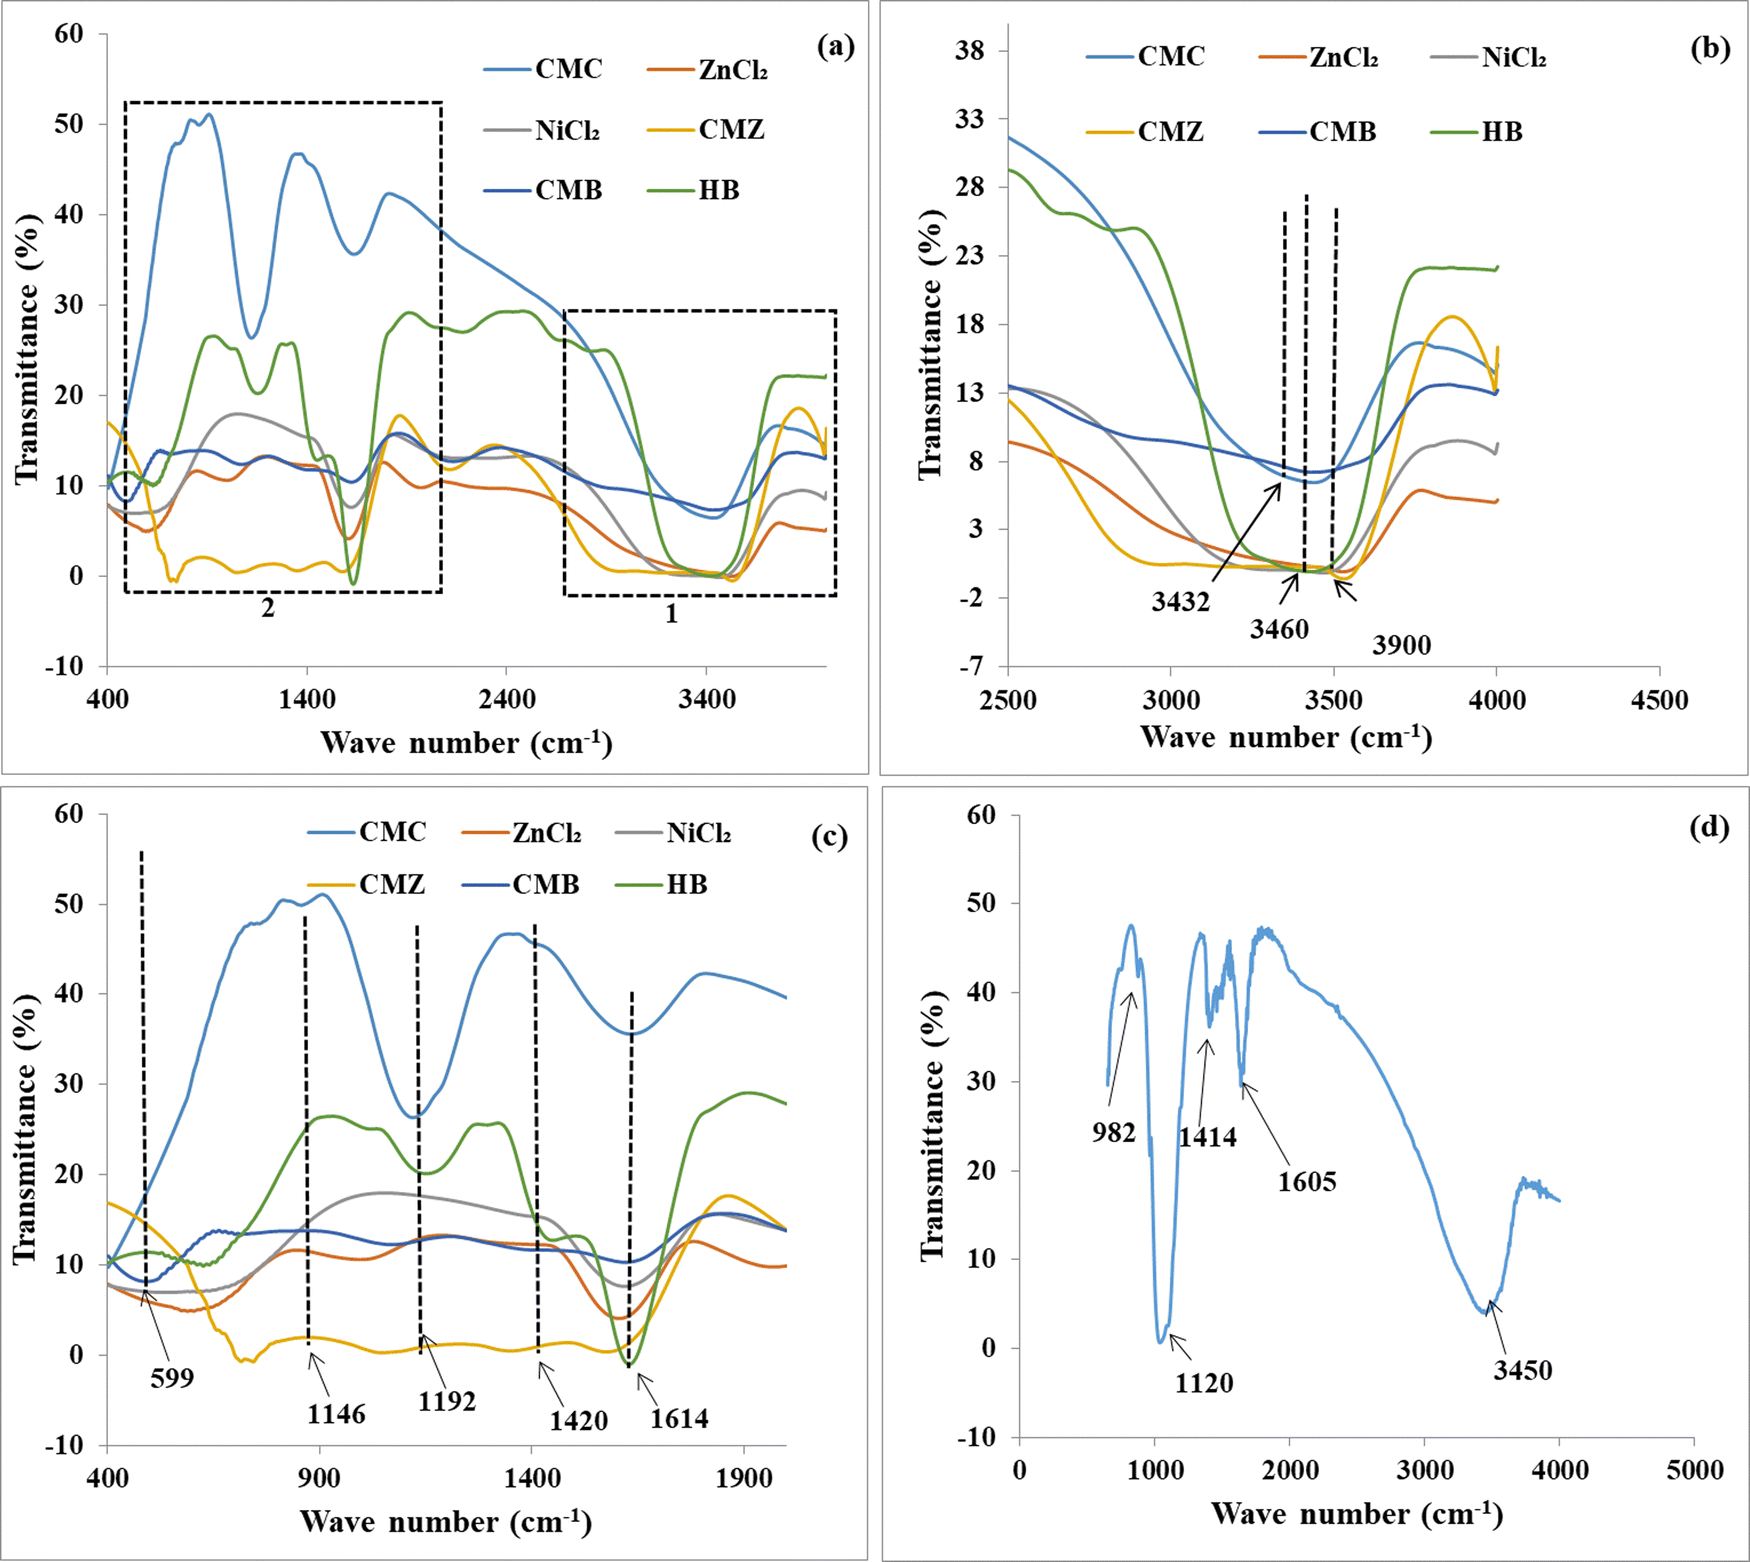
To study the interaction of CMC with ZnCl2 and NiCl2, FTIR spectra of HB were recorded at different stages of preparation. FTIR spectra of HB are shown in Fig. 3(a) and the magnified major peaks are displayed in Fig. 3(b) and (c). It is evident from Fig. 3(b) that a broad absorption observed at 3432 cm−1 is related to the OH stretching from CMC molecules as well as intramolecular and intermolecular hydrogen bonds.55,56 The –OH stretching was found at 3900 cm−1 for CMC–Zn film (CMZ), in addition to the decrease of transmittance. This shift could be assigned to the presence of new OH–Zn2+ interaction between –OH of CMC and Zn2+ ions. Furthermore, Zn2+ acts as a bridge to link the adjacent CMC chain through intermolecular hydrogen bonding. Apart from Zn2+ ions, water molecules also occupy the interlayer of CMC. After the addition of NaOH (CMC–Zn–NaOH; CMB) the band was shifted to lower wavelength regions, whereas transmittance increases gradually. After the addition of NaOH, Zn2+ converted to ZnO, resulting in the lower wave number corresponding to –OH stretching vibration. In this context 0.679 g NaOH (in 50 mL) was used for the formation of beads. This concentration of NaOH can be treated as the optimized base concentration as excessive use of base has adverse effects on bead formation by breaking all the intermolecular hydrogen bonding leading to an unstable bead and subsequently disturbing the process of cross-linking. Dormanns et al.57 found that at lower temperature, OH− anions break the hydrogen bonds between cellulose networks. At the same time, Na+ catalysed the bond-breaking process for arranging the surrounding water to prevent chains’ reaggregation.57 FTIR spectra of hydrogel beads cross-linked with Ni2+ revealed spectroscopic bands at 3460 cm−1 that were related to Ni2+–OH interactions. It seems that, after the addition of NiCl2, OH–Zn interactions get stabilized along with chain cross-linking and in-turn reduce the available water molecules in the polymer network.
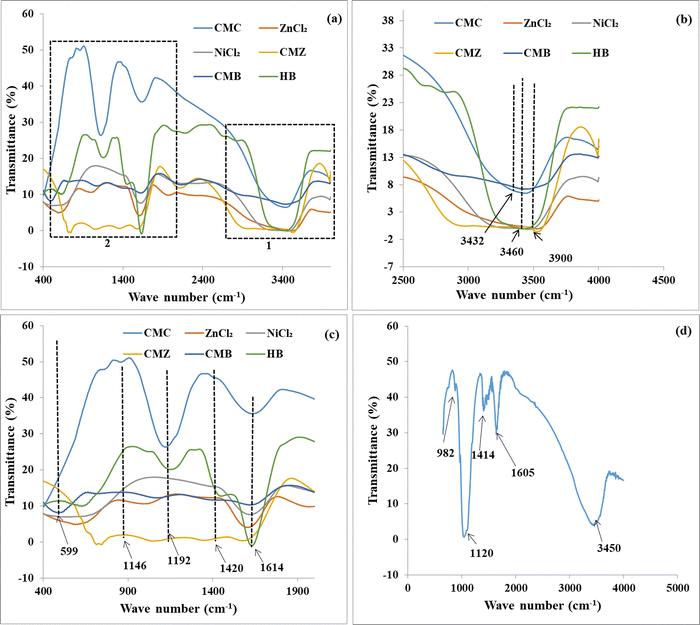 |
| | Fig. 3 FTIR spectra of CMC, NiCl2, ZnCl2, CMZ, CMC/Zn/base composites (CMB) and HB in the region of (a) 400–4000 cm−1, (b) 2500–4000 cm−1 [expanded], (c) 700–2000 cm−1 [expanded] and (d) FTIR spectra of PHB. | |
An FTIR spectrum for CMC shows an intense band at 1614 cm−1 that is due to stretching vibration of –COO−, as shown in Fig. 3(c). It is revealed that after binding with Zn2+ and Ni2+, the absorption band shifts into higher wavenumber. The interactions between ions shift the –COO− anionic groups to higher wave number, further indicating the possible interaction of –COO with Ni2+.43 For both CMZ and HB, the peaks turn broad in nature as compared to the CMC blend. An intense peak was observed at 1420 cm−1 owing to ![[double bond, length as m-dash]](https://www.rsc.org/images/entities/char_e001.gif) CH2 scissoring vibration of CMC molecules.58 A new additional sharp absorption band appeared at 599 cm−1 in CMB, corresponding to the formation of a zinc oxide bond with CMC, confirming the in situ formation of ZnO.59 After cross-linking with Ni2+ ions, this band shifts to higher wavenumber, and this is attributed to the interactions of CMC with Ni2+ ions. Fig. 3(d) shows the FTIR spectra of PHB, where a broad band at 3450 cm−1 is observed due to the symmetrical and asymmetrical stretching frequency of water molecules present in the sample. The peak at 1605 cm−1 is the stretching frequency of –COO− of CMC. The peaks at 1120 cm−1 and 982 cm−1 are due to the –O–(OH) and P–O–OH mode of phosphate groups.43,54,57,60
CH2 scissoring vibration of CMC molecules.58 A new additional sharp absorption band appeared at 599 cm−1 in CMB, corresponding to the formation of a zinc oxide bond with CMC, confirming the in situ formation of ZnO.59 After cross-linking with Ni2+ ions, this band shifts to higher wavenumber, and this is attributed to the interactions of CMC with Ni2+ ions. Fig. 3(d) shows the FTIR spectra of PHB, where a broad band at 3450 cm−1 is observed due to the symmetrical and asymmetrical stretching frequency of water molecules present in the sample. The peak at 1605 cm−1 is the stretching frequency of –COO− of CMC. The peaks at 1120 cm−1 and 982 cm−1 are due to the –O–(OH) and P–O–OH mode of phosphate groups.43,54,57,60
3.3.2 PXRD analysis.
To study the interaction of CMC with NiCl2 and ZnCl2, PXRD was also carried out. The PXRD spectra of HB and PHB are shown in Fig. 4(a). The presence of peaks at 34°, 64° and 68° in the XRD pattern of the hydrogel confirmed the in situ formation of ZnO NPs on the hydrogel network.61 HB displays a broad peak at 21° of 2θ (due to CMC), which has been almost diminished in the PHB due to further polymerization in PHB.62 The XRD pattern also confirms the amorphous behavior of the hydrogel beads. A decrease in crystallinity is considered to be due to the ring opening of glucopyranose and the breakdown of their ordered network of intermolecular hydrogen bonding.63
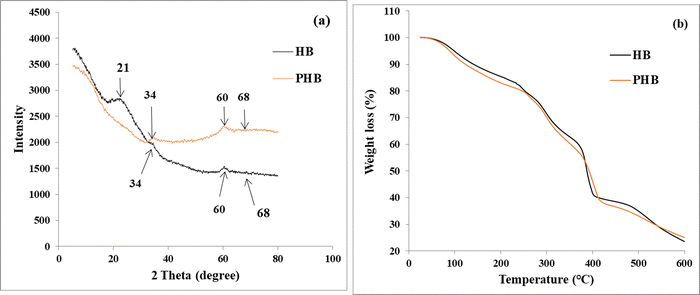 |
| | Fig. 4 (a) PXRD spectra and (b) TGA thermogram of HB and PHB. | |
3.3.3 Thermogravimetric analysis.
In this study, we have tried to prepare a slow release polymer composite as a multiple plant nutrient supplier. The basic principle for selecting a new plant nutrient delivery system is its stability within a wide range of soil temperatures. In general, agricultural soil in humid subtropical climates reaches a minimum ∼5 °C in the winter season but maximum ∼50 °C in the summer.64 Therefore, applied nutrient supplements for plants in soil should be stable in this wide range. Thermogravimetric analysis (TGA) is a powerful technique that measures the thermal stability of materials including polymers. In this study, we measured the thermal stability of our newly established composite nutrient substance for agricultural produces not only for its suitability in the agricultural field but also for its storage. TGA was performed for HB as well as PHB and shown in Fig. 4(b). As expected, significant differences were found at elevated temperatures for both the samples. The analysis showed that both samples were stable up to 70 °C and thereafter it started decomposing gradually reflecting its suitability as a soil amendment. A slight decomposition was observed at 90 °C, which occurred due to the removal of moisture. A wide range of temperature was selected in this study as the recent changing pattern of climatic variability, particularly temperature is a common phenomenon. In general, soil temperature higher than 90 °C is not an obvious fact but TGA study at >90 °C certainly provides a piece of information related to the molecular rearrangement inside the composite matrix. At the range between 100 °C and 248 °C, the first break of the TGA thermogram for HB was observed. In this temperature range around 15% weight loss of HB was recorded, which might be due to the release of chemically adsorbed, crystal, or lattice water molecules from the surface and pores of the beads. The removal of water occurs at elevated temperature due to strong hydrogen bonds between the hydrogel chains and water molecule.65,66 The second break (>248–400 °C) shows maximum weight loss up to 40% due to the breaking of the cross-linking agent and destruction of the polymer backbone. Again an additional 15% weight loss occurred at the third break (>400–600 °C), due to the decomposition of carboxymethyl groups and the cross-linker. The decomposition patterns of the TGA thermogram for PBH were found to be similar to HB. It was observed that the prepared beads were not completely decomposed up to 600 °C, which states that the beads are thermally stable even at higher temperature. Moreover, the TGA thermogram indicates that the thermal stability of PHB is higher than that of HB as 77% and 75% weight loss takes place for HB and PHB, respectively, at the temperature of 600 °C. The thermal stability of the prepared HB is comparable with previously reported literature on cellulose-based hydrogels.64–69 The TGA thermogram suggests that the incorporation of disodium hydrogen phosphate endowed greater stability to the hydrogel. TGA also confirms the presence of phosphatic groups in the hydrogel network.
3.4 Morphological analysis
One of the major parameters affecting the release behavior of HB is its surface morphology. SEM images provide detailed visualization of the prepared beads. SEM micrographs of the surface and cross-section of the dried HB (NH-6) and PHB (NH-8) at high and low magnifications are shown in Fig. 5(a)–(f). Cross-sectional images were used to describe the internal structure of the beads. Fig. 5(a) and(d) show the surface images of HB and PHB, respectively, both images show smooth surface morphology. Fig. 5(b) displays the surface of HB at high magnification in comparison to Fig. 5(a) where the surface cross-linking could be seen. The presence of an interconnected network structure in the HB provides enough space for loading of fertilizer into their three-dimensional network system as well as slow release of fertilizer. Fig. 5(e) and (f) represent the cross-sectional image of PHB. From these figures the surface morphology of PHB appears smooth in nature. These types of structures in hydrogel are found due to the separation of the liquid medium from the 3D network of the hydrogel.70
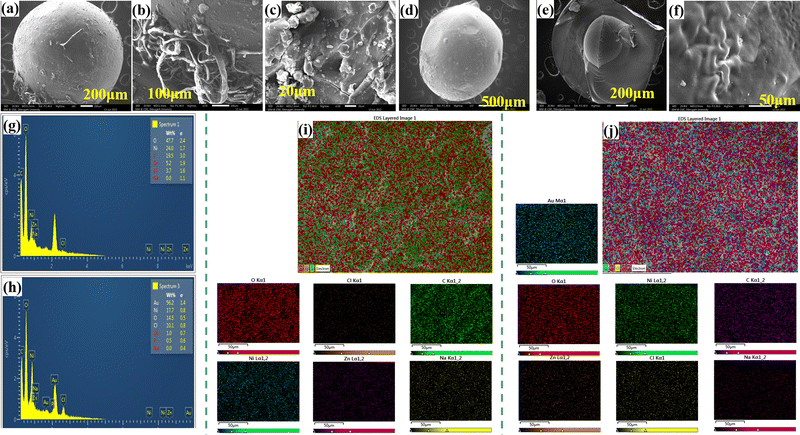 |
| | Fig. 5 SEM micrograph of (a) HB, (b) the magnified surface of HB, (c) the cross-section of HB, (d) the surface of PHB, and (e) and (f) the cross-section of PHB. SEM-EDX analysis of (g) HB and (h) PHB. EDX-mapping micrograph of (i) HB and (j) PHB. | |
The characterizations of Zn and Ni distribution on the surface of HB and PHB were performed by energy-dispersive X-ray spectroscopy (EDX-mapping). EDX was used to identify the elemental composition of the hydrogel. The EDX spectra of HB and PHB are shown in Fig. 5(g) and (h), respectively. The EDX spectrum confirms the presence of Zn and Ni in the hydrogel beads. Fig. 5(i) and (j) represent the SEM-EDX mapping of HB and PHB, respectively. From these figures it could be confirmed that the Ni, Zn, and phosphate groups are uniformly distributed in the polymeric CMC network chain.
3.5 Effect of pH and temperature on the swelling behaviour of the hydrogel
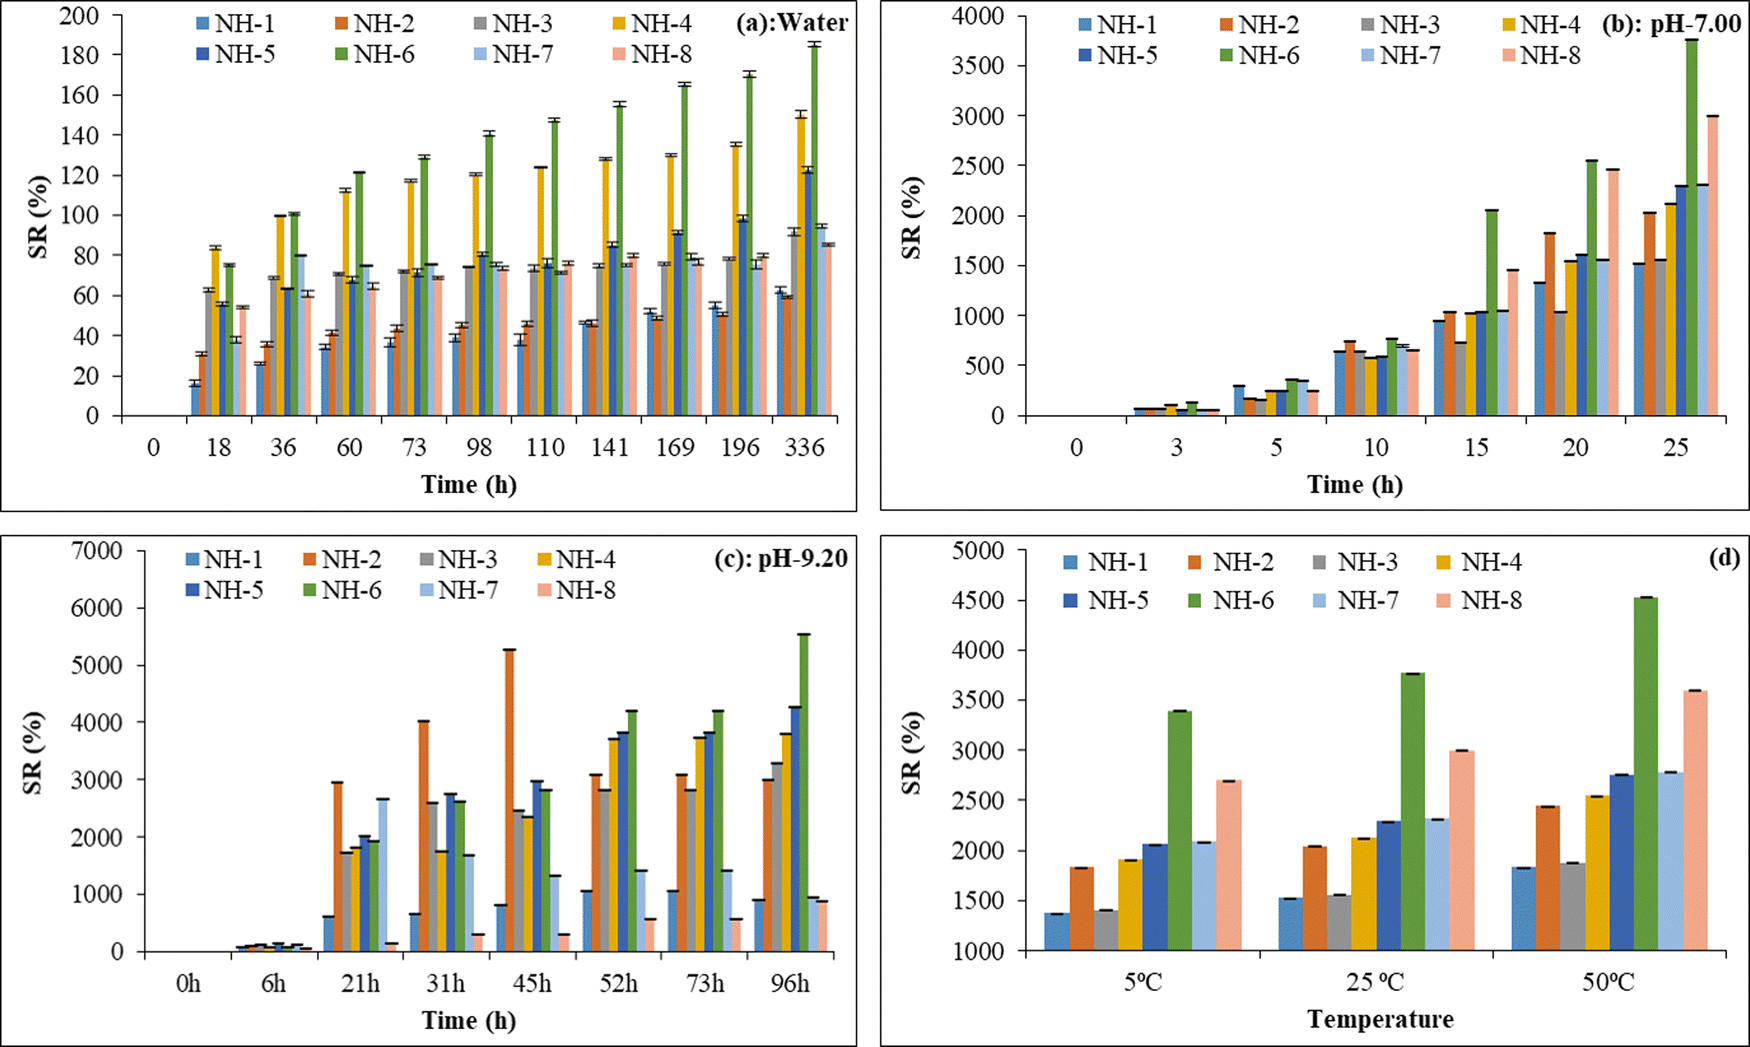
3.5.1 Effect of cross-linker on swelling ratio (SR) in water.
Cross-linkers serve as a bridge to connect the polymer networks, form three-dimensional structures, and improve the physical and chemical stability of the beads in solution.71 As shown in Fig. 6(a), the SR of all prepared hydrogel beads increases with time irrespective of the treatment imposed. Among all the treatments, NH-6 (1:0.15 ratio of CMC and ZnCl2) showed a maximum value of SR irrespective of time. When the concentration of ZnCl2 is less than 0.073 M (NH-1 to NH-4), the water absorption capacity is lowered. Moreover, with the addition of 0.73 M ZnCl2 (NH-5), the swelling capacity was decreased due to the blockage of water absorption sites by increasing the cross-linking density within the hydrogel network system. On the other hand, mixing of 2.2 M ZnCl2 was found to be a suitable treatment to get maximum SR and this could be due to the formation of charged ZnO nanoparticles inside the hydrogel creating more space for the penetration of added water molecules that neutralize the build-up in osmotic pressure as suggested by Yadollahi et al.72 In the present study, it was observed that the equilibrium swelling capacity for all prepared hydrogel beads was attained at 336 h. The trend of SR (%) at equilibrium was found as: NH-2(59.30 ± 0.49) < NH-1(62.63 ± 1.64) < NH-8(85.43 ± 0.40) < NH-3(91.75 ± 1.70) < NH-7(94.82 ± 1.01) < NH-5(122.68 ± 1.65) < NH-4(150.31 ± 1.76) < NH-6(185.38 ± 1.07). Higher SR at equilibrium was found in NH-6 than NH-8 even though both have the same amount of ZnCl2, and the lower SR in NH-8 than NH-6 could be due to phosphate loading that occupies the free sites of HB and blocks the water molecules from entering the HB networks.
 |
| | Fig. 6 Swelling ratio of hydrogel samples NH-1, NH-2, NH-3, NH-4, NH-5, NH-6, NH-7, and NH-8 (a) at equilibrium (in distilled water), (b) at pH 7, (c) at pH 9.2 and (d) at different temperatures (5 °C, 25 °C and 50 °C). | |
3.5.2 Effect of cross-linker on swelling ratio (SR) in water solution adjusted to pH 7.0.
The variation of SR for all prepared hydrogel beads in buffer solutions with pH 7.0 is shown in Fig. 6(b). Initially, the SR increases with time and begins to level off, after a few hours. The time taken for maximum swelling adopted by the beads varies with the compositions of the hydrogel beads. The SR values are directly related to the density of the cross-linker. Again, the sorption trend increased with increasing the density of ZnCl2 in the polymer network up to 0.3 g of ZnCl2. When the concentration of ZnCl2 increased from 0.3 g to 1 g, a regular decrease was observed in the SR values. The maximum water absorption percentage was attained with NH-6 formulation in which the ratio of CMC and ZnCl2 was 1:0.15 and identified as an optimal composition for further development of the phosphate-loaded hydrogel beads for slow phosphorus delivery. At pH 7, maximum SR (%) was achieved by NH-6, i.e., (3770 ± 1.98) after 25 h. Other hydrogel beads NH-1, NH-2, NH-3, NH-4, NH-5, NH-7 and NH-8 showed SR (%) of (1527 ± 2.84), (2035 ± 1.46), (1561 ± 2.77), (2123 ± 1.16), (2294 ± 2.12), (2318 ± 1.58) and (2999 ± 1.91), respectively, for the same duration. Moreover, for the same concentration of cross-linker density for both HB (NH-6) and PHB (NH-8), the SR (%) of HB is comparatively higher as compared to PHB (Fig. 6(b)). This can be explained by the fact that more water molecules could be incorporated into the inter matrix space of HB, which are otherwise occupied by disodium hydrogen phosphate in PHB leading to a decrease of available inter matrix space reducing the overall SR (%).
3.5.3 Effect of cross-linker on swelling ratio (SR) in water solution adjusted to pH 9.2.
At pH = 9.2, the NH-2 sample achieved maximum SR at 45 h with SR 5267 (%), and after that SR decreased as some of the polymer backbones degraded (Fig. 6(c)). The NH-6 sample attained equilibrium after 96 h having SR 5552(%) and it was more stable than other prepared beads. At equilibrium, the samples achieved maximum stability due to increased intermolecular distance between the COO- ions. Faster swelling of HB takes place at basic medium (pH = 9.2) compared to neutral medium. As the pH of the surrounding solution of the beads is more than the pKa values of the carboxylic group of CMC (pKa = 4.5), the acidic groups are ionized into COO- ions, causing an intermolecular repulsion leading to swelling.73–75
3.5.4 Effect of temperature.
A temperature range from 5–50 °C was applied to study its effect on the water retention property of the hydrogel beads. As shown in Fig. 6(d), SR is directly proportional to the temperature of the absorbing medium. The increase in SR with temperature was accelerated by the change of thermal mobility of the hydrogel due to faster movement of ions in solution and at breaking of intermolecular hydrogen bonding between hydrogel networks as suggested by Kong et al.76 and Xiao et al.77 Therefore, at higher temperatures, a significant amount of water molecules can be held in the hydrogel network than at lower temperature. Each hydrogel composite showed different temperature-sensitive behavior. For example, SR of NH-6 at 5 °C, 25 °C and 50 °C was 3393%, 3770% and 4525%, respectively, and NH-8 shows 2699%, 2999% and 3598%, respectively within the same experimental temperatures. Overall, it was found that the prepared hydrogel beads are sensitive to the temperature of the surrounding environment.
3.6 Swelling kinetics of the hydrogel
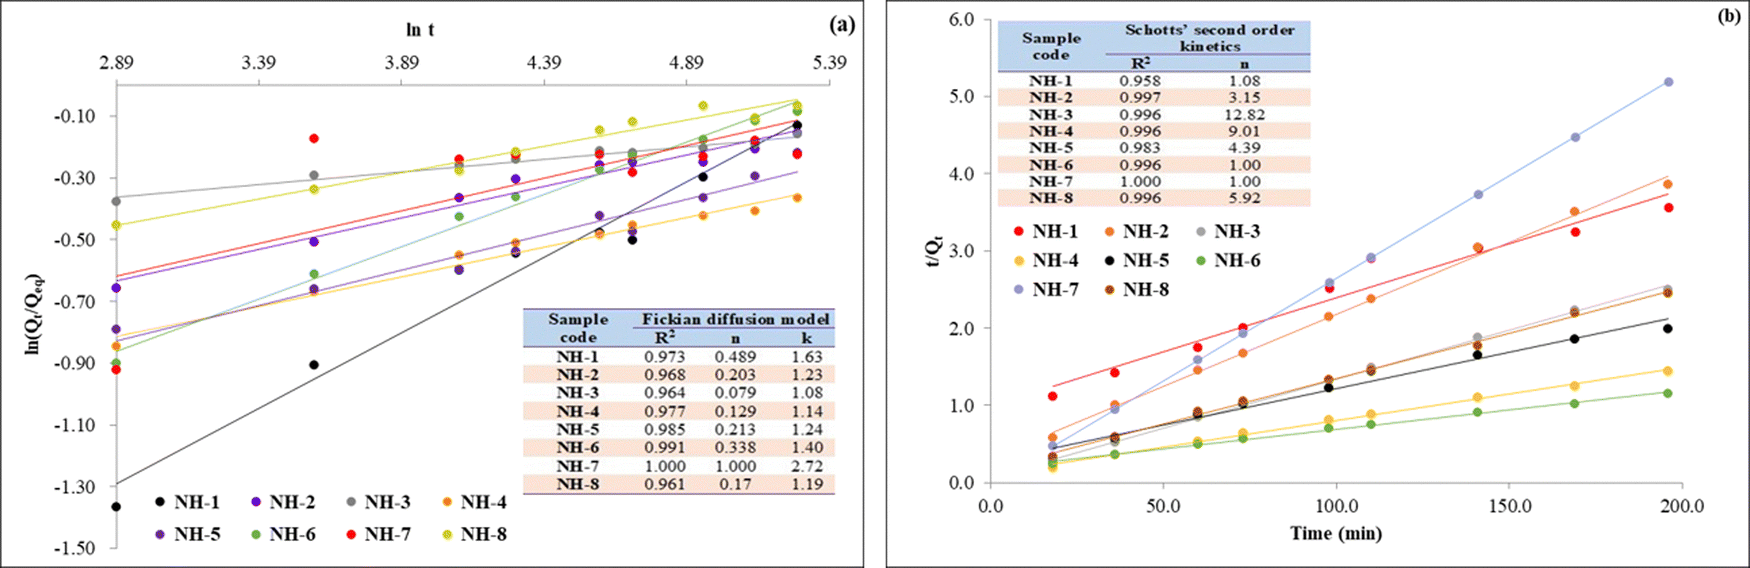
3.6.1 Swelling kinetic studies.
Fig. 7(a) represents the swelling kinetics of the hydrogel fitted into the Fickian diffusion model. The values of n for all the prepared hydrogel beads were found to be less than 0.5, which is indicating Fickian kinetics and the sorption of water is controlled by diffusion as suggested by Bajpai et al.78 From the result, it has been observed that the n and k of the sorption kinetics are directly related to the cross-linker density of the prepared hydrogel. This result further revealed that all the linear co-relation coefficients (R2) are close to 1 in the case of Schott's second order kinetics (Fig. 7(b)) as compared to the Fickian model.
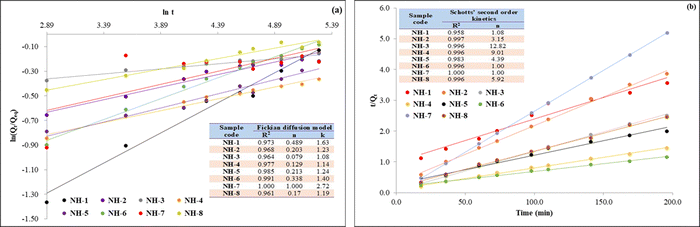 |
| | Fig. 7 Swelling kinetics graph of different hydrogel composites NH-1, NH-2, NH-3, NH-4, NH-5, NH-6, NH-7, and NH-8 in (a) the Fickian diffusion model and (b) the Second order kinetics model. | |
3.7 Stability and release kinetics
3.7.1 Degradation studies.
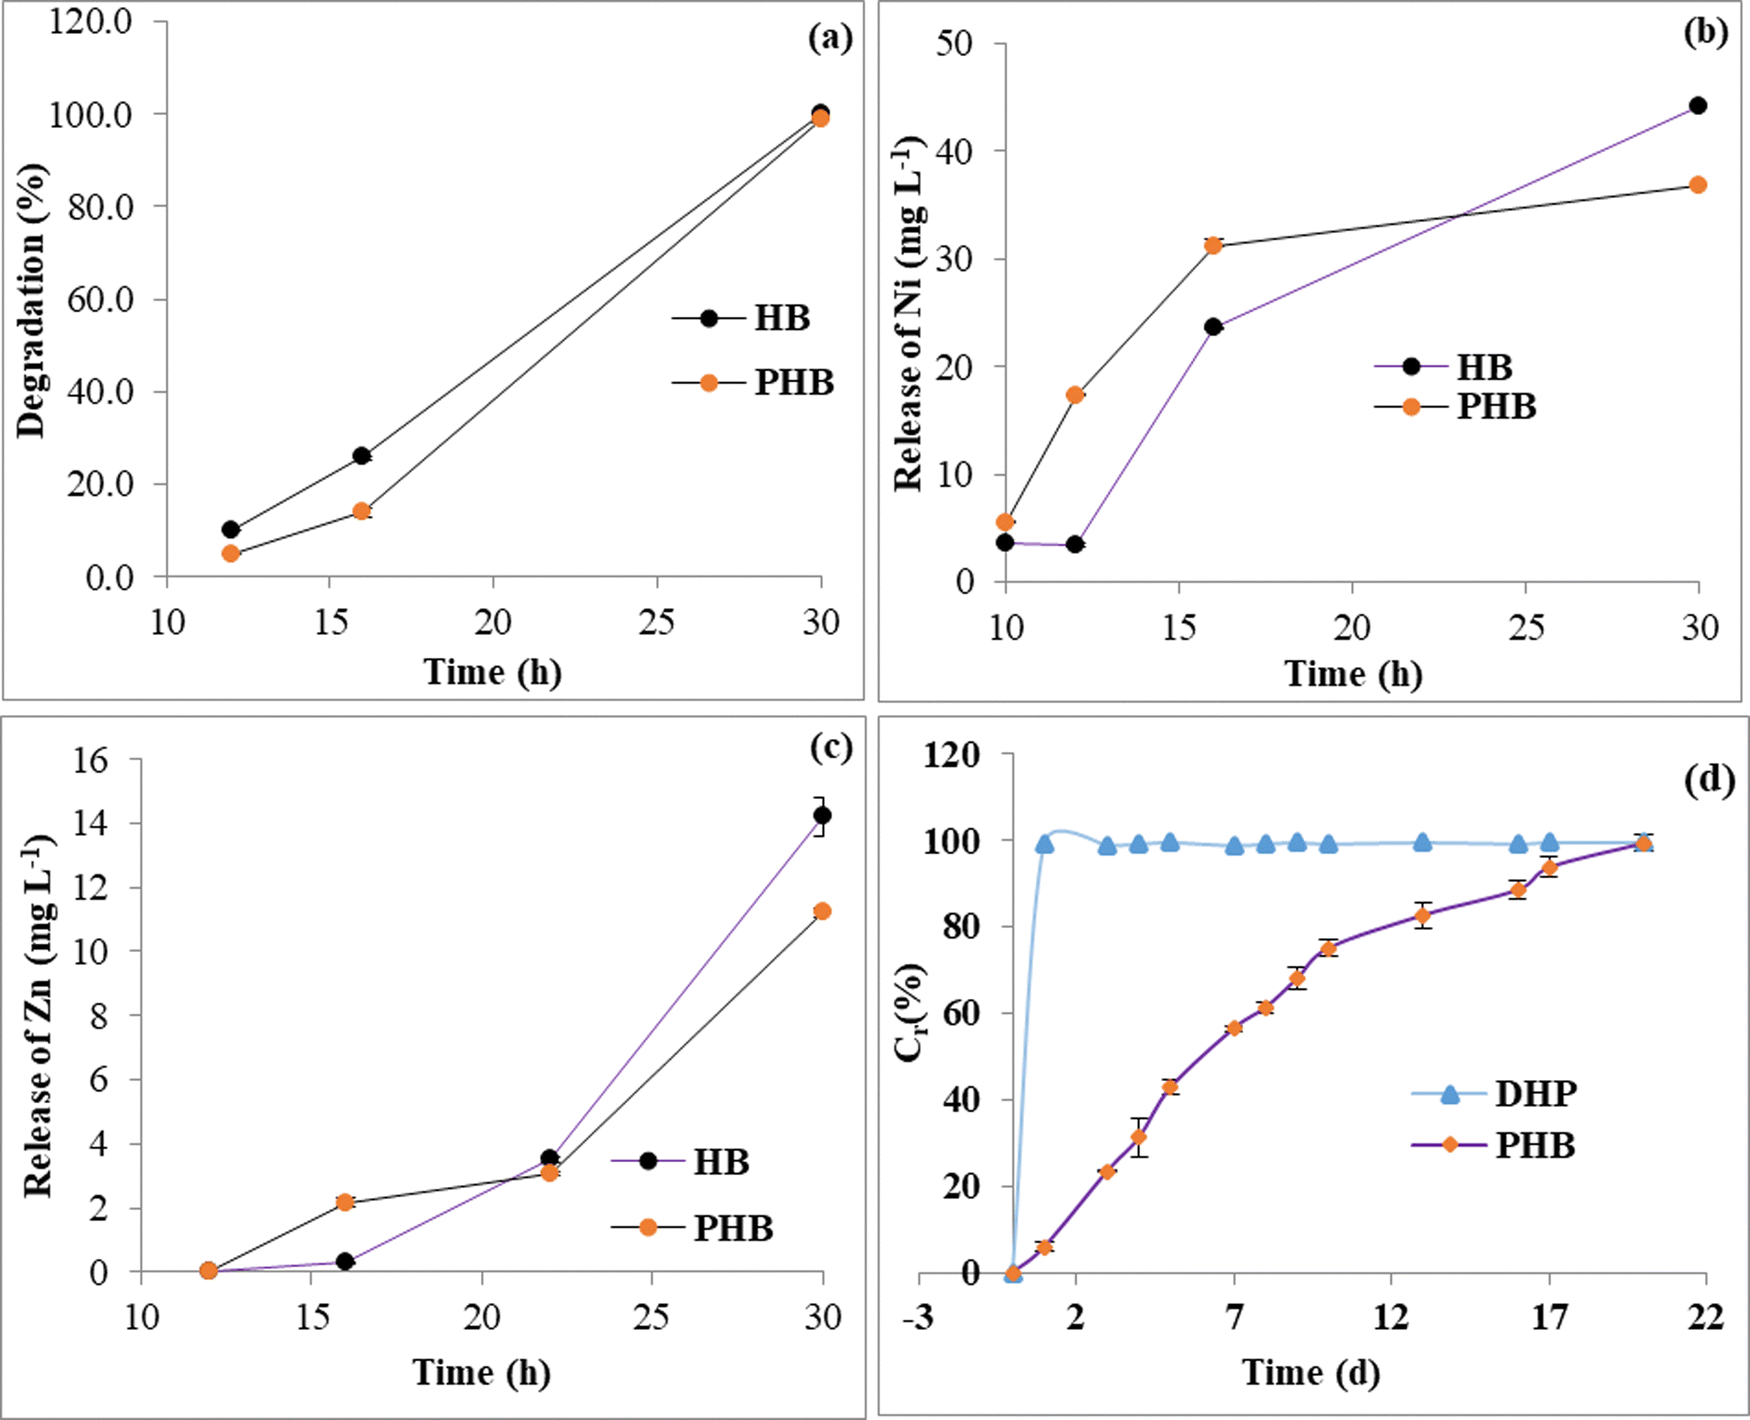
The hydrogel beads are designed for slow nutrient release; therefore, it becomes most essential to study their degradation behavior. The degradability of hydrogel beads is tested in normal tea-growing soil pH (buffer pH = 4.5). Fig. 8(a) presents the degradation behavior of hydrogel beads at room temperature. Percentage degradation (from eqn (9)) of HB at 12 h, 16 h and 24 h is 12%, 27% and 100%, respectively. However, percentage degradation for PHB was found to be 10%, 20% and 98% corresponding to time interval 12 h, 16 h and 24 h, respectively. It was observed that all the prepared hydrogels were completely degraded within 24 h at the studied conditions. This degradation behavior may be related to the role of various additives such as salt, acetate and acidic groups that are present in acidic buffer taken for the study. It is conceivable that at acidic pH the –COOH groups in CMC molecules are in non-ionized form, and therefore hydrogen bonding rather than electrostatic interactions is predominant in the hydrogel network.79 Therefore, in acidic medium, hydrogen bond formation turns the network of hydrogel to hydrophobic in nature, which leads to a collapsed state.80 At equilibrium SR, the diffusion of proton and counter ions with water inside the hydrogel network is maximum which allows the swelling.81 These protons and counter ions occupy the intermolecular space of the hydrogel and participate in breaking of non-bonding interactions of (CMC/Zn/Ni) in the hydrogel networks. Although our results are indicative of acidic soil (pH 4.5), the physiochemical properties and components of soil vary significantly from the buffer used. Real soil applications are complex (considering presence of different ions, various microorganism, and enzymes etc.) and could give an altered degradation profile. A detailed degradation study in a soil environment is recommended.
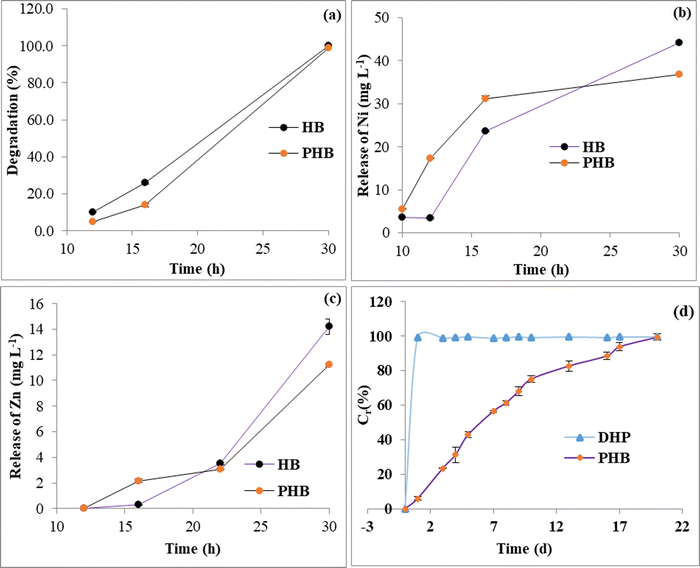 |
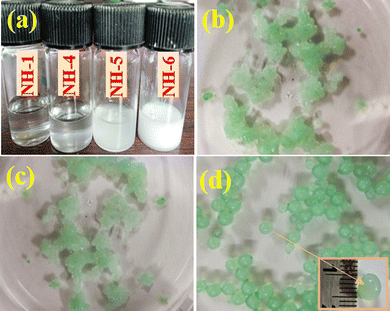
| | Fig. 8 (a) Degradation of the hydrogel HB and PHB at pH 4.5; (b) release of Ni after degradation from the hydrogel composite; (c) Zn release from the degradation of the hydrogel composite and (d) comparison of the cumulative release of P into solution with highly soluble (sodium dihydrogen phosphate) DHP and P from the P loaded hydrogel PHB. | |
3.7.2 Nutrient release study.
Fig. 8(b) and (c) depict the release profiles of Ni and Zn from hydrogel beads. Among different micronutrients, Ni plays a pivotal role for urease and urea metabolism;82 however, Zn acts as a versatile catalytic cofactor in proteins inside the plant cells.83 Like P impregnation, Zn and Ni were also loaded in the same HB and it was observed that upon degradation at pH 4.5, the prepared bead effectively released Zn and Ni to the solution. Ni was detected in solution at 10 h with 3.6 (mg L−1) for HB and 5.4 (mg L−1) for PHB, respectively. However, Zn was detected only after 12 h in the solution. This could be due to the fact that Zn participates in the interior cross-linking of the hydrogel beads as compared to Ni, which participated in more outer cross-linking. After complete degradation of the hydrogels, the corresponding medium of HB contains 44.1 (mg L−1) of Ni and 14.2 (mg L−1) of Zn, and PHB contains 36.7 (mg L−1) of Ni and 11.2 (mg L−1) of Zn.
The cumulative release study of phosphate from the PHB sample in distilled water as a function of time has been depicted in Fig. 8(d). As shown, PHB acts as a fast release source of phosphate for 10 days and gradually it became slower with time. The release percentage of phosphate at 1, 3, 5, 10, and 20 days was 5.9%, 23.4%, 42.8%, 75.0%, and 99.3%, respectively. The penetration of water molecules into the hydrogel network system caused the dissolution of Na2HPO4 encapsulated in the polymeric network. With time, this dissolution increases gradually, increasing the osmotic pressure inside the polymeric matrix. A difference in the concentration gradient of soluble fertilizer between the inside and outside of the hydrogel matrix triggers the release mechanism.84,85 With initial faster release of phosphate from the interior matrix of the hydrogel, the steric strain between the networks of the hydrogel decreases. With time, the difference in concentration gradient decreases and the phosphorus release rate slows down.86
Other P slow-release systems such as the one reported by Huang et al. combined calcium cross-linked alginate hydrogel matrix with ultrafine dolomite powder for the adsorption of P from wastewater.87 In distilled water, 90% of adsorbed P was released over a 60 day period. Wang et al. prepared a calcium cross-linked sodium alginate hydrogel using amber acid, aluminium sulphate octadecahydrate and ferric chloride for adsorptive P loading and the cumulative release rate of P in soil was found to be 85.03% in 30 days.88 In a similar effort for the synthesis of a biodegradable hydrogel nanocomposite Sharma et al. reported the preparation of a poly(vinyl alcohol)/kaolin/diammonium hydrogen phosphate hydrogel nanocomposite for the controlled release of phosphate.89 After 30 days, 88.8% of incorporated P was released in water and 76.3% was released in soil. From the reported literature it is evident that the rate of P loading and release of our composite fertilizer system is comparable to other slow-release fertilizer systems. Furthermore, our system could deliver primary plant micronutrients (Zn, Ni) alongside a sustainable P release.
3.8 P release kinetics
In the present study, we did not perform the kinetics for Zn and Ni as those are micronutrients and plants require them in a very trace amount. The total amount of P loaded as calculated by ICP-AES analysis was found to be ∼70 mg g−1. The phosphate release kinetics from HBs were estimated by using the equation presented in Section 2.8. The parameters release component (n) and release factor (K) calculated by these equations and their determination coefficients (R) are summarized in Table 2 (kinetic plots are shown in ESI,† Fig. S1). The release process of phosphate from PHB is due to the combined effect of various physicochemical phenomena. P release kinetic data were tried to be fitted in different kinetic models, viz. zero order, first order, Higuchi and Korsmeyer–Peppas models. Based on the data set as well as the fitted trend lines (R2 values), it was observed that experimental data was best suited only in the Korsmeyer–Peppas model (Table 2). In the case of formulation of the Korsmeyer–Peppas model, the diffusion exponential constant ‘n’ determines the release mechanism. According to Siepmann et al.90 and Shen et al.91 the release mechanism for a value of n < 0.43 indicates Fickian diffusion and 0.43 < n < 0.85 indicates a non-Fickian transport. However, n > 0.85 indicates a case II transport fertilizer release mechanism.90,91 Here, the value of n = 0.91, which indicates that the release mechanism follows the type II mechanism. The influence of CMC chain relaxation might play a prominent role leading to a case II fertilizer release pattern.
Table 2 Kinetics model fitting data indicating the parameters for the zero order, first order, Higuchi and Korsmeyer–Peppas model
| Kinetics model |
R
|
K
H
|
K
P
|
n
|
| Zero order |
0.918 |
— |
— |
— |
| First order |
0.662 |
— |
— |
— |
| Higuchi |
0.925 |
0.206 |
— |
— |
| Korsmeyer–Peppas |
0.956 |
— |
0.008 |
0.910 |
4. Conclusions
Slow-release nutrient delivery systems amalgamated with degradability could foster new developments in the field of smart fertilizer delivery. We herein report a promising novel and easy preparation technique for loading of P, Ni and Zn loaded CMC hydrogel as a multinutrient slow-release fertilizer for plants in a wide range of pH conditions. A series of hydrogel composite beads with different ratios of CMC, Zn, and Ni were prepared. Sample NH-6 showed the maximum swelling ratio of 185%, 3770% and 5552% in distilled water, pH 7 buffer and pH 9.2 buffer, respectively. The hydrogel beads were characterized by FTIR analysis, PXRD, TGA, and SEM-EDX mapping. These characterizations suggest the formation of stable spherical CMC hydrogel beads with Ni and Zn crosslinking. Formation of ZnO could also be ascertained from the data. Ni and Zn are evenly dispersed onto the hydrogel matrix as evident from the SEM EDX analysis. The hydrogel composite beads are stable up to a temperature of 90 °C. The total amount of P loaded onto the PHB sample was calculated by ICP-AES analysis and was found to be ∼70 mg g−1. About ∼99% of the loaded P was released in a span of 21 days in solution. The swelling kinetics data was better fitted onto the Fickian diffusion model. The P release data for PHB at equilibrium could be better described by the Korsmeyer–Peppas model, leading to the assertion that the overall release process follows a type II diffusion mechanism. The degradation profile of the HB and PHB was also evaluated at an indicative acidic soil pH of 4.5. At lower pH the hydrogel beads follow a very rapid degradation profile with subsequent release of Zn and Ni to the solution. Upon complete degradation of the hydrogels, the corresponding medium of HB contains 44.1 (mg L−1) of Ni and 14.2 (mg L−1) of Zn, and PHB contains 36.7(mg L−1) of Ni and 11.2 (mg L−1) of Zn, respectively. Although a real soil application study is highly recommended to get better insight into the degradation profile of the hydrogel composites in a soil environment. The present work not only demonstrates the design of a new slow-release fertilizer system for P delivery, but also paves the way for more innovative improved techniques for simultaneous incorporation and release of other macro and micro nutrients (such as Ni and Zn in this case) for a greener sustainable future.
Author contributions
Madhusmita Baruah: data curation, formal analysis, investigation, methodology, writing – original draft; Arup Borgohain: data curation, formal analysis, investigation, methodology, writing – original draft; Rimjim Gogoi: data curation, formal analysis, investigation, methodology, writing – original draft; Nilotpal Borah: data curation, formal analysis, investigation, methodology, writing – original draft; Diganta Deka: data curation, formal analysis, investigation, methodology, writing – original draft; Tanmoy Karak: methodology, project administration, resources, validation, visualization, writing – review & editing. Jiban Saikia: conceptualization, funding acquisition, methodology, project administration, resources, validation, visualization, writing – review & editing.
Conflicts of interest
The are no conflicts of interest to declare.
Acknowledgements
J. S. thanks UGC, India (grant no. F.30-467/2019-BSR) and DBT, India (grant no. BT/PR36255/NNT/28/1728/2020) for financial support. We thank Dibrugarh University for providing all the infrastructural facilities. The authors are grateful to the Department of Science and Technology for financial support under DST-FIST programme and UGC, New Delhi for Special Assistance Programme (UGC-SAP) to the Department of Chemistry, Dibrugarh University.
References
- T. Zhou, Y. Wang, S. Huang and Y. Zhao, Sci. Total Environ., 2018, 615, 422–430 CrossRef CAS PubMed.
- N. Bechtaoui, M. K. Rabiu, A. Raklami, K. Oufdou, M. Hafidi and M. Jemo, Front. Plant Sci., 2021, 12, 679916 CrossRef PubMed.
- S. Rajan and M. P. Upsdell, Adv. Agron., 2021, 167, 183–245 Search PubMed.
- S. Zheng, J. Hu, K. Chen, J. Yao, Z. Yu and X. Lin, Soil Biol. Biochem., 2009, 41, 2094–2099 CrossRef CAS.
- A. Smolander, P. J. Martikainen and H. M. Henttonen, For. Ecol. Manage., 2022, 519, 120320 CrossRef.
- C. Wang, D. Luo, X. Zhang, R. Huang, Y. Cao, G. Liu, Y. Zhang and H. Wang, Environ. Sci. Ecotechnology, 2022, 100167 CrossRef CAS PubMed.
- T. Li, B. Gao, Z. Tong, Y. Yang and Y. Li, Water, Air, Soil Pollut., 2019, 230, 1–9 CrossRef CAS.
- J. Zhang, M. Fu, M. Zhang, L. Xu and Y. Gao, Int. J. Pharm., 2014, 465, 32–41 CrossRef CAS PubMed.
- E. Kianfar, J. Sol-Gel Sci. Technol., 2019, 91, 415–429 CrossRef CAS.
- S. Dhaliwal, R. Naresh, A. Mandal, R. Singh and M. Dhaliwal, Enviro. Sustain. Indic., 2019, 1, 100007 CrossRef.
- N. Natasha, M. Shahid, I. Bibi, J. Iqbal, S. Khalid, B. Murtaza, H. F. Bakhat, A. B. U. Farooq, M. Amjad and H. M. Hammad, Sci. Total Environ., 2022, 808, 152024 CrossRef CAS PubMed.
- V. Page and U. Feller, Agronomy, 2015, 5, 447–463 CrossRef CAS.
- J. E. Coleman, Annu. Rev. Biochem., 1992, 61, 897–946 CrossRef CAS PubMed.
- M. S. A. Ahmad, M. Ashraf and M. Hussain, J. Hazard. Mater., 2011, 185, 1295–1303 CrossRef CAS PubMed.
- F. Nadeem and M. Farooq, Ric. Sci., 2019, 26, 356–371 CrossRef.
- B. Y. Kutman, U. B. Kutman and I. Cakmak, Plant Soil, 2014, 376, 261–276 CrossRef CAS.
- N. Kamboj, R. Malik, P. Dhanker and A. Kumar, J. Pharmacogn. Phytochem., 2018, 7, 3470–3475 CAS.
- D. M. do Nascimento, Y. L. Nunes, J. P. Feitosa, A. Dufresne and M. d F. Rosa, Int. J. Biol. Macromol., 2022, 216, 24–31 CrossRef CAS PubMed.
- N. Mazloom, R. Khorassani, G. H. Zohury, H. Emami and J. Whalen, Environ. Exp. Bot., 2020, 175, 104055 CrossRef CAS.
- Y. C. Chen and Y.-H. Chen, Sci. Total Environ., 2019, 655, 958–967 CrossRef CAS PubMed.
- Y. Liu, J. Wang, H. Chen and D. Cheng, Sci. Total Environ., 2022, 157303 CrossRef CAS PubMed.
- B. Song, H. Liang, R. Sun, P. Peng, Y. Jiang and D. She, Int. J. Biol. Macromol., 2020, 144, 219–230 CrossRef CAS PubMed.
- S. Sharma and S. Tiwari, Int. J. Biol. Macromol., 2020, 162, 737–747 CrossRef CAS PubMed.
- B. Qu and Y. Luo, Int. J. Biol. Macromol., 2020, 152, 437–448 CrossRef CAS PubMed.
- M. Shahzamani, S. Taheri, A. Roghanizad, N. Naseri and M. Dinari, Int. J. Biol. Macromol., 2020, 147, 187–193 CrossRef CAS PubMed.
- H. A. Essawy, M. B. Ghazy, F. Abd El-Hai and M. F. Mohamed, Int. J. Biol. Macromol., 2016, 89, 144–151 CrossRef CAS PubMed.
- S. Ahmad, M. Ahmad, K. Manzoor, R. Purwar and S. Ikram, Int. J. Biol. Macromol., 2019, 136, 870–890 CrossRef CAS PubMed.
- K. Gharbi, F. Salles, P. Mathieu, C. Amiens, V. Colliere, Y. Coppel, K. Philippot, L. Fontaine, V. Montembault, L. S. Smirib and D. C. Pradines, New J. Chem., 2017, 41, 11898–11905 RSC.
- H. Qi, R. Ma, C. Shi, Z. Huang, S. Liu, L. Sun and T. Hu, Int. J. Biol. Macromol., 2019, 131, 412–419 CrossRef CAS PubMed.
- T. R. Hoare and D. S. Kohane, Polymers, 2008, 49, 1993–2007 CrossRef CAS.
- X. Chen, J. Chen, T. You, K. Wang and F. Xu, Carbohydr. Polym., 2015, 125, 85–91 CrossRef CAS PubMed.
- A. Biswas, S. Kim, G. W. Selling and H. Cheng, Ind. Crops Prod., 2014, 60, 259–265 CrossRef CAS.
- R. Suriyatem, N. Noikang, T. Kankam, K. Jantanasakulwong, N. Leksawasdi, Y. Phimolsiripol, C. Insomphun, P. Seesuriyachan, T. Chaiyaso and P. Jantrawut, Polymers, 2020, 12, 1505 CrossRef CAS PubMed.
- C. R. Bauli, G. F. Lima, A. G. de Souza, R. R. Ferreira and D. S. Rosa, Colloids Surf., A, 2021, 623, 126771 CrossRef CAS.
- Y. Wang, H. Shaghaleh, Y. A. Hamoud, S. Zhang, P. Li, X. Xu and H. Liu, Int. J. Biol. Macromol., 2021, 187, 262–271 CrossRef CAS PubMed.
- H. I. Nimir, A. Hamza and I. A. Hussein, Energies, 2020, 13, 4262 CrossRef CAS.
- Y. Tang, C. Liu, H. Zhu, X. Xie, J. Gao, C. Deng, M. Han, S. Liang and J. Zhou, Energy Storage Mater., 2020, 27, 109–116 CrossRef.
- J. Silva, P. Vanat, D. Marques-da-Silva, J. R. Rodrigues and R. Lagoa, Bioact. Mater., 2020, 5, 447–457 CrossRef PubMed.
- P. Pissis and A. Kyritsis, J. Polym. Sci., Part B: Polym. Phys., 2013, 51, 159–175 CrossRef CAS.
- M. Gaca, J. Pietrasik, M. Zaborski, L. Okrasa, G. Boiteux and O. Gain, Polymers, 2017, 9, 645 CrossRef PubMed.
- Q. Xu, C. Chen, K. Rosswurm, T. Yao and S. Janaswamy, Carbohydr. Polym., 2016, 149, 274–281 CrossRef CAS PubMed.
- I. Gholamali and M. Yadollahi, Int. J. Biol. Macromol., 2020, 160, 724–735 CrossRef CAS PubMed.
- M. Hashem, S. Sharaf, M. Abd El-Hady and A. Hebeish, Carbohydr. Polym., 2013, 95, 421–427 CrossRef CAS PubMed.
- M. Yadollahi, I. Gholamali, H. Namazi and M. Aghazadeh, Int. J. Biol. Macromol., 2015, 73, 109–114 CrossRef CAS PubMed.
- R. Gogoi, A. Borgohain, M. Baruah, T. Karak and J. Saikia, RSC Adv., 2022, 12, 6704–6714 RSC.
- S. Fattahpour, M. Shamanian, N. Tavakoli, M. Fathi, H. Sadeghi-Aliabadi, S. R. Sheykhi, M. Fesharaki and S. Fattahpour, Int. J. Biol. Macromol., 2020, 151, 220–229 CrossRef CAS PubMed.
- N. Xia, W. Wan, S. Zhu and Q. Liu, Int. J. Biol. Macromol., 2020, 163, 1518–1528 CrossRef CAS PubMed.
- Y. Shen, H. Wang, Z. Liu, W. Li, Y. Liu, J. Li, H. Wei and H. Han, Ind. Crops Prod., 2021, 93, 375–382 CAS.
- H. Malakar, G. Timsina, J. Dutta, A. Borgohain, D. Deka, B. Azariah, R. K. Paul, M. Yeasin, F. H. Rahman, S. Panja and T. Karak, Front. Plant Sci., 2022, 13, 5256 Search PubMed.
- A. Ali, M. A. Hussain, M. T. Haseeb, S. N. A. Bukhari, T. Tabassum, M. F. Haq and F. A. Sheikh, J. Drug Delivery Sci. Technol., 2022, 69, 103144 CrossRef CAS.
- Y. Pan, C. Xiao, H. Tan, G. Yuan, J. Li, S. Li, Y. Jia, D. Xiong, X. Hu and X. Niu, Int. J. Polym. Mater. Polym. Biomater., 2021, 70, 149–157 CrossRef CAS.
- Z. Tian, W. Liu and G. Li, Polym. Degrad. Stab., 2016, 130, 264–270 CrossRef CAS.
- I. Matai, M. Garg, K. Rana and S. Singh, RSC Adv., 2019, 9, 13444–13457 RSC.
- S. Nisar, A. H. Pandit, M. Nadeem, A. H. Pandit, M. M. A. Rizvi and S. Rattan, Int. J. Biol. Macromol., 2021, 182, 37–50 CrossRef CAS PubMed.
- N. Habibi, Spectrochim. Acta, Part A, 2014, 131, 55–58 CrossRef CAS PubMed.
- V. Pushpamalar, S. J. Langford, M. Ahmad and Y. Y. Lim, Carbohydr. Polym., 2006, 64, 312–318 CrossRef CAS.
- J. W. Dormanns, J. Schuermann, J. Müssig, B. J. Duchemin and M. P. Staiger, Composites, Part A, 2016, 82, 130–140 CrossRef CAS.
- Y. Seki, A. Altinisik, B. Demircioğlu and C. Tetik, Cellulose, 2014, 21, 1689–1698 CrossRef CAS.
- R. Priyadarshi, B. Kumar and J. W. Rhim, Int. J. Biol. Macromol., 2020, 162, 229–235 CrossRef CAS PubMed.
- N. J. John, P. Selvarajan, S. B. J. Silviya and C. Mahadevan, Mater. Manuf. Processes, 2007, 22, 379–383 CrossRef.
- M. Yadollahi, I. Gholamali, H. Namazi and M. Aghazadeh, Int. J. Biol. Macromol., 2015, 74, 136–141 CrossRef CAS PubMed.
- T. Anjali, Carbohydr. Polym., 2012, 87, 457–460 CrossRef CAS PubMed.
- P. Mukhopadhyay, K. Sarkar, S. Soam and P. P. Kundu, J. Appl. Polym. Sci., 2013, 129, 835–845 CrossRef CAS.
- G. J. Oldenborgh, S. Philip, S. Kew, M. Weele, P. Uhe, F. Otto, R. Singh, I. Pai, H. Cullen and K. A. Rao, Nat. Hazards Earth Syst. Sci., 2018, 18, 365–381 CrossRef.
- M. Mohy Eldin, A. Omer, E. Soliman and E. Hassan, Desalina. Water Treat., 2013, 51, 3196–3206 CrossRef CAS.
- A. Johnson, F. Kong, S. Miao, H.-T. V. Lin, S. Thomas, Y.-C. Huang and Z.-L. Kong, Sci. Rep., 2020, 10, 1–23 CrossRef PubMed.
- B. Kumar and Y. S. Negi, Mater. Lett., 2019, 252, 308–312 CrossRef CAS.
- B. Kumar, R. Priyadarshi, F. Deeba, A. Kulshreshtha, K. K. Gaikwad, J. Kim, A. Kumar and Y. S. Negi, Gels, 2020, 6, 49 CrossRef CAS PubMed.
- A. Salama, Mater. Lett., 2015, 157, 243–247 CrossRef CAS.
- Z. L. Wu, T. Kurokawa, S. Liang and J. P. Gong, Macromolecules, 2010, 43, 8202–8208 CrossRef CAS.
- G. R. Mahdavinia, M. Soleymani, M. Sabzi, H. Azimi and Z. Atlasi, J. Environ. Chem. Eng., 2017, 5, 2617–2630 CrossRef CAS.
- M. Yadollahi, S. Farhoudian, S. Barkhordari, I. Gholamali, H. Farhadnejad and H. Motasadizadeh, Int. J. Biol. Macromol., 2016, 82, 273–278 CrossRef CAS PubMed.
- I. Muhamad, L. S. Fen, N. H. Hui and N. A. Mustapha, Carbohydr. Polym., 2011, 83, 1207–1212 CrossRef CAS.
- M. Zhang, B. Gao, J. Chen, Y. Li, A. E. Creamer and H. Chen, Chem. Eng. J., 2014, 255, 107–113 CrossRef CAS.
- G. O. Akalin and M. Pulat, J. Nanomater., 2018, 2018, 1–12 CrossRef.
- L. Kong, Y. Gao, W. Cao, Y. Gong, N. Zhao and X. Zhang, J. Biomed. Mater. Res. A., 2005, 75, 275–282 CrossRef PubMed.
- X. C. Xiao, L. Y. Chu, W.-M. Chen and J.-H. Zhu, Polymer, 2005, 46, 3199–3209 CrossRef CAS.
- A. K. Bajpai and M. Shrivastava, J. Appl. Polym. Sci., 2002, 85, 1419–1428 CrossRef CAS.
- Y. Bao, J. Maa and N. Li, Carbohydr. Polym., 2021, 84, 76–82 CrossRef.
- Z. Z. Akbari, H. Farhadnejad, B. F. Nia, S. Abedind, M. Yadollahi and M. K. Ghayeni, Int. J. Biol. Macromol., 2016, 93, 1317–1327 CrossRef PubMed.
- D. H. Hanna, V. F. Lotfy, A. H. Basta and G. R. Saad, Int. J. Biol. Macromol., 2020, 150, 228–237 CrossRef CAS PubMed.
- T. Chatzistathis, Plant Micronutr. Use Effic., 2018, 123–135 CAS.
- C. Stanton, D. Sanders, U. Krämer and D. Podar, Mol. Plant, 2021, 15, 65–85 CrossRef PubMed.
- S. M. Lohmousavi, H. H. S. Abad, G. Noormohammadi and B. Delkhosh, Arabian J. Chem., 2020, 13, 6977–6985 CrossRef CAS.
- M. Rizwan, S. R. Gilani, A. I. Durrani and S. Naseem, J. Taiwan Inst. Chem. Eng., 2022, 131, 104137 CrossRef CAS.
- A. Olad, H. Zebhi, D. Salari, A. Mirmohseni and A. R. Tabar, Mater. Sci. Eng., C, 2018, 90, 333–340 CrossRef CAS PubMed.
- Y. Huang, M. Liu, S. Chen, I. I. Jasmi, Y. Tang and S. Lin, Water Environ. Res., 2019, 19, 797–804 CrossRef PubMed.
- Z. Wang, J. Lu, C. Wu, Y. Dan, G. Li, D. Wu and S. Hu, Int. J. Biol. Macromol., 2022, 201, 437–443 CrossRef CAS PubMed.
- N. Sharma, A. Singh and R. K. Dutta, Polym. Bull., 2021, 78, 2933–2950 CrossRef CAS.
- J. Siepmann and N. A. Peppas, Int. J. Pharm., 2011, 418, 6–12 CrossRef CAS PubMed.
- Y. Shen, H. Wang, W. Li, Z. Liu, Y. Liu, H. Wei and J. Li, Int. J. Biol. Macromol., 2020, 164, 557–565 CrossRef CAS PubMed.
|
| This journal is © The Royal Society of Chemistry and the Centre National de la Recherche Scientifique 2023 |

 b and
Jiban
Saikia
b and
Jiban
Saikia